


Highlights
- Global indices show mixed trends across key regions
- US markets decline amid cautious investor sentiment
- European indices weaken, Asian markets show resilience
Latest news

Haier Launches HQLED P7 Pro Series TVs With Google Gemini, 50W Audio And AI Picture Enhancements

Nothing's Latest Pokémon Teasers Hint At New Hardware, RCB Collaboration May Also Be In The Works

OnePlus N6 Set To Debut With Massive 8,000mAh Battery And Long-Term Performance Focus

Roblox Introduces Age-Based Accounts for Younger Users, Expands Parental Controls Globally

IIFL Capital Launches Algo Marketplace with Over 100 Ready-Made Strategies

LUMIQ Raises INR 50 Crore Pre-Series B to Become the AI Decision Layer for Financial Services

Tay Keith, producer behind Travis Scott's 'Sicko Mode' dies at 29

GenAI could lift realty sales velocity by up to 50%, speed up launches by 30%: Report
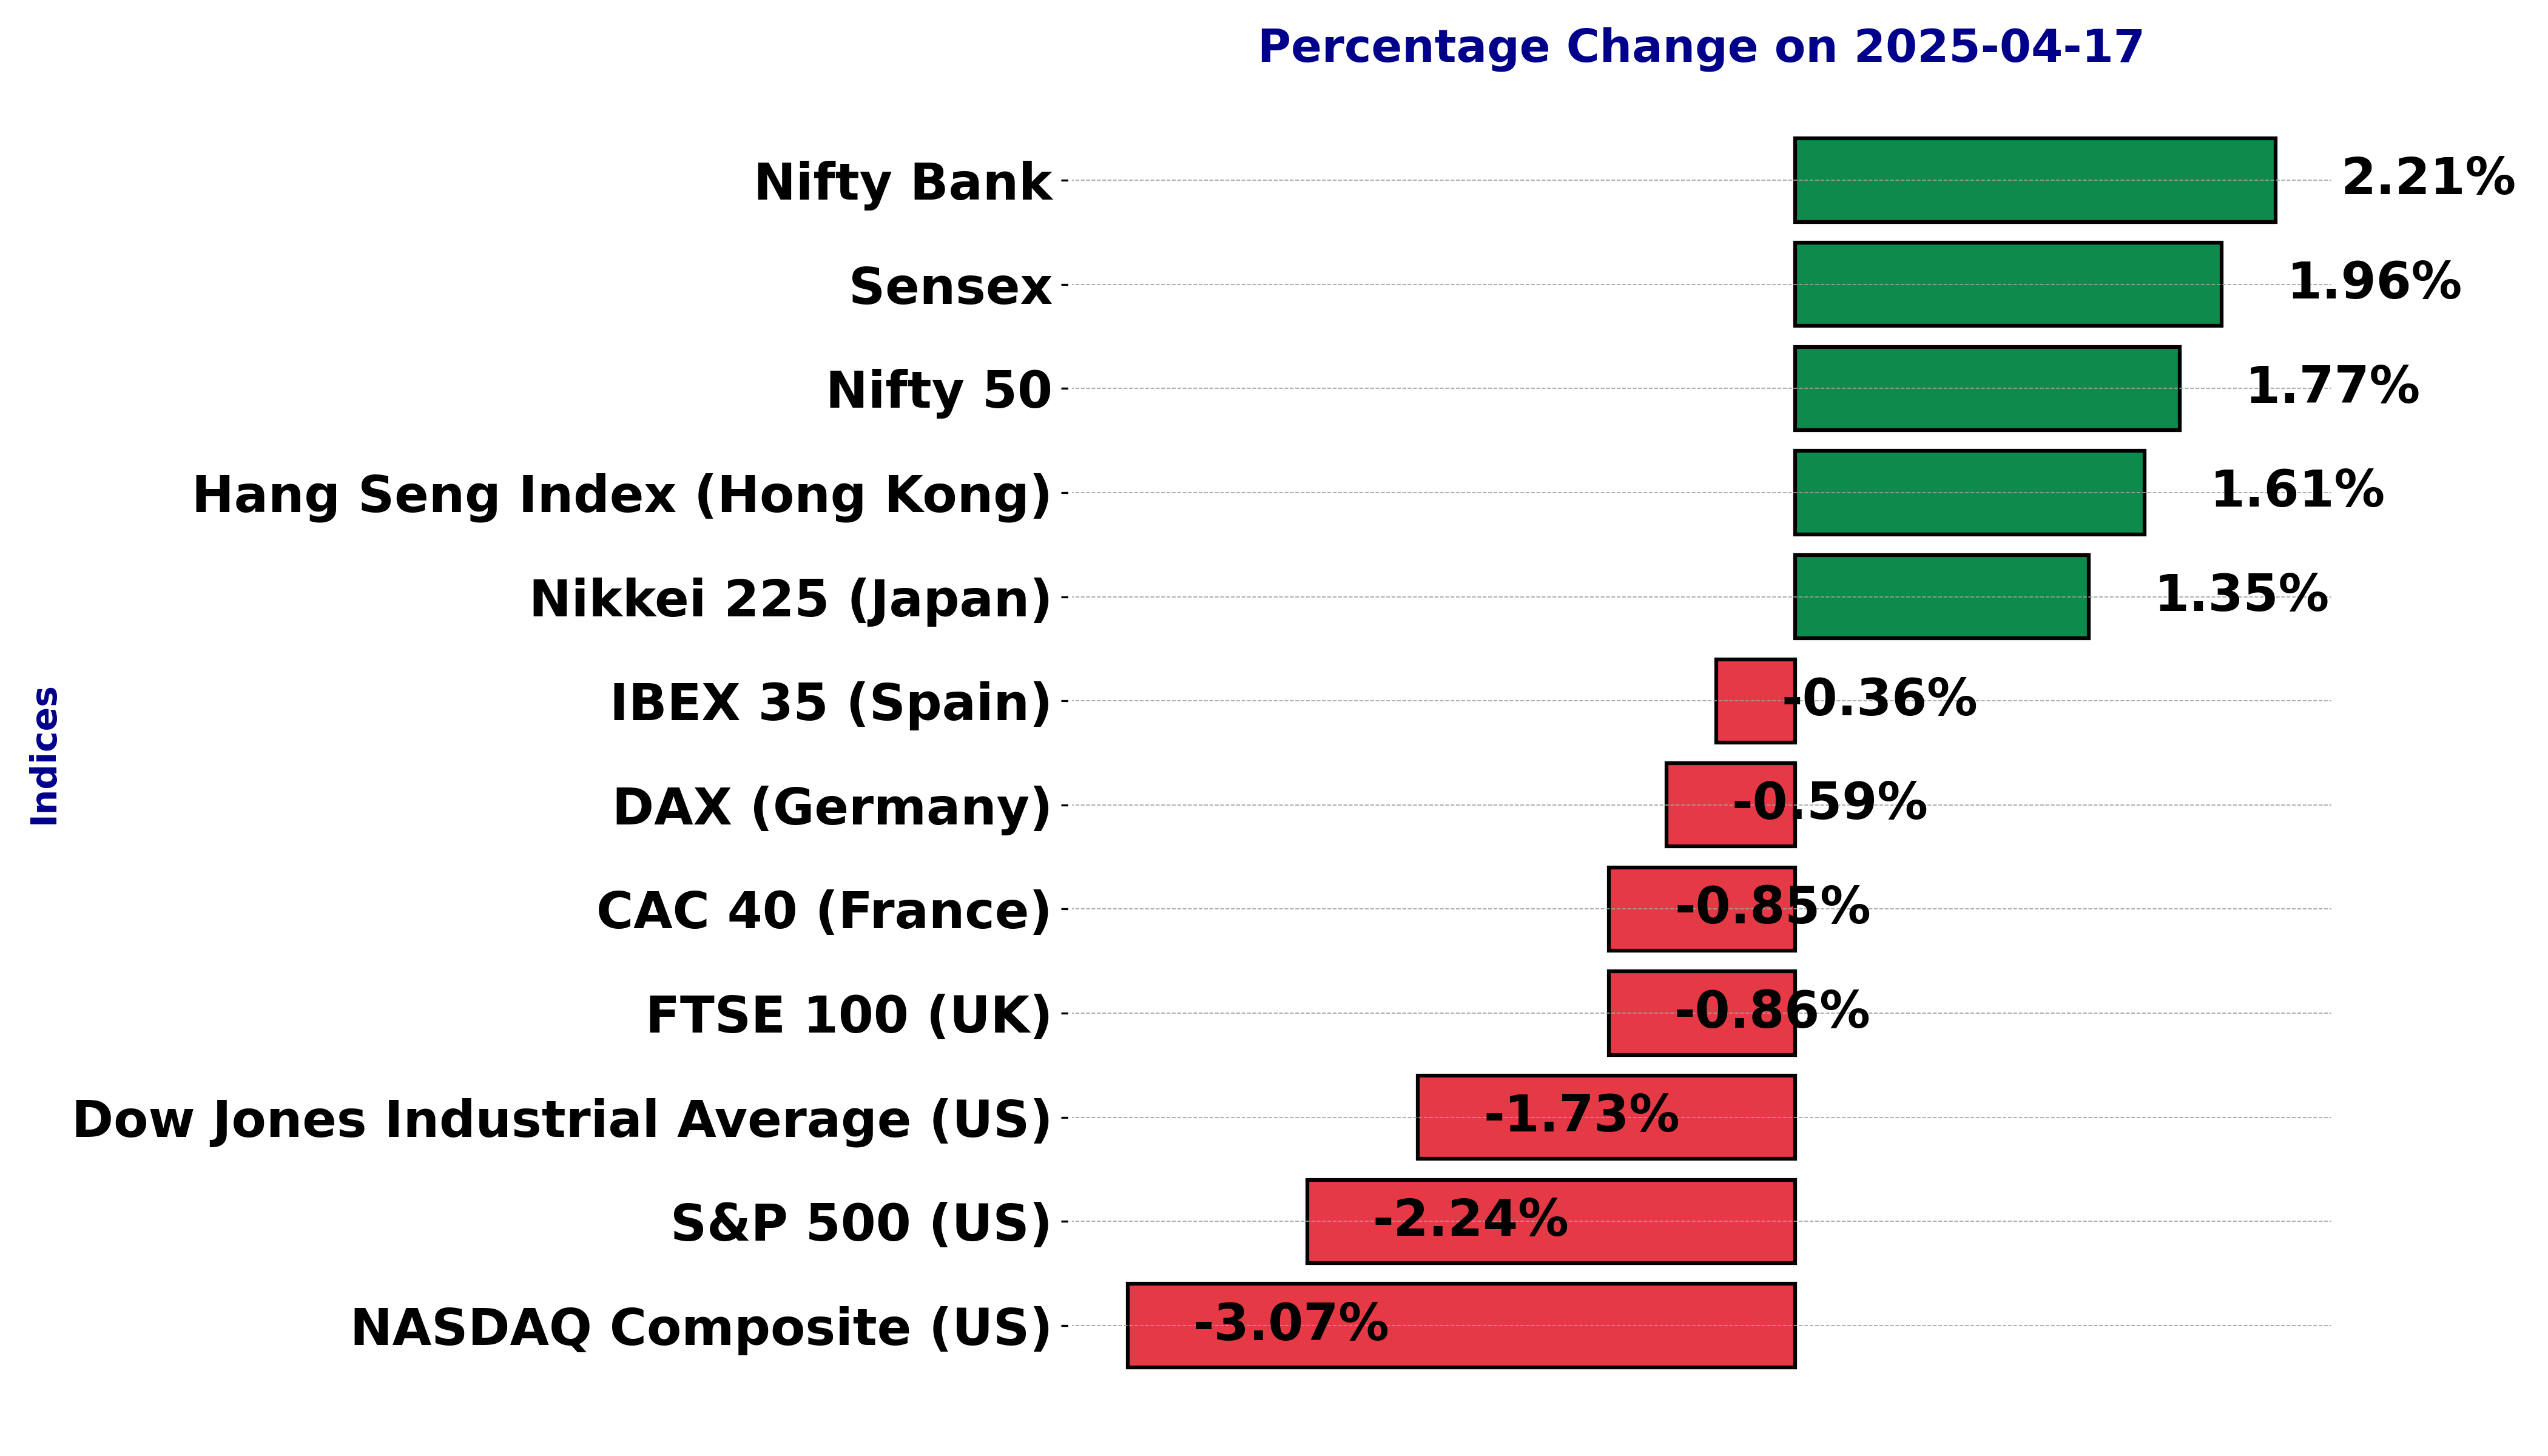
Global stock market indices: How the world markets performed today - 17 April 2025


The international stock market indices showed varied performances on April 17, 2025, reflecting the economic sentiment across different regions.
In this article, we analyze the performance of key global indices including the S&P 500, Dow Jones Industrial Average, NASDAQ Composite, FTSE 100, DAX, CAC 40, IBEX 35, Nikkei 225, Hang Seng, Nifty 50, and BSE Sensex.
Analysis for Sensex - April 17, 2025

The Sensex opened at 76,968.02 and closed at 78,553.20, showing a noticeable increase with a percentage change of approximately 1.96% and a points change of 1,508.91. The RSI value of 62.90 indicates a relatively strong market position, while the MACD of 251.77 being substantially above the signal of 50.84 suggests a bullish trend.
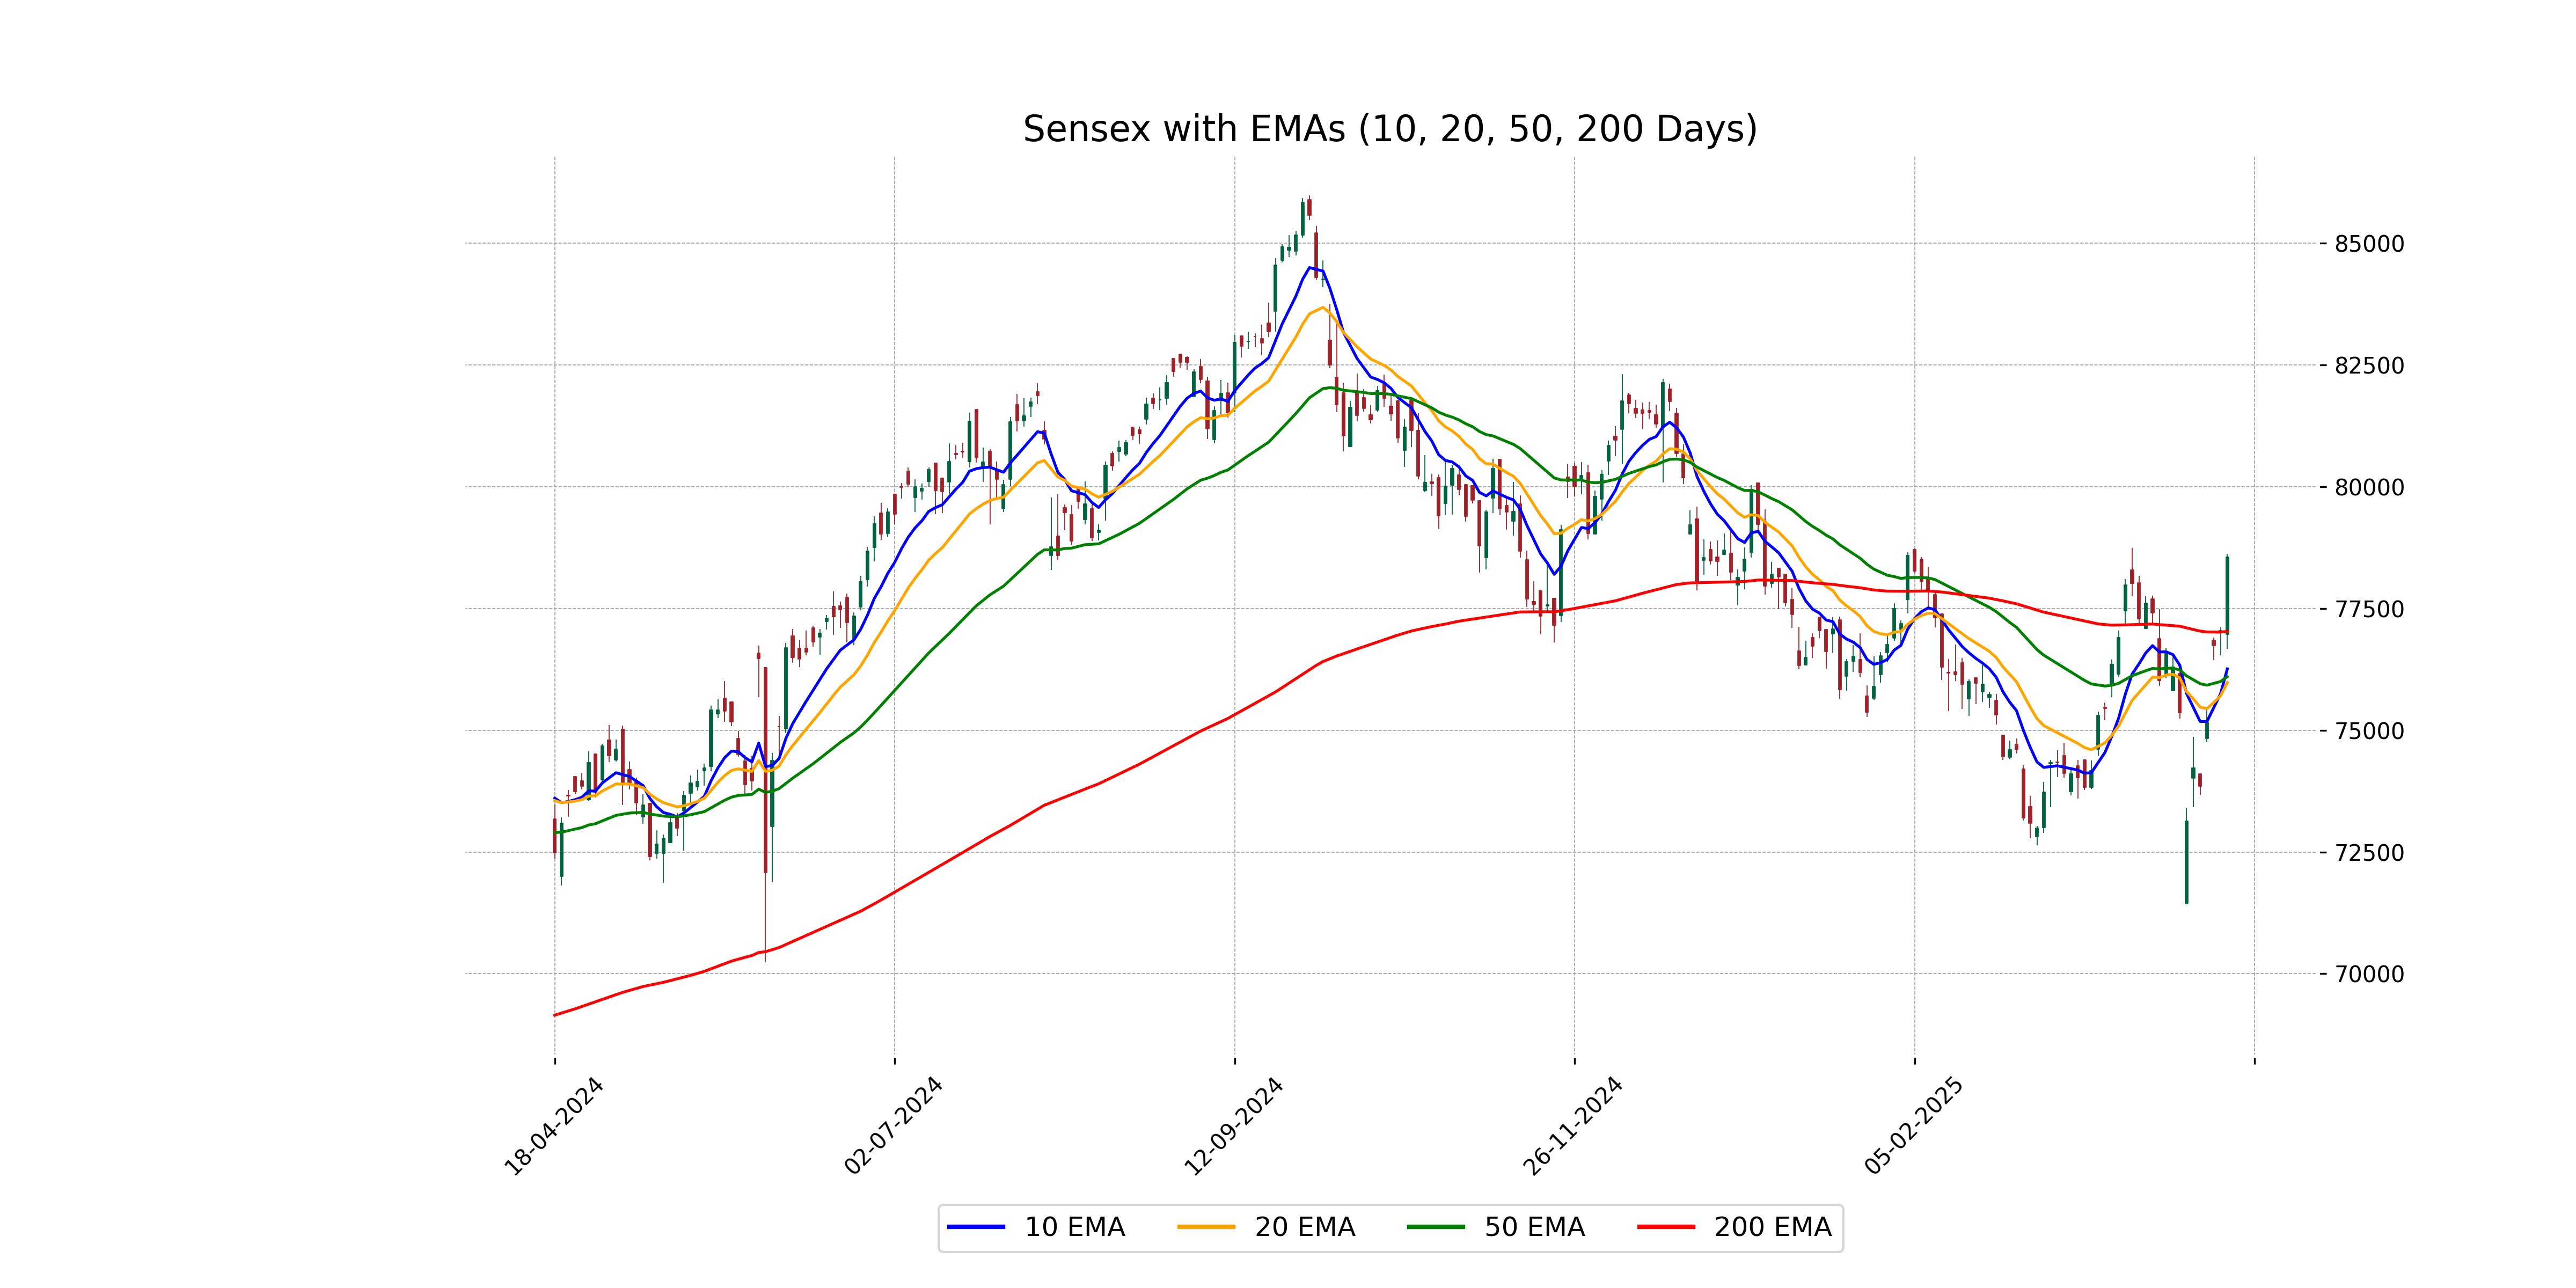
Relationship with Key Moving Averages
The Sensex currently trades above all key moving averages, including the 50 EMA (76,099.42), 200 EMA (77,029.58), 10 EMA (76,257.95), and 20 EMA (75,978.29), indicating a strong bullish trend. The close price of 78,553.20 suggests upward momentum as it exceeds these average levels.
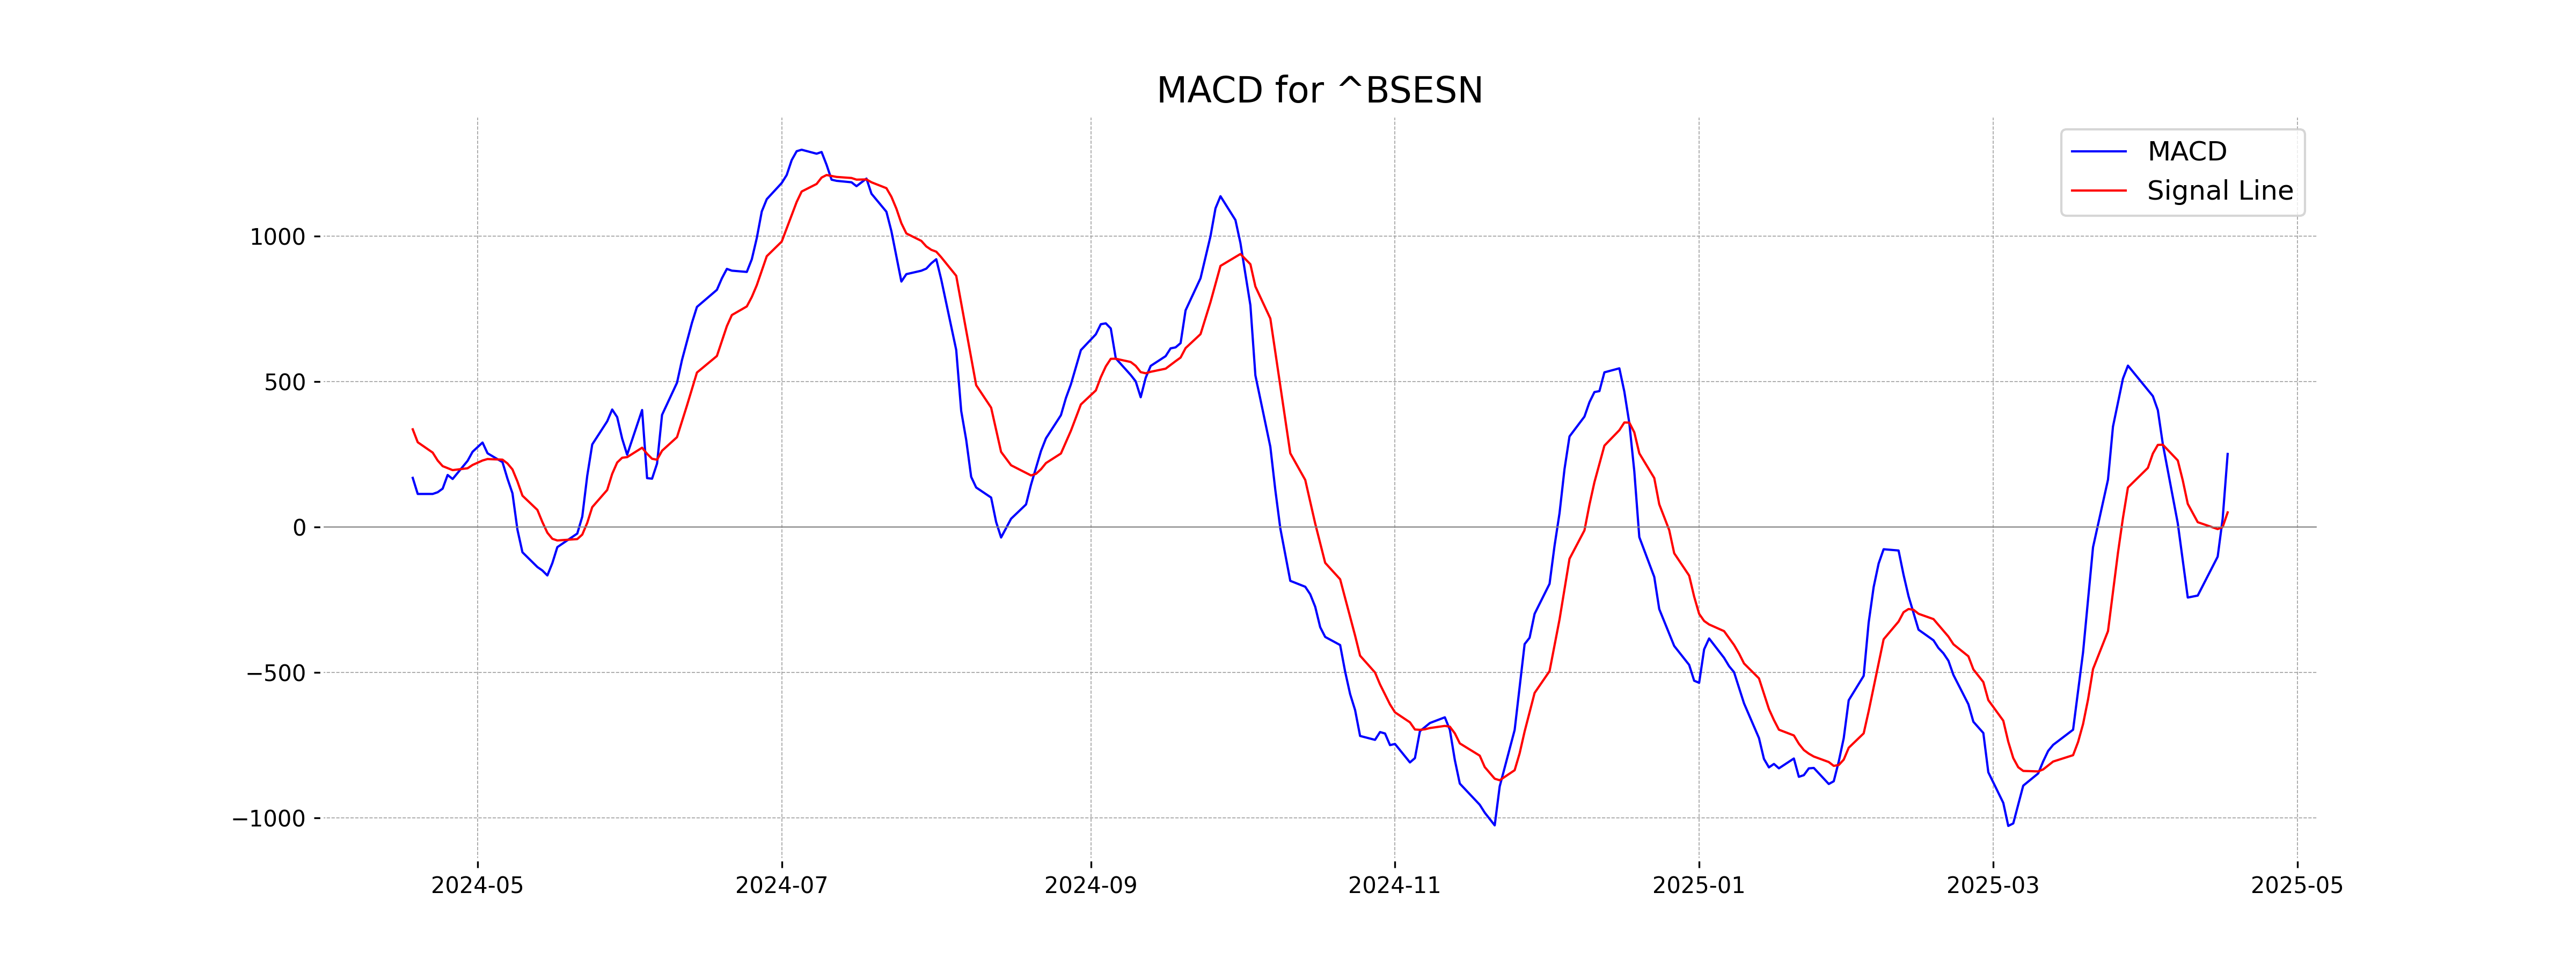
Moving Averages Trend (MACD)
The MACD for Sensex is 251.77, significantly higher than the signal line at 50.84, indicating strong bullish momentum. With the RSI at 62.90, market conditions suggest a bullish trend with further upside potential.
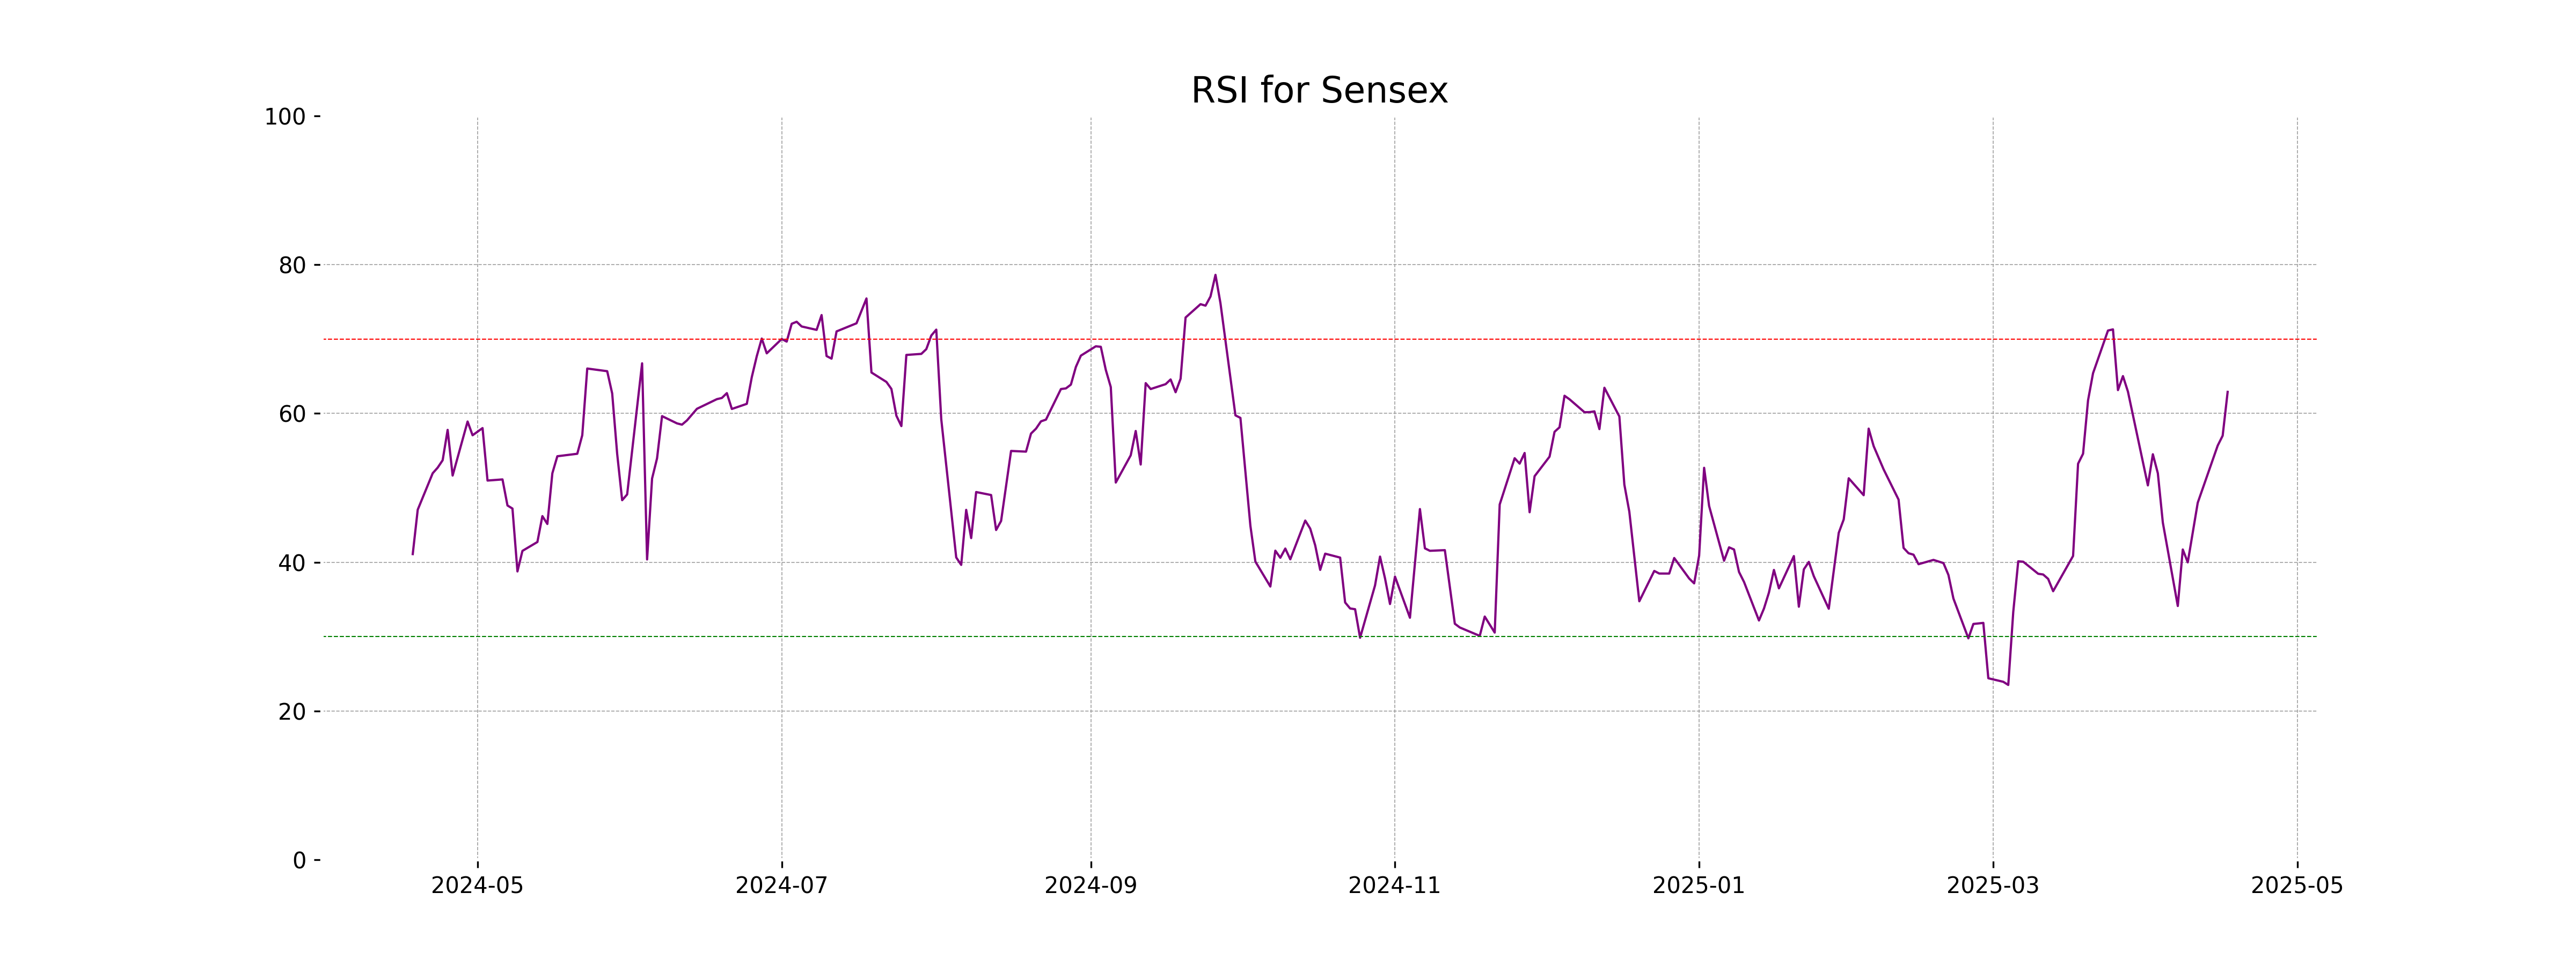
RSI Analysis
Based on the stock data, the Relative Strength Index (RSI) for Sensex is 62.90. This indicates a moderately strong momentum and suggests that the stock is neither overbought nor oversold at the current levels. Generally, an RSI above 70 is considered overbought, and below 30 is considered oversold.
Analysis for Dow Jones Industrial Average (US) - April 17, 2025
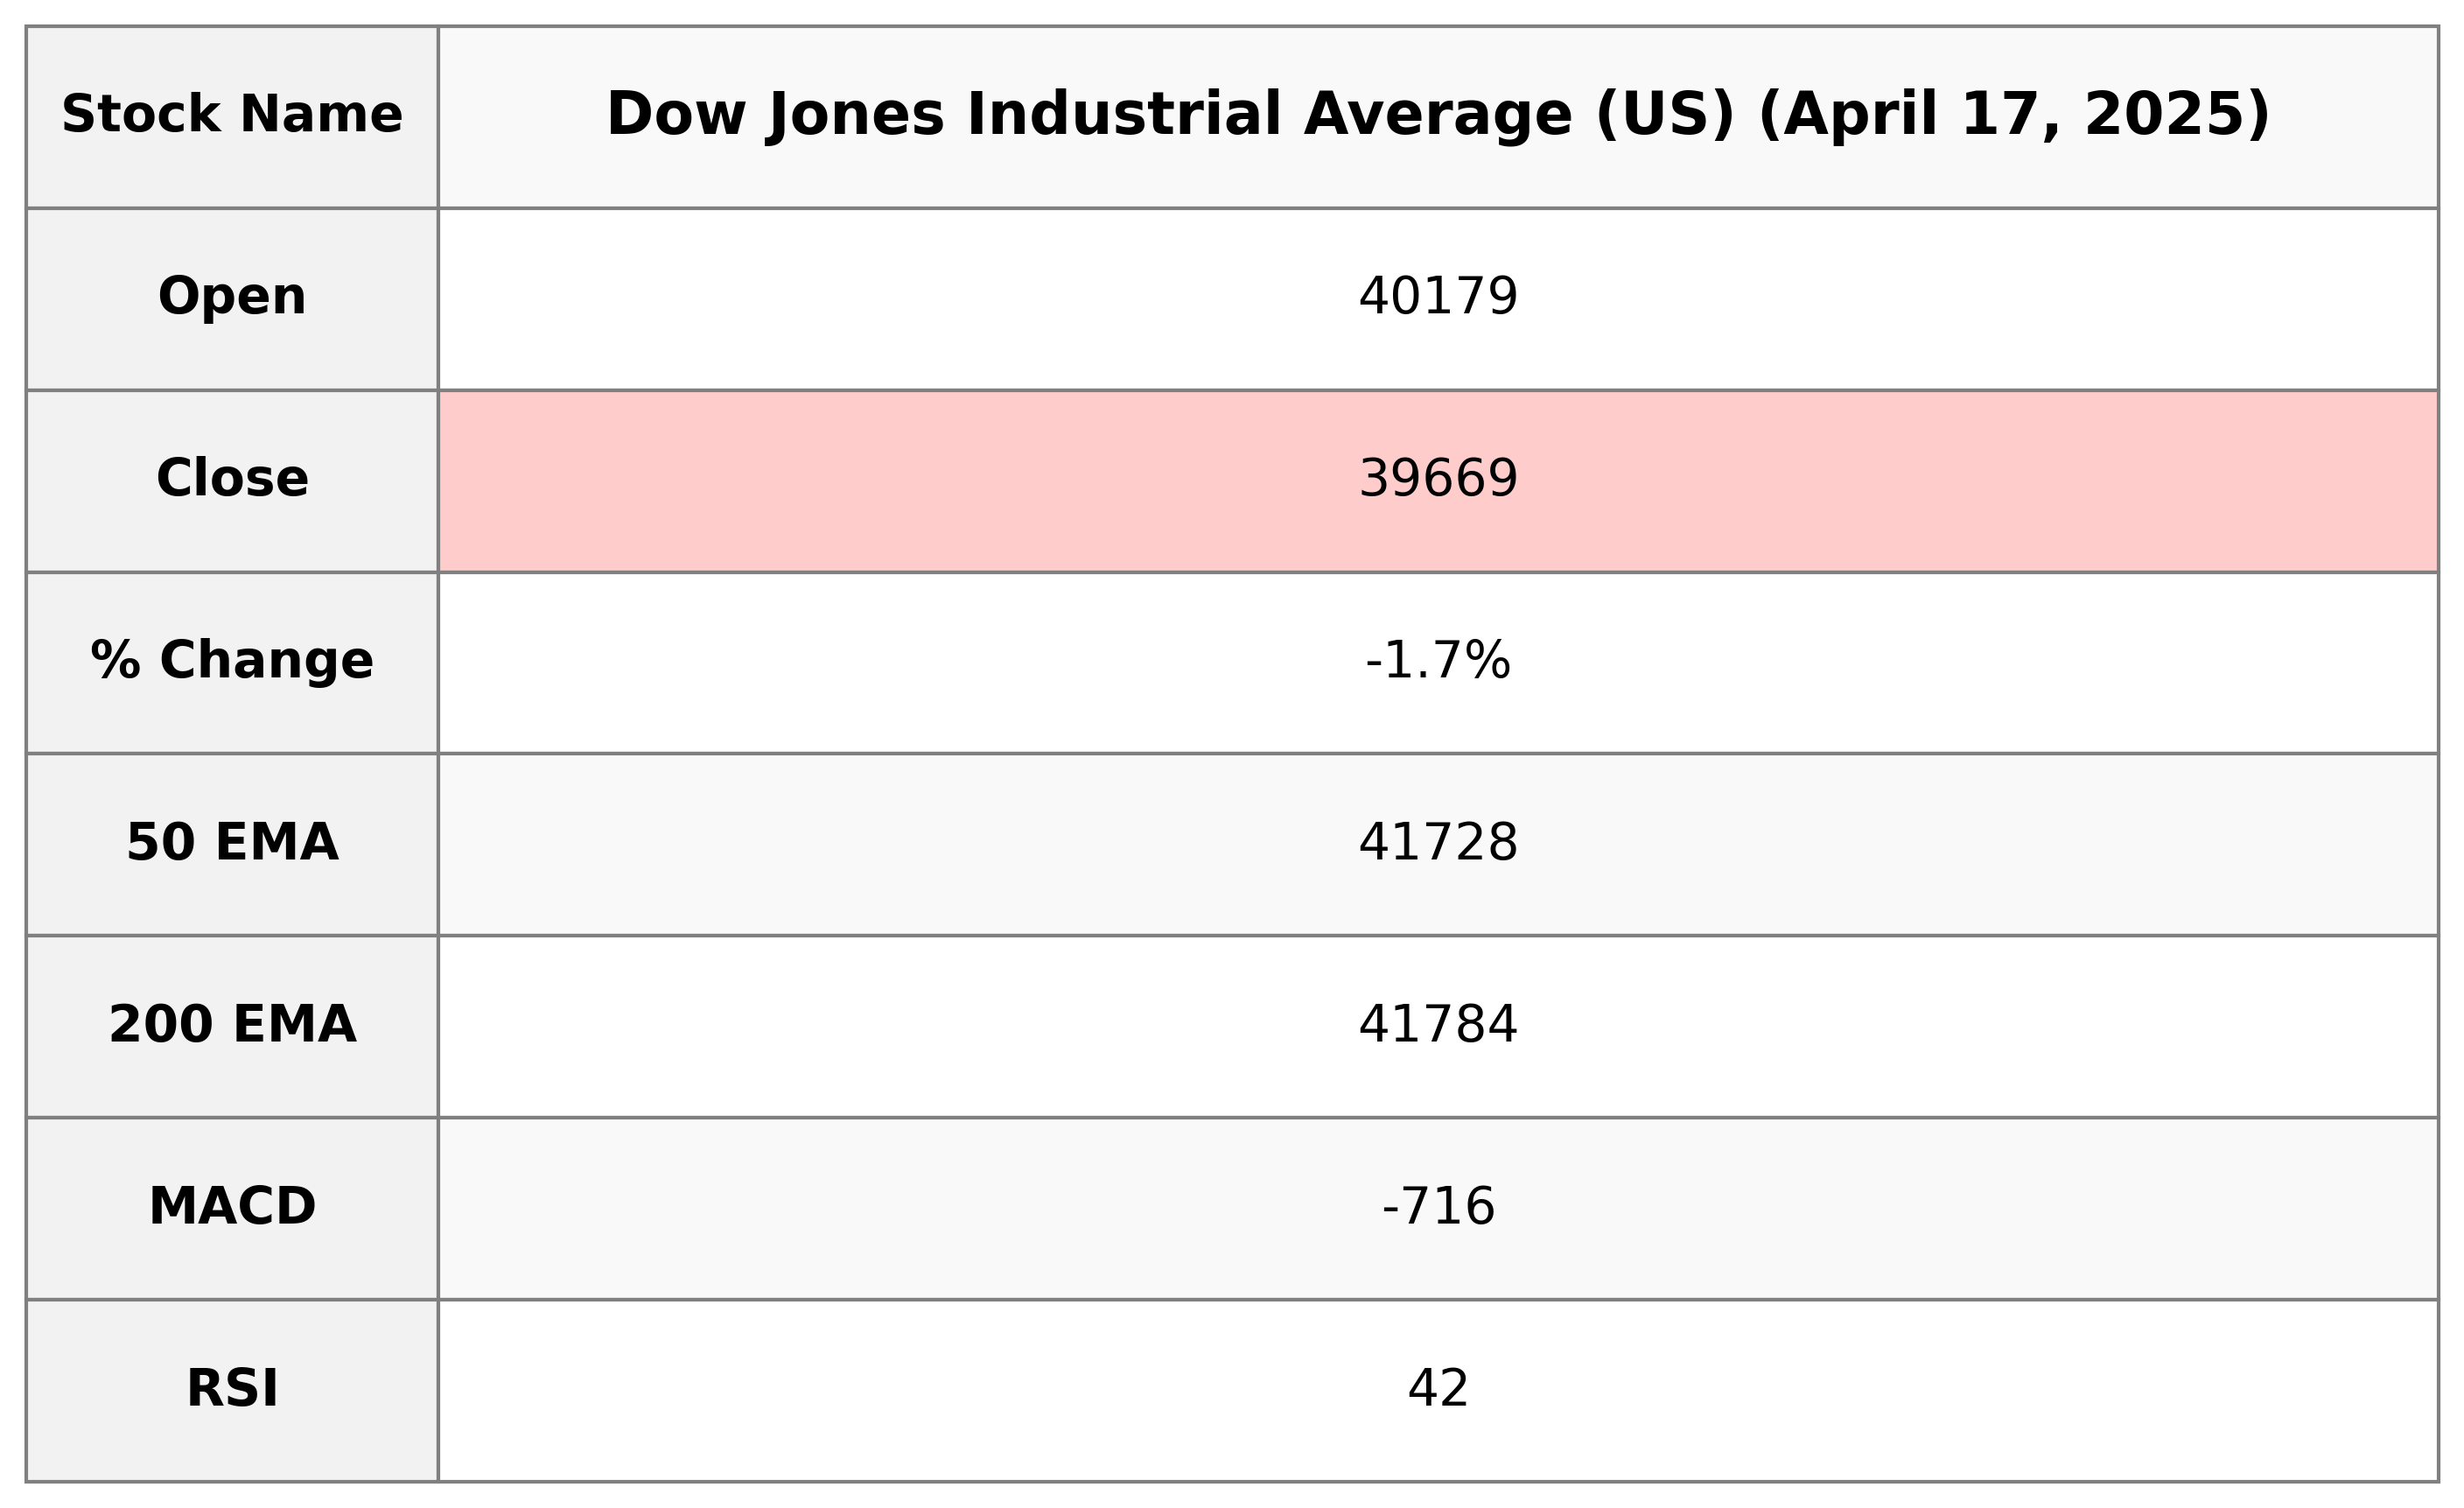
The Dow Jones Industrial Average (US) experienced a decline, with the index closing at 39,669.39, a decrease of 1.73% or 699.57 points from the previous close of 40,368.96. The index's RSI at 42.23 indicates a neutral momentum, while the MACD suggests a slightly bearish trend. The trading volume was 737.55 million.
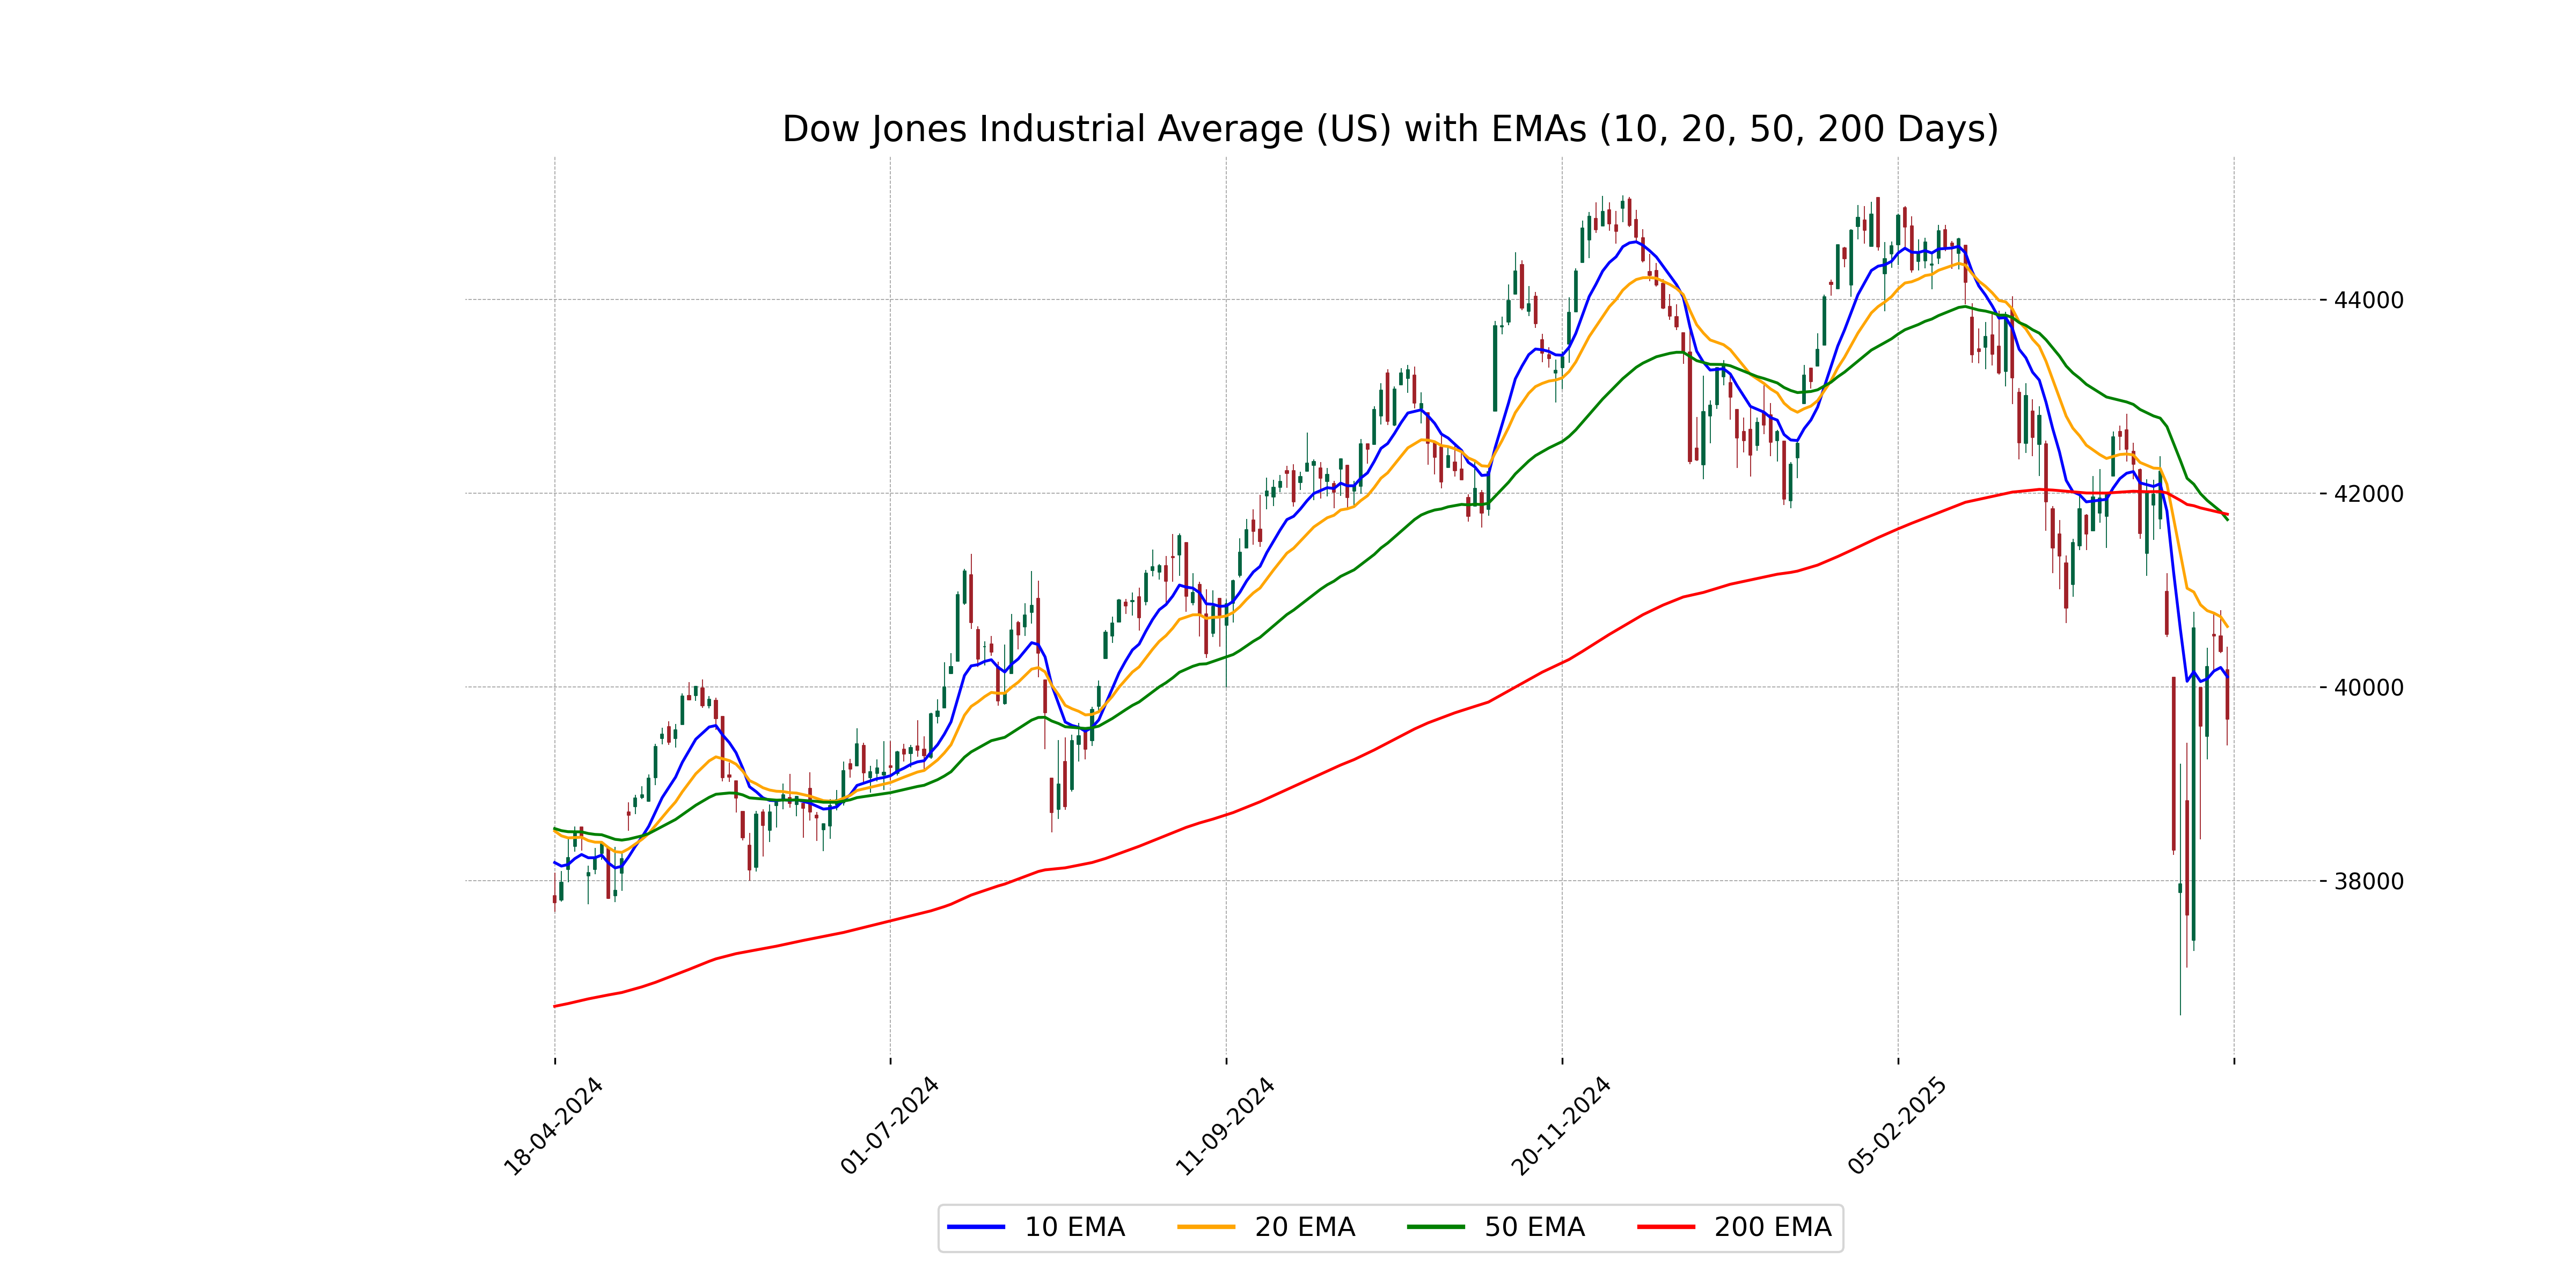
Relationship with Key Moving Averages
The Dow Jones Industrial Average opened below its 10 EMA and 20 EMA, indicating a bearish sentiment. The closing price of 39669.39 is significantly below all major moving averages (50 EMA and 200 EMA), suggesting continued downward pressure.
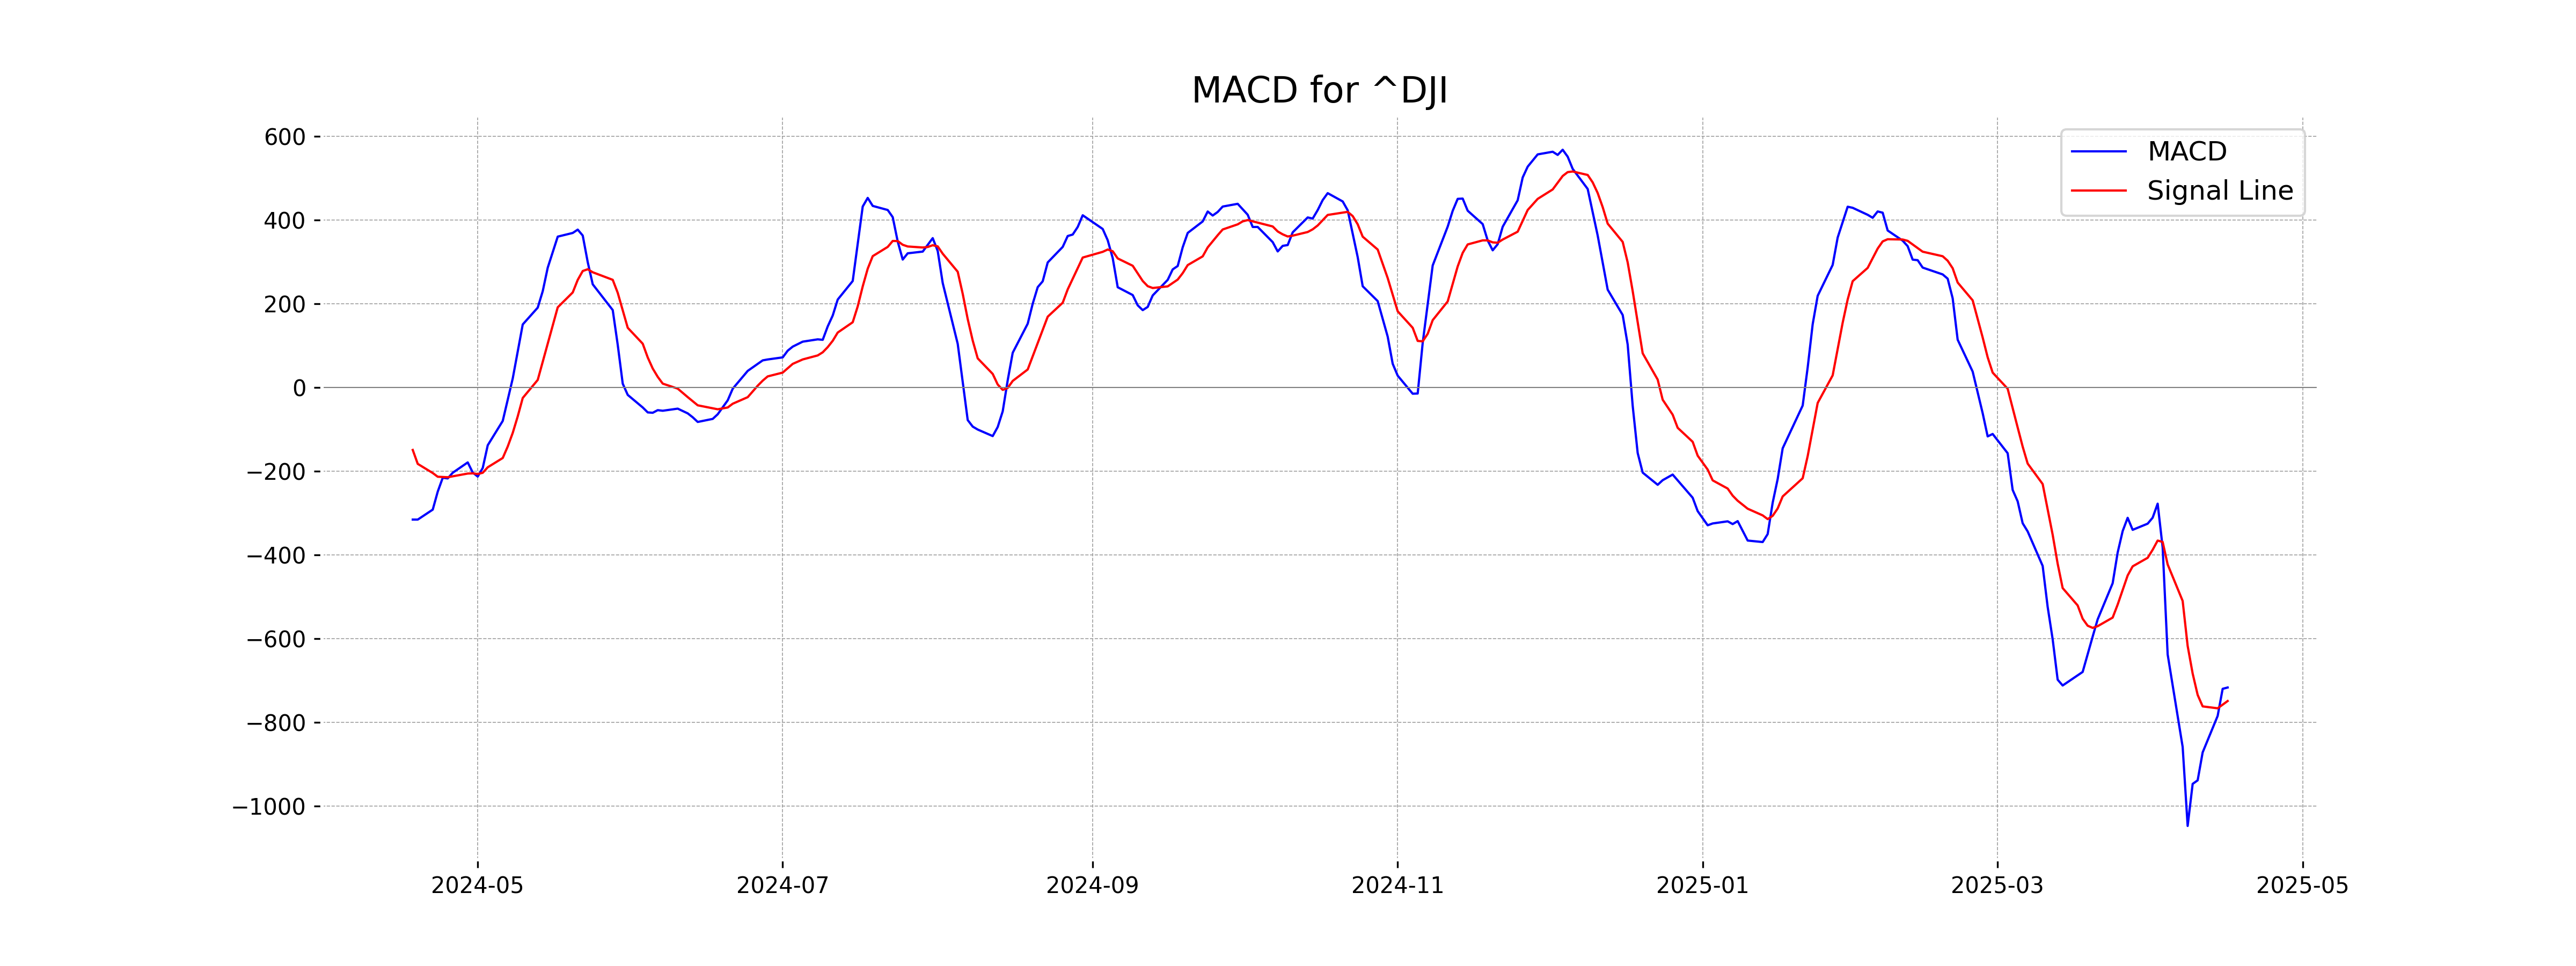
Moving Averages Trend (MACD)
MACD Analysis for Dow Jones Industrial Average (US): The MACD value of -716.22 indicates a bearish trend as it is below the MACD Signal of -748.50. A negative MACD suggests downward momentum and potential continuation of the current downtrend.
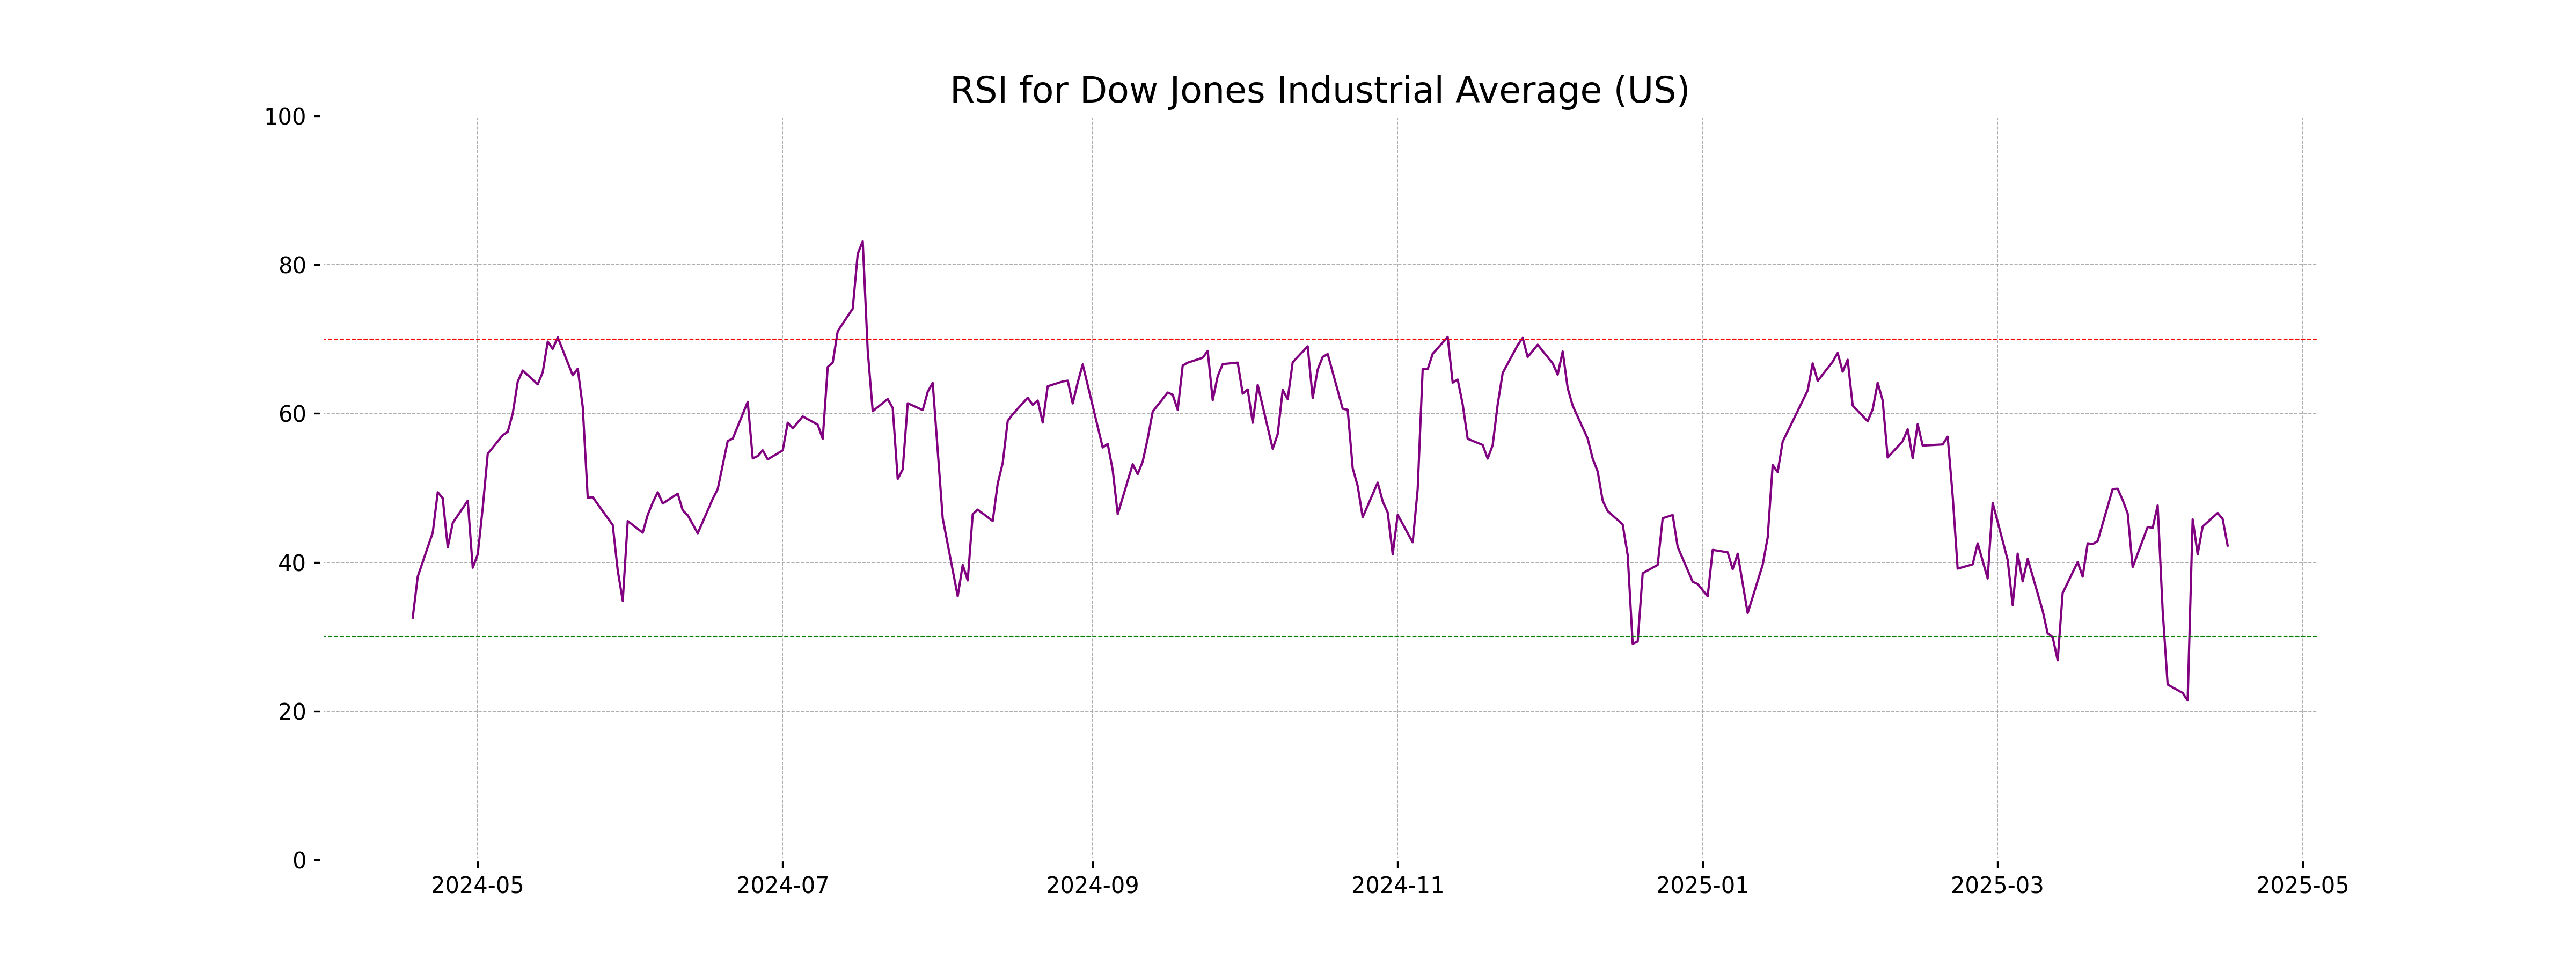
RSI Analysis
The RSI (Relative Strength Index) for the Dow Jones Industrial Average is 42.23, indicating a relatively neutral level as it is between 30 and 70. This suggests the index is neither in overbought nor oversold territory, but it is worth monitoring for potential changes if the RSI moves closer to the traditional thresholds of 30 or 70.
Analysis for CAC 40 (France) - April 17, 2025
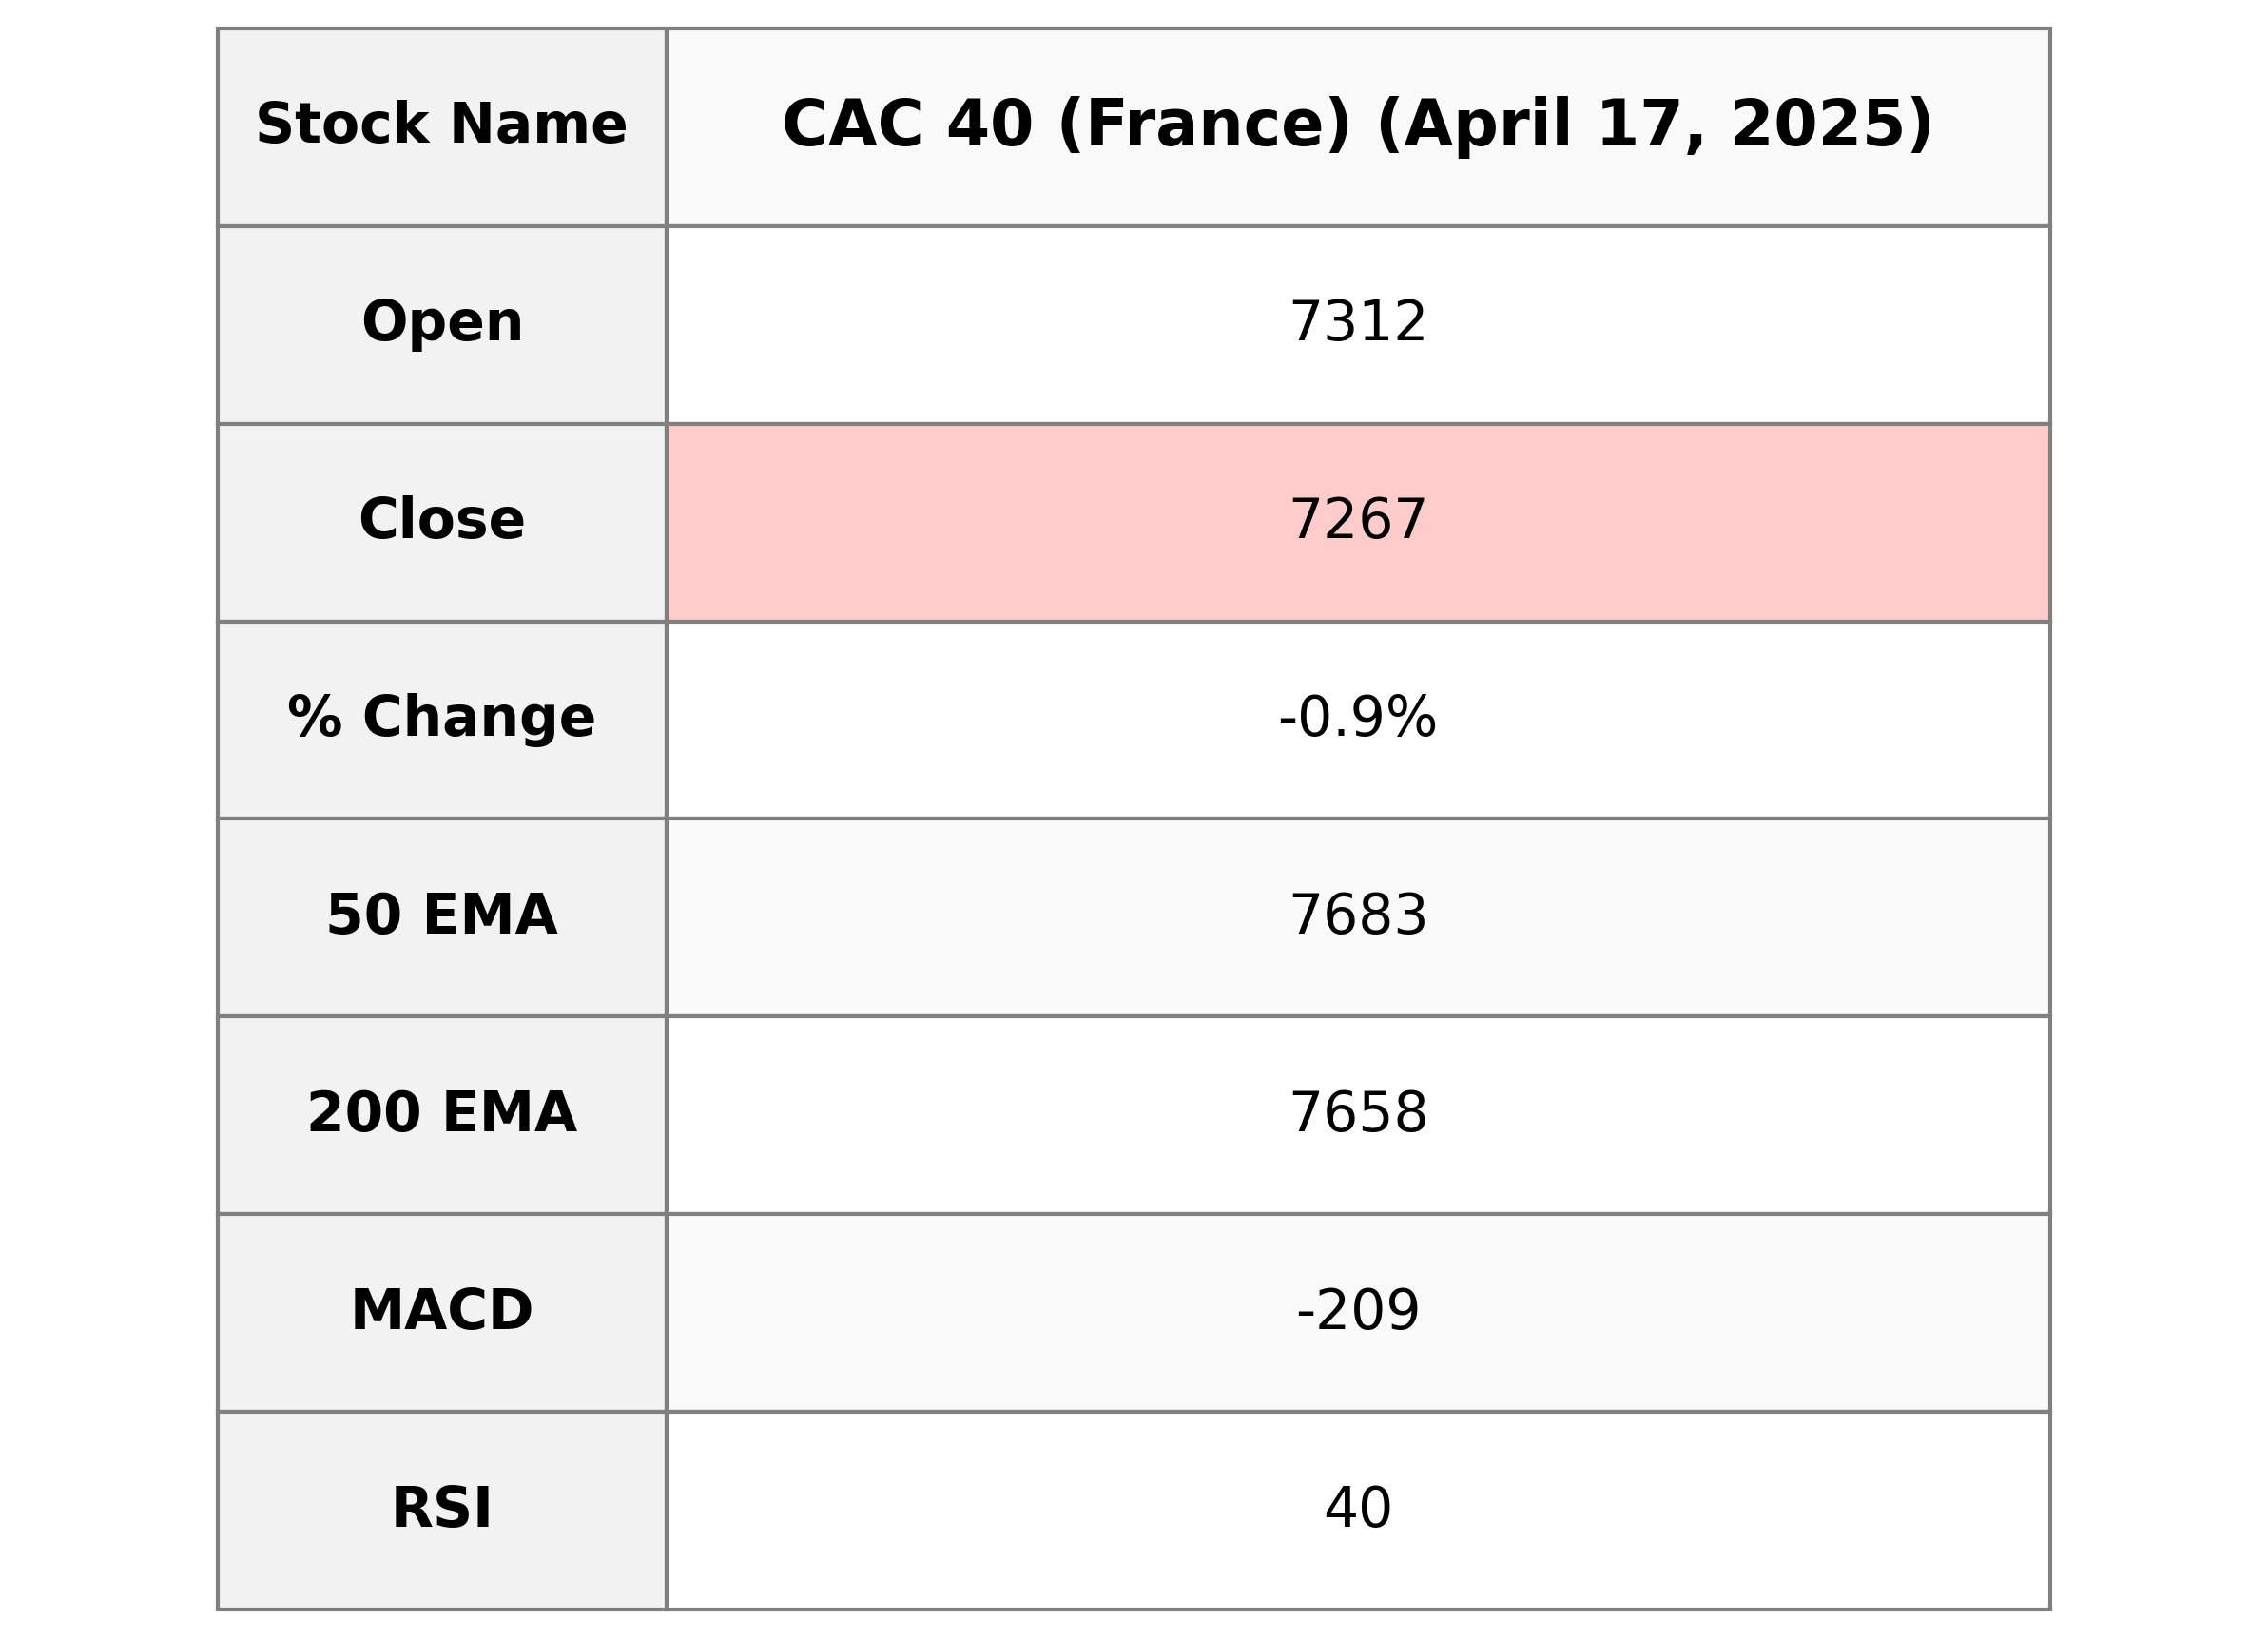
CAC 40 (France) Performance: On the trading day, the CAC 40 index opened at 7311.91, reaching a high of 7331.64 and a low of 7262.30, closing at 7267.33. This reflects a loss of 62.64 points or a 0.85% decrease from the previous close of 7329.97. The RSI of 40.18 suggests a weaker momentum, while the MACD indicates a bearish trend with a value of -208.75, as compared to its signal line at -202.80.
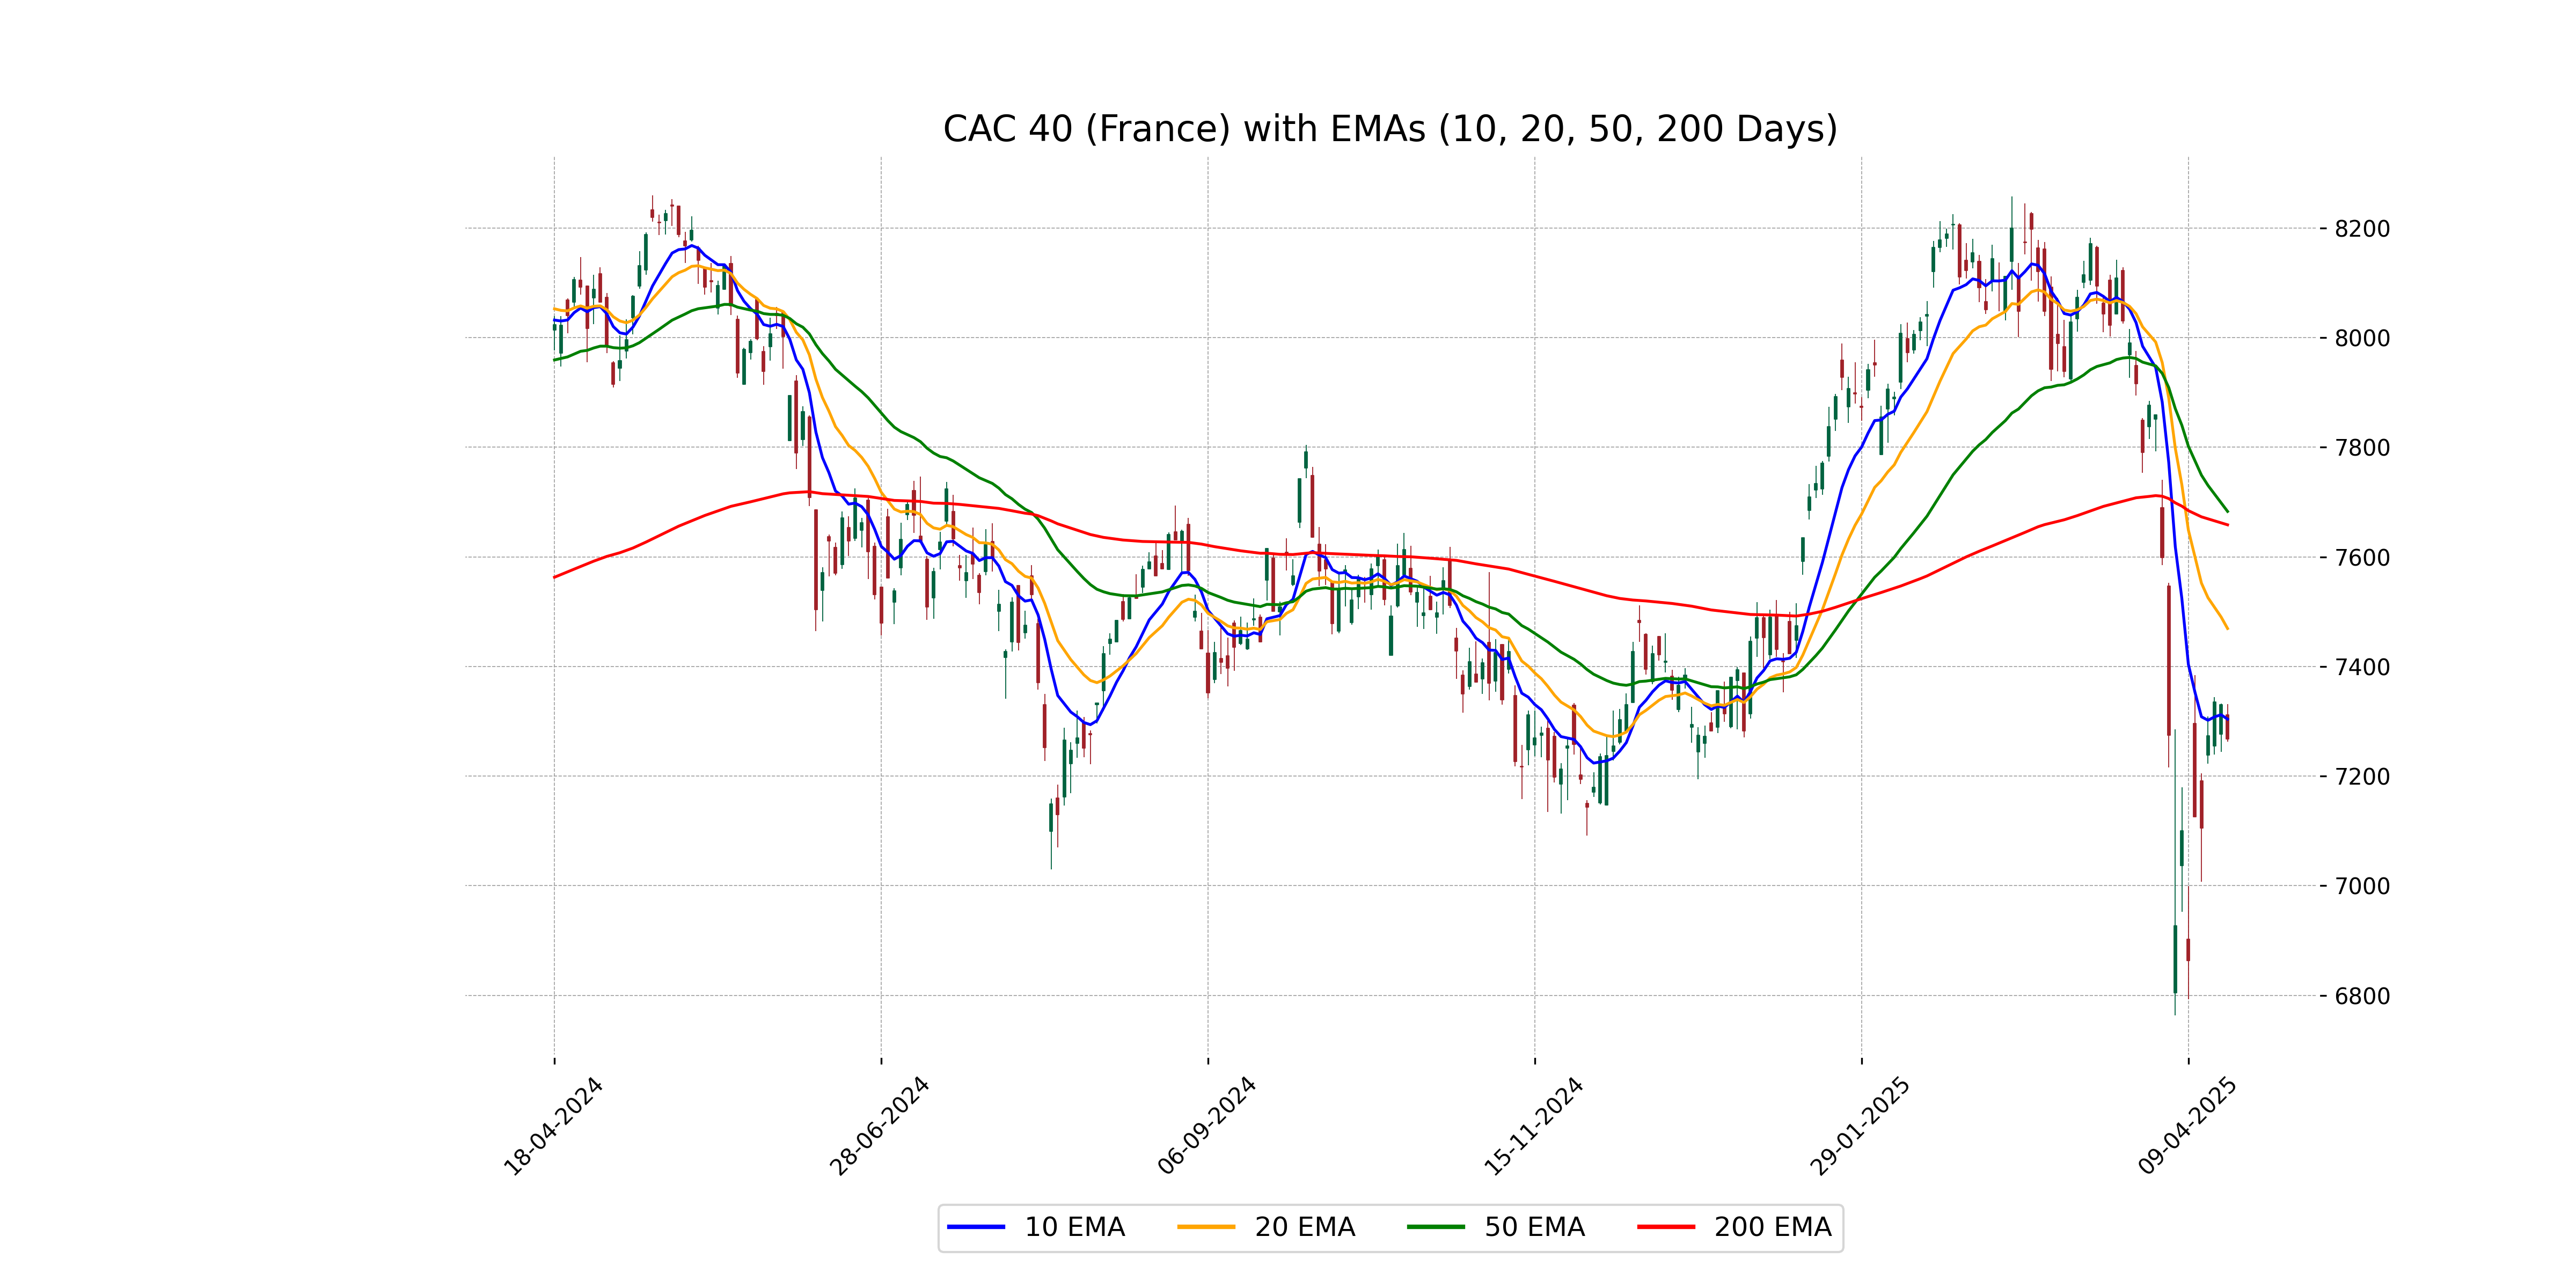
Relationship with Key Moving Averages
CAC 40 (France) closed below several key moving averages, including the 50 EMA (7682.85), 200 EMA (7658.42), and 20 EMA (7469.22), indicating potential bearish momentum. The close was also below the 10 EMA (7303.84), which further corroborates the downward trend.
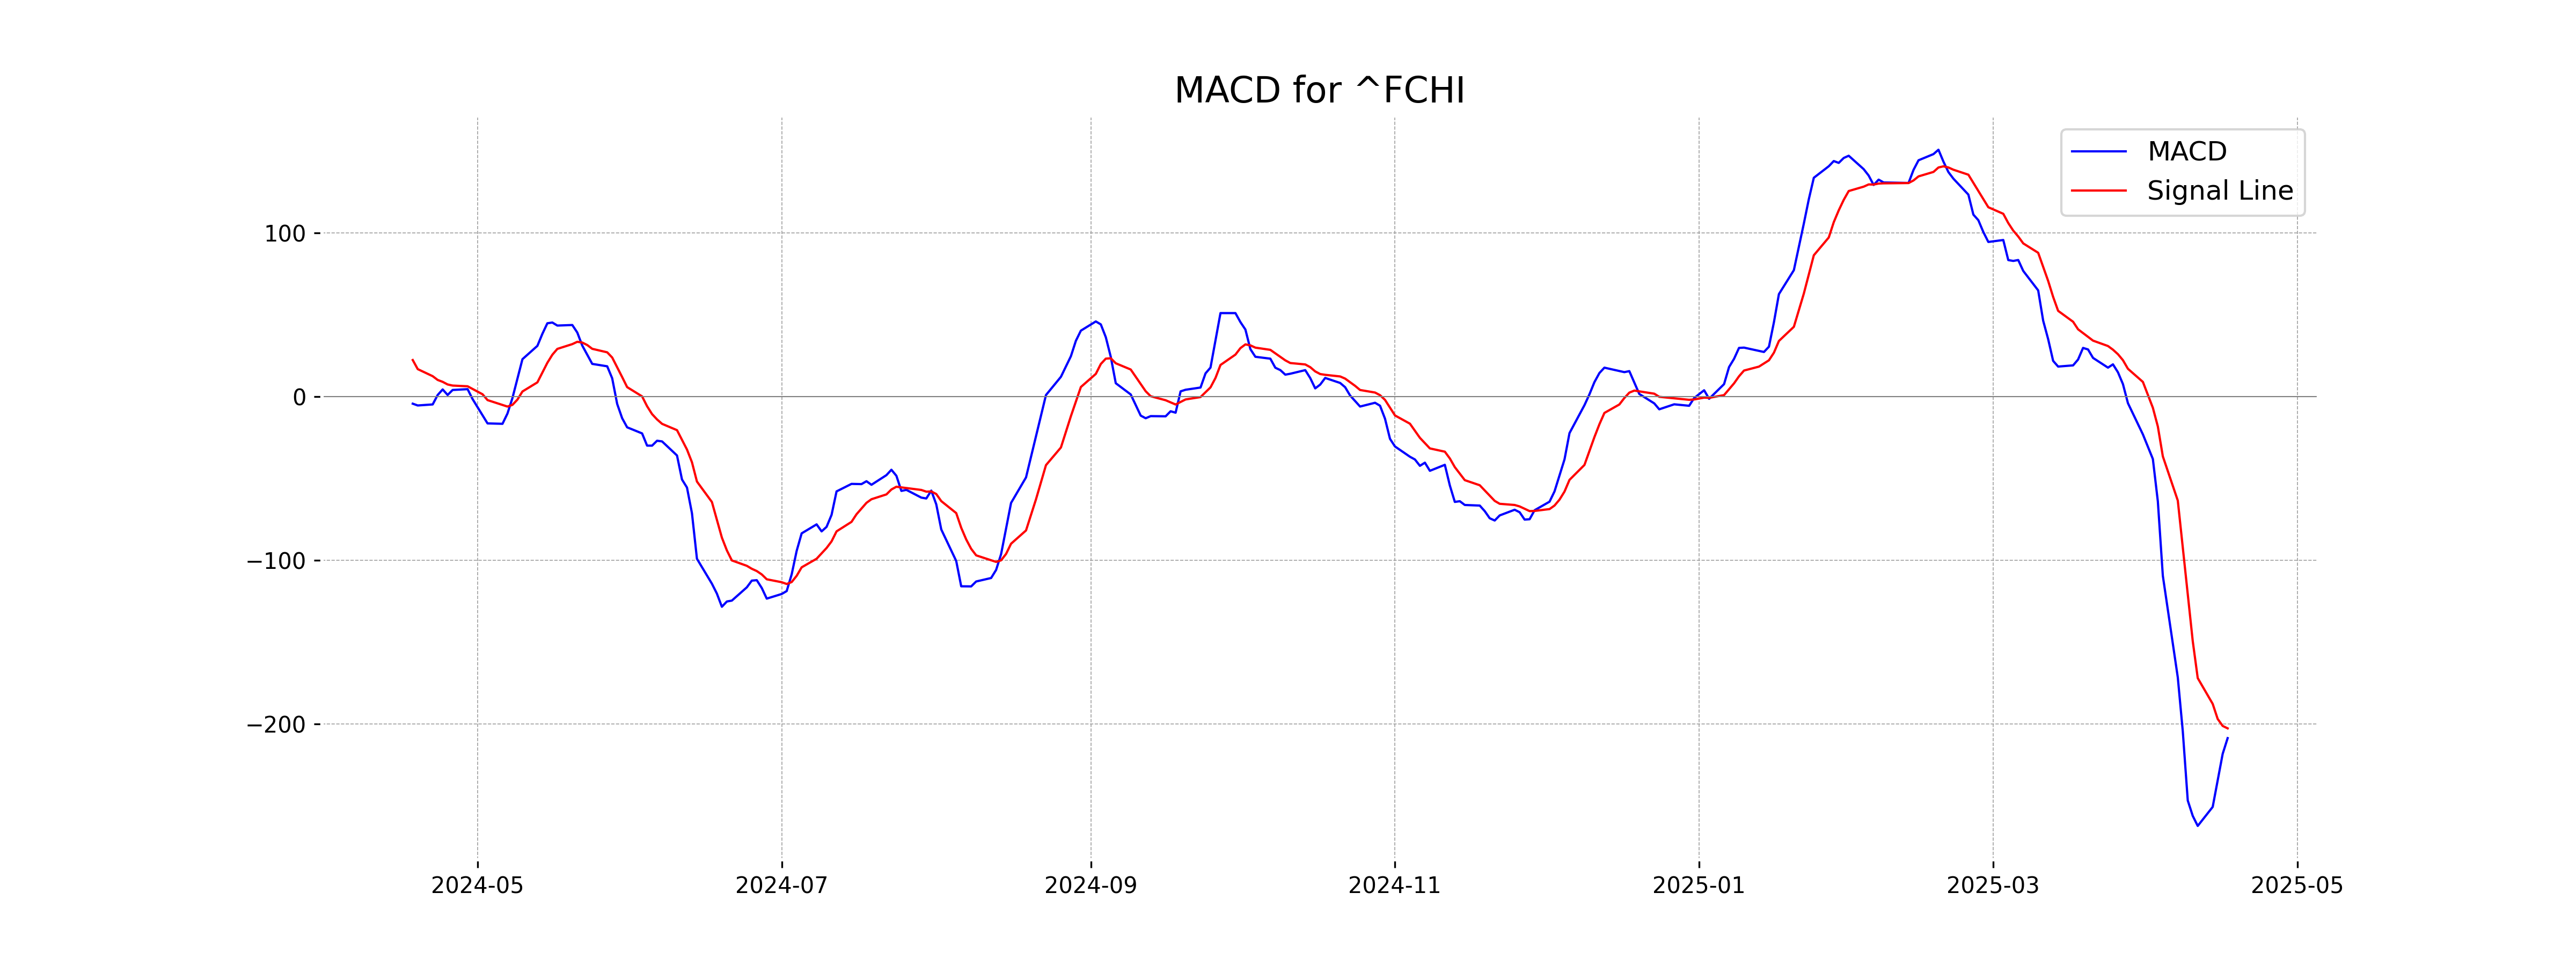
Moving Averages Trend (MACD)
MACD Analysis for CAC 40 (France): The MACD value is -208.75, which is below the MACD Signal at -202.80, suggesting a bearish trend. This indicates potential downward momentum in the stock price.
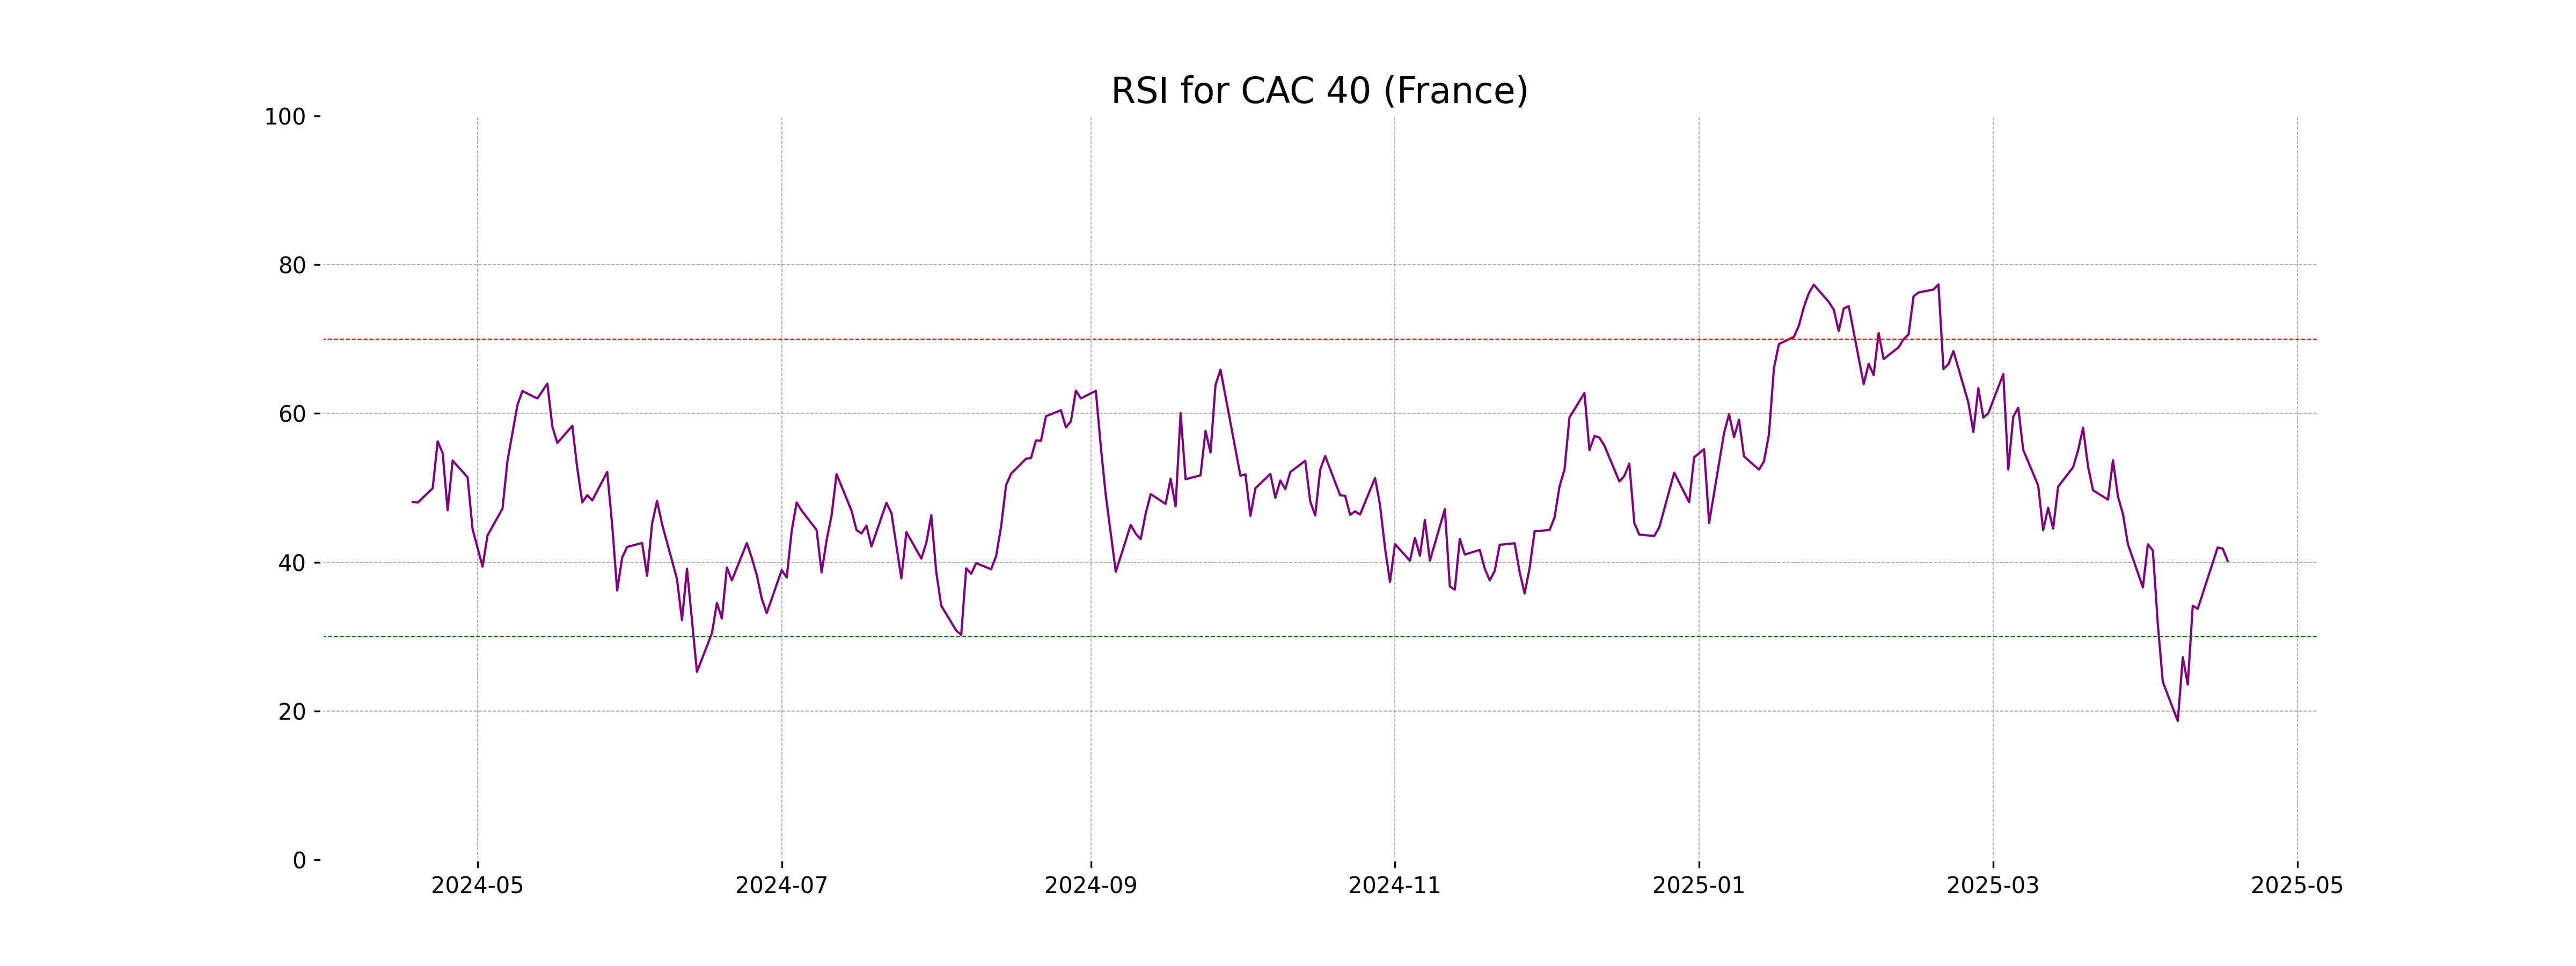
RSI Analysis
The CAC 40 index has an RSI of 40.18, indicating a relatively weak momentum and suggesting that the index is approaching an oversold condition. This level could imply potential for a reversal or continuation of the current trend depending on other market factors.
Analysis for FTSE 100 (UK) - April 17, 2025

FTSE 100 (UK) Performance: The FTSE 100 experienced a decline today, closing at 8204.70, down from the previous close of 8275.60. This represents a percentage change of -0.86% and a points change of -70.89. The RSI indicates a slightly bearish momentum at 45.69, while the MACD suggests a negative trend with a value of -135.62, though the MACD Signal is slightly more negative at -146.06.
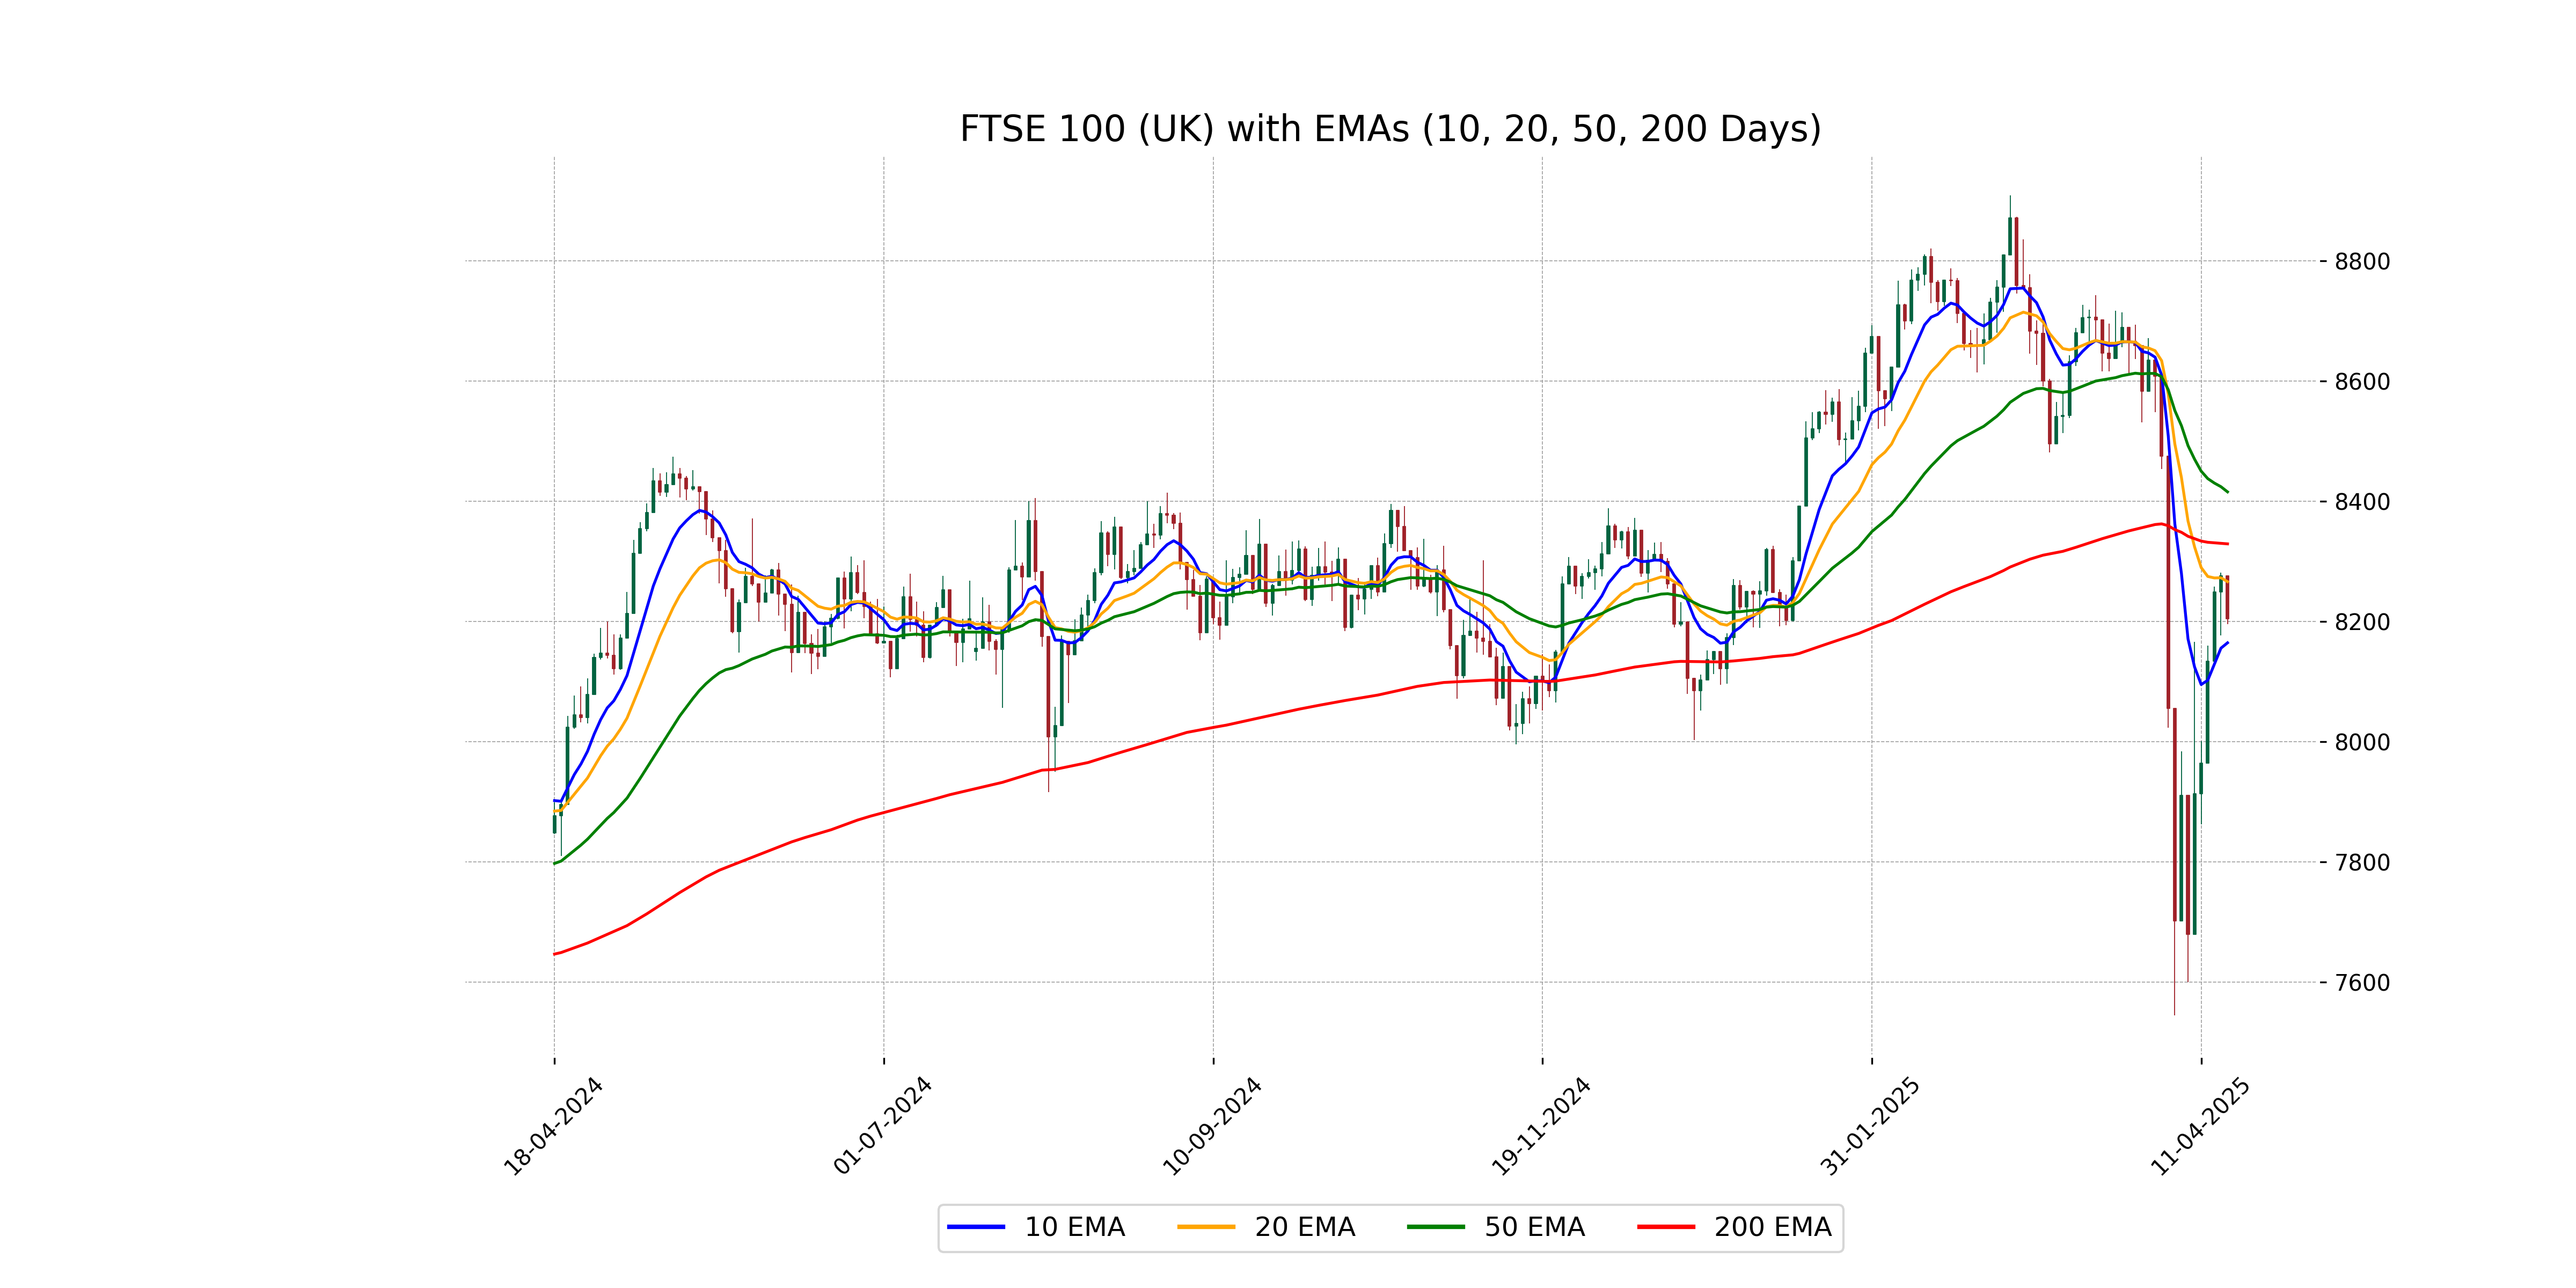
Relationship with Key Moving Averages
The FTSE 100 is trading below its 50-day and 200-day EMAs, indicating a potential bearish trend. However, it remains slightly above the 10-day EMA, suggesting a recent upward movement against the broader downward trend. The price is also below the 20-day EMA, further supporting a bearish indication.
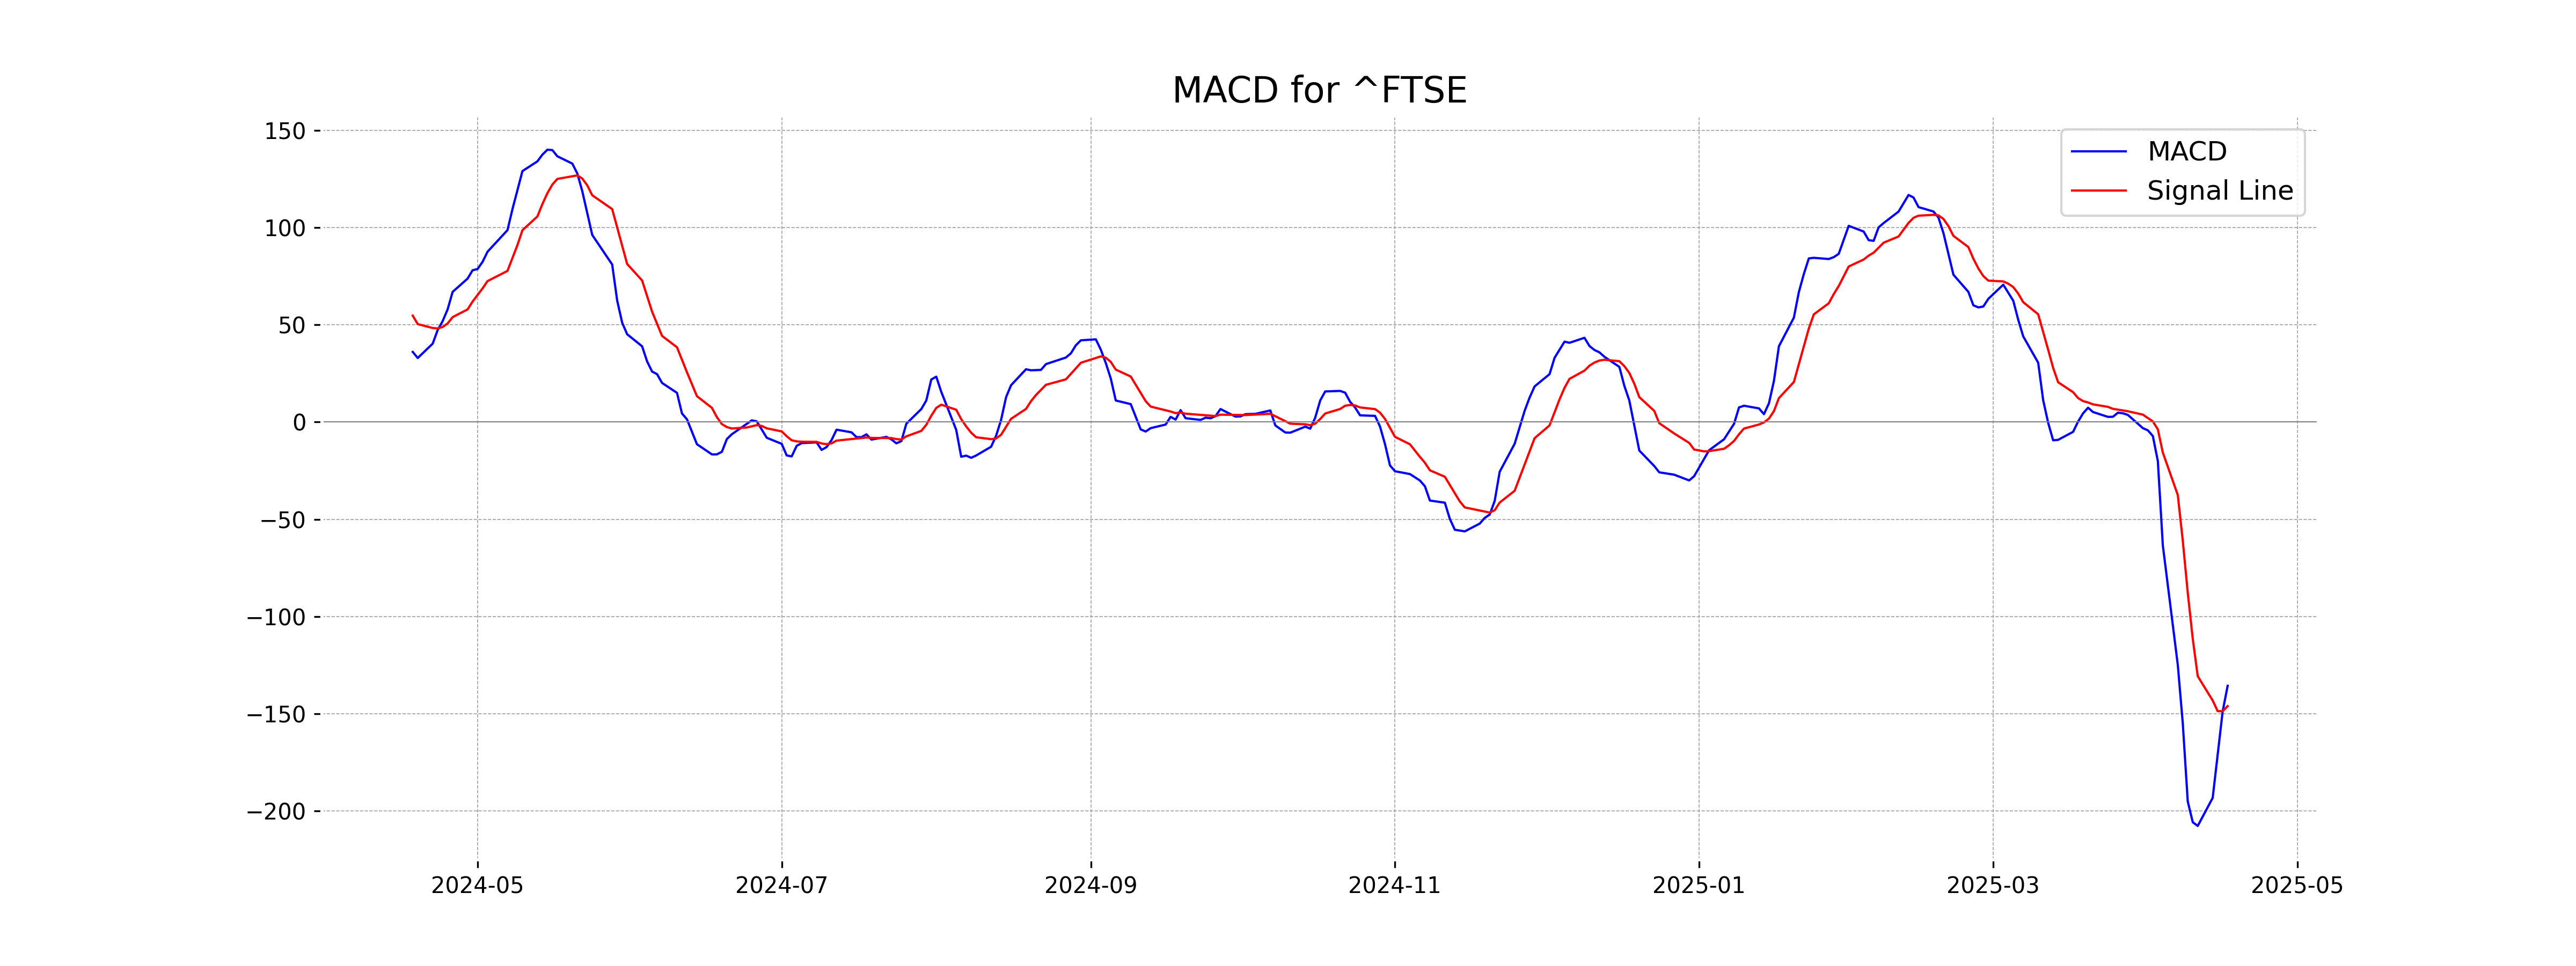
Moving Averages Trend (MACD)
MACD Analysis for FTSE 100 (UK): The MACD value is -135.62, and the MACD Signal is -146.06, indicating a bearish trend. Since the MACD is above the Signal line, the downward momentum may be beginning to weaken slightly.
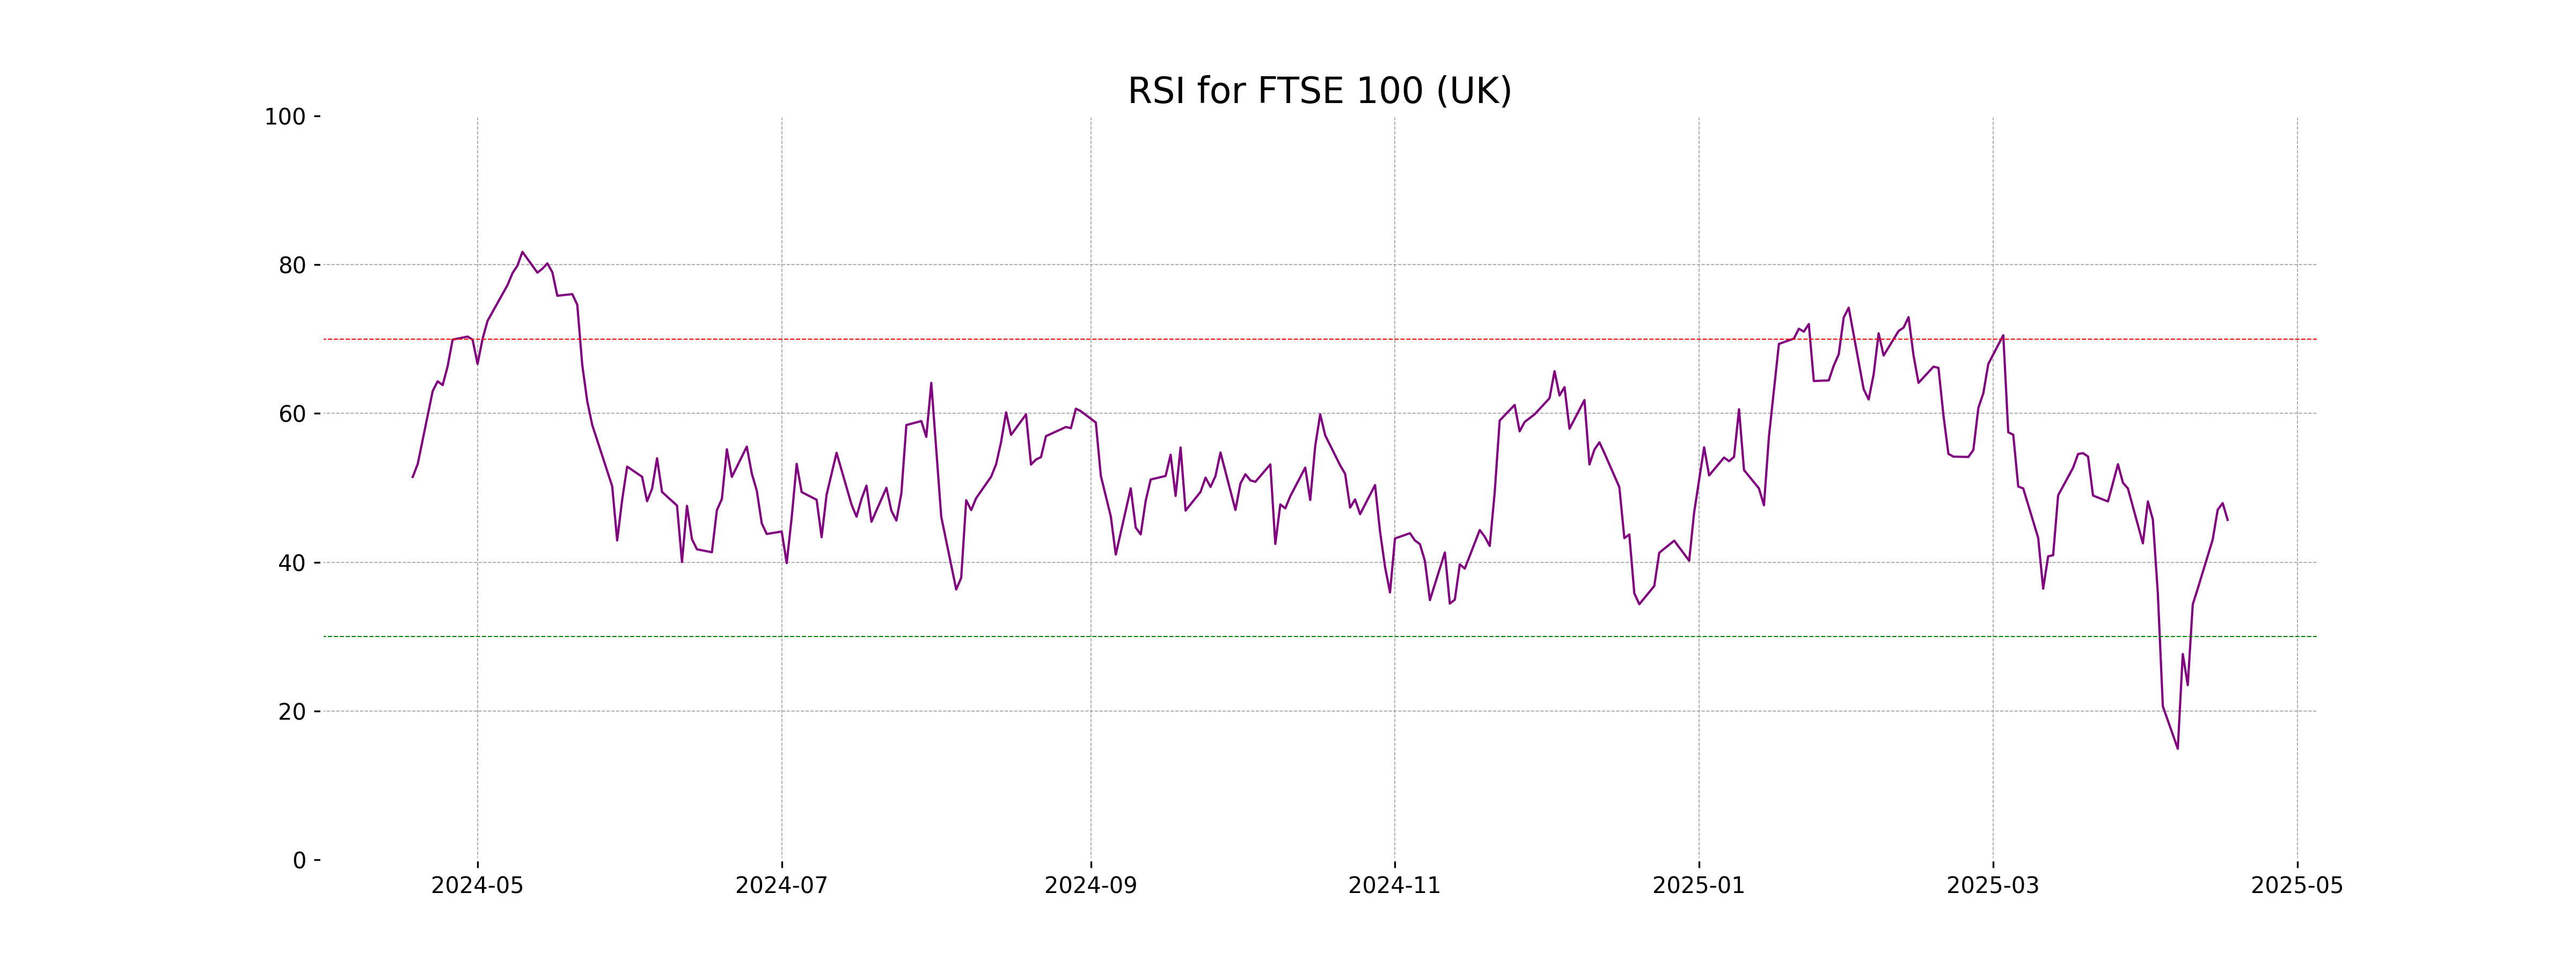
RSI Analysis
The RSI (Relative Strength Index) for FTSE 100 is 45.69, indicating that the index is approaching the oversold territory. This suggests potential buying opportunities as it could be undervalued at current levels.
Analysis for DAX (Germany) - April 17, 2025
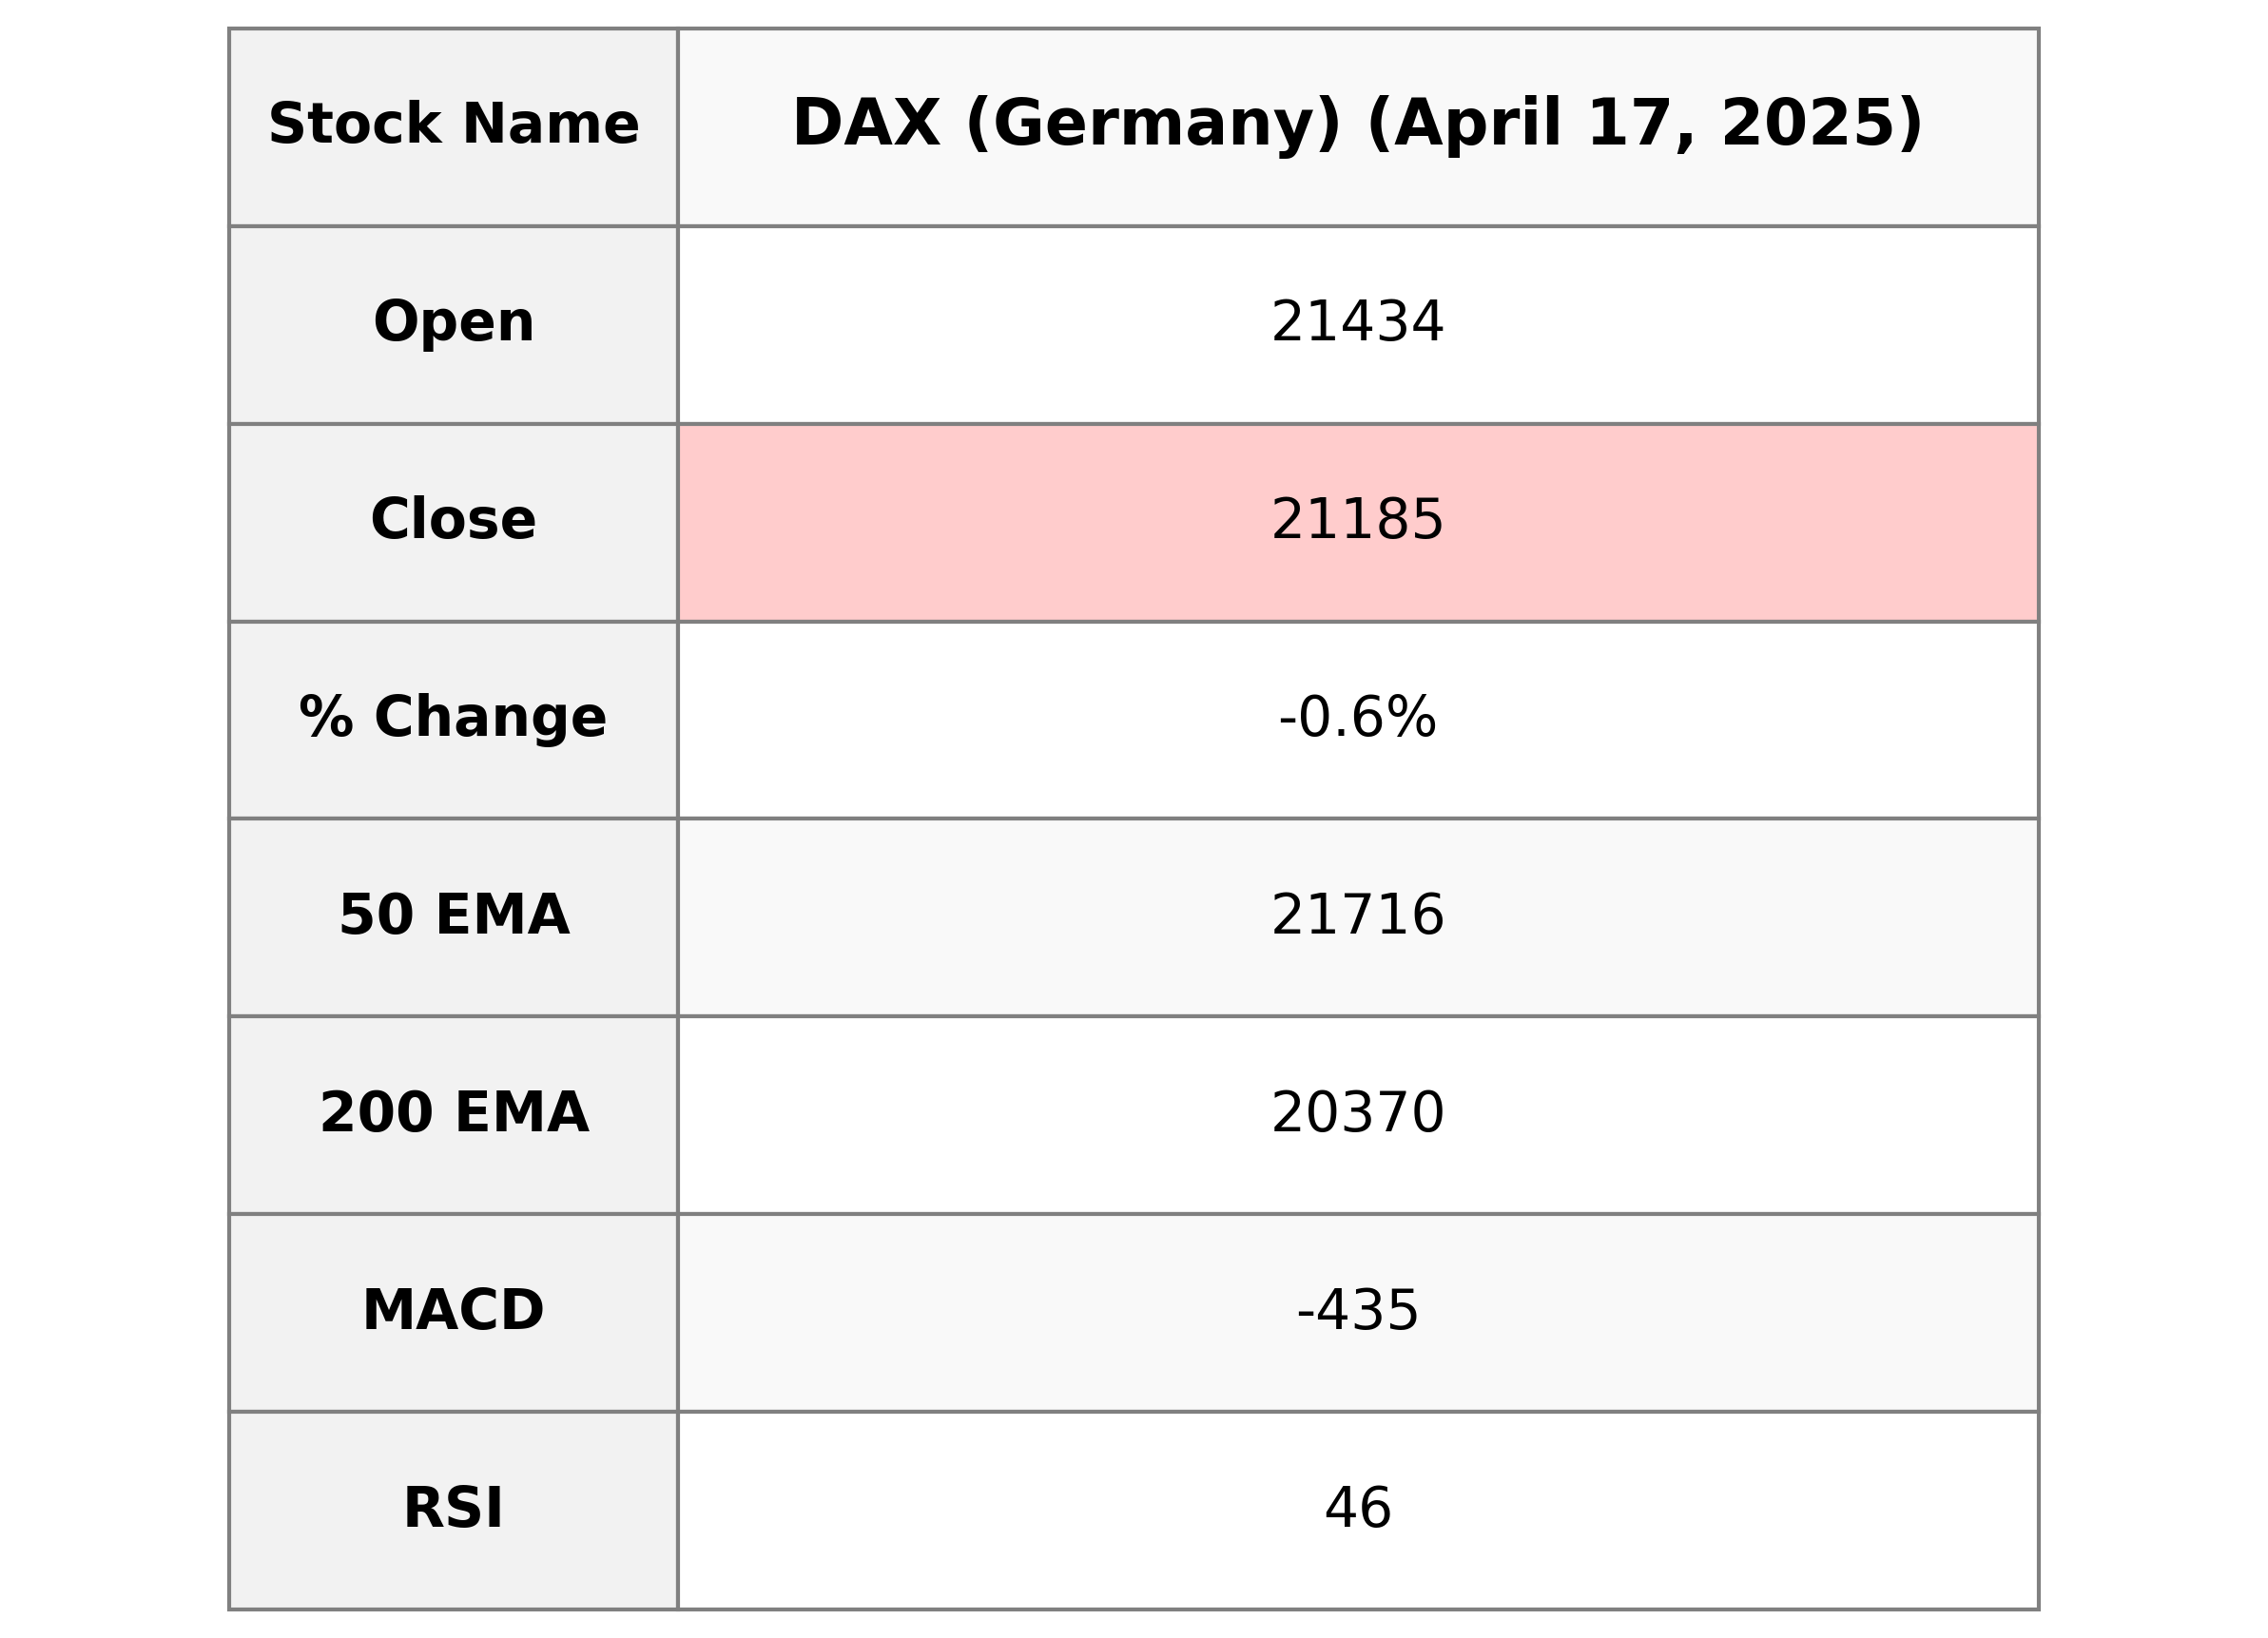
DAX (Germany) Performance: The DAX index opened at 21,433.55 and closed at 21,184.76, marking a decrease of 126.26 points, or -0.59%, compared to the previous close of 21,311.02. The index's daily performance showed a decline, with a relative strength index (RSI) of 45.89, indicating a moderately weak market momentum. Additionally, the MACD suggests bearish momentum as the signal line is higher than the MACD line.
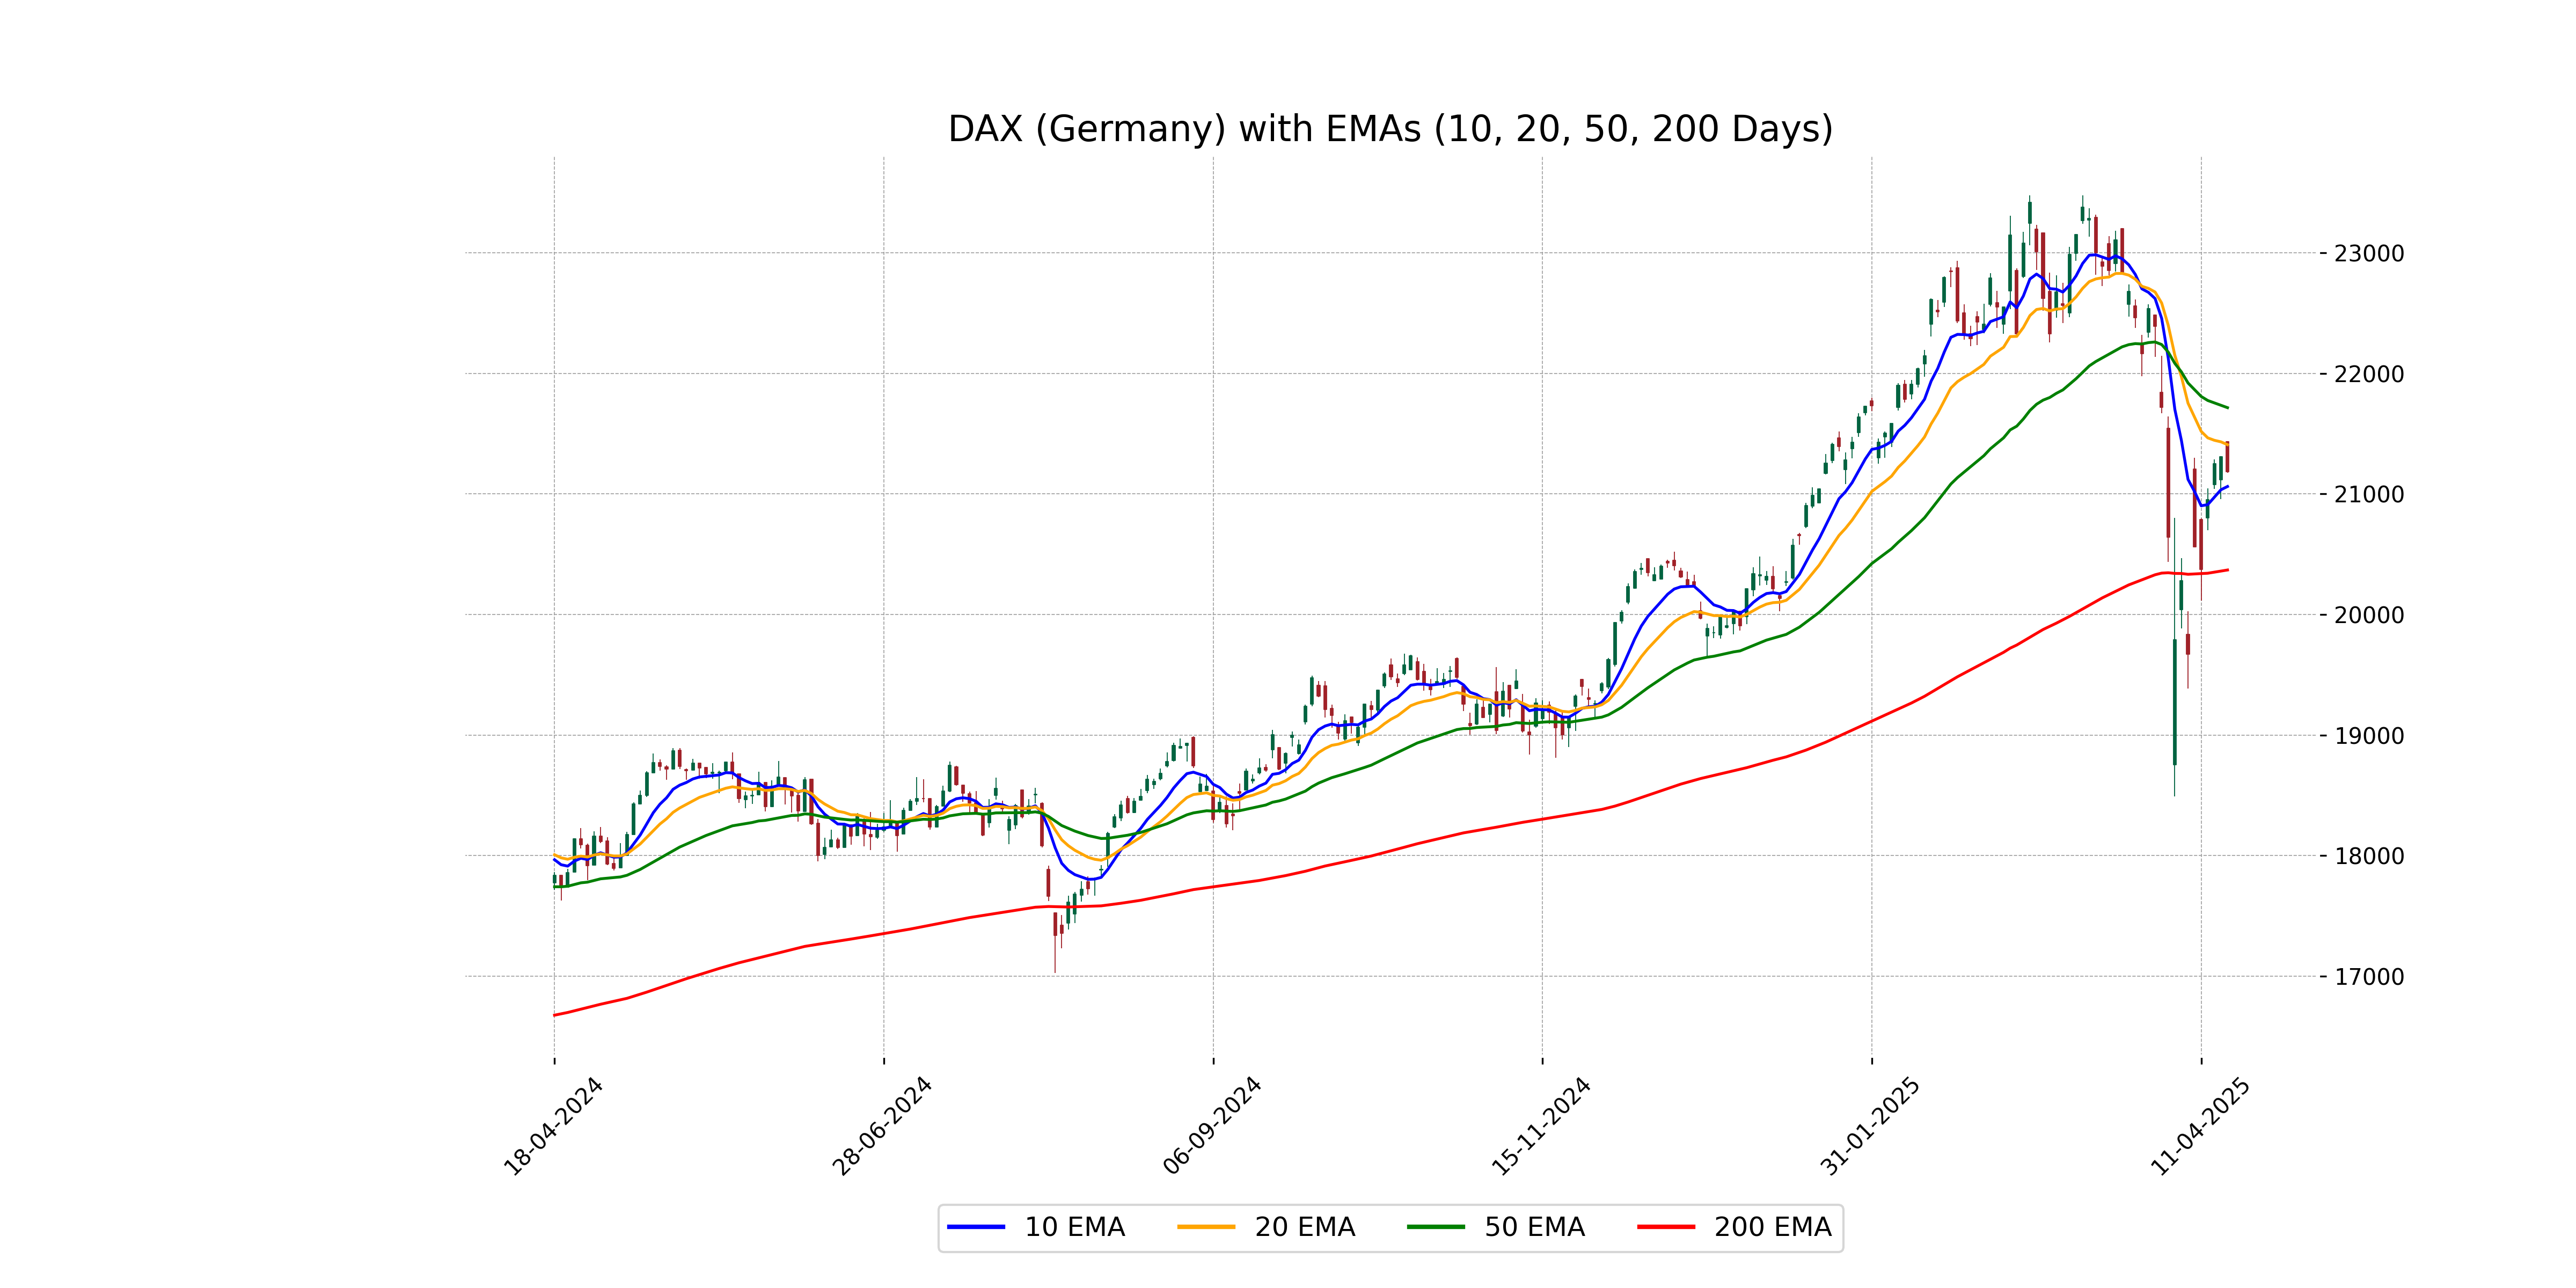
Relationship with Key Moving Averages
The closing price of DAX (Germany) at 21184.76 is below the 50-day EMA of 21716.12, indicating a bearish trend. However, it is trading above the 200-day EMA of 20369.54, which suggests longer-term support. The 10-day EMA at 21062.45 shows recent price activity slightly below the current close.
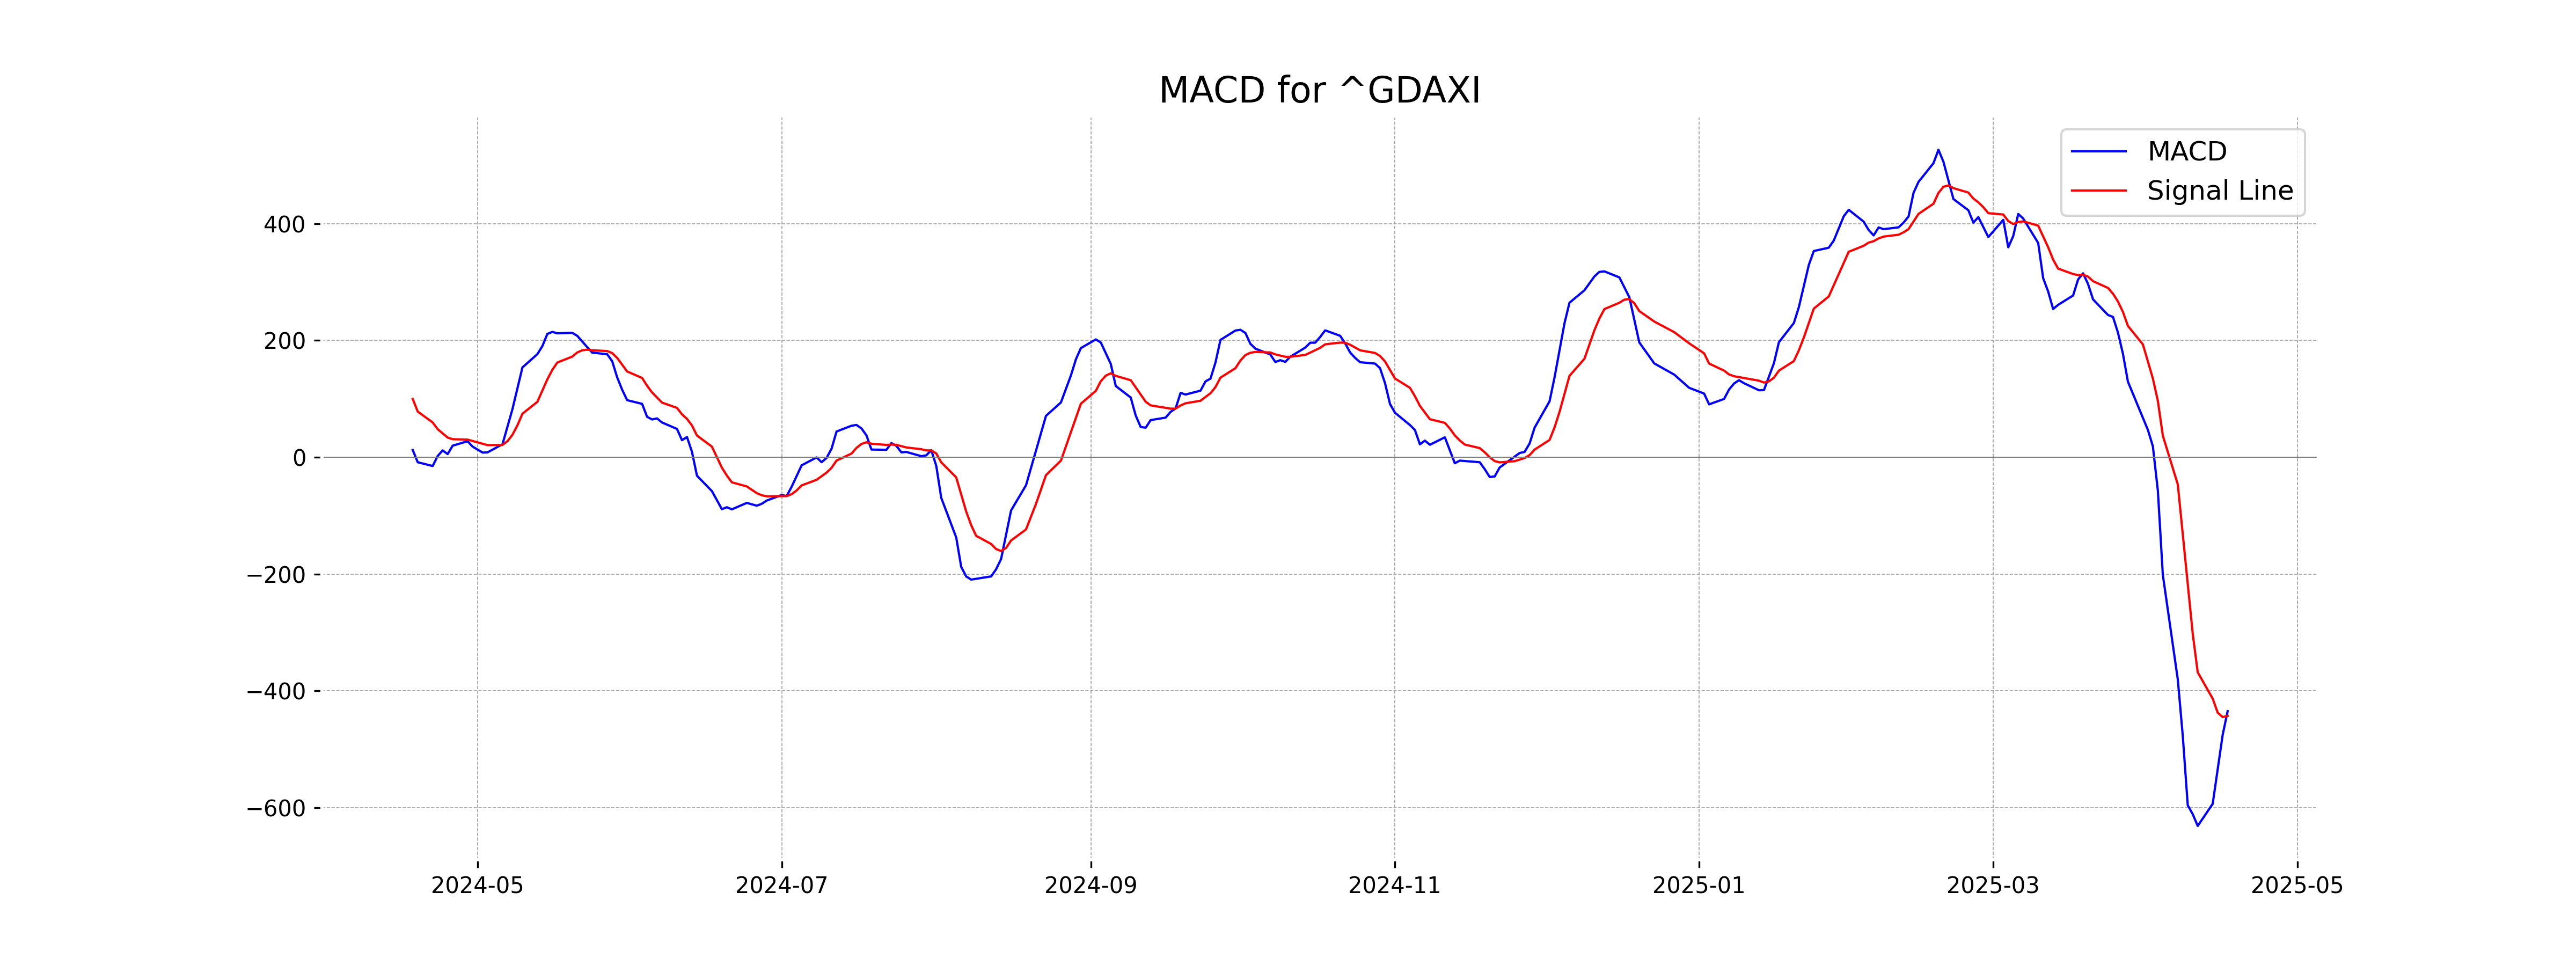
Moving Averages Trend (MACD)
The DAX (Germany) is showing a bearish signal as the MACD (-434.94) is below the MACD Signal line (-443.07). This indicates a potential continuation of the downward trend.
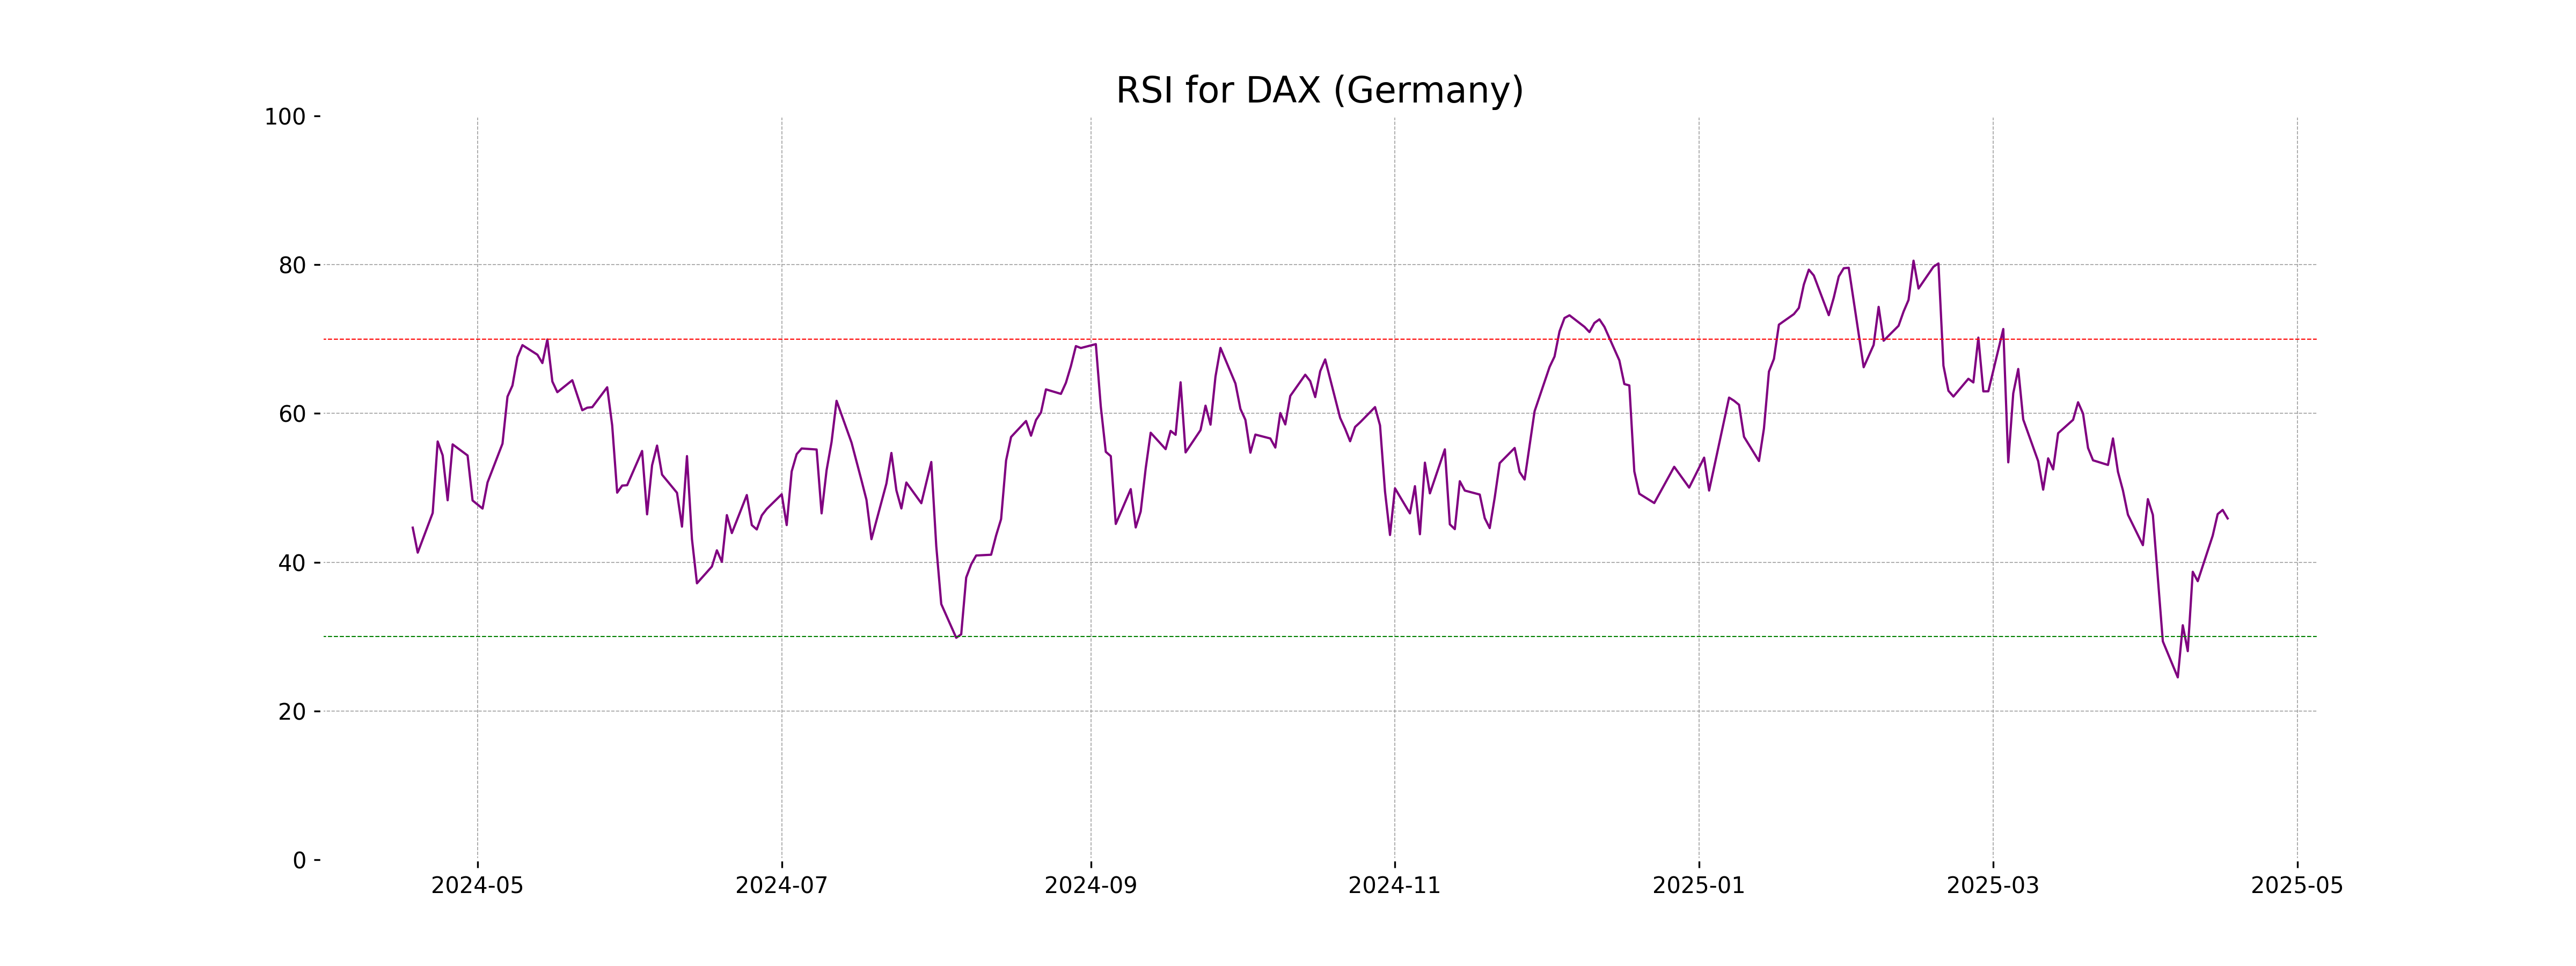
RSI Analysis
The current RSI for the DAX (Germany) is 45.89, indicating a neutral to slightly oversold status. RSI values typically range from 0 to 100, with values below 30 considered oversold and above 70 considered overbought. The index is not in an extreme RSI zone, suggesting there may not be a strong trend direction currently.
Analysis for S&P 500 (US) - April 17, 2025
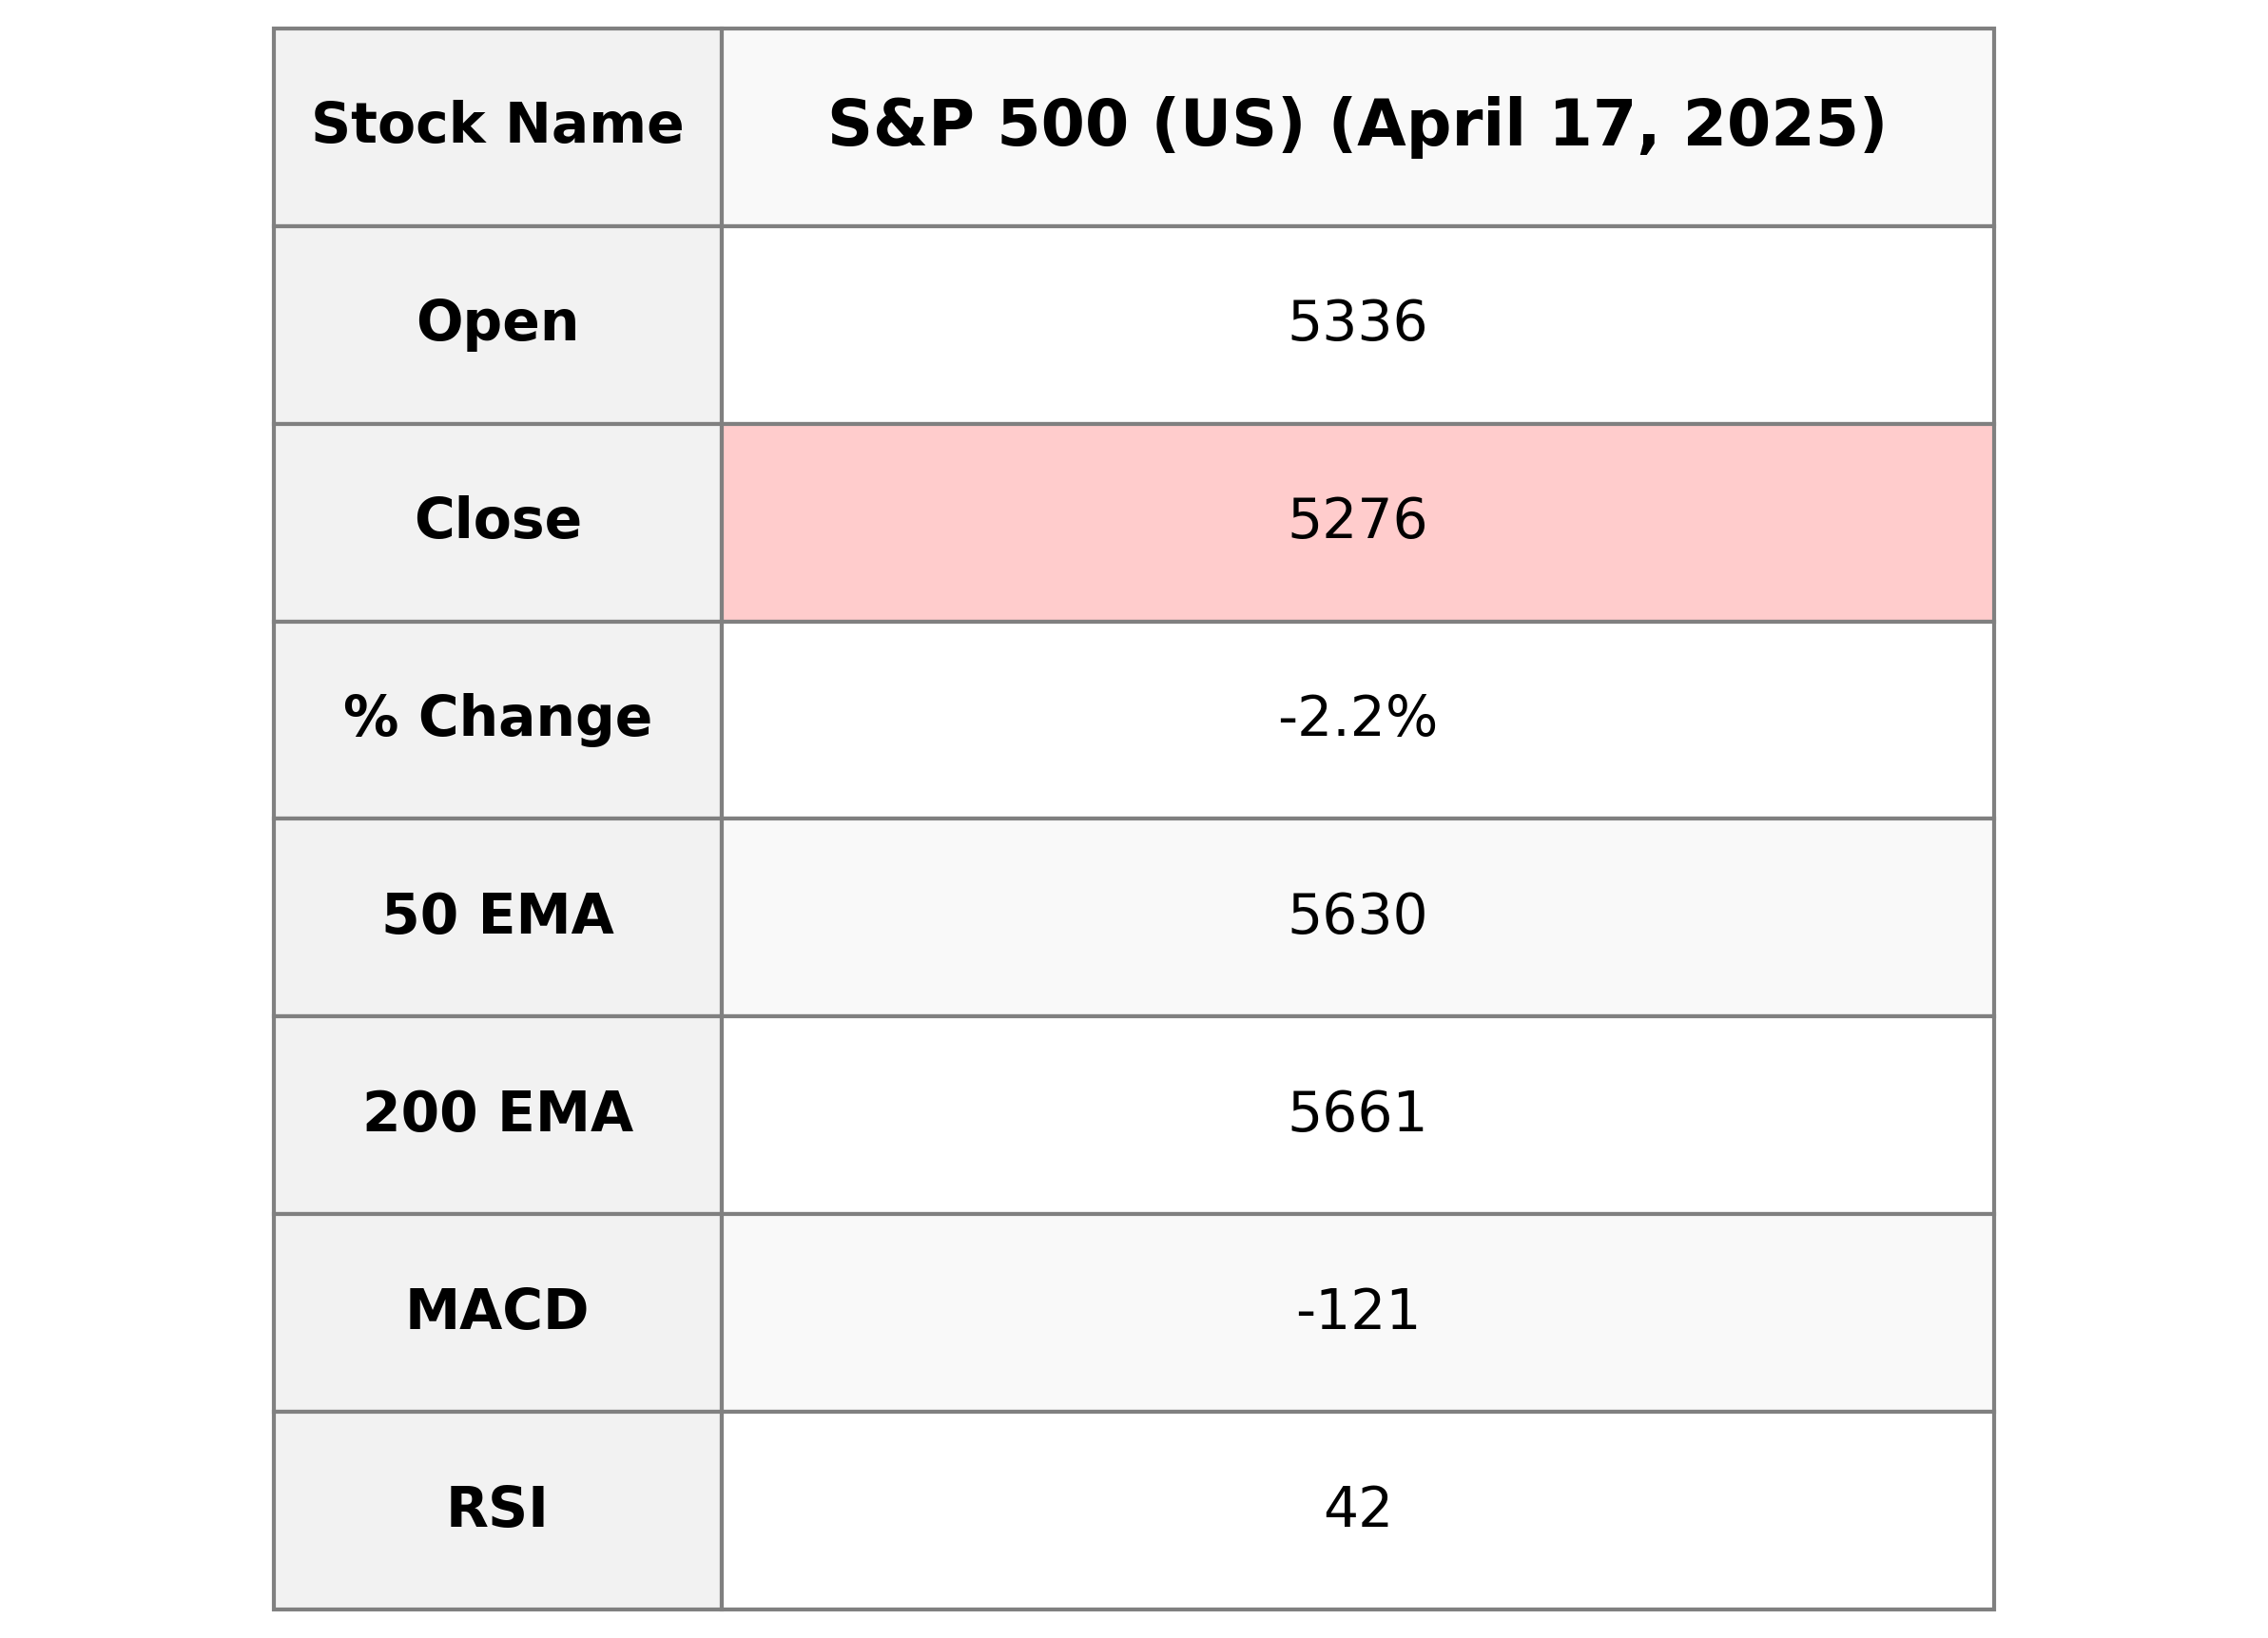
S&P 500 (US) opened at 5335.75 and closed at 5275.70, indicating a decline of approximately 2.24%, with a points change of -120.93. The index's movement is below its 50-day and 200-day EMAs, while the RSI stands at 41.62, suggesting a bearish trend.
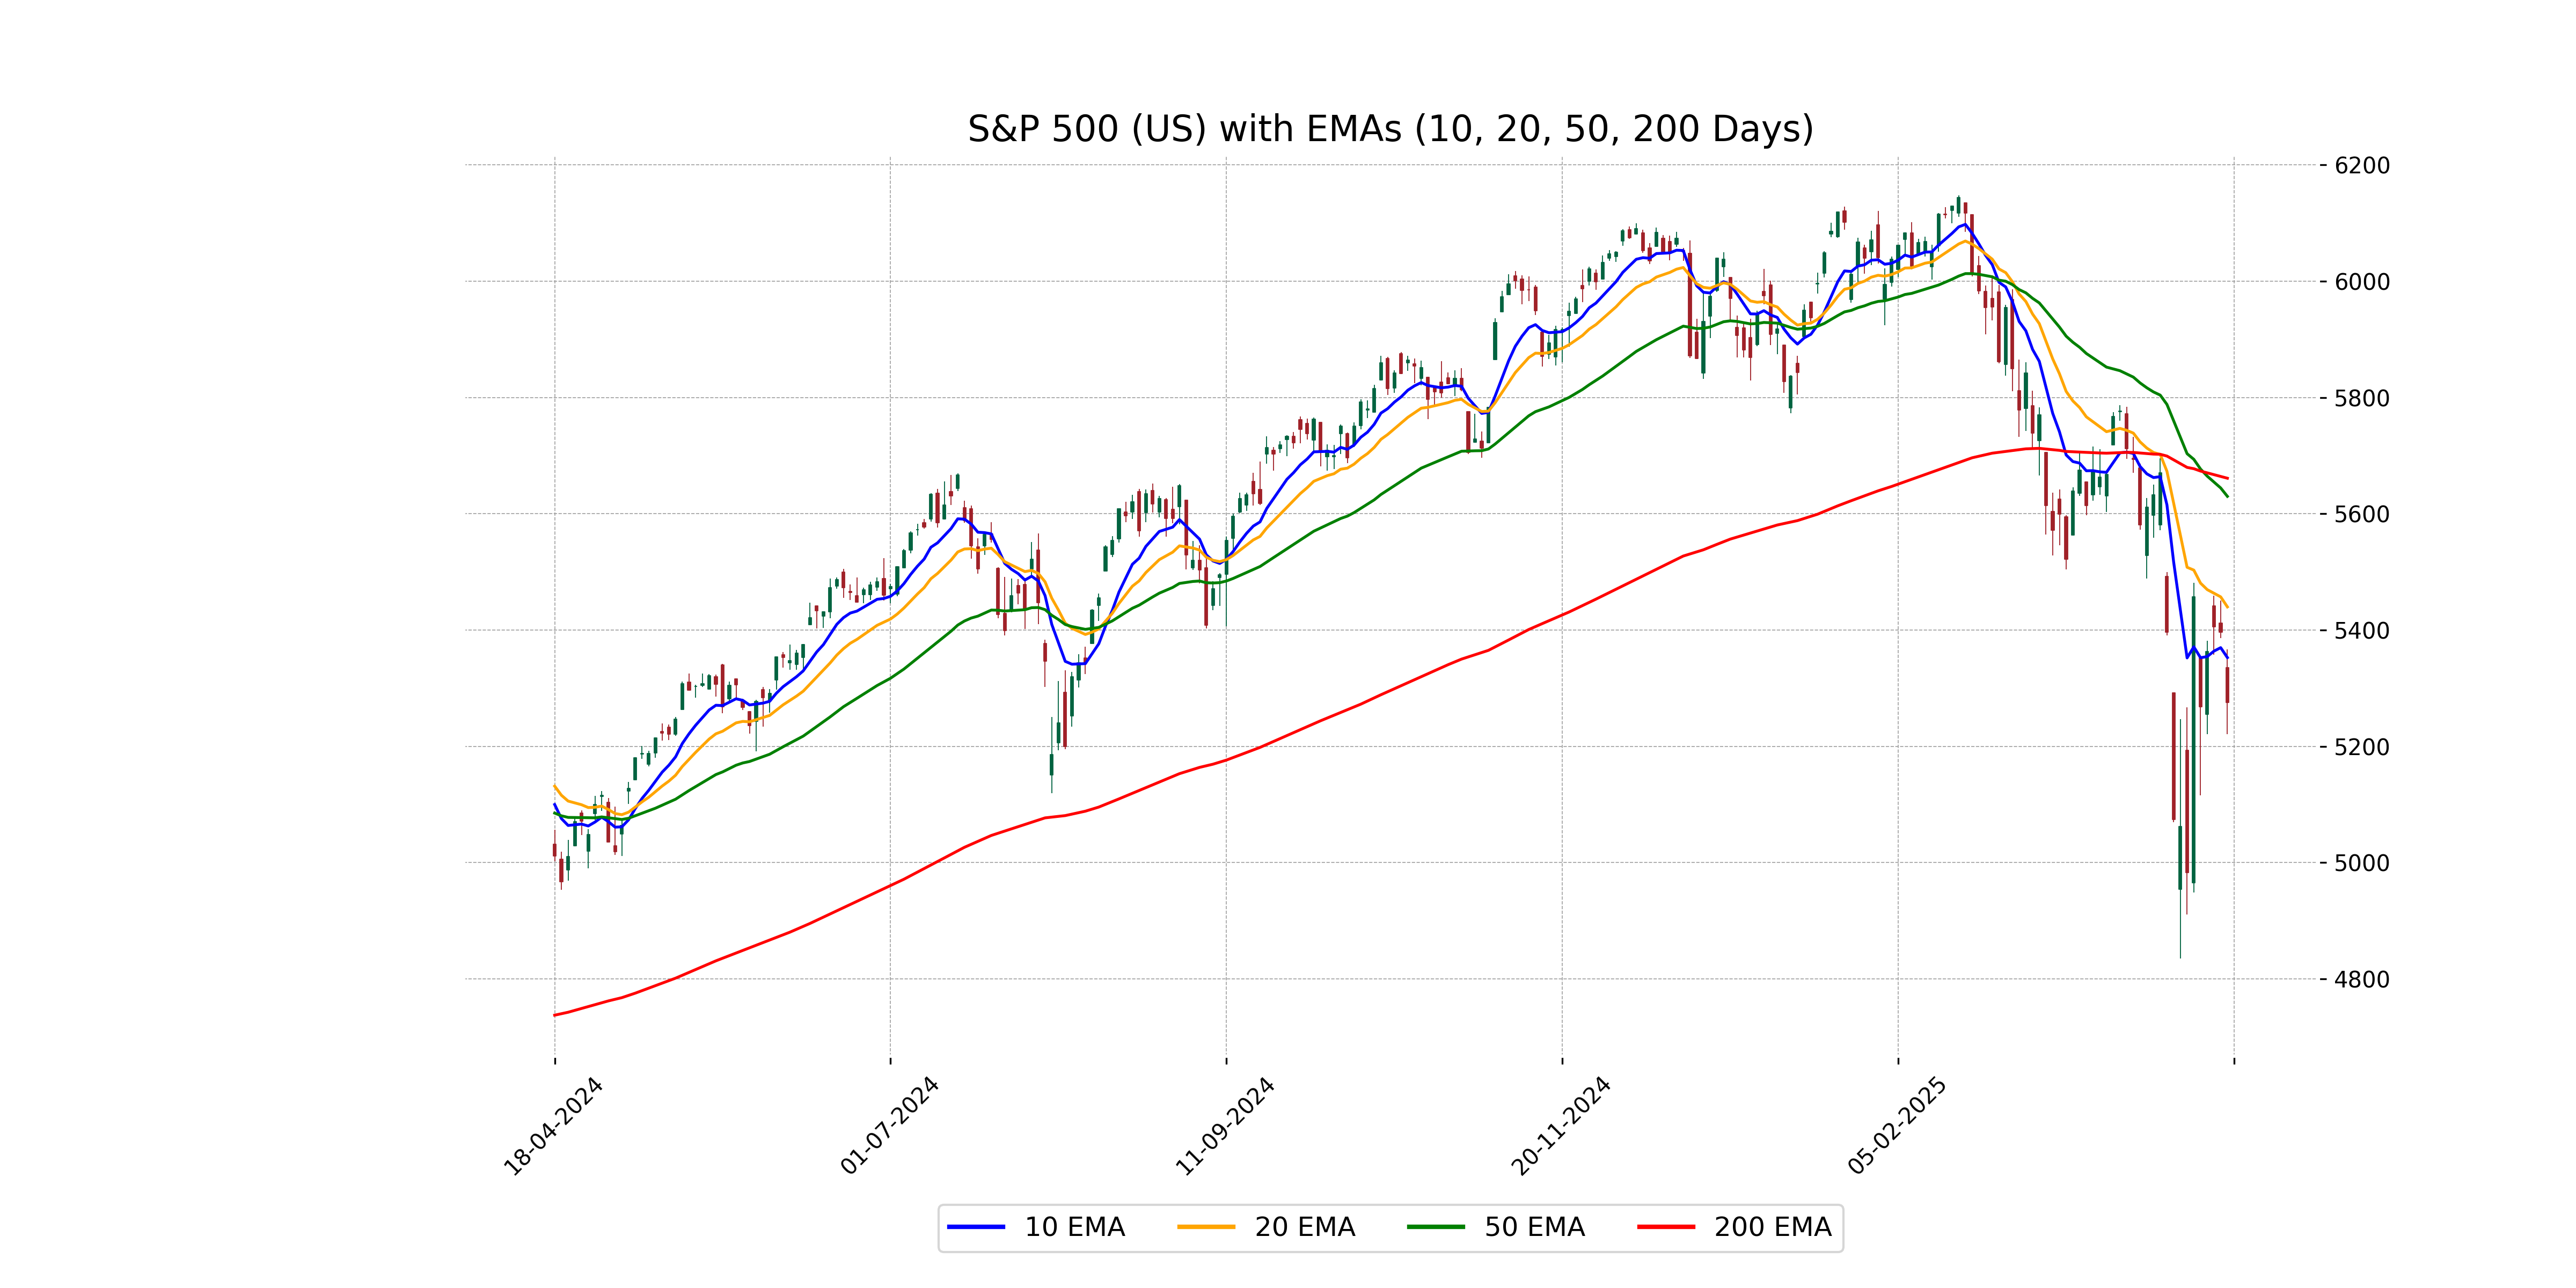
Relationship with Key Moving Averages
The S&P 500 is trading below its key moving averages, with the current closing price of 5275.70 below the 10 EMA of 5352.66, 50 EMA of 5629.99, and 200 EMA of 5661.19. This suggests a bearish trend in the market based on these technical indicators.
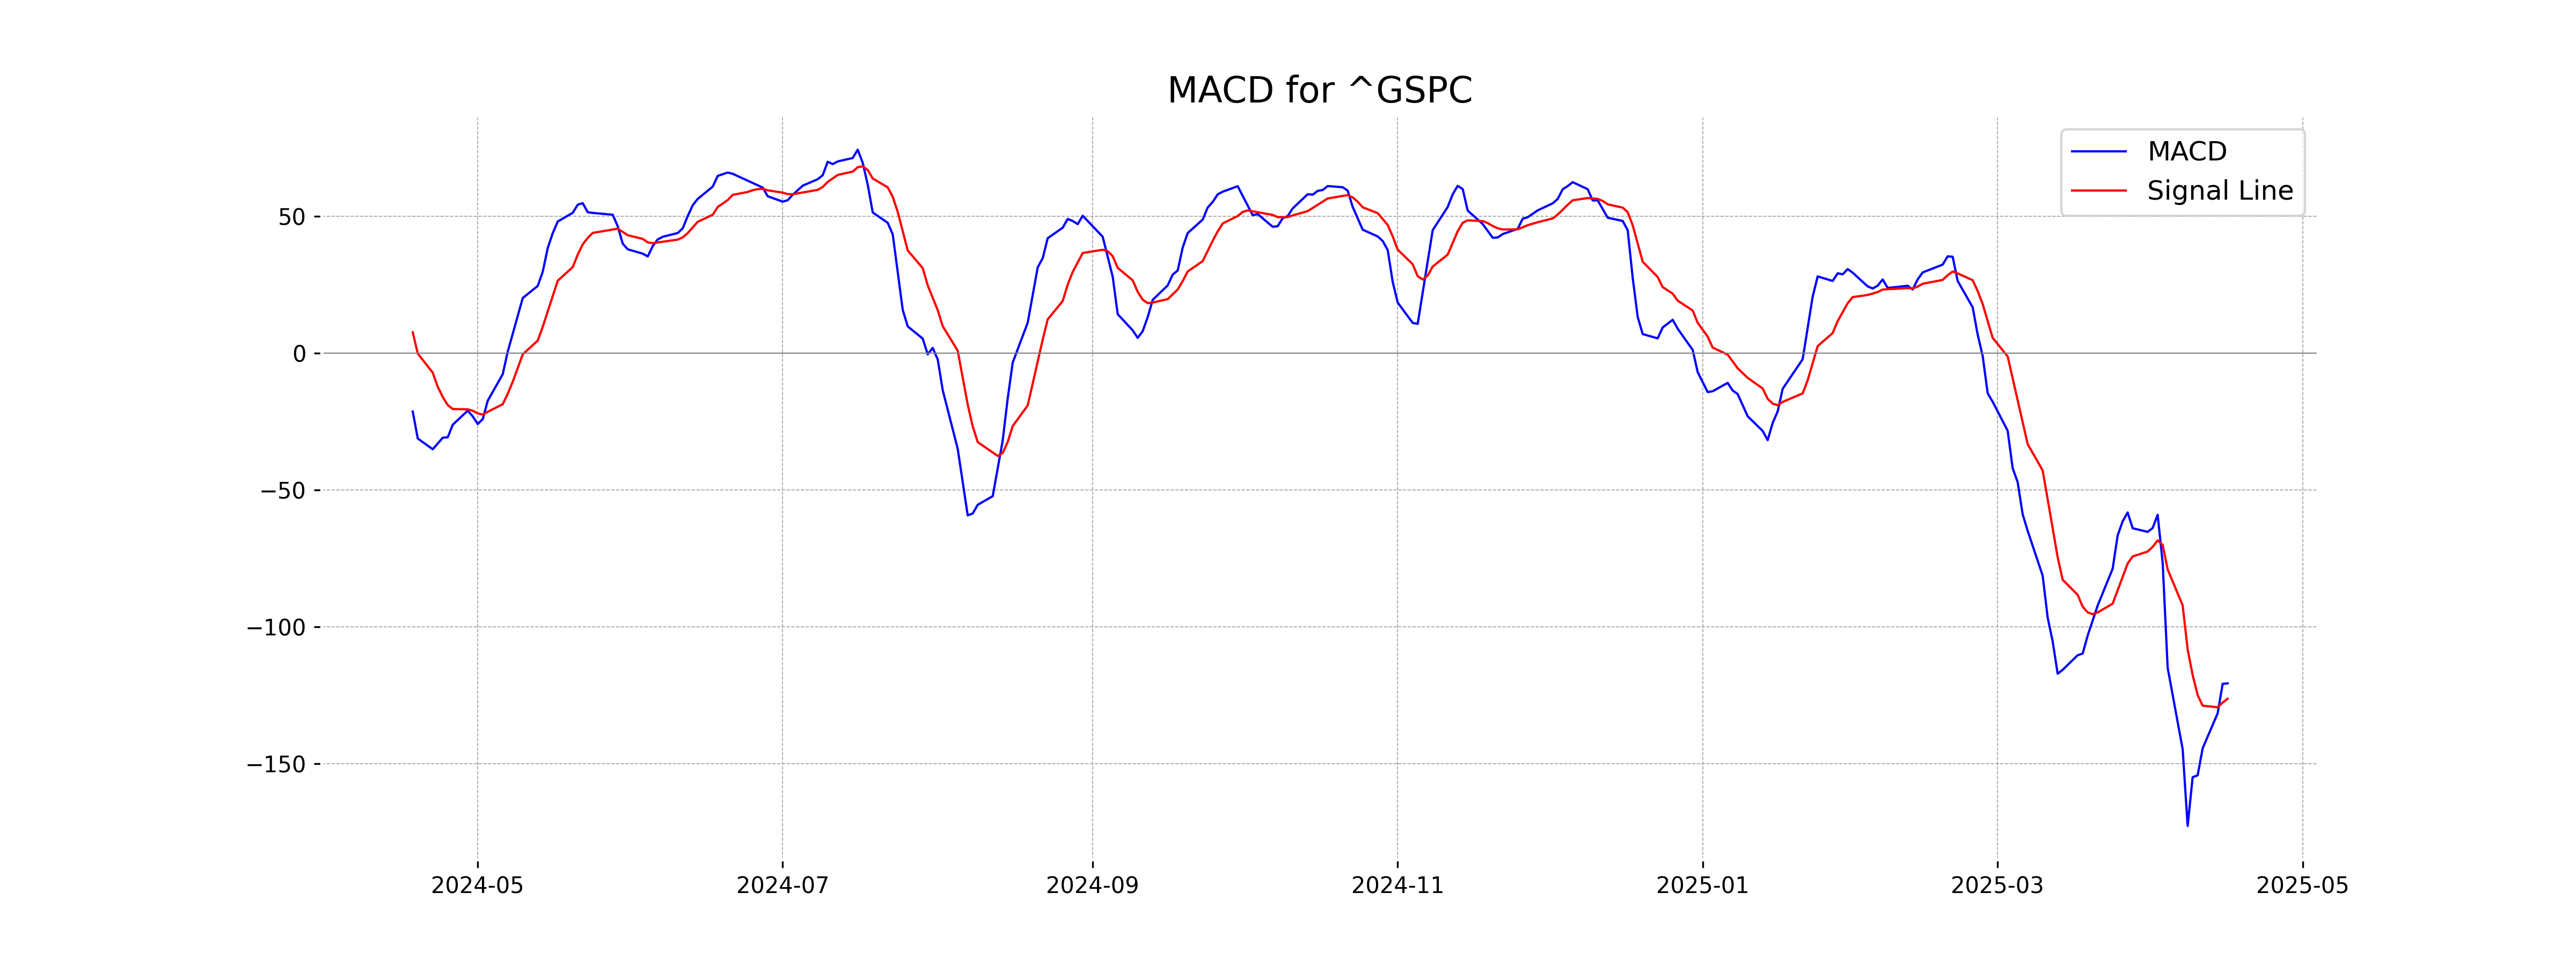
Moving Averages Trend (MACD)
The MACD value of -120.70, along with a MACD Signal of -126.32, suggests a bearish momentum for the S&P 500, as the MACD line is above the signal line. Both values being negative further reinforce the bearish trend.
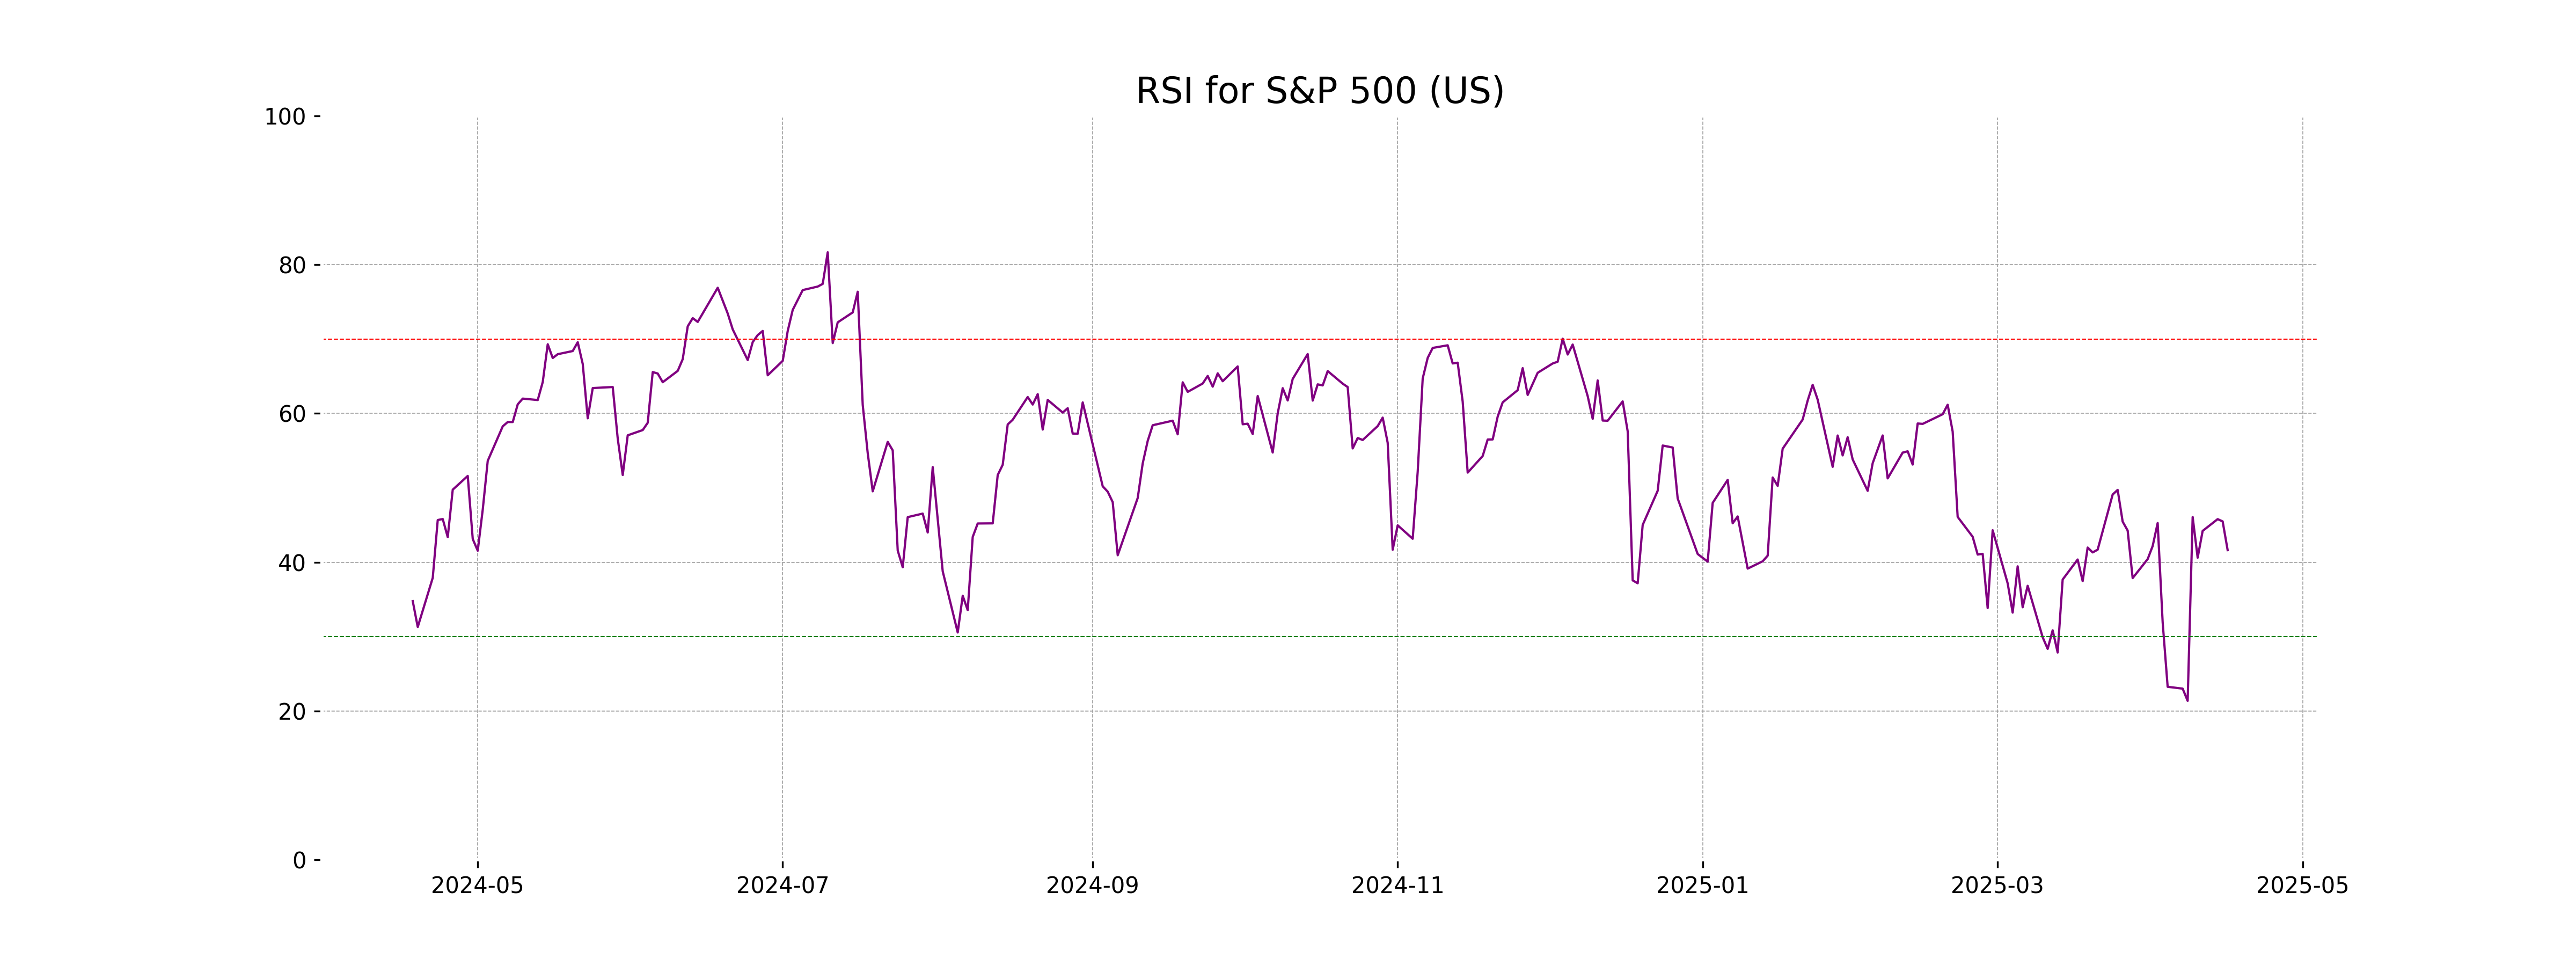
RSI Analysis
The RSI value for S&P 500 is 41.62, indicating that the index is close to the oversold territory. This suggests that there may be a potential buying opportunity if the RSI falls further, though caution should be exercised as other market conditions are taken into consideration.
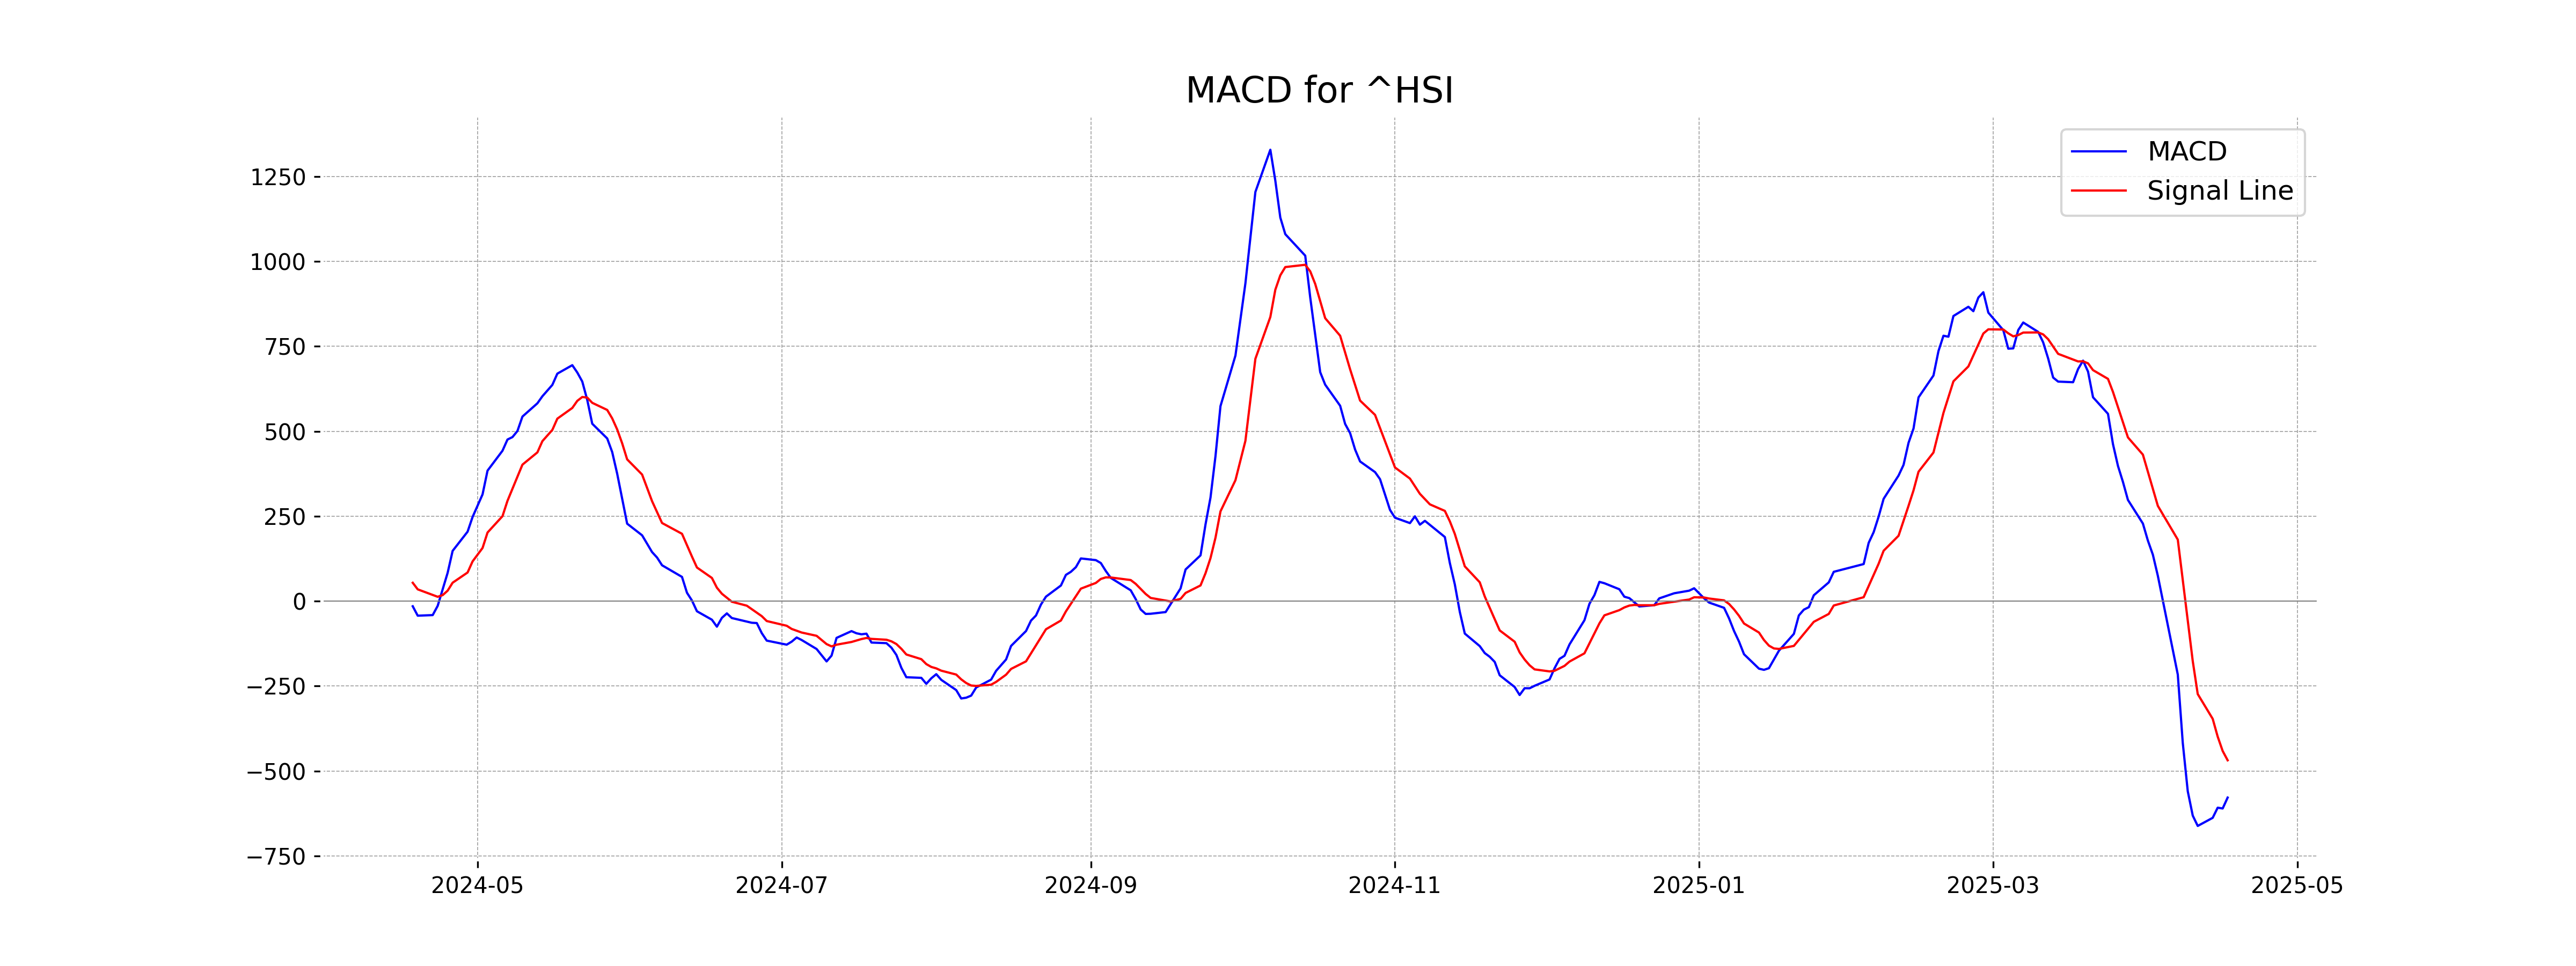
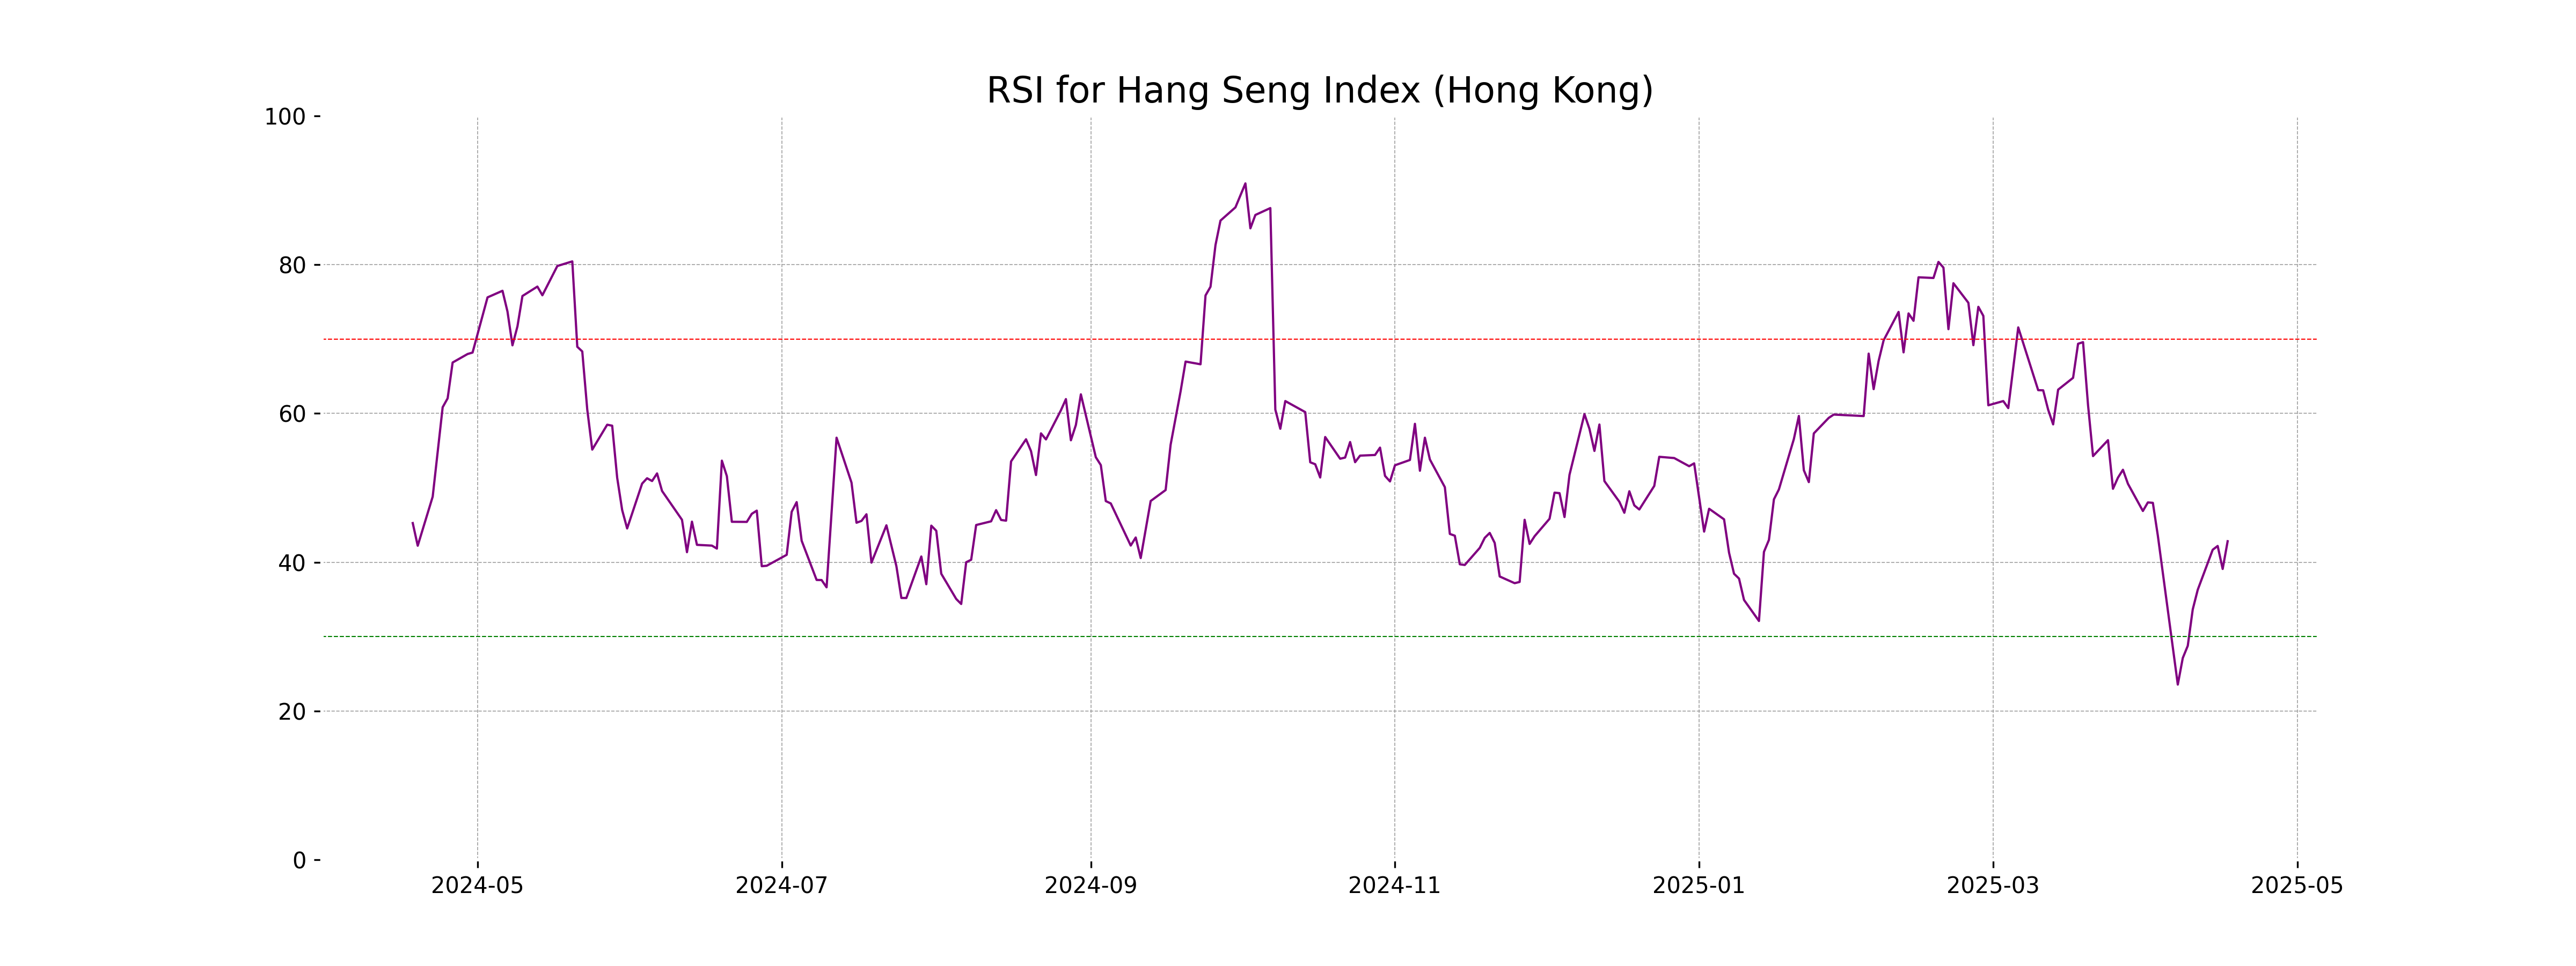
Analysis for Hang Seng Index (Hong Kong) - April 17, 2025

The Hang Seng Index (Hong Kong) closed at 21,395.14, reflecting a positive change of 1.61% from the previous close of 21,056.98, with a points increase of 338.16. The index experienced a high of 21,417.64 and a low of 21,039.16 during the trading session, with an RSI of 42.82, indicating the market's current momentum. The MACD stands at -578.41, suggesting bearish momentum as it is below the signal line of -468.66.
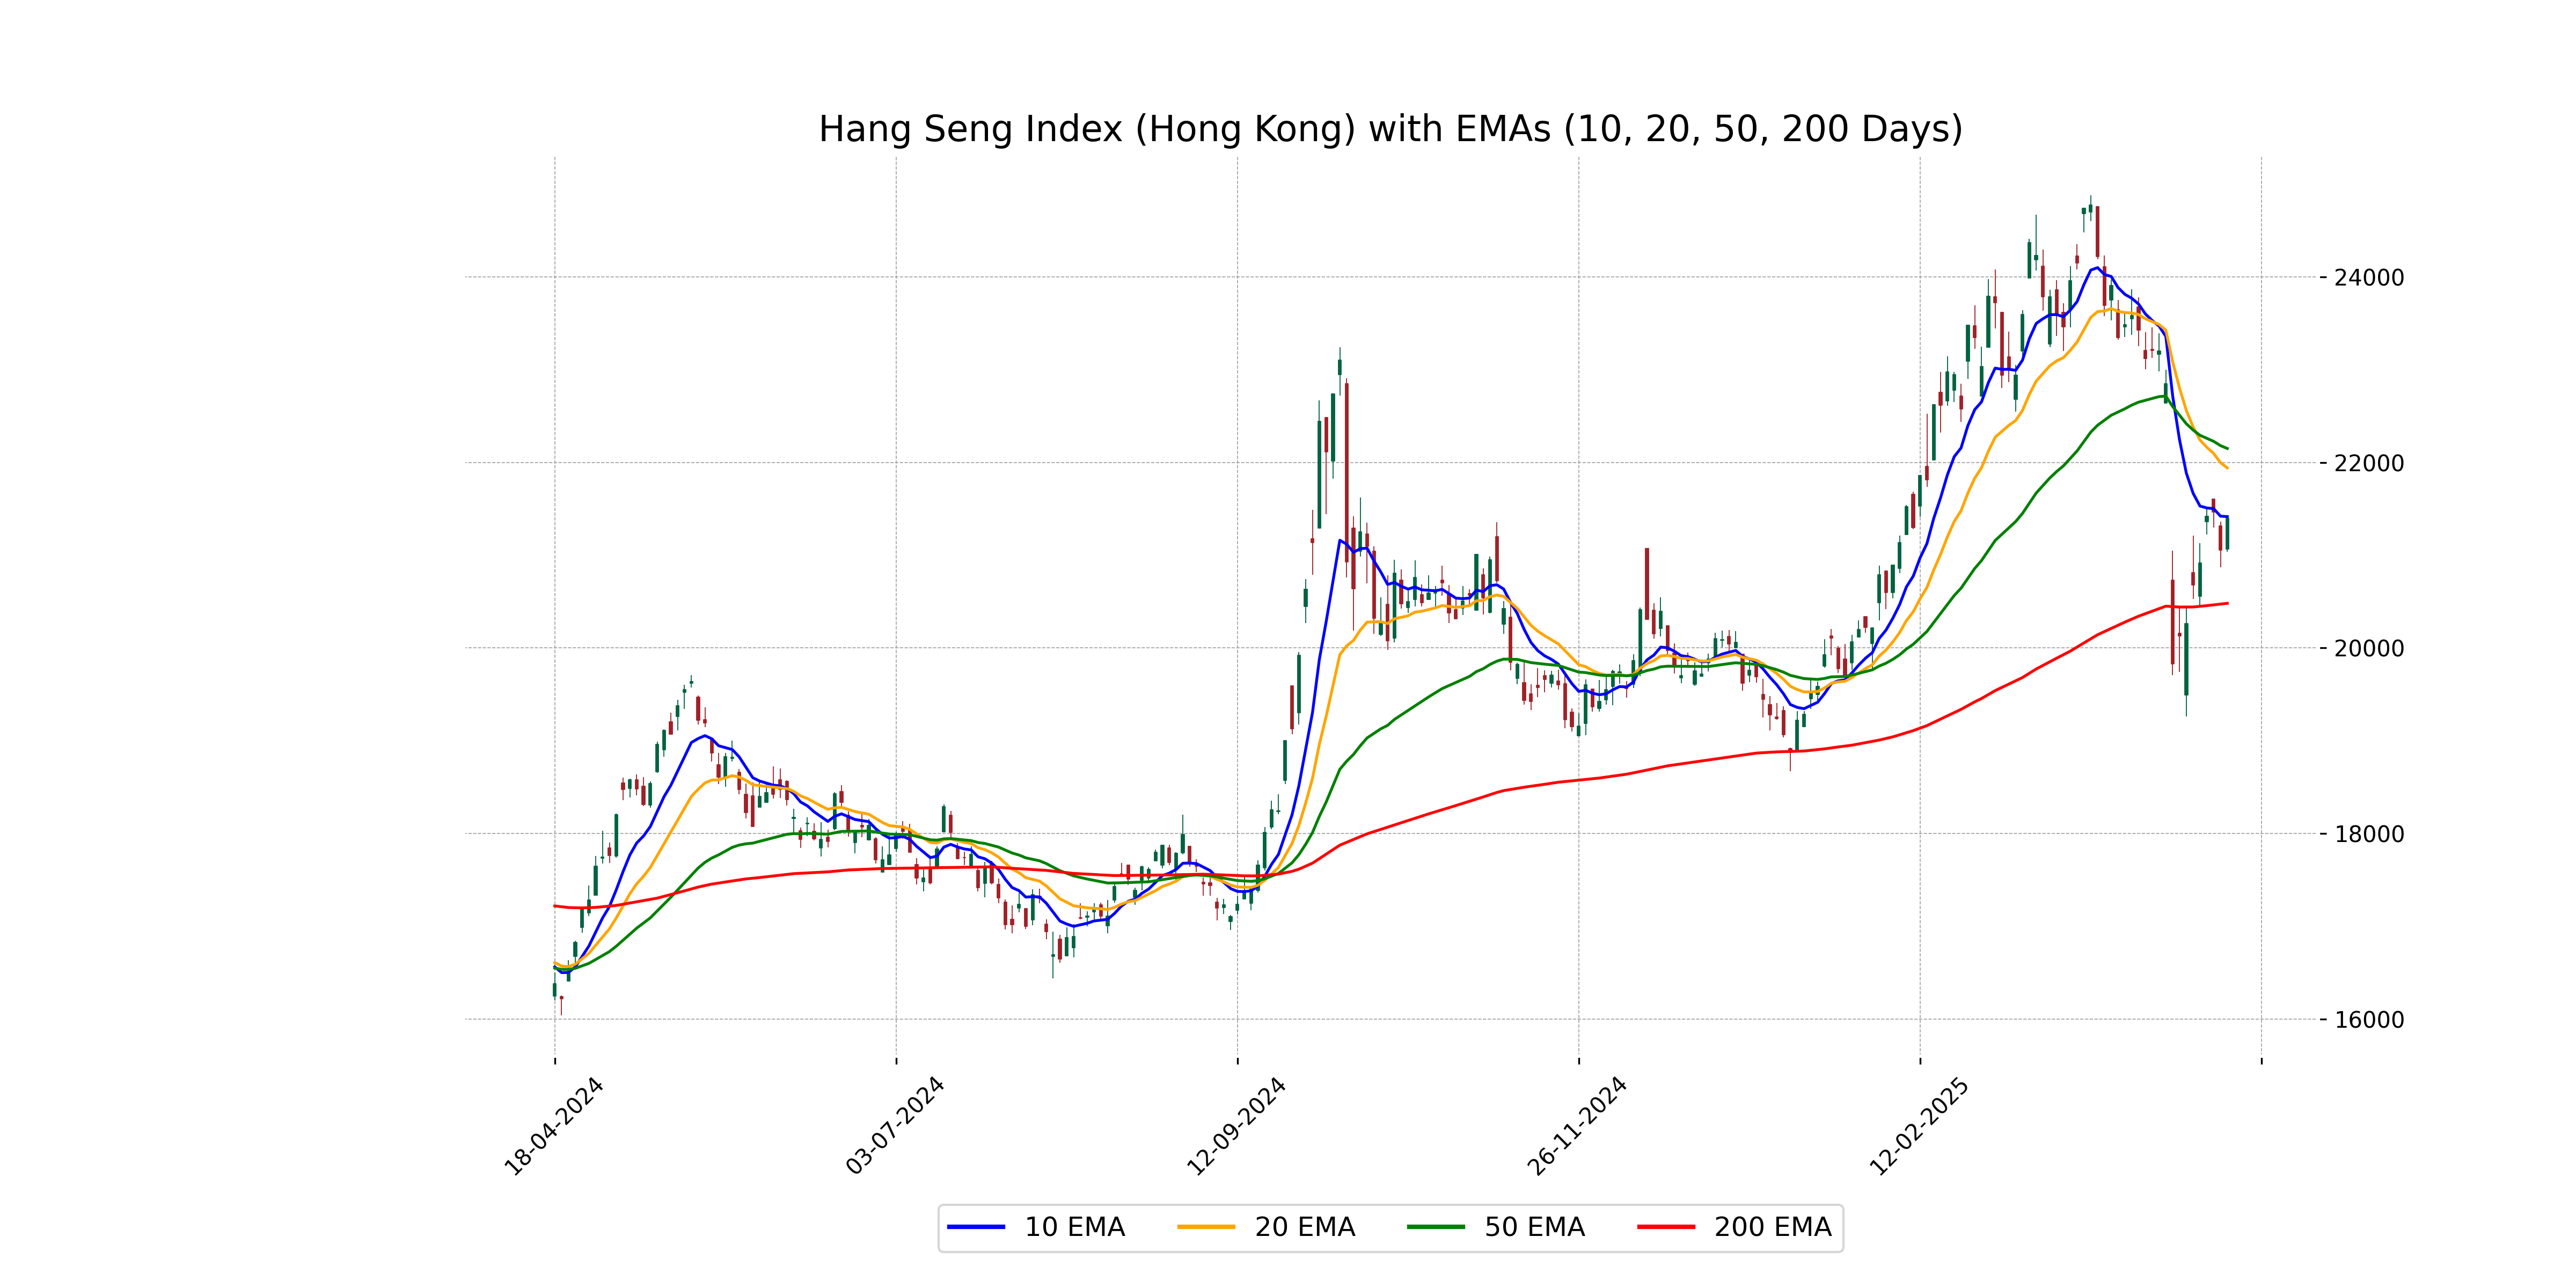
Relationship with Key Moving Averages
The Hang Seng Index is trading below its 50-day and 20-day EMAs, indicating a potential bearish trend, while it is slightly above the 200-day EMA, suggesting some long-term support. The 10-day EMA is close to the current closing value, showing near-term alignment.
Moving Averages Trend (MACD)
Based on the stock data for Hang Seng Index (Hong Kong), the MACD value of -578.41 is below the MACD Signal of -468.66, indicating a bearish trend. This suggests the momentum is currently negative, and the index may experience downward pressure in the short term.
RSI Analysis
RSI Analysis for Hang Seng Index (Hong Kong): The RSI currently stands at 42.82, indicating that the index is neither overbought nor oversold, but relatively close to the oversold territory. This suggests that the index might have more room for downside movement before it enters an overbought state.
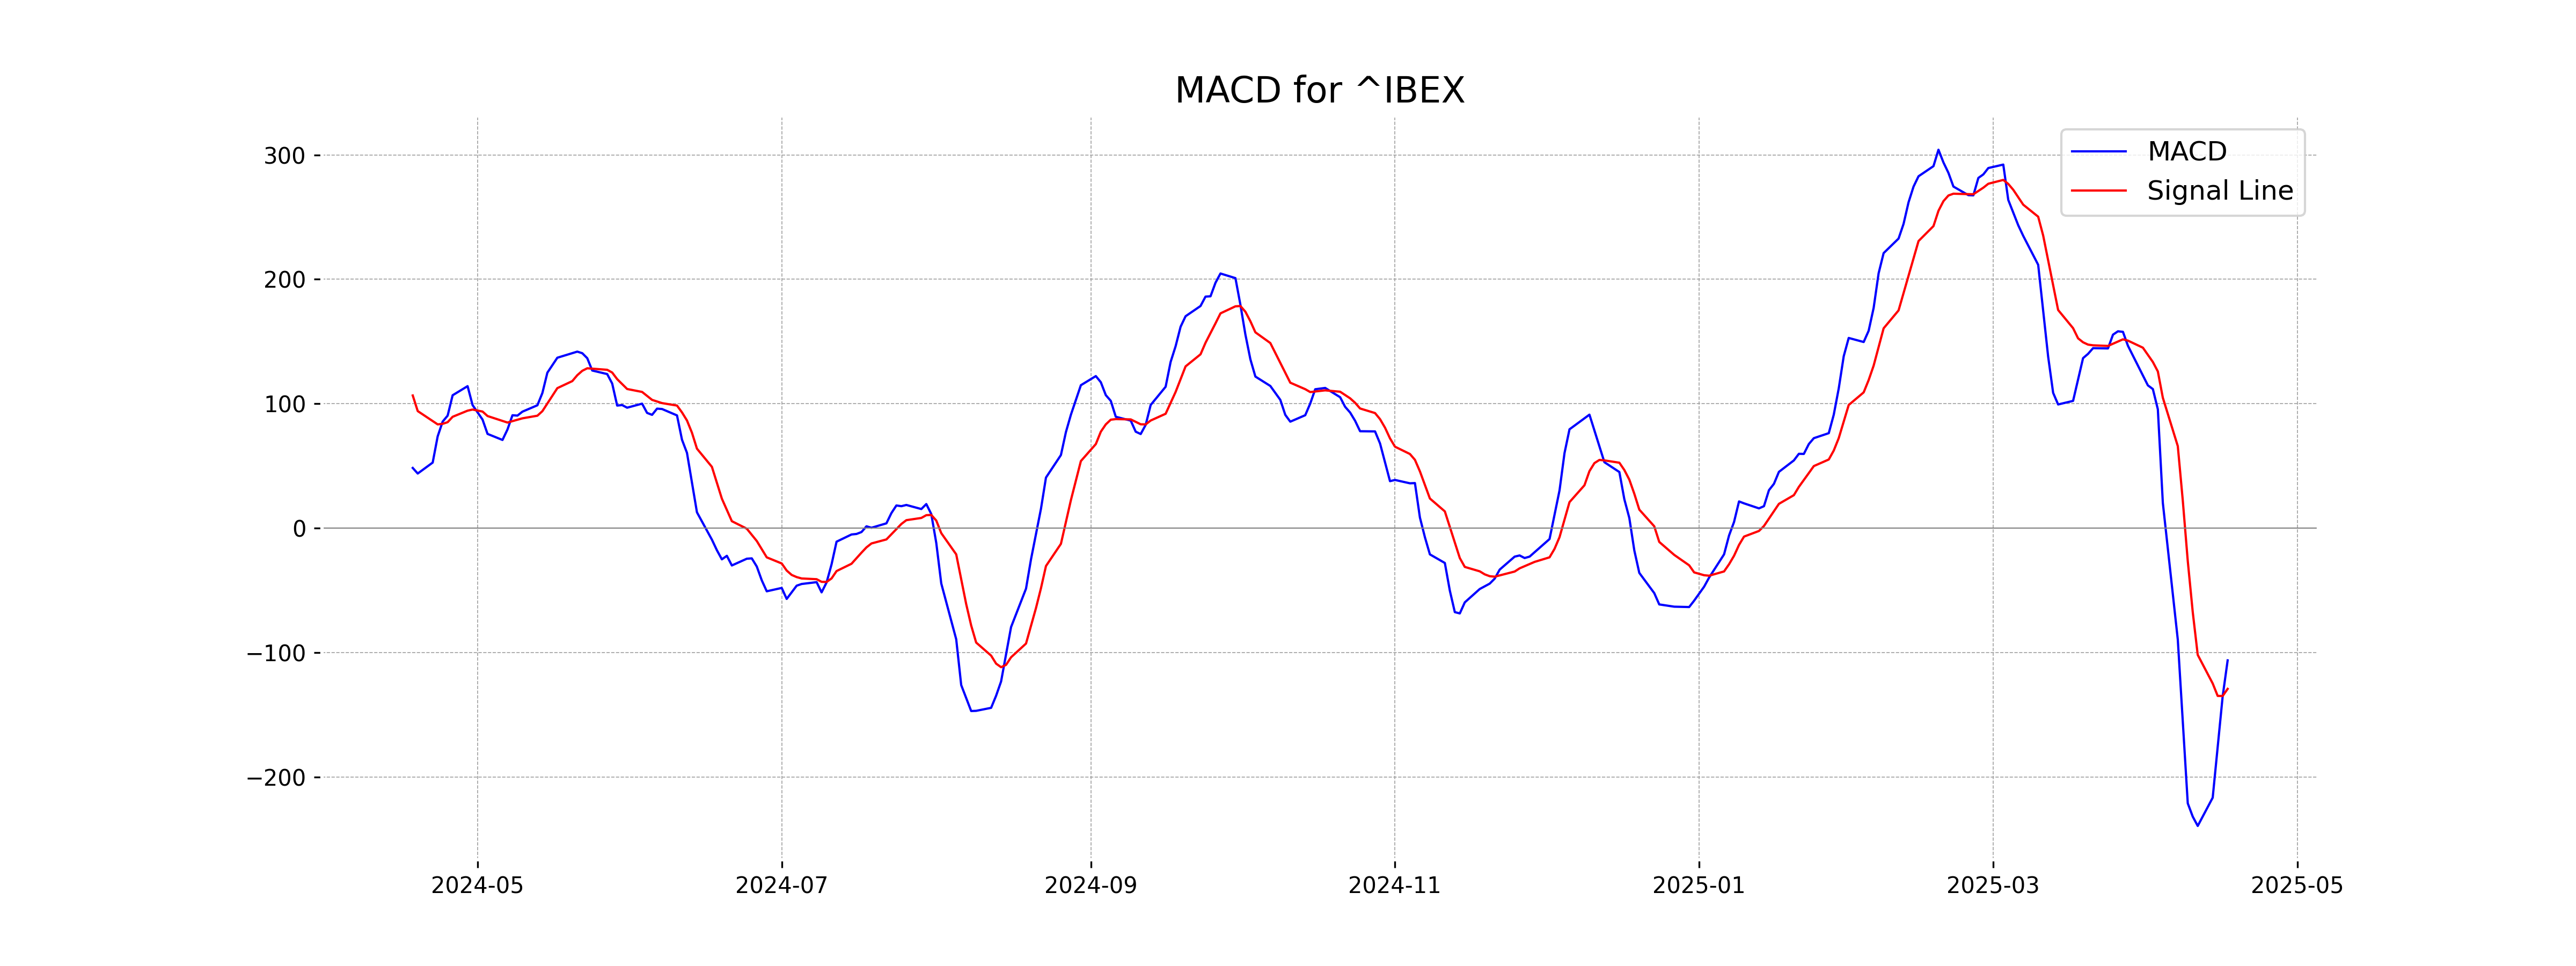
Analysis for IBEX 35 (Spain) - April 17, 2025
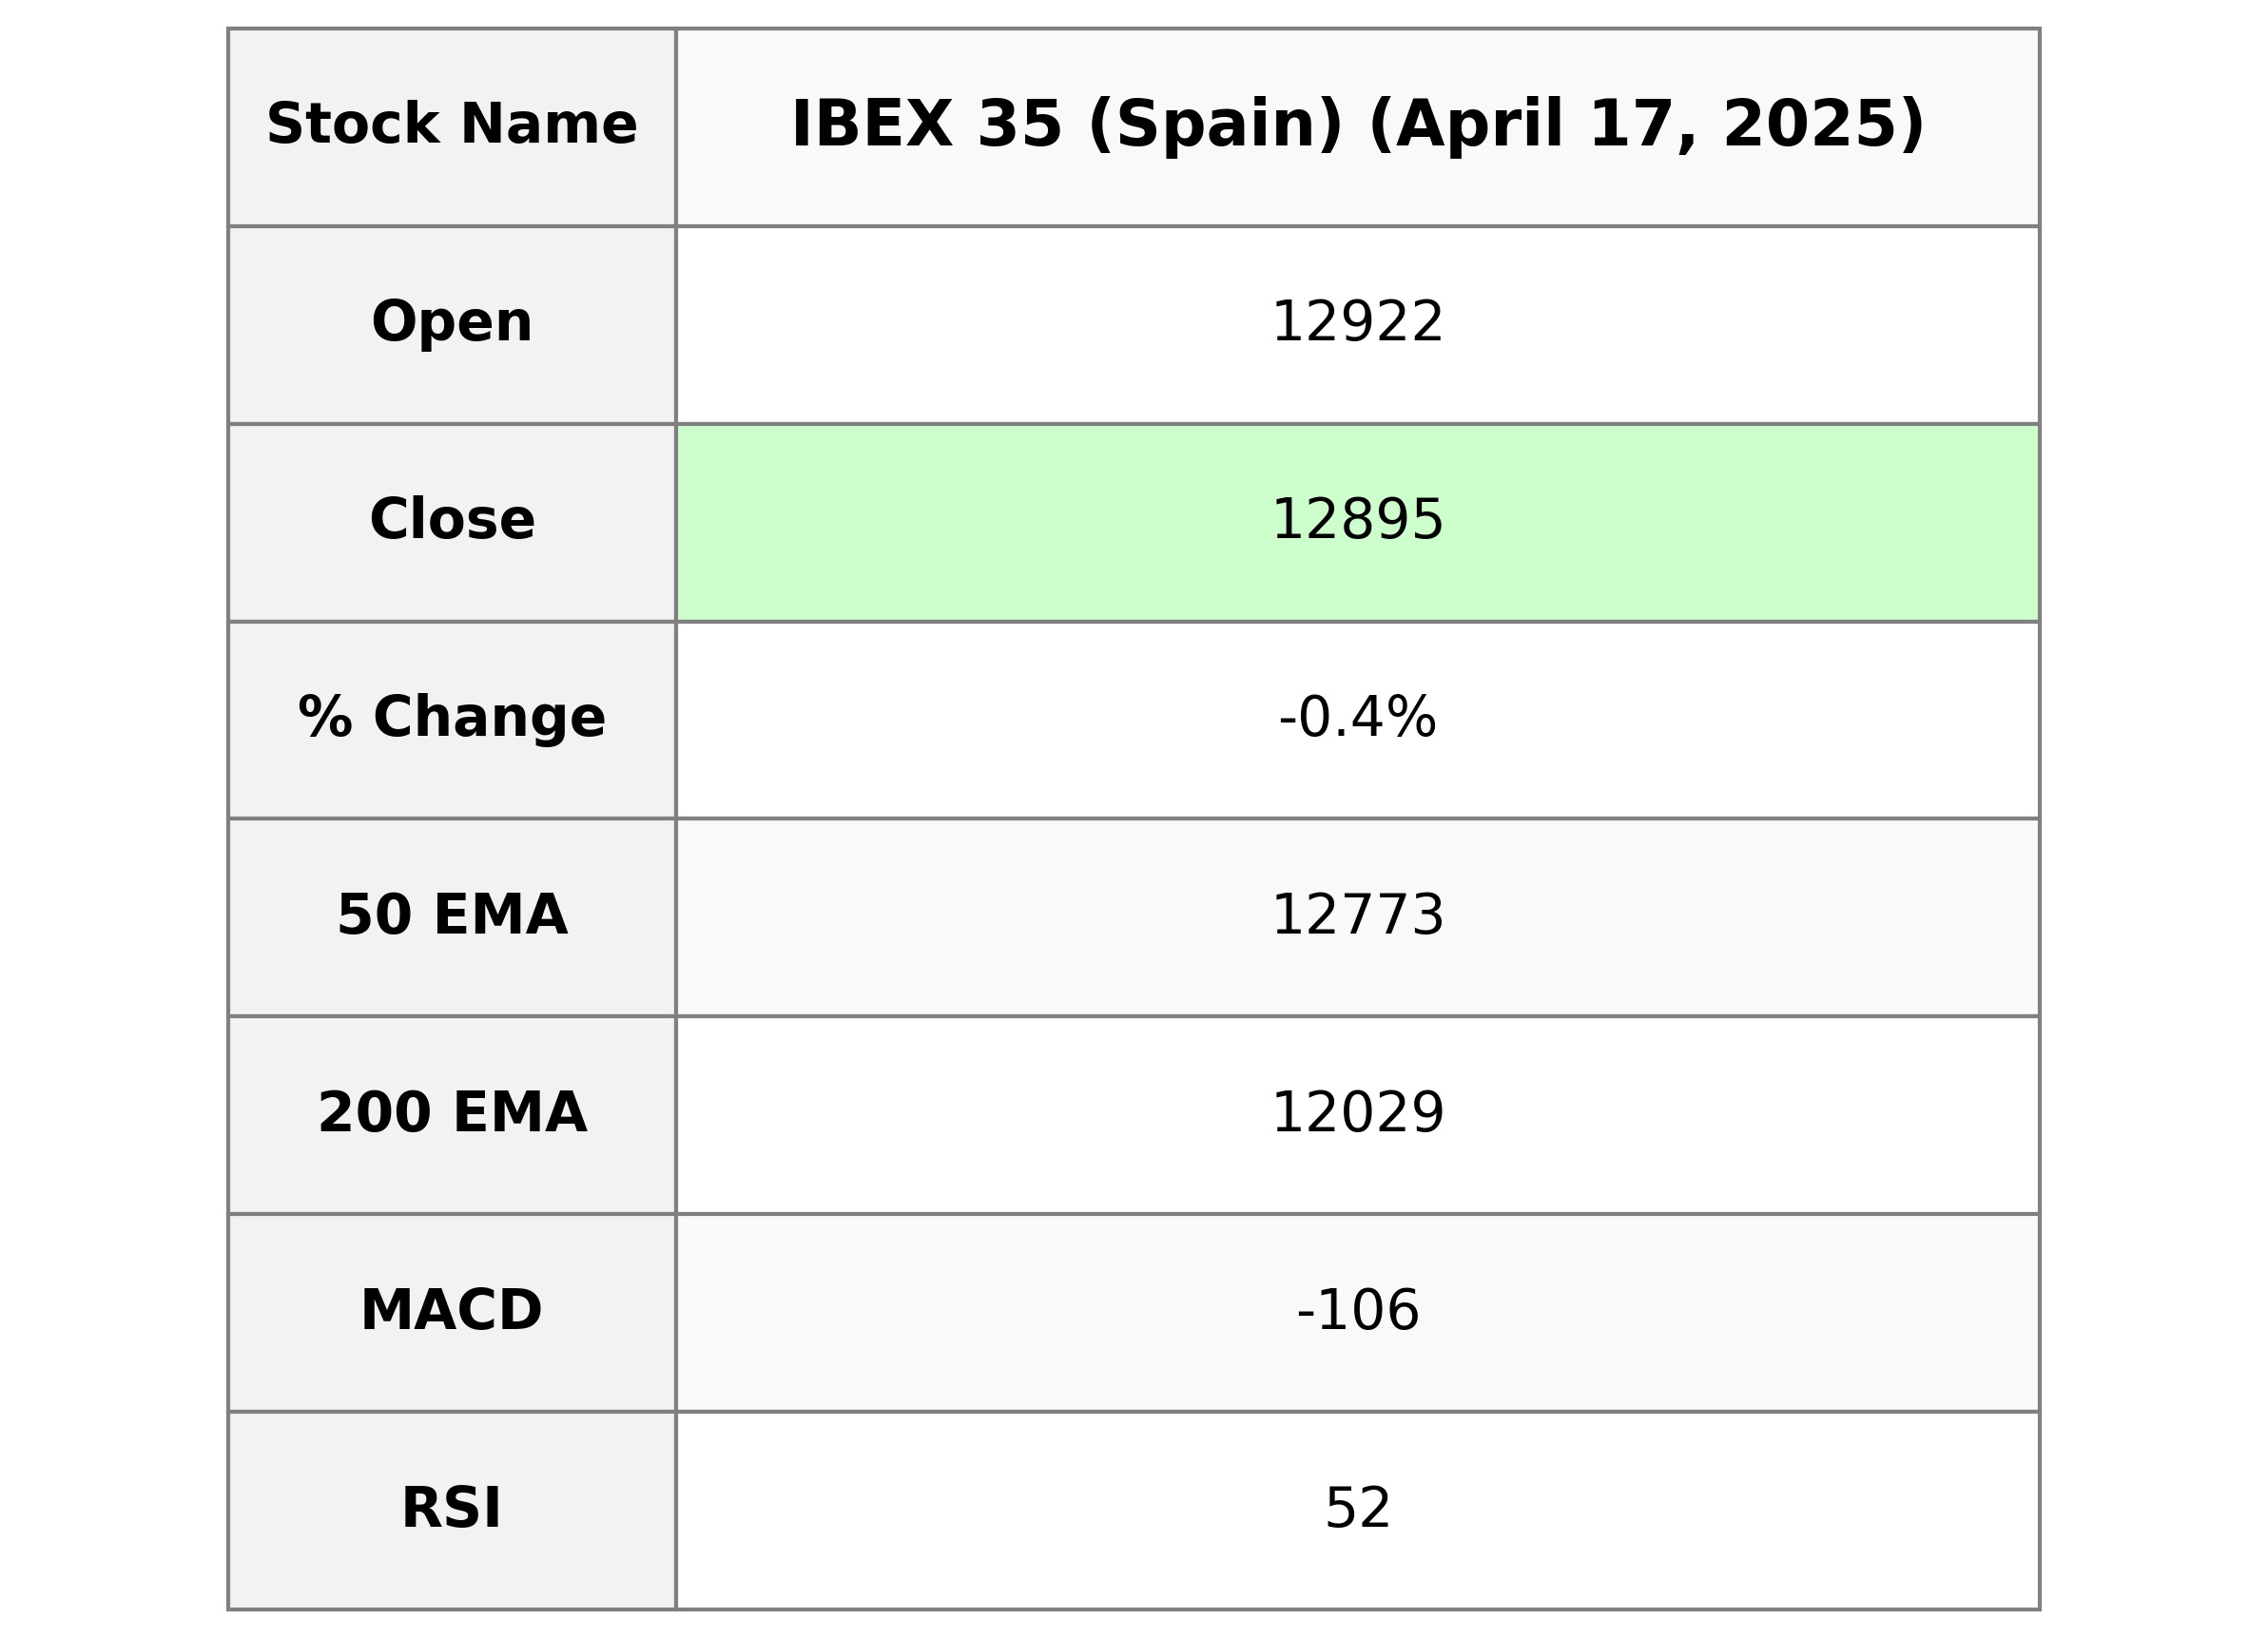
The IBEX 35 (Spain) opened at 12922.10 and closed slightly lower at 12895.20, marking a points change of -46.90 and a percent change of -0.36%. The trading volume was 31,704,944, while key averages showed the 50-day EMA at 12773.38 and the 200-day EMA at 12028.68, suggesting a short-term market stability but with recent momentum reflected by a MACD of -106.31.
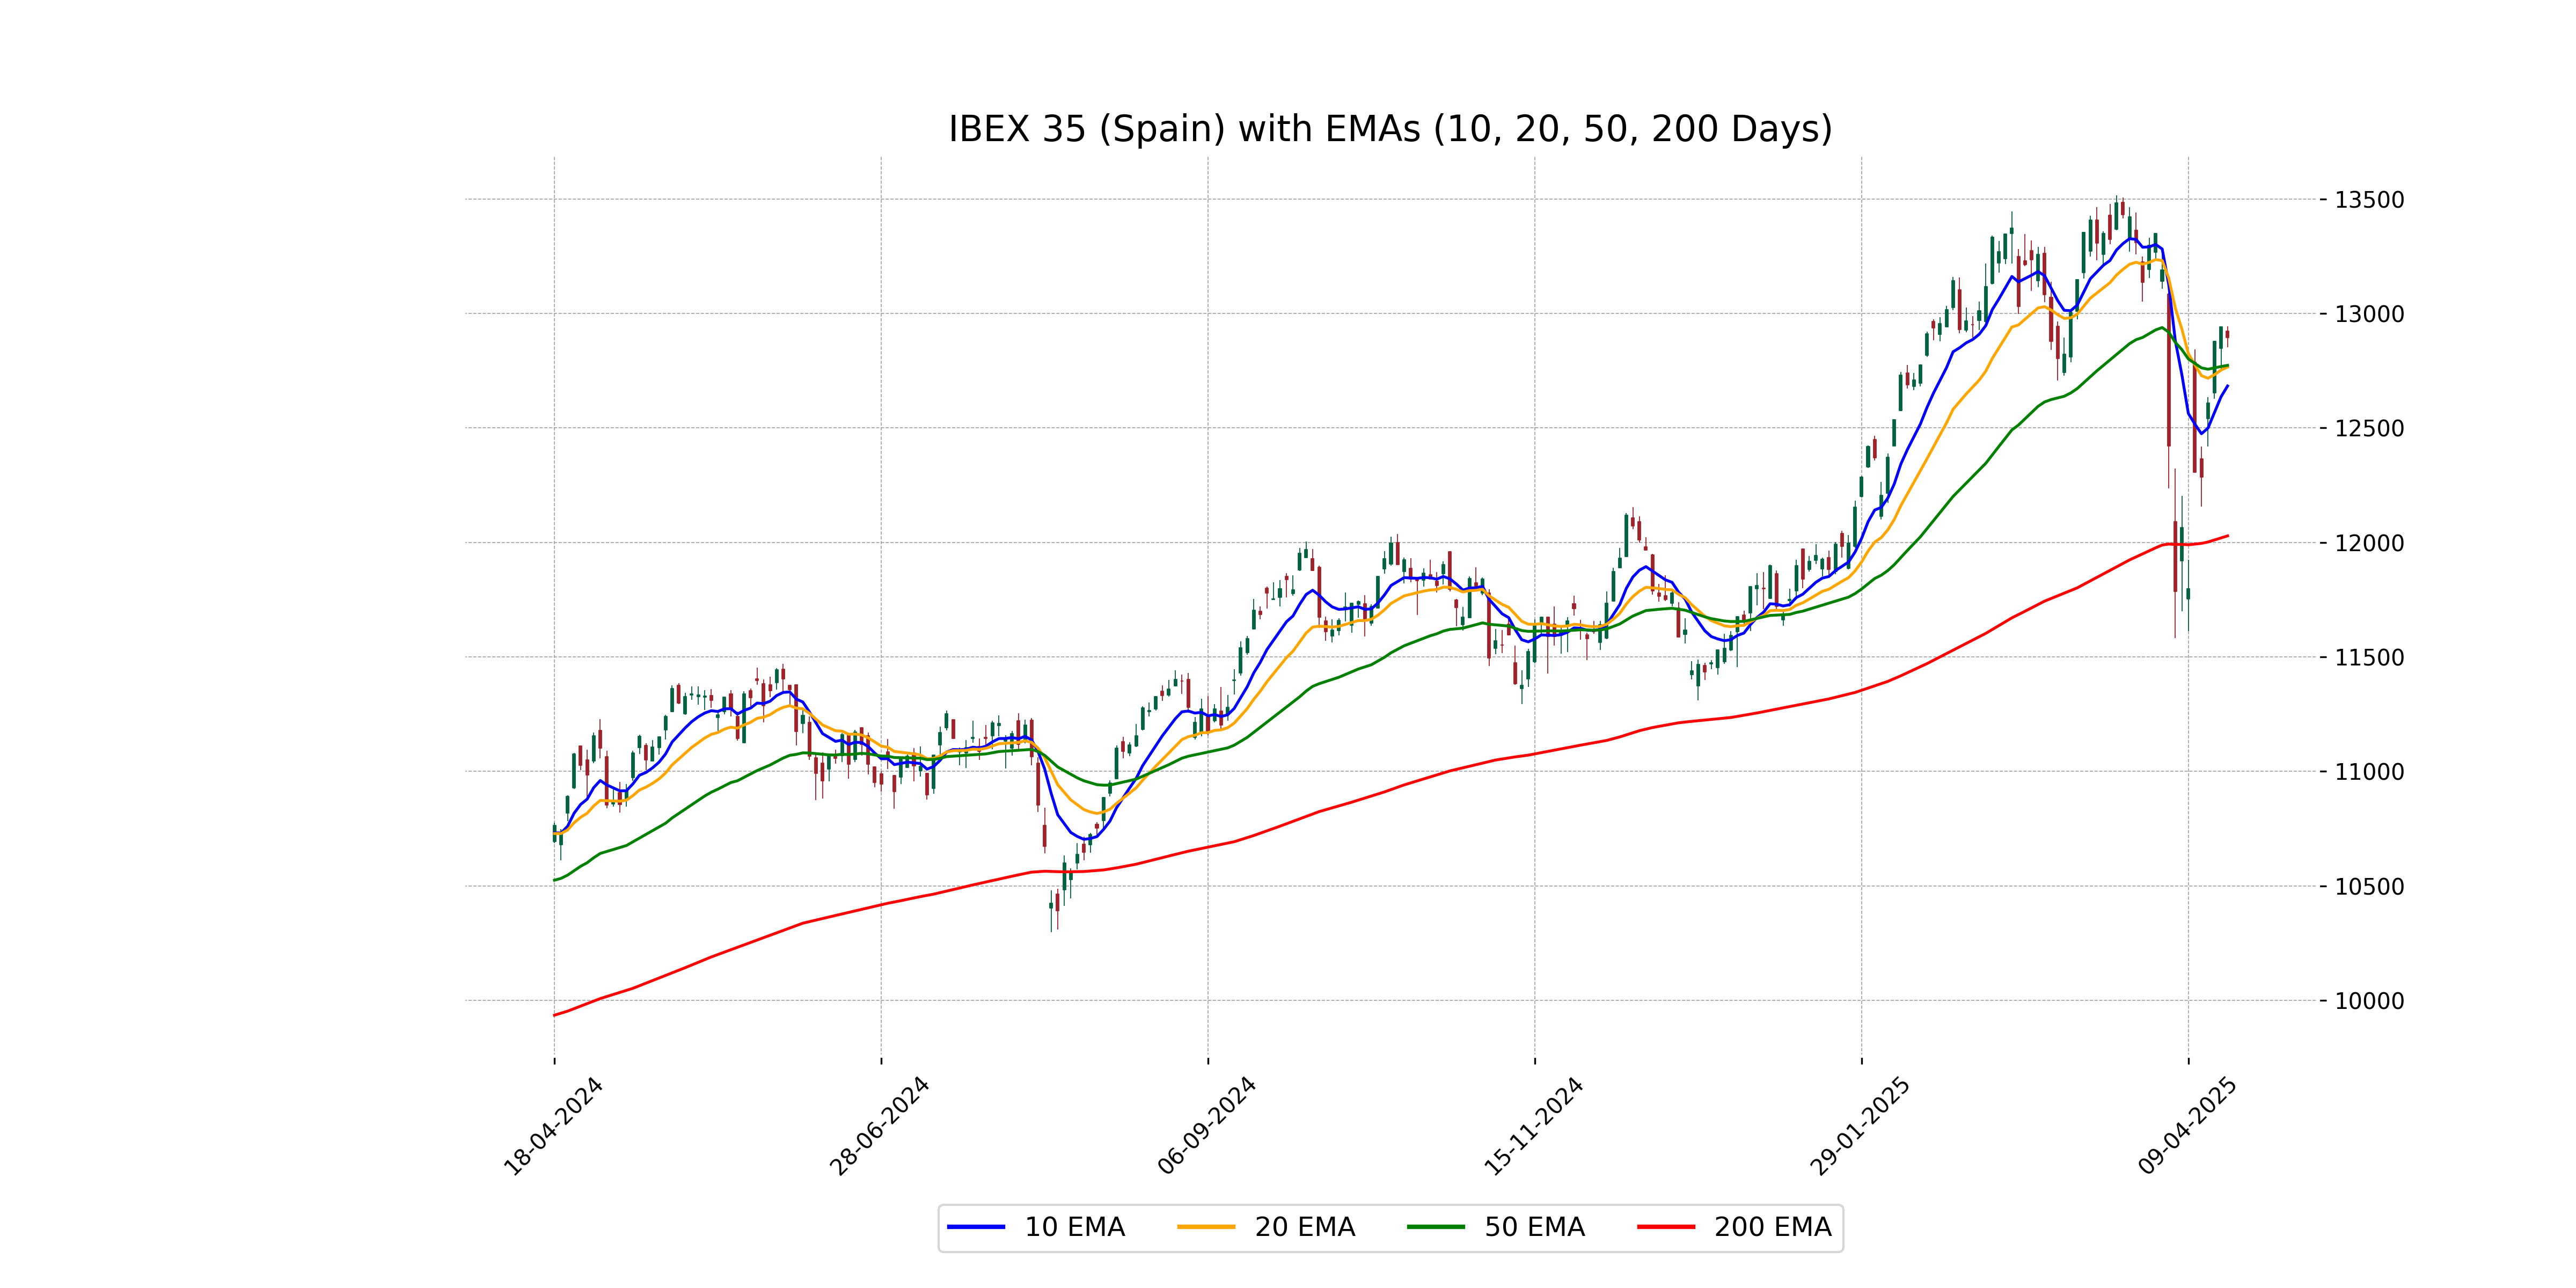
Relationship with Key Moving Averages
The IBEX 35 (Spain) is currently trading at 12895.20, which is above its 50 EMA of 12773.38 and 10 EMA of 12683.41, indicating a short-term bullish trend. However, it is trading below the 20 EMA of 12766.21 and well above the 200 EMA of 12028.68, suggesting longer-term bullish momentum despite recent short-term fluctuations.
Moving Averages Trend (MACD)
The MACD for IBEX 35 currently stands at -106.31, which is above the MACD Signal of -129.23, indicating a potential bullish crossover. This suggests that the negative momentum might be weakening, but overall trend analysis should also consider other indicators.
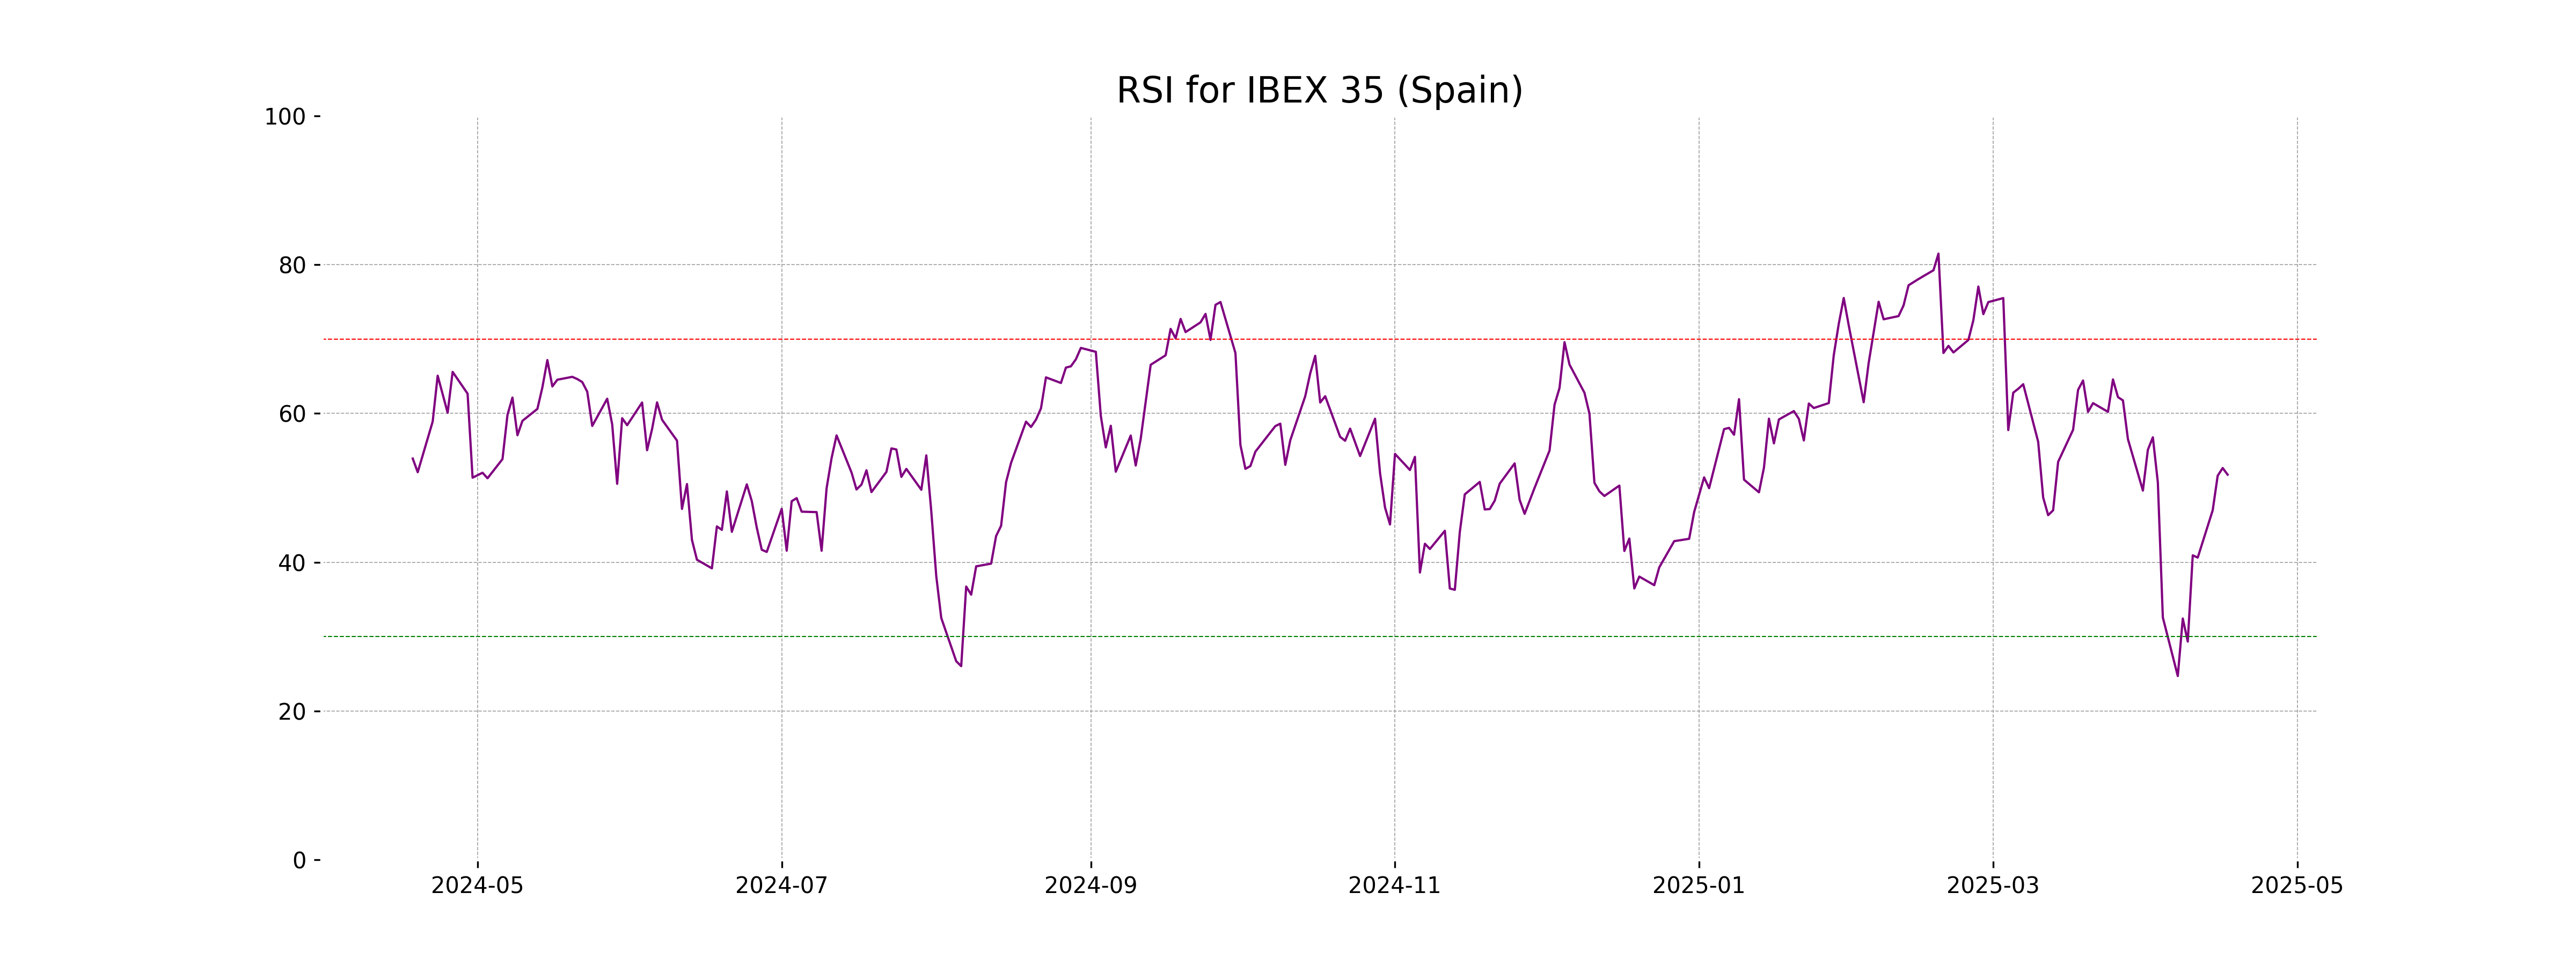
RSI Analysis
The RSI value for IBEX 35 (Spain) is 51.77, which suggests the index is in a neutral zone, neither overbought nor oversold. Generally, an RSI above 70 indicates an overbought condition, while below 30 suggests an oversold situation.
Analysis for NASDAQ Composite (US) - April 17, 2025
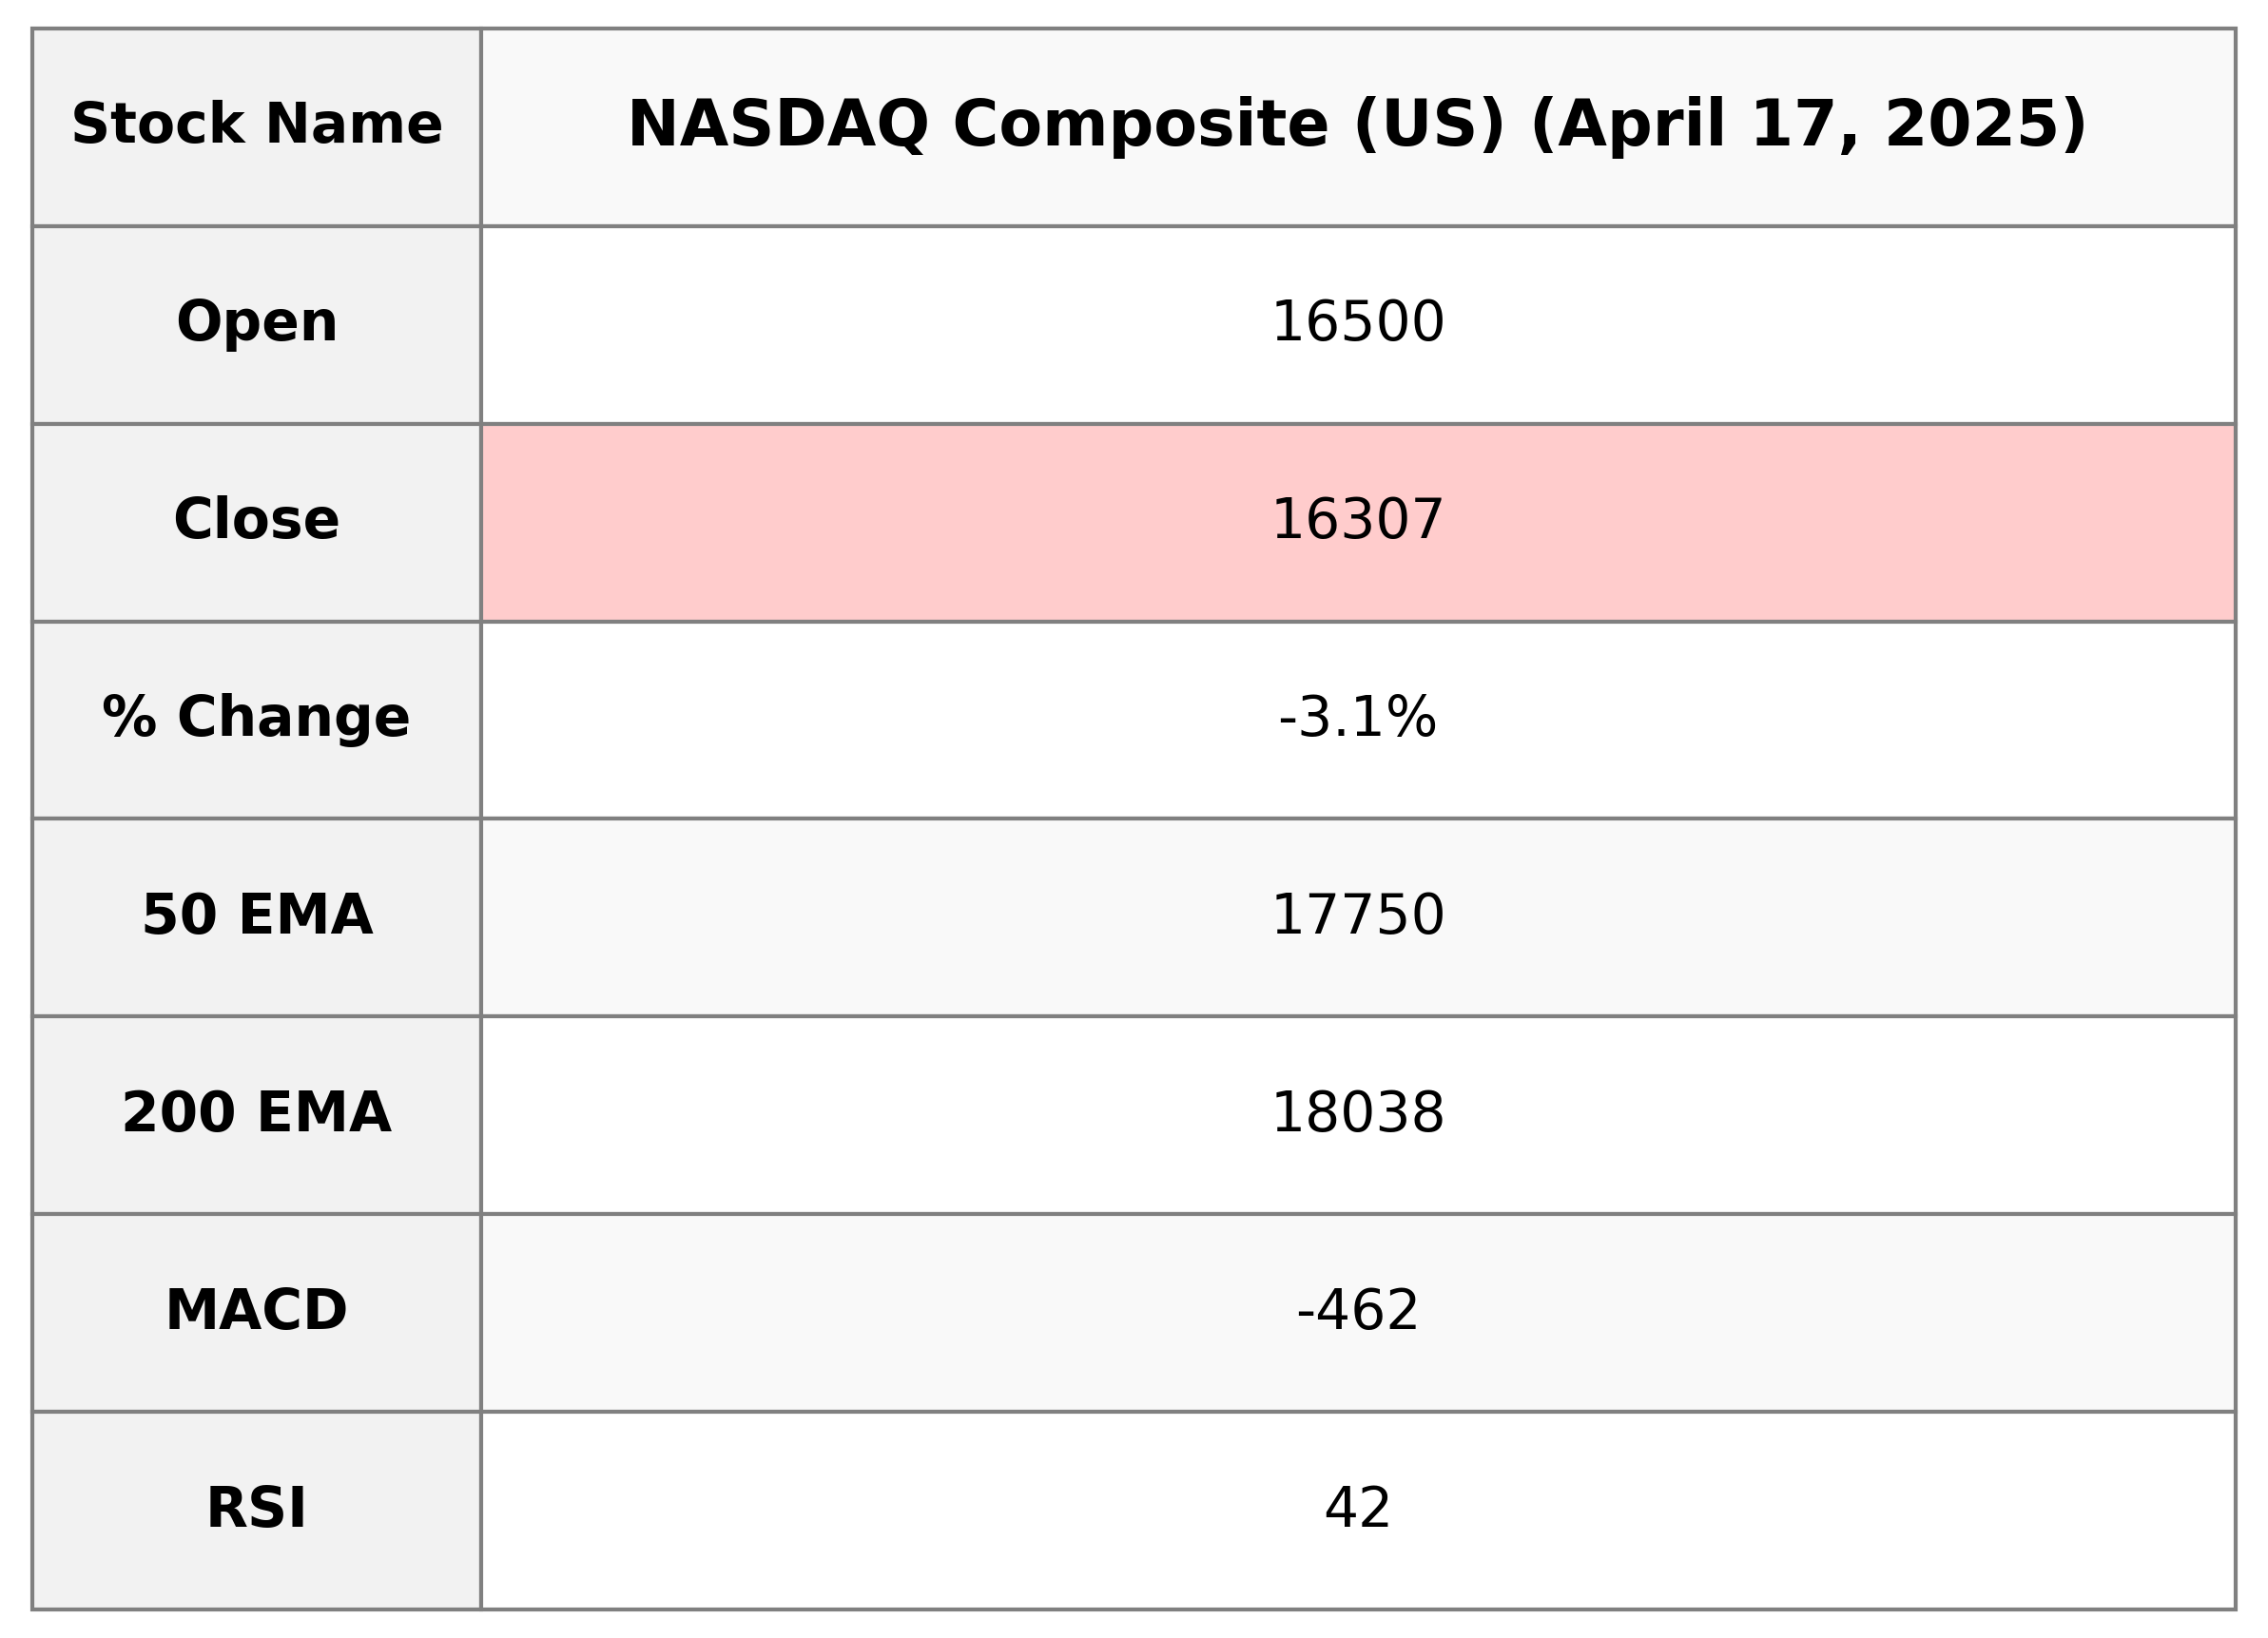
The NASDAQ Composite (US) shows a significant decline with a -3.07% change, as the index closed at 16,307.16, down from its previous close of 16,823.17. The trading volume was notably high at 7.91 billion. The Relative Strength Index (RSI) suggests a bearish trend with a value of 41.50, accompanied by a negative MACD of -462.08.
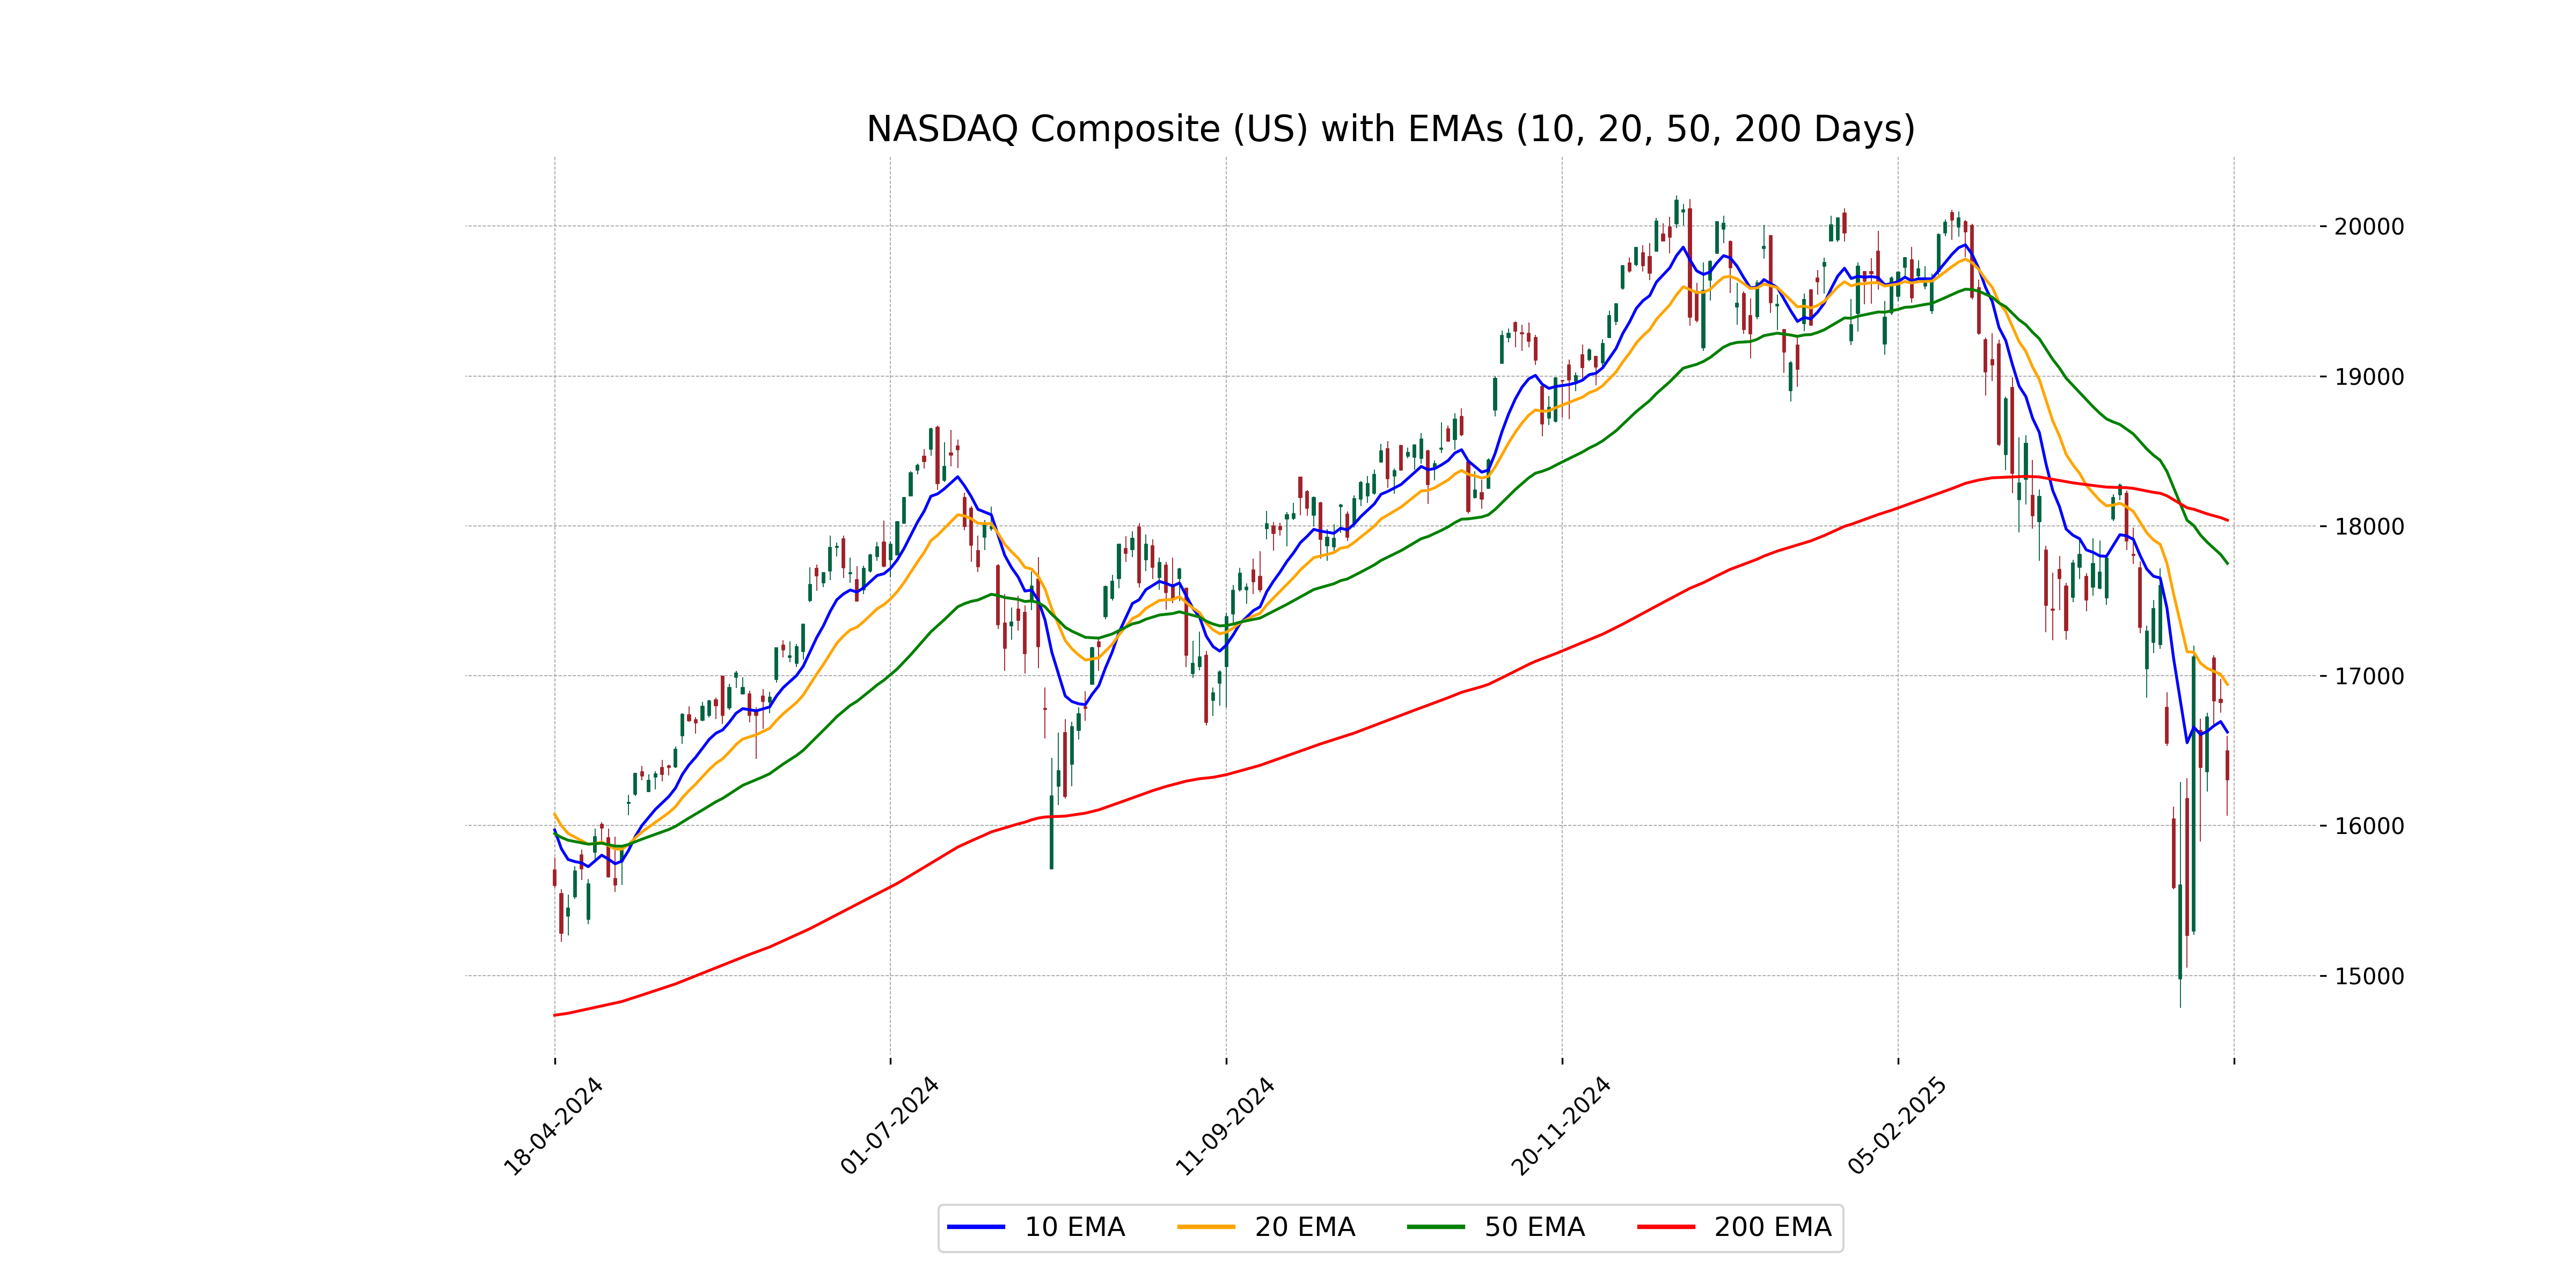
Relationship with Key Moving Averages
The NASDAQ Composite is currently trading below its key moving averages, with the latest close of 16,307.16 falling beneath the 10-day EMA (16,624.13), 50-day EMA (17,750.27), and 200-day EMA (18,037.91). This indicates a bearish trend in the short to long term, as the price is consistently positioned below these significant moving averages.
Moving Averages Trend (MACD)
Based on the stock data provided, NASDAQ Composite (US) currently has a MACD of -462.08, which is higher than the MACD Signal of -506.58. This positive difference indicates a potential bullish signal, suggesting the momentum might be shifting towards an upward trend despite the recent decline in the closing price.
RSI Analysis
NASDAQ Composite RSI Analysis: The RSI (Relative Strength Index) for the NASDAQ Composite is 41.50, which indicates that the index is approaching the oversold territory. Typically, an RSI below 30 signals an asset is oversold, while above 70 suggests it is overbought. At 41.50, the NASDAQ Composite is relatively neutral but leaning towards being oversold.
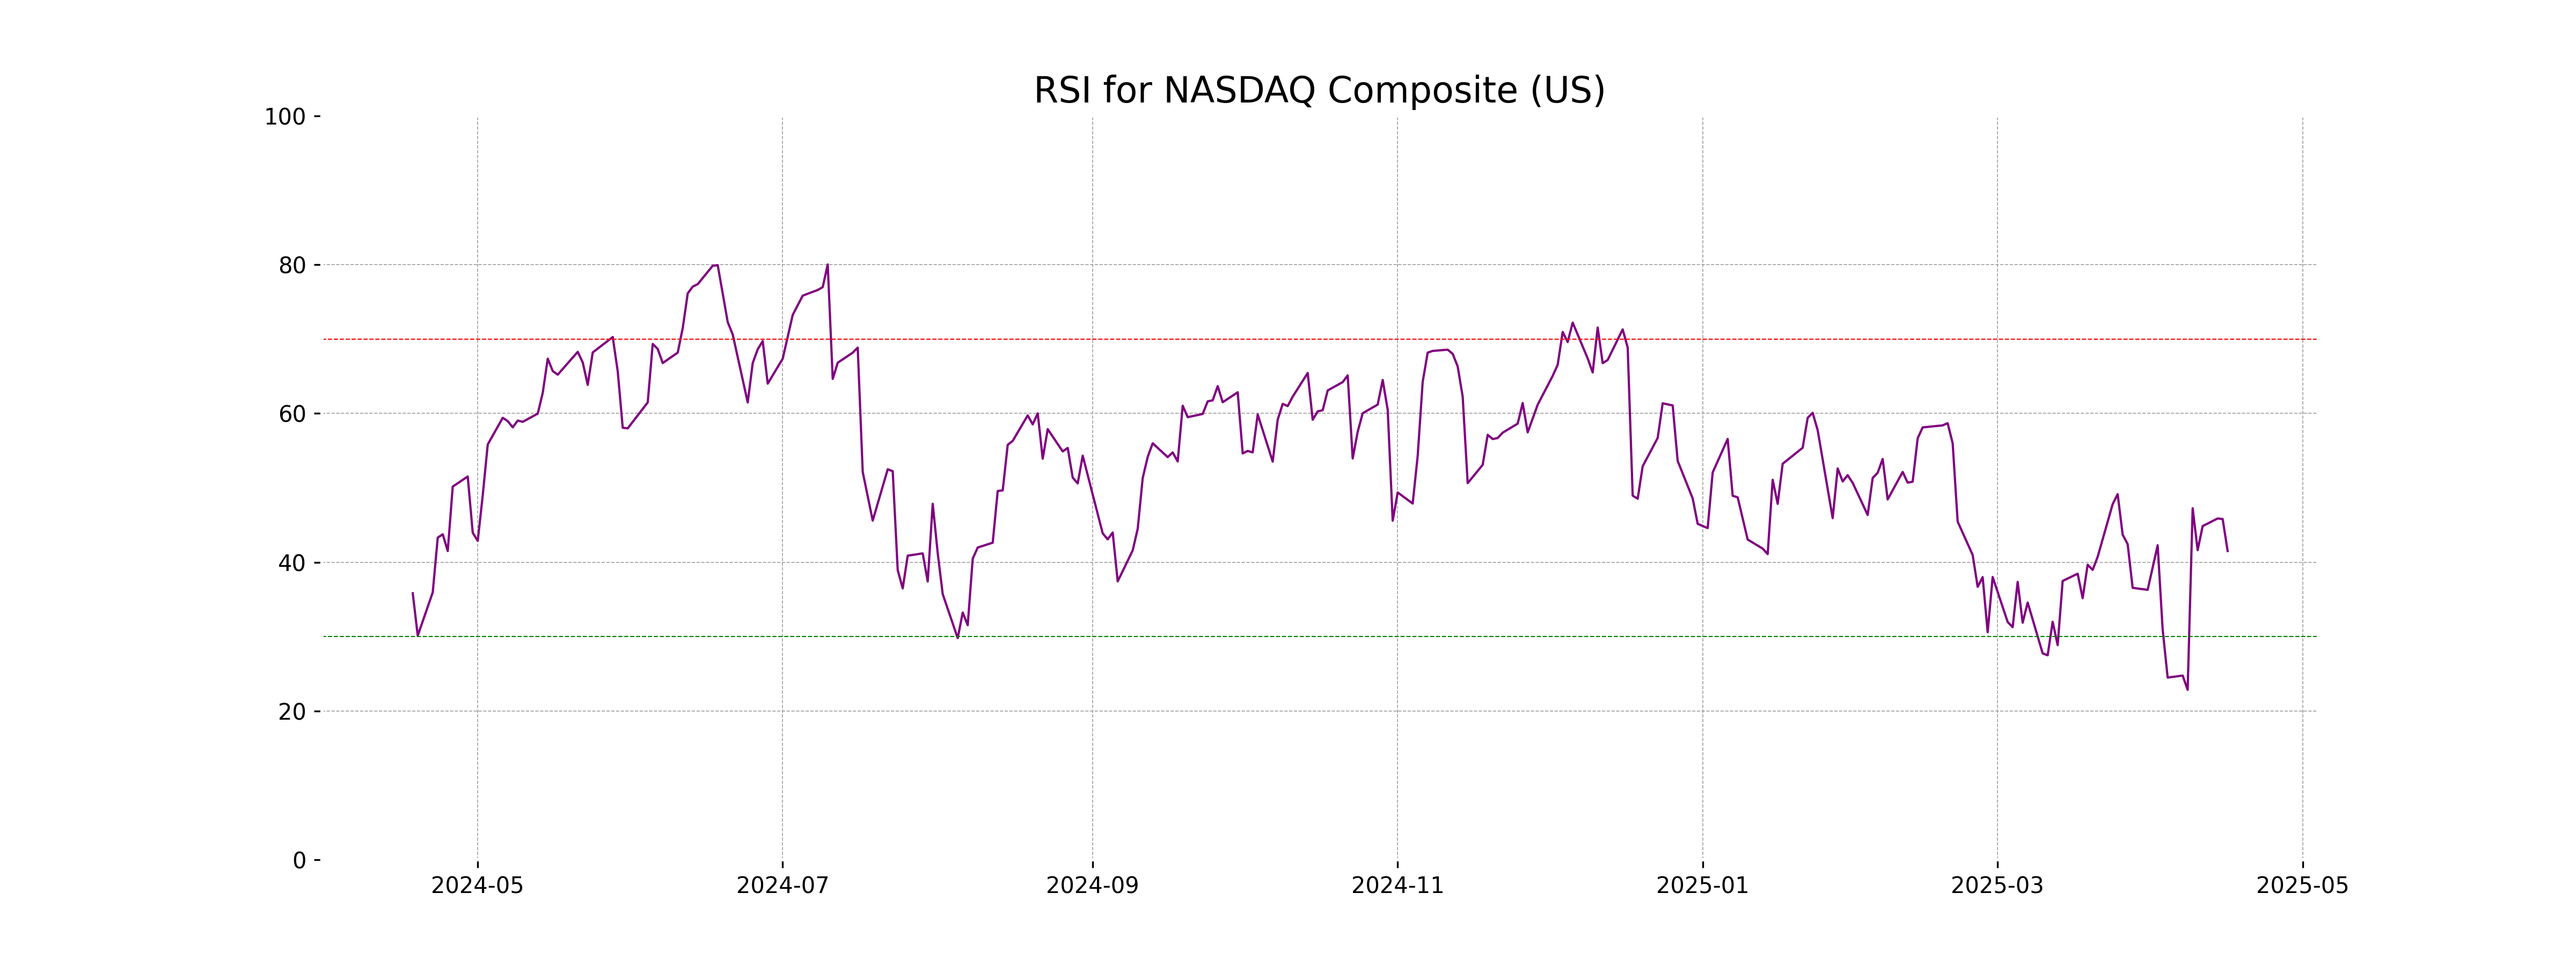
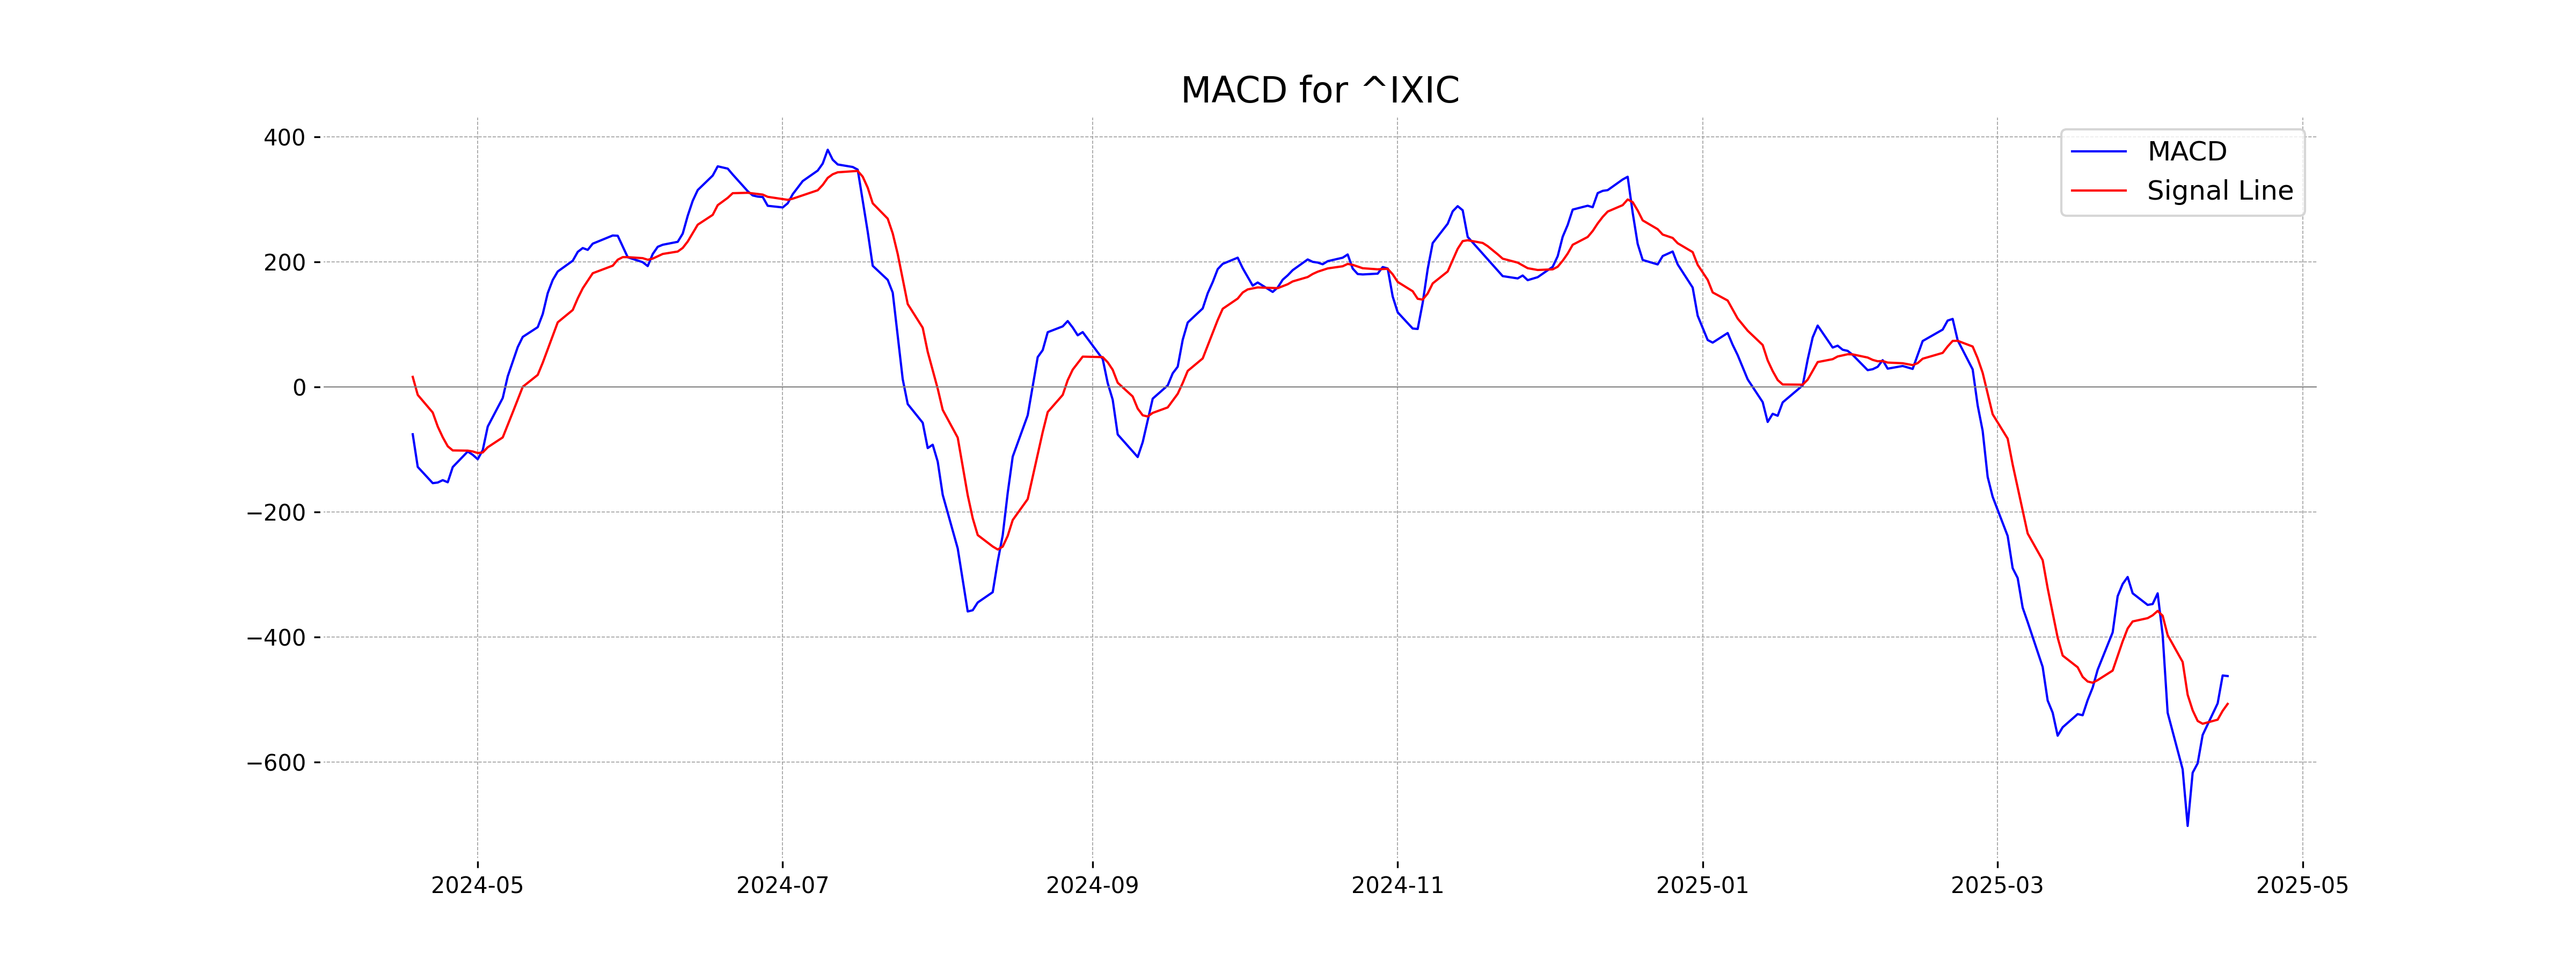
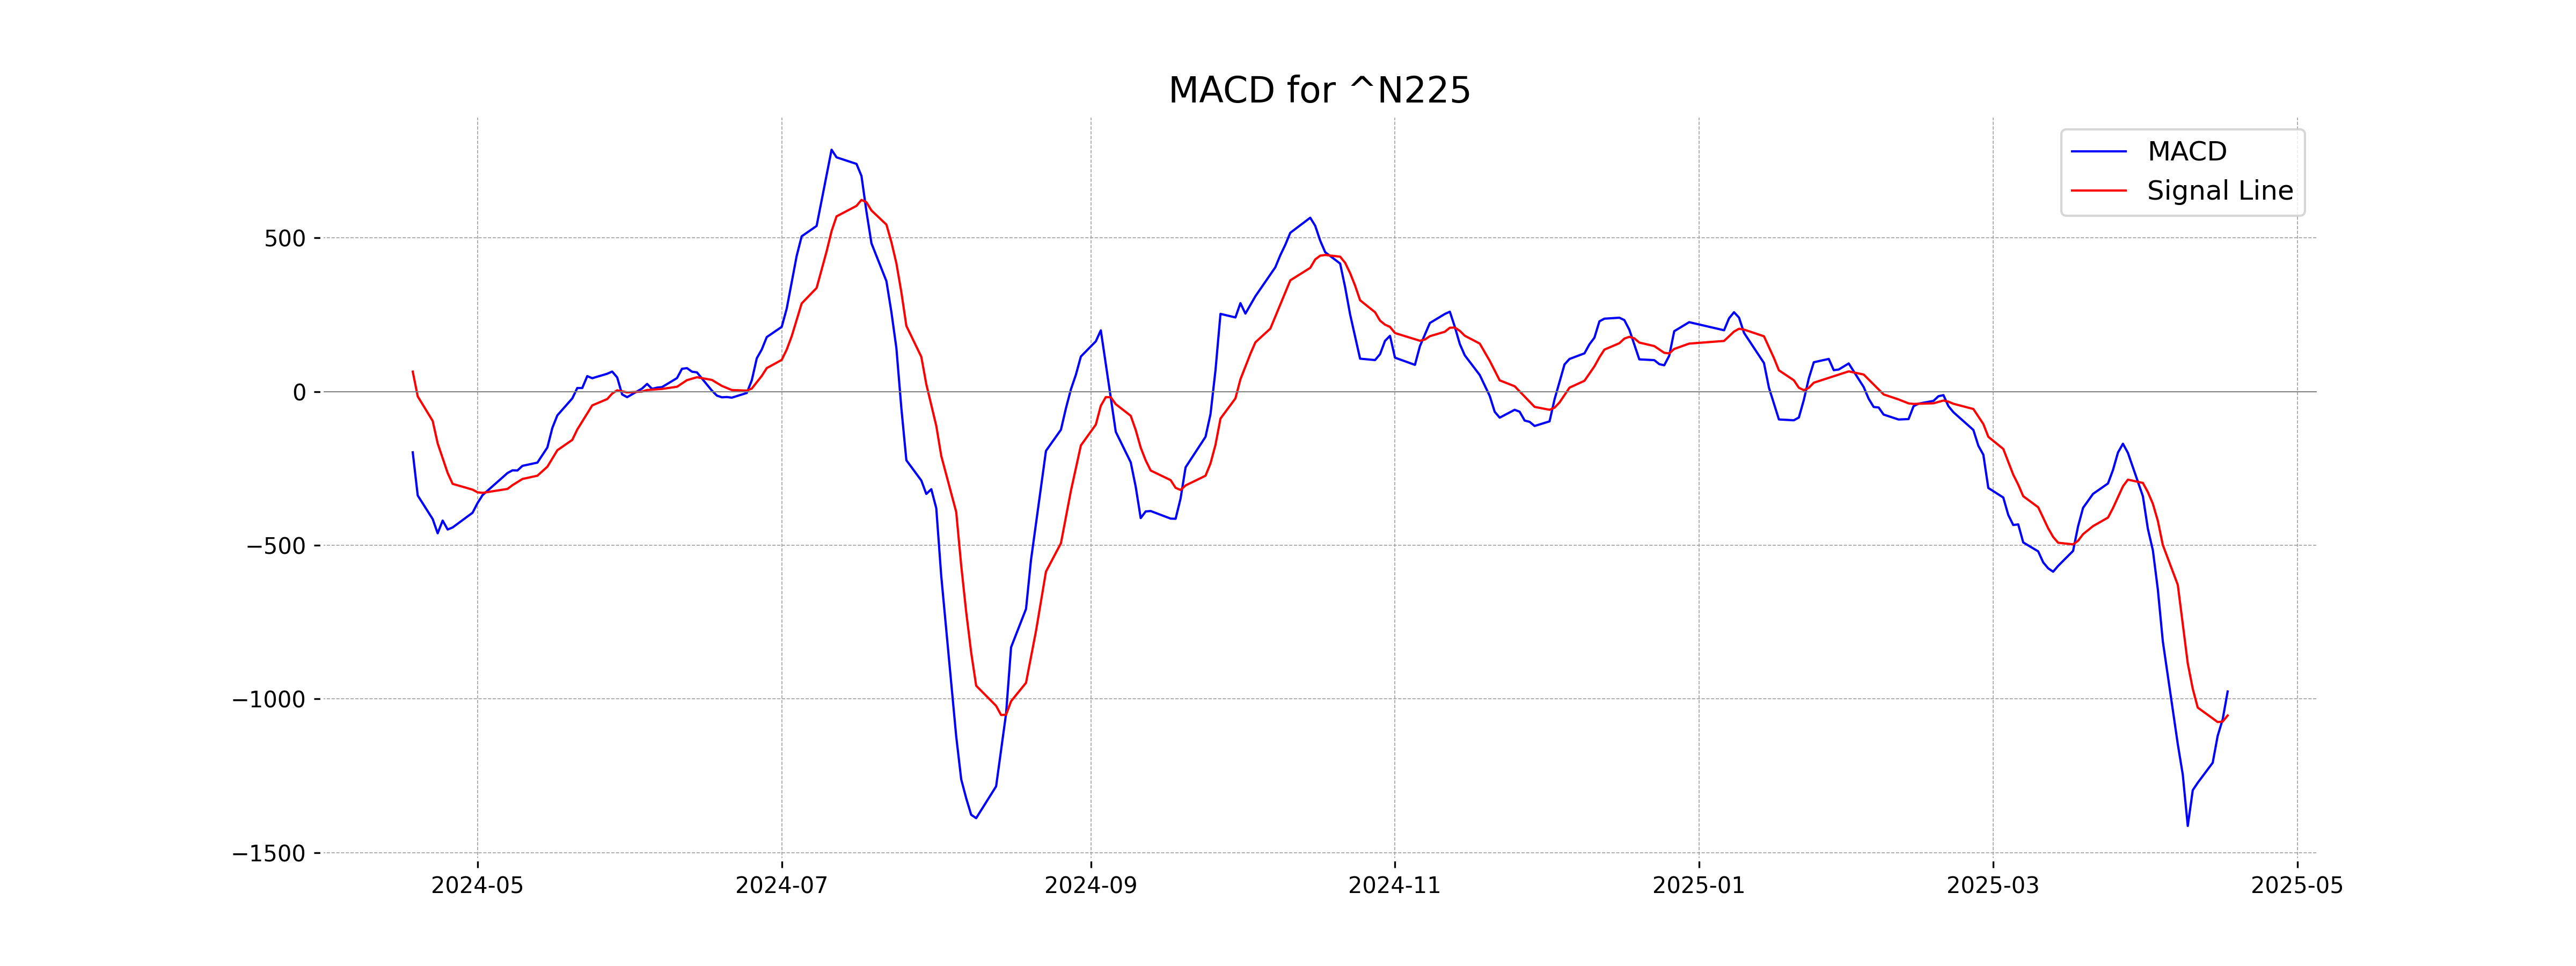
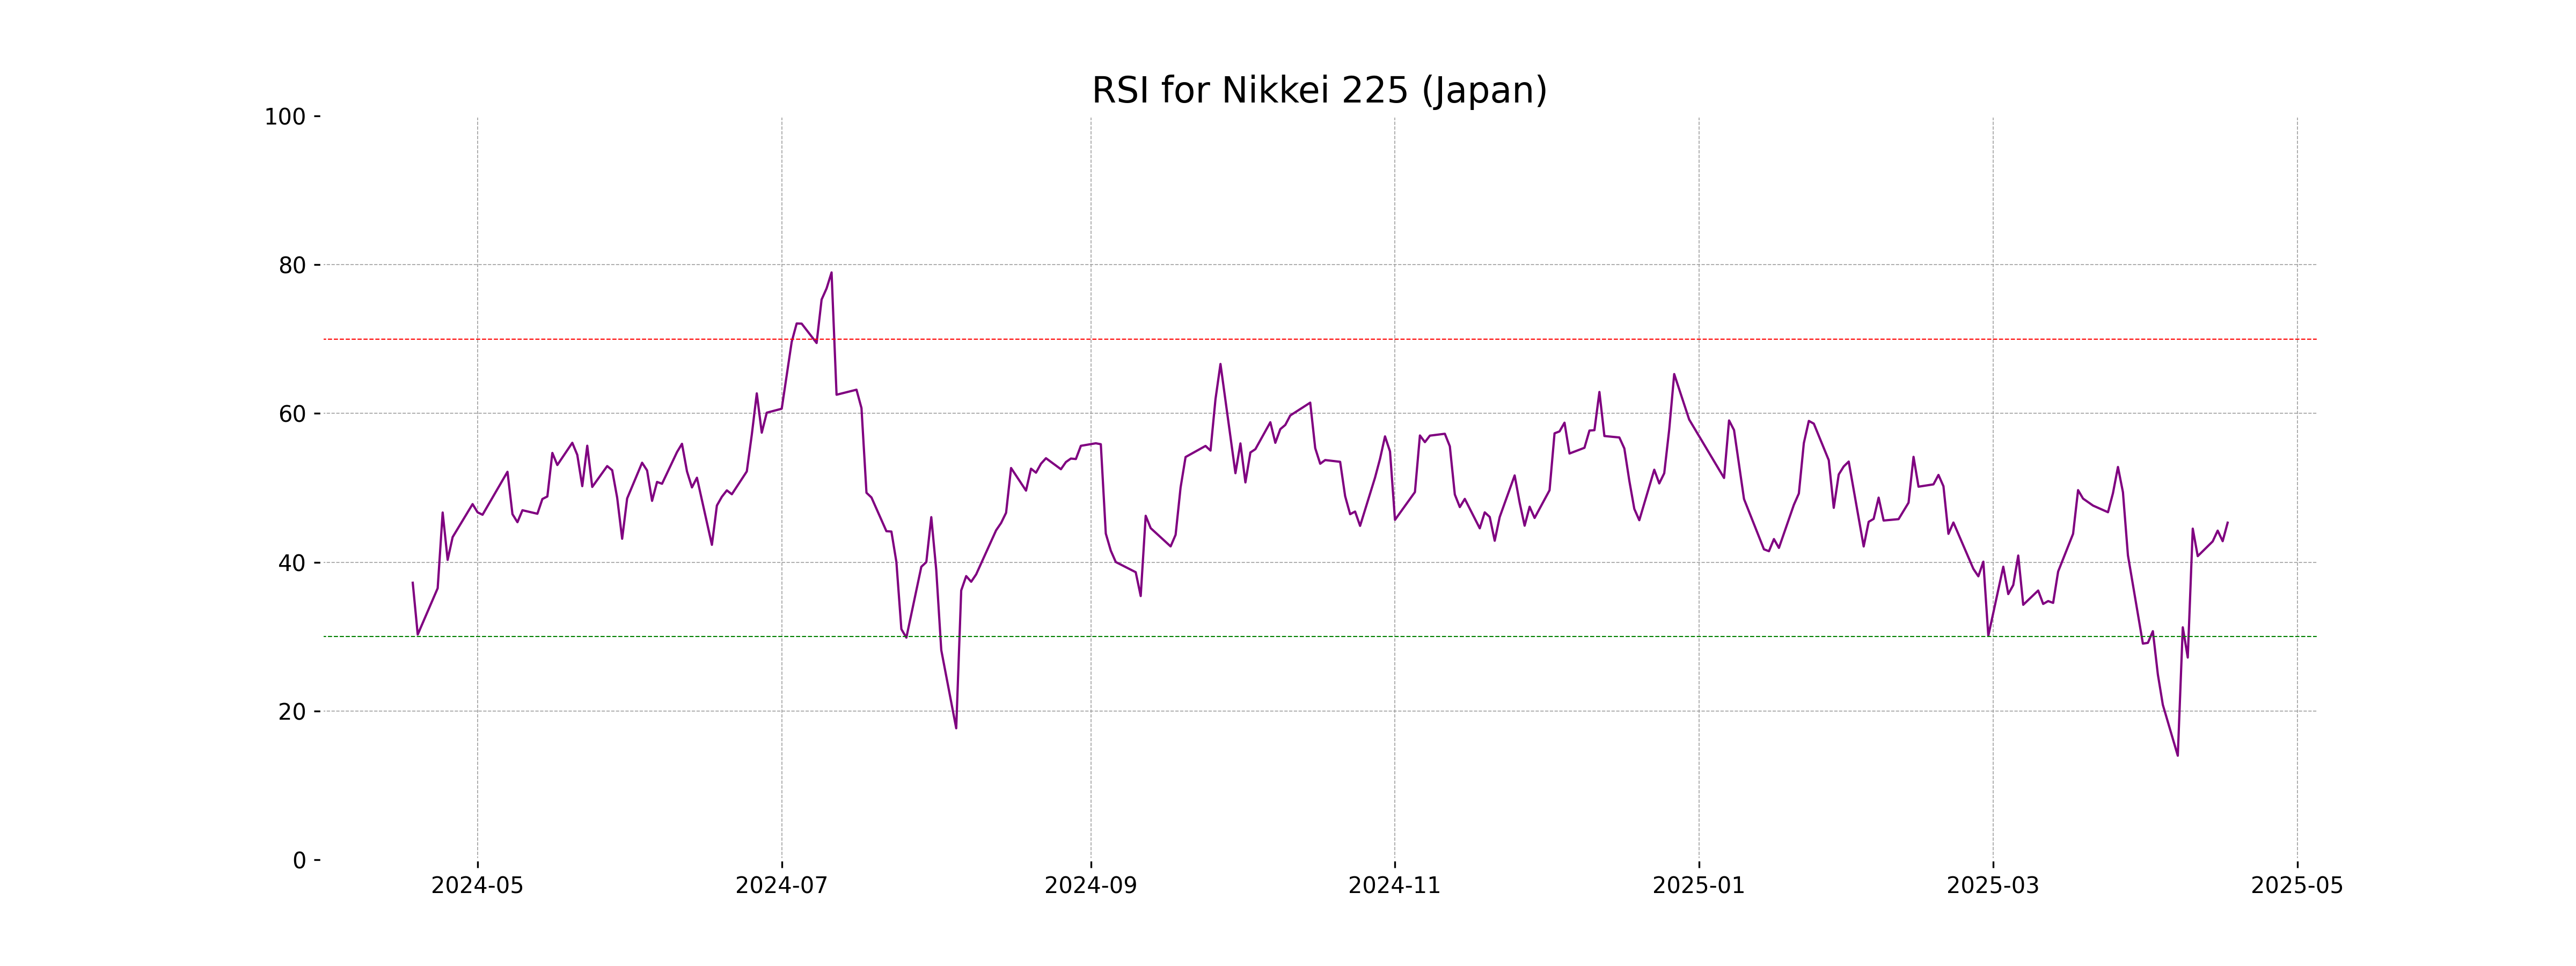
Analysis for Nikkei 225 (Japan) - April 17, 2025
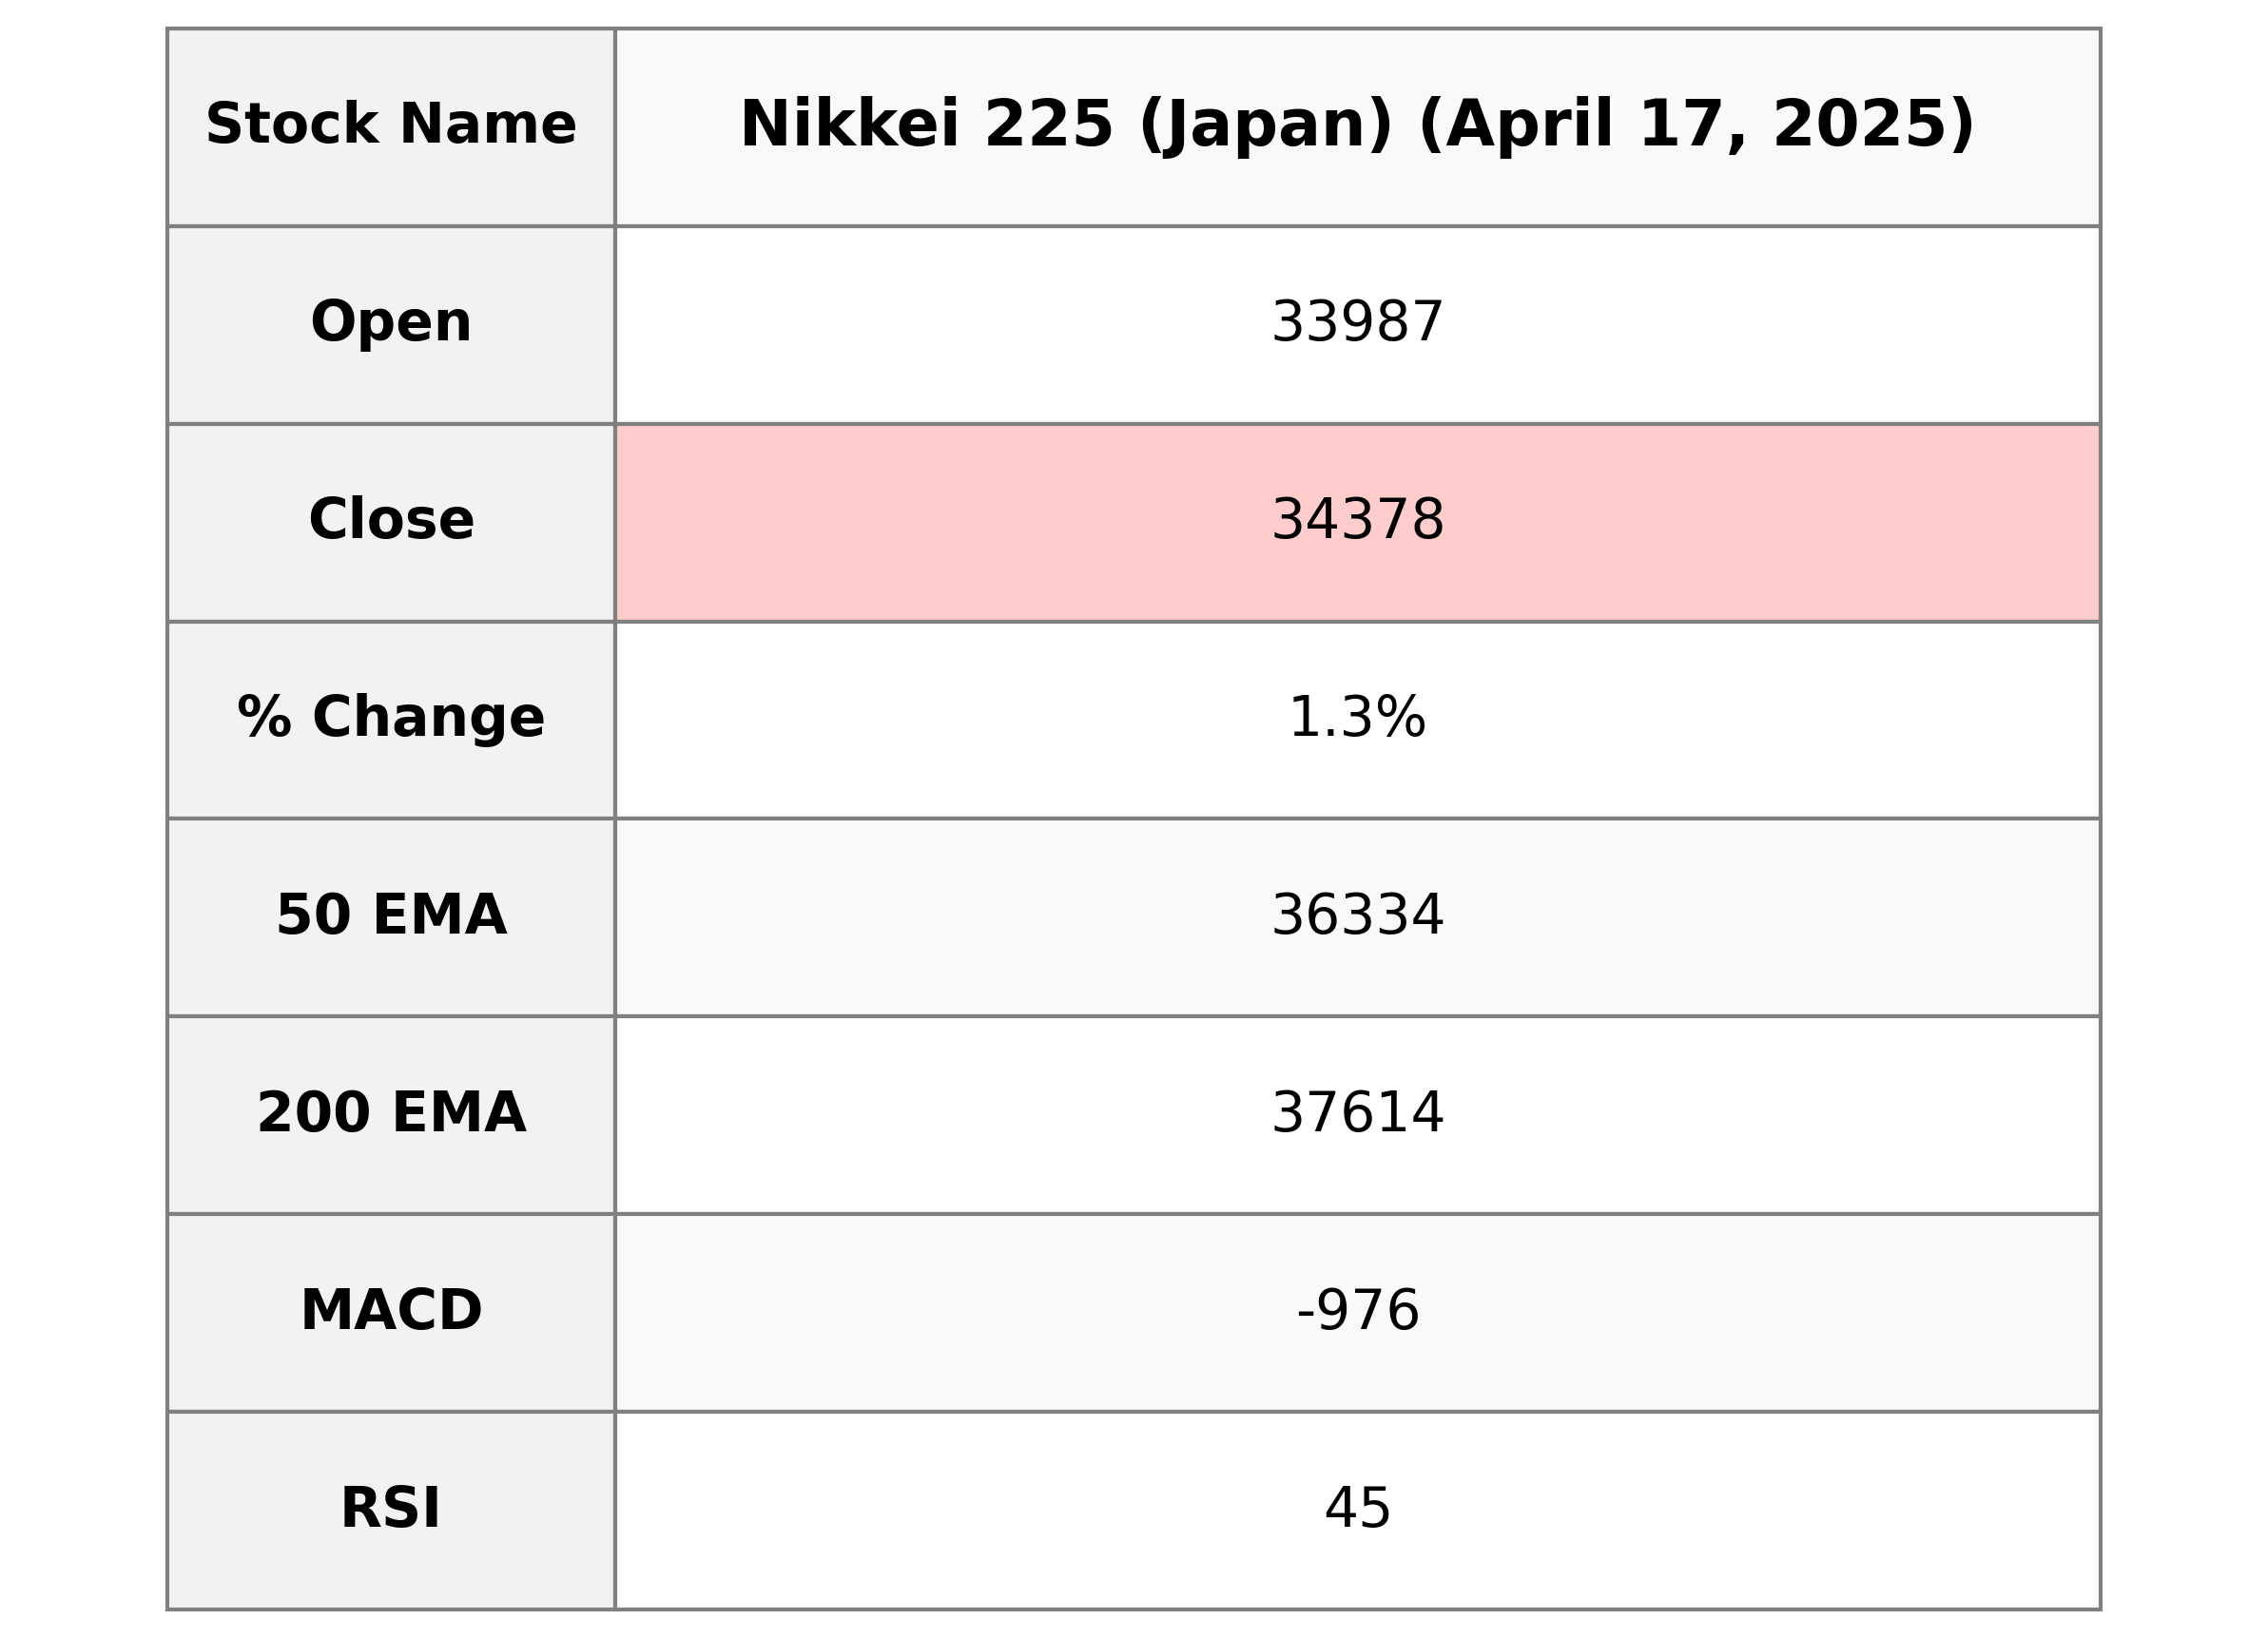
The Nikkei 225 (Japan) opened at 33,987.01 and closed at 34,377.60, marking a 1.35% increase with a points change of 457.20. Although the stock experienced a notable rise, the RSI value of 45.32 suggests it is in a relatively neutral position, while the MACD indicates a bearish sentiment with a value of -975.90.
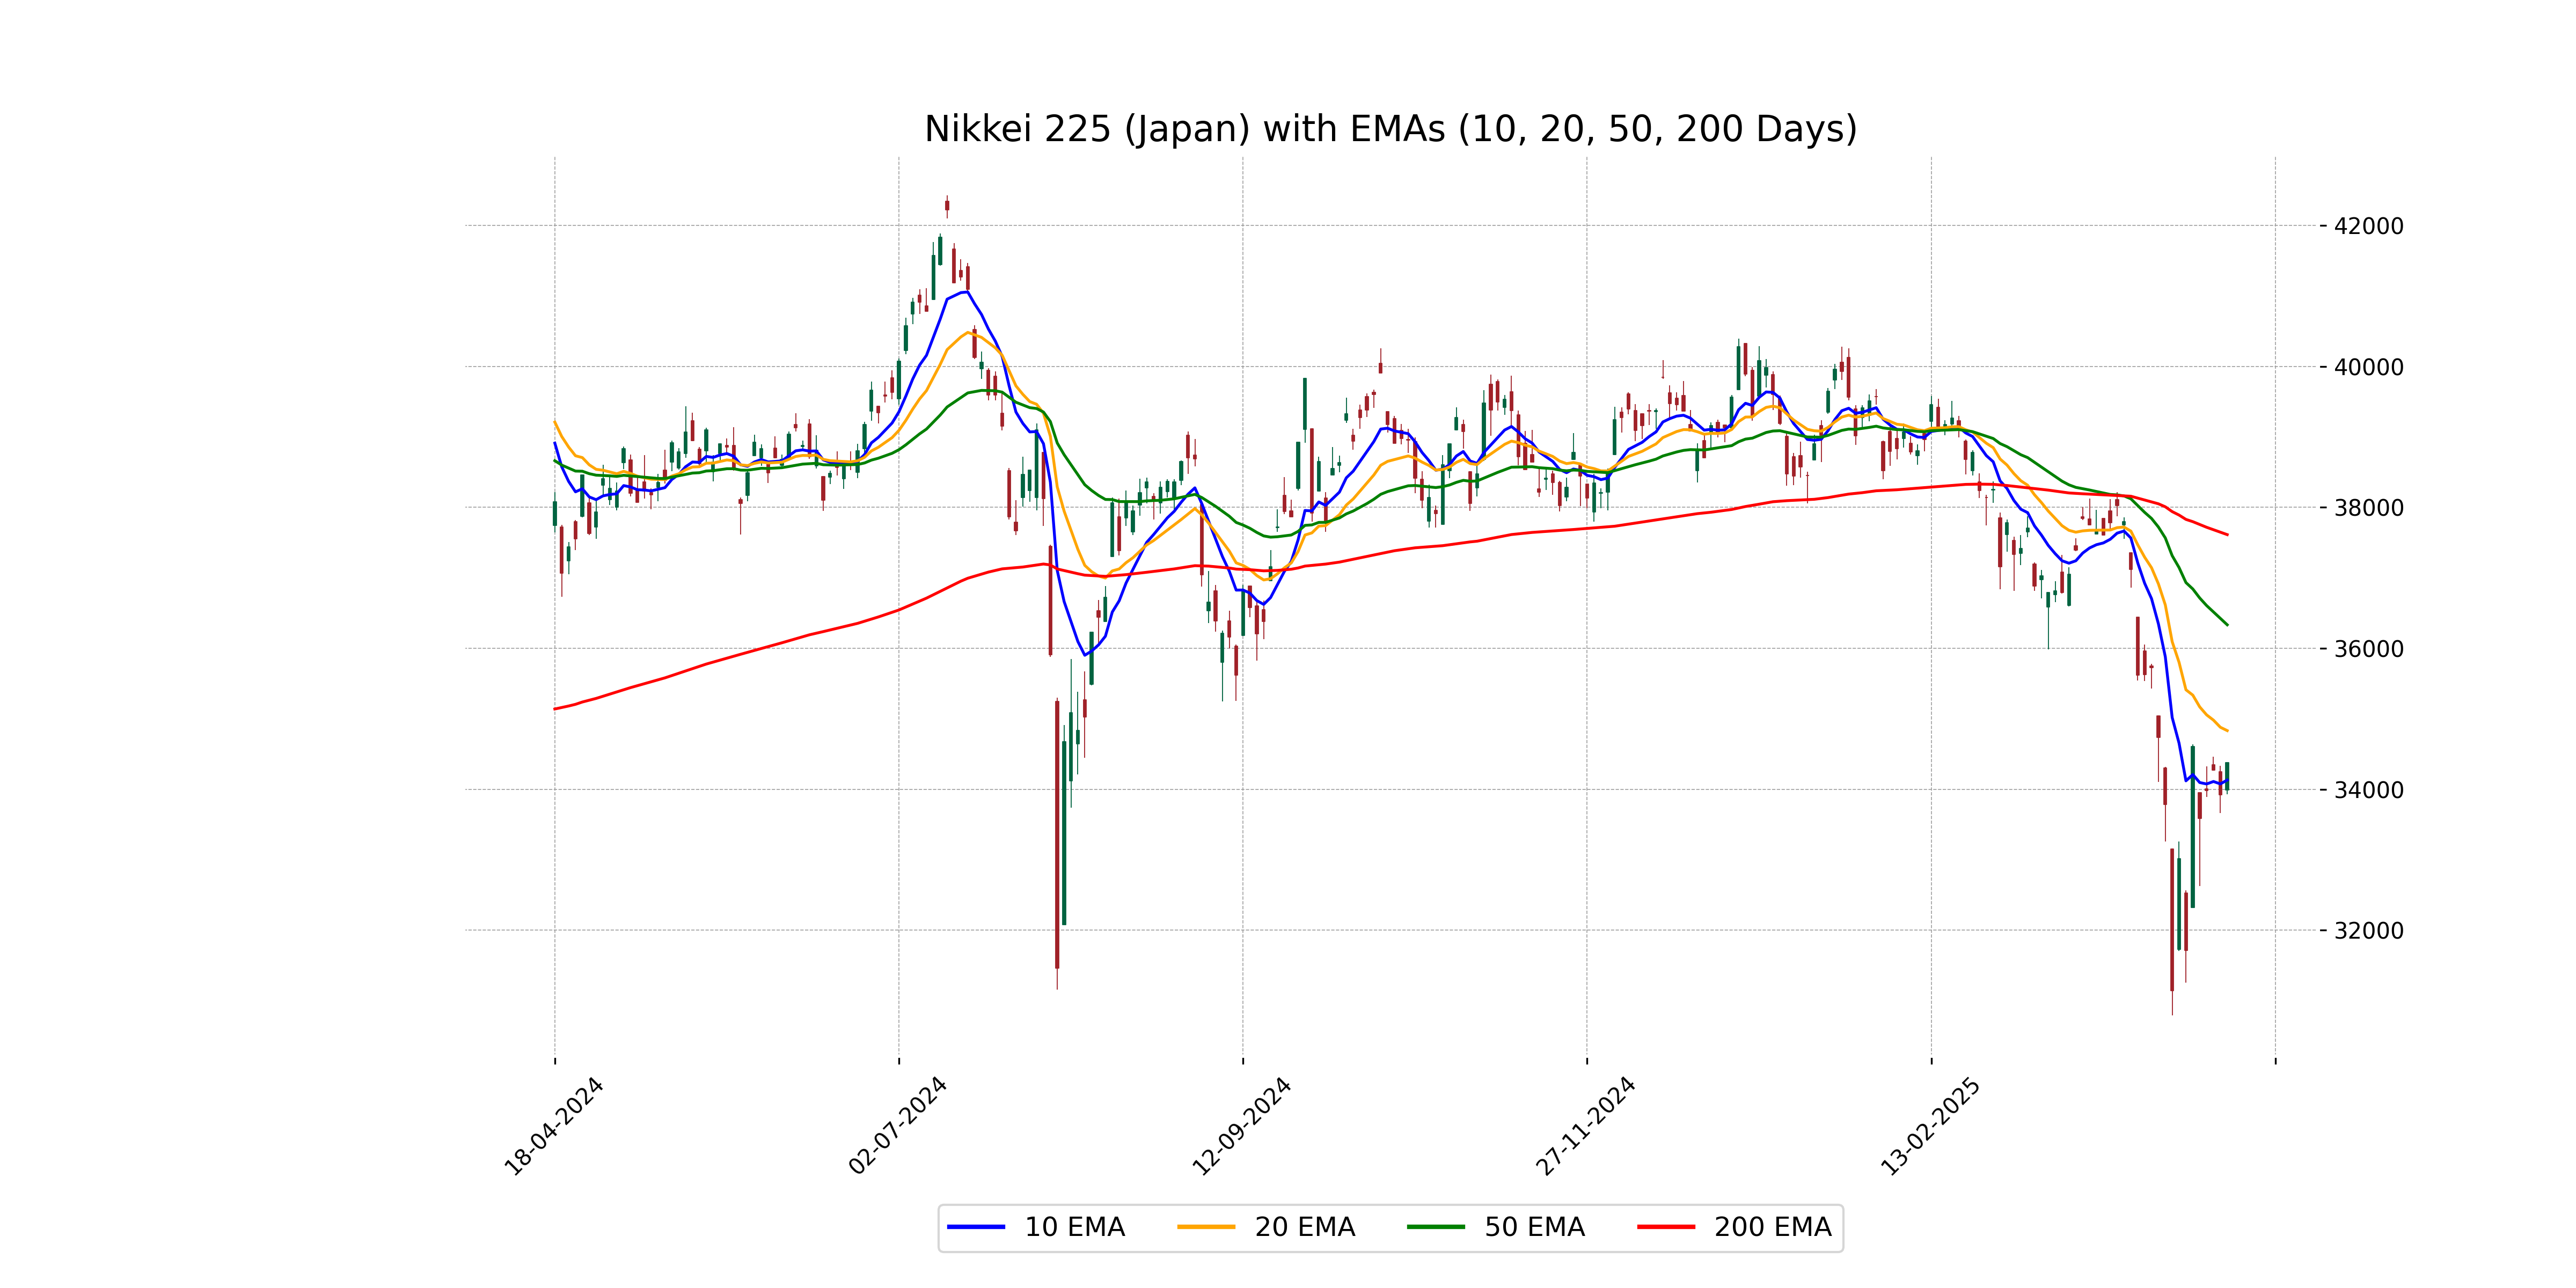
Relationship with Key Moving Averages
The Nikkei 225's current close of 34377.60 is below both the 50 EMA (36333.76) and the 200 EMA (37613.68), indicating a bearish trend in the longer term. However, it is above the 10 EMA (34130.15) and below the 20 EMA (34831.74), suggesting short-term strength but overall weakness in the intermediate term.
Moving Averages Trend (MACD)
MACD Analysis for Nikkei 225 (Japan): The MACD value of -975.90 compared to the MACD Signal of -1054.07 indicates a potential bullish momentum, as the MACD line is above the Signal line. However, both values are negative, suggesting that the index is still in a bearish trend overall.
RSI Analysis
The RSI (Relative Strength Index) for Nikkei 225 is 45.32, indicating that the index is in the neutral range. Typically, an RSI below 30 suggests that an asset may be undervalued (potentially oversold), whereas an RSI above 70 may suggest overvaluation (potentially overbought). With the current RSI, the index does not show strong signs of being overbought or oversold.
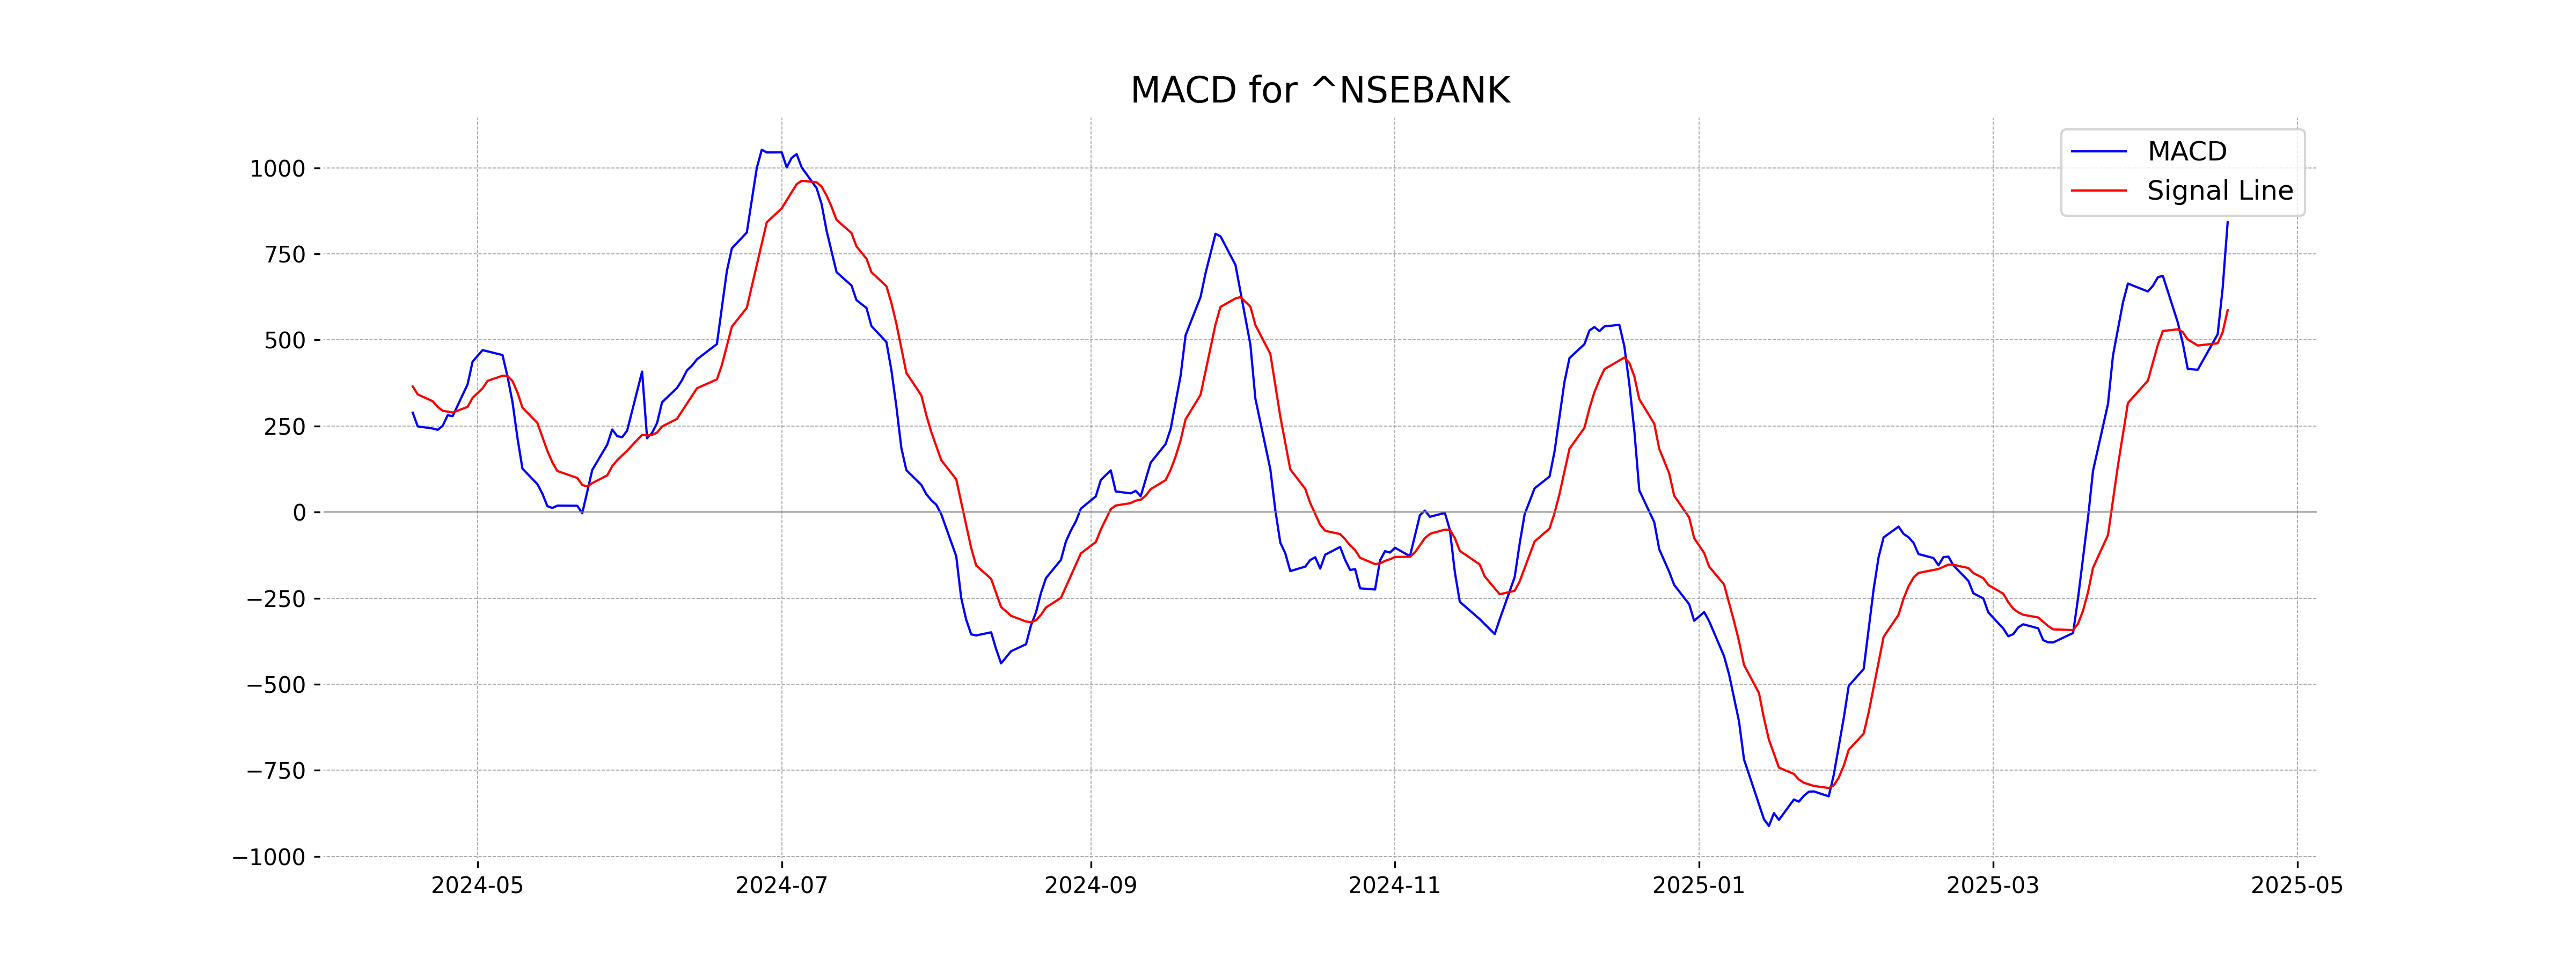
Analysis for Nifty Bank - April 17, 2025
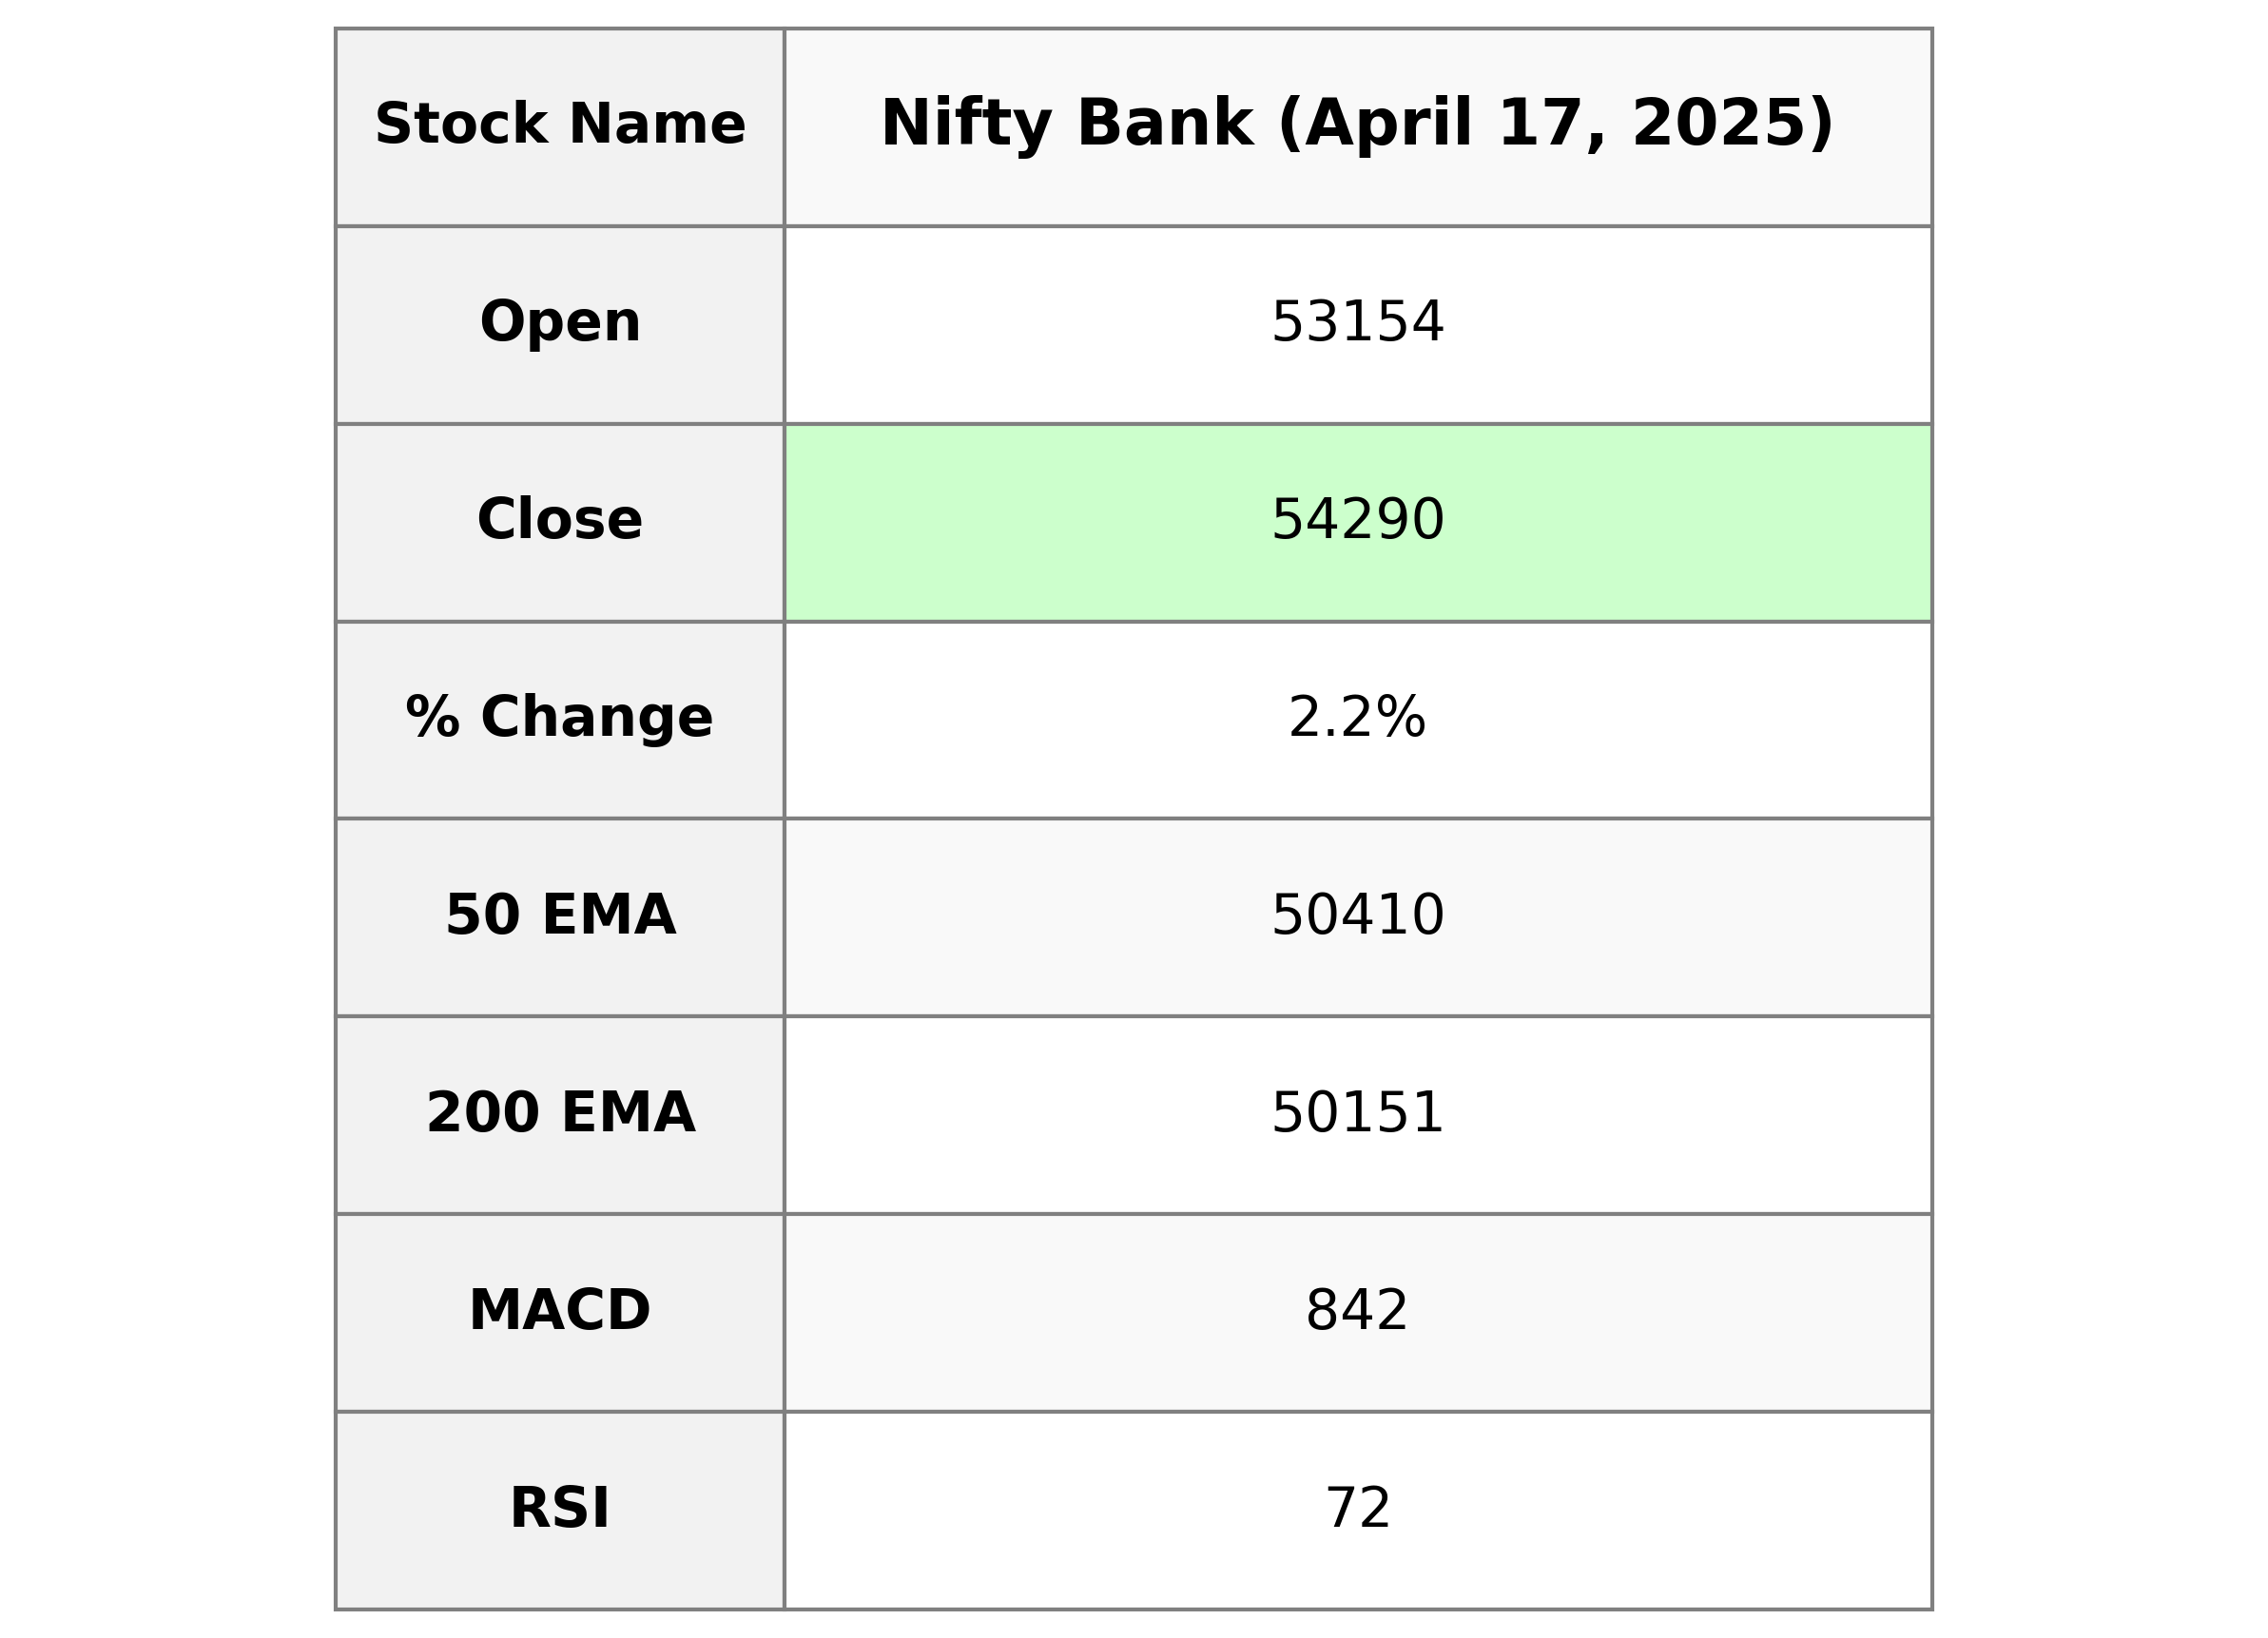
Nifty Bank demonstrated a strong performance with an opening of 53,153.75 and closing significantly higher at 54,290.20, marking a 2.21% increase, equating to a 1,172.45 points gain. The RSI indicates strong momentum at 72.24, and the MACD value further supports the bullish trend with a positive divergence from the signal line. The current close price is well above all major EMAs, suggesting sustained positive momentum.
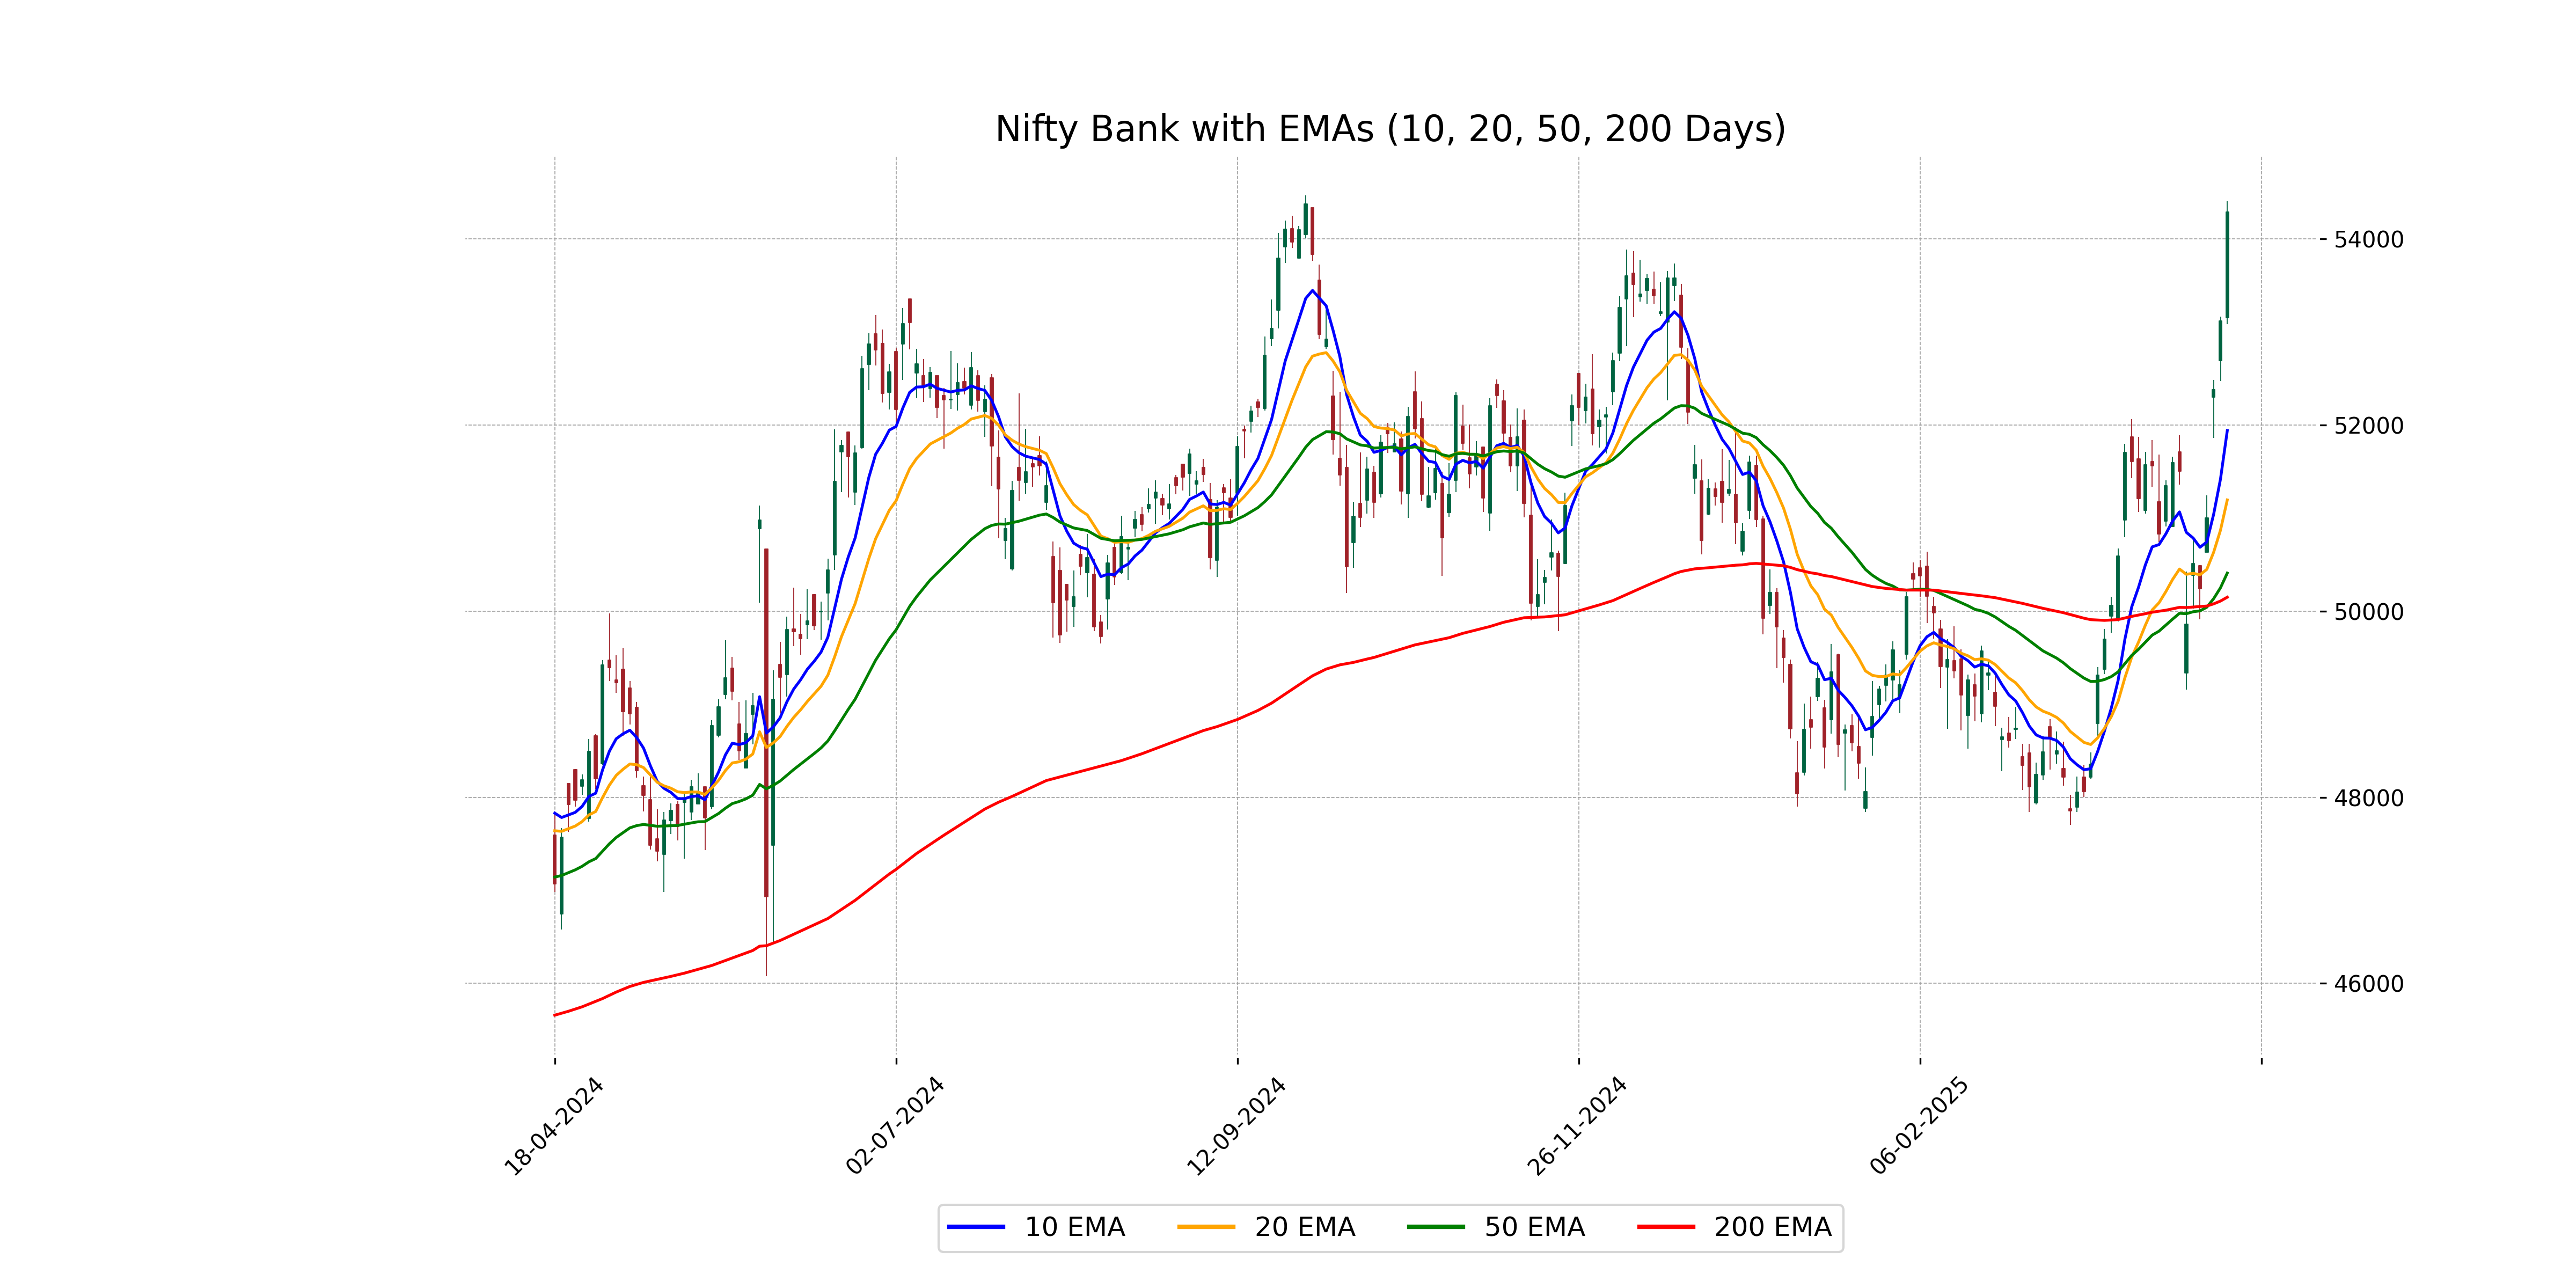
Relationship with Key Moving Averages
The Nifty Bank index closed at 54,290.20, which is above all its key moving averages, indicating a strong bullish trend. Specifically, it is trading above its 10-day EMA (51,941.23), 20-day EMA (51,195.99), 50-day EMA (50,410.27), and 200-day EMA (50,151.06), reflecting strong upward momentum.
Moving Averages Trend (MACD)
The MACD for Nifty Bank is at 841.54, which is above the MACD Signal line of 586.14. This suggests that the Nifty Bank is currently experiencing bullish momentum, indicating a potential upward trend in the stock's price.
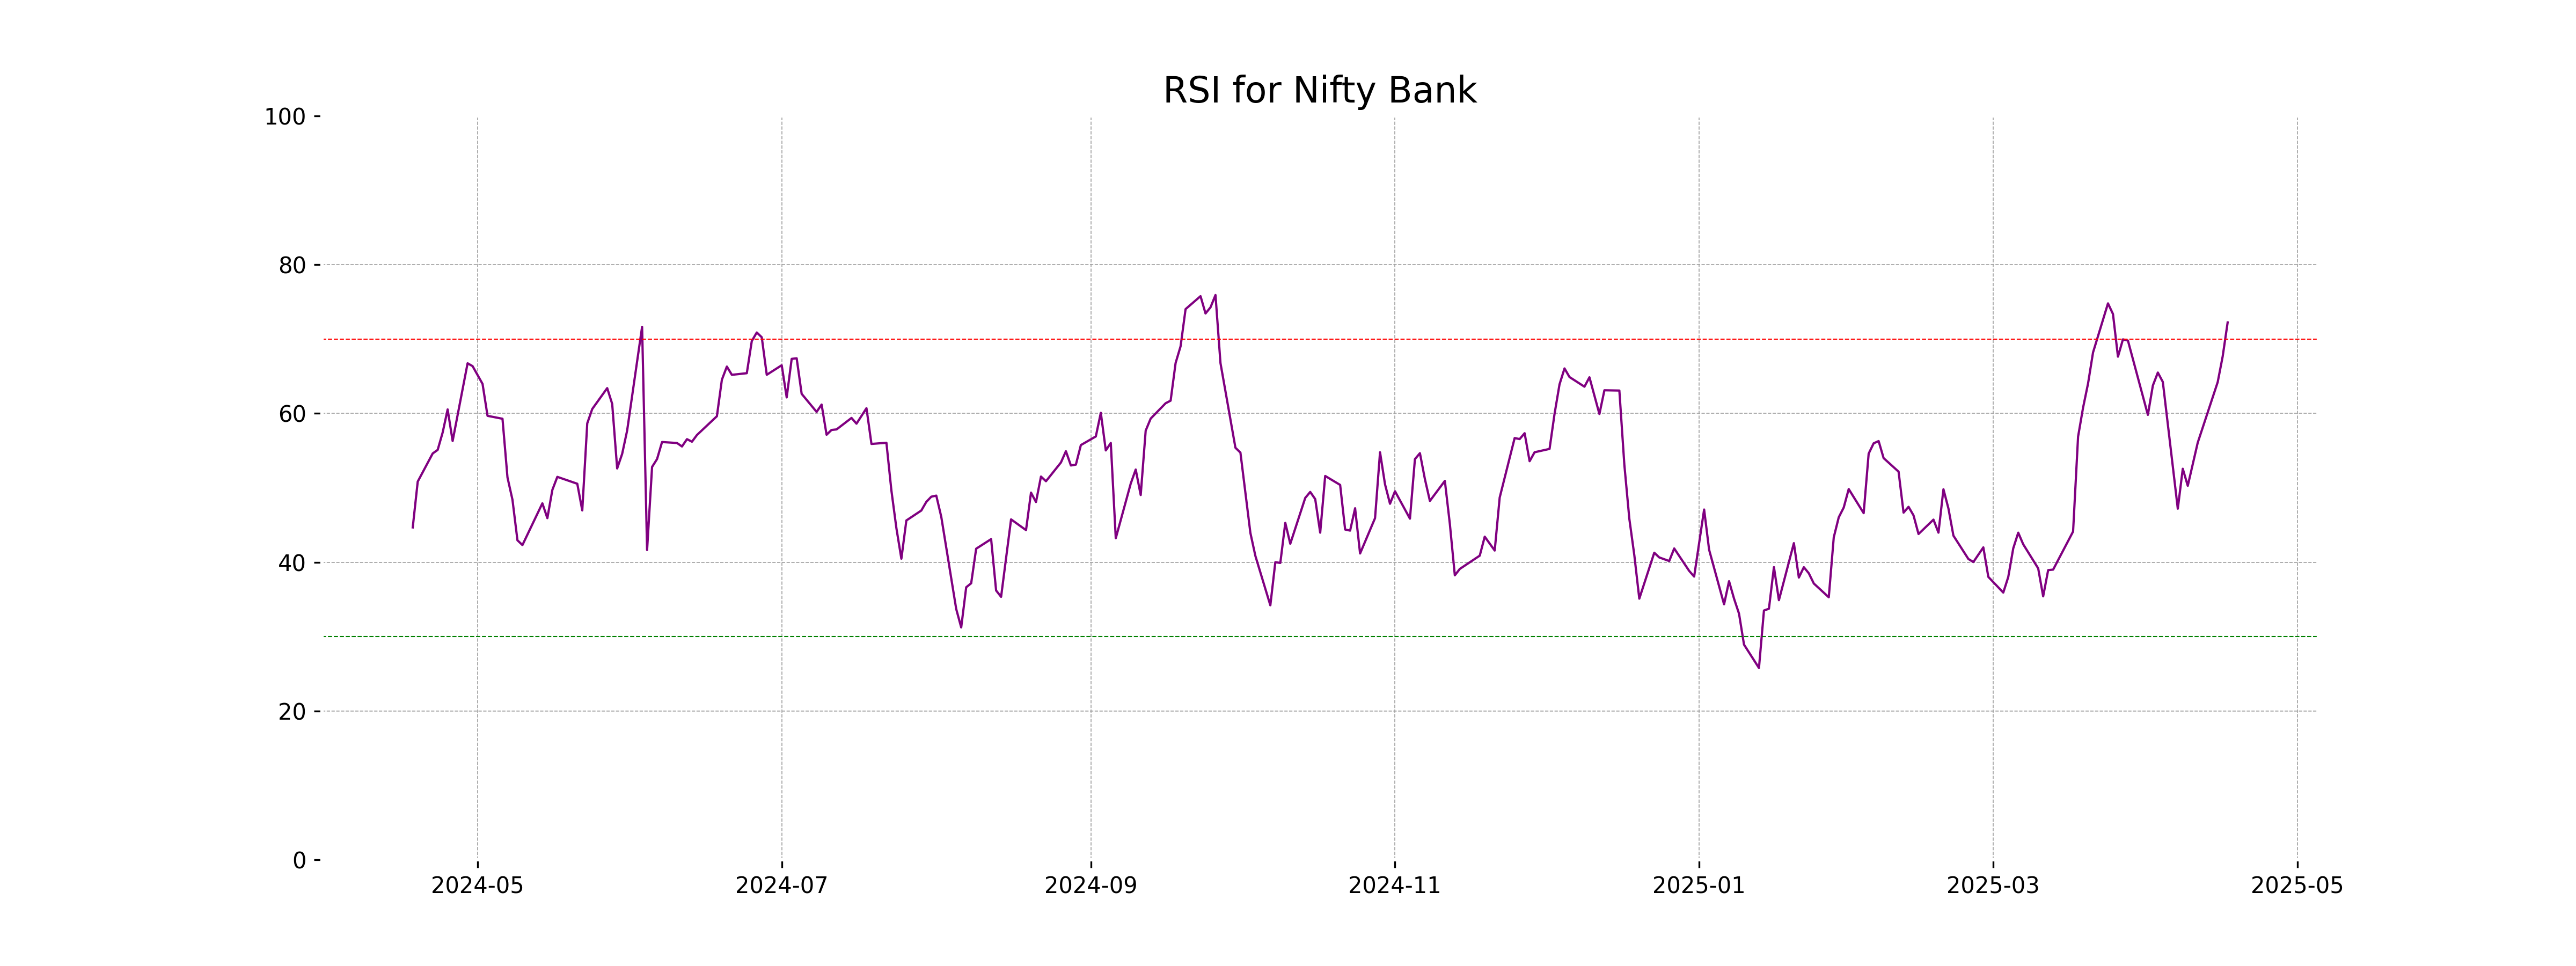
RSI Analysis
The RSI (Relative Strength Index) for Nifty Bank is currently at 72.24, which indicates that the stock is in the overbought territory. This suggests that the stock may be due for a price correction or consolidation if buying momentum decreases.
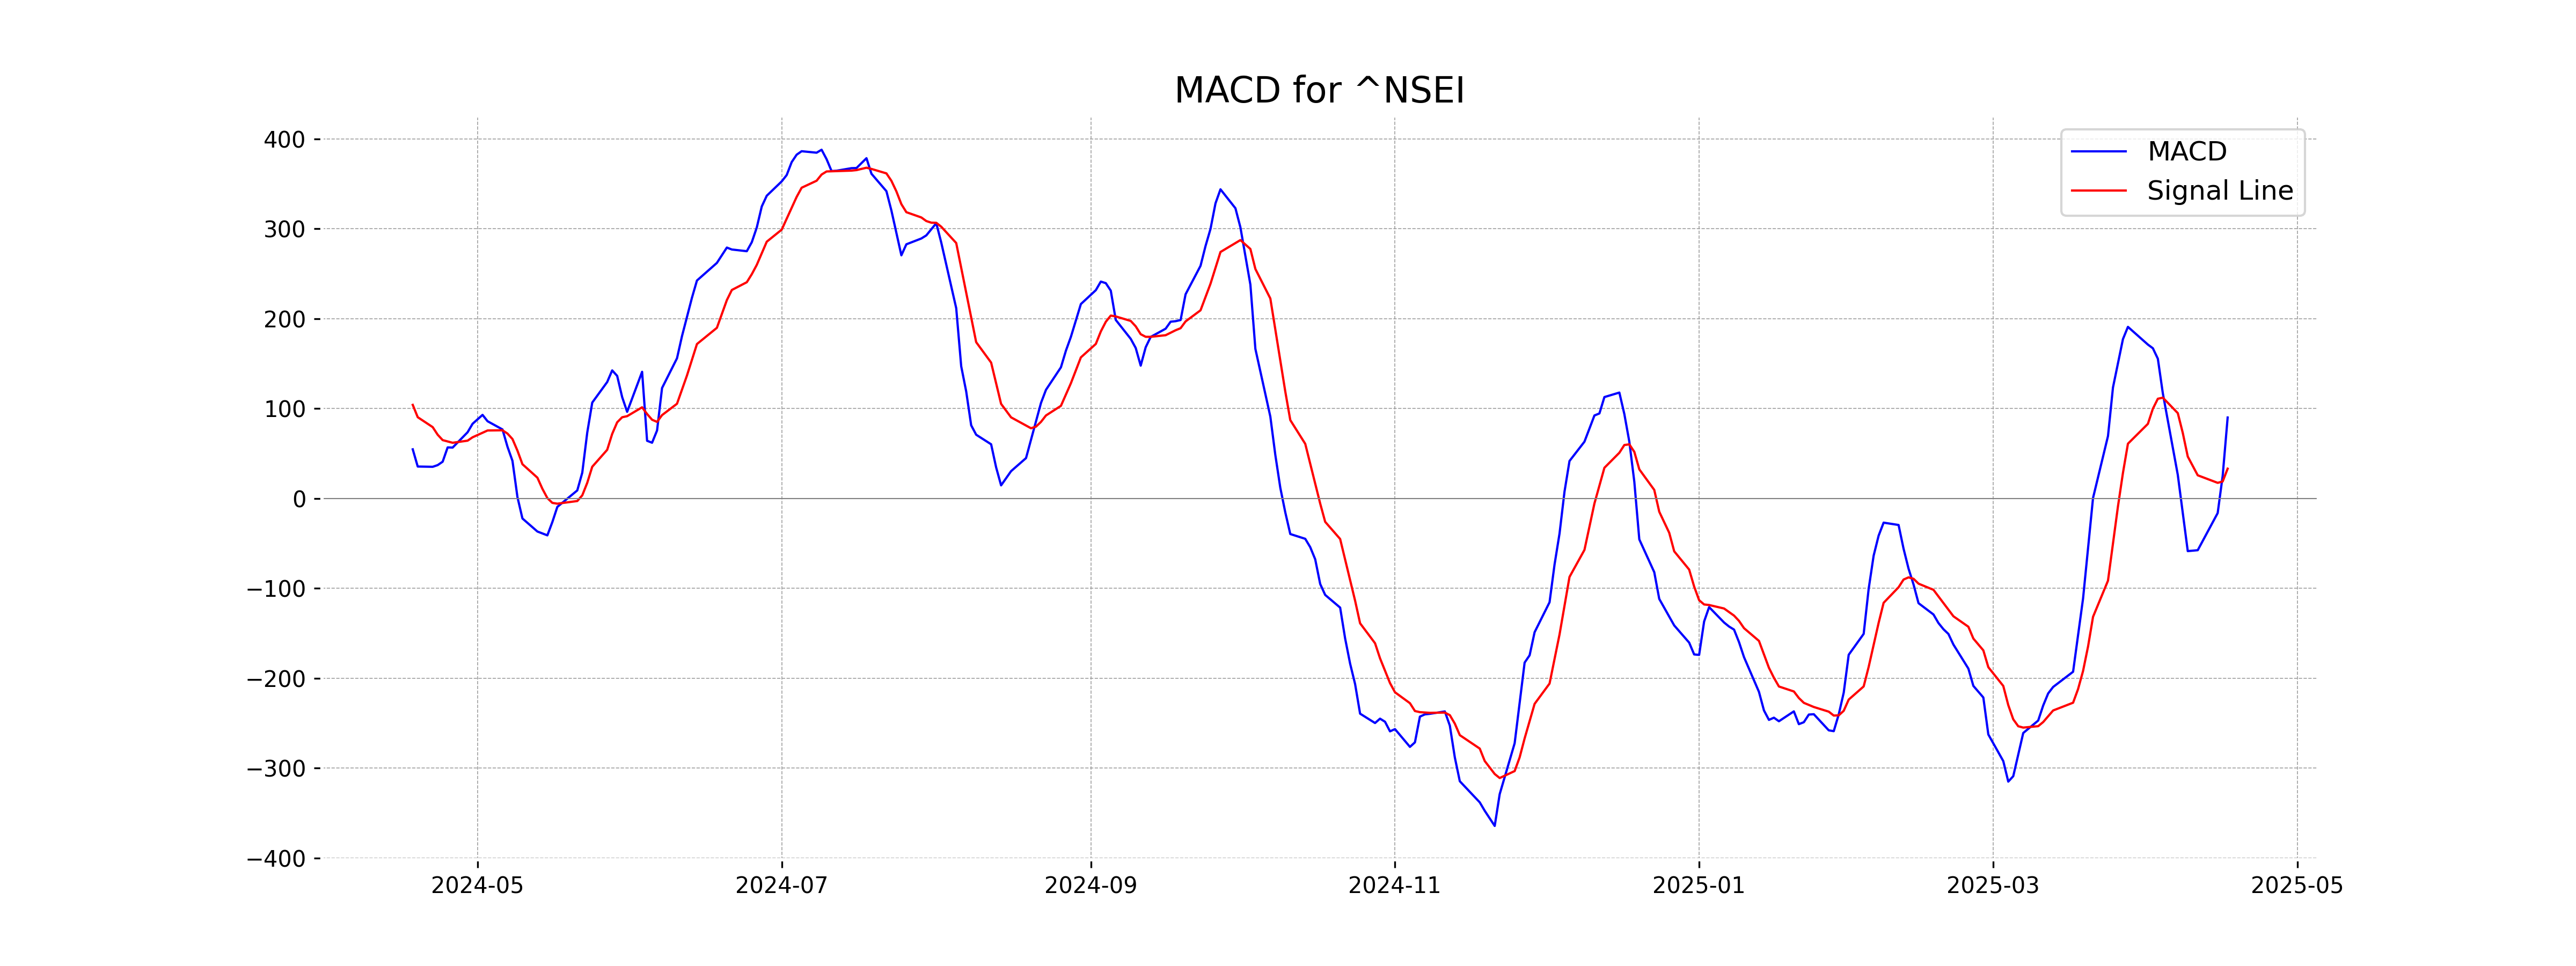
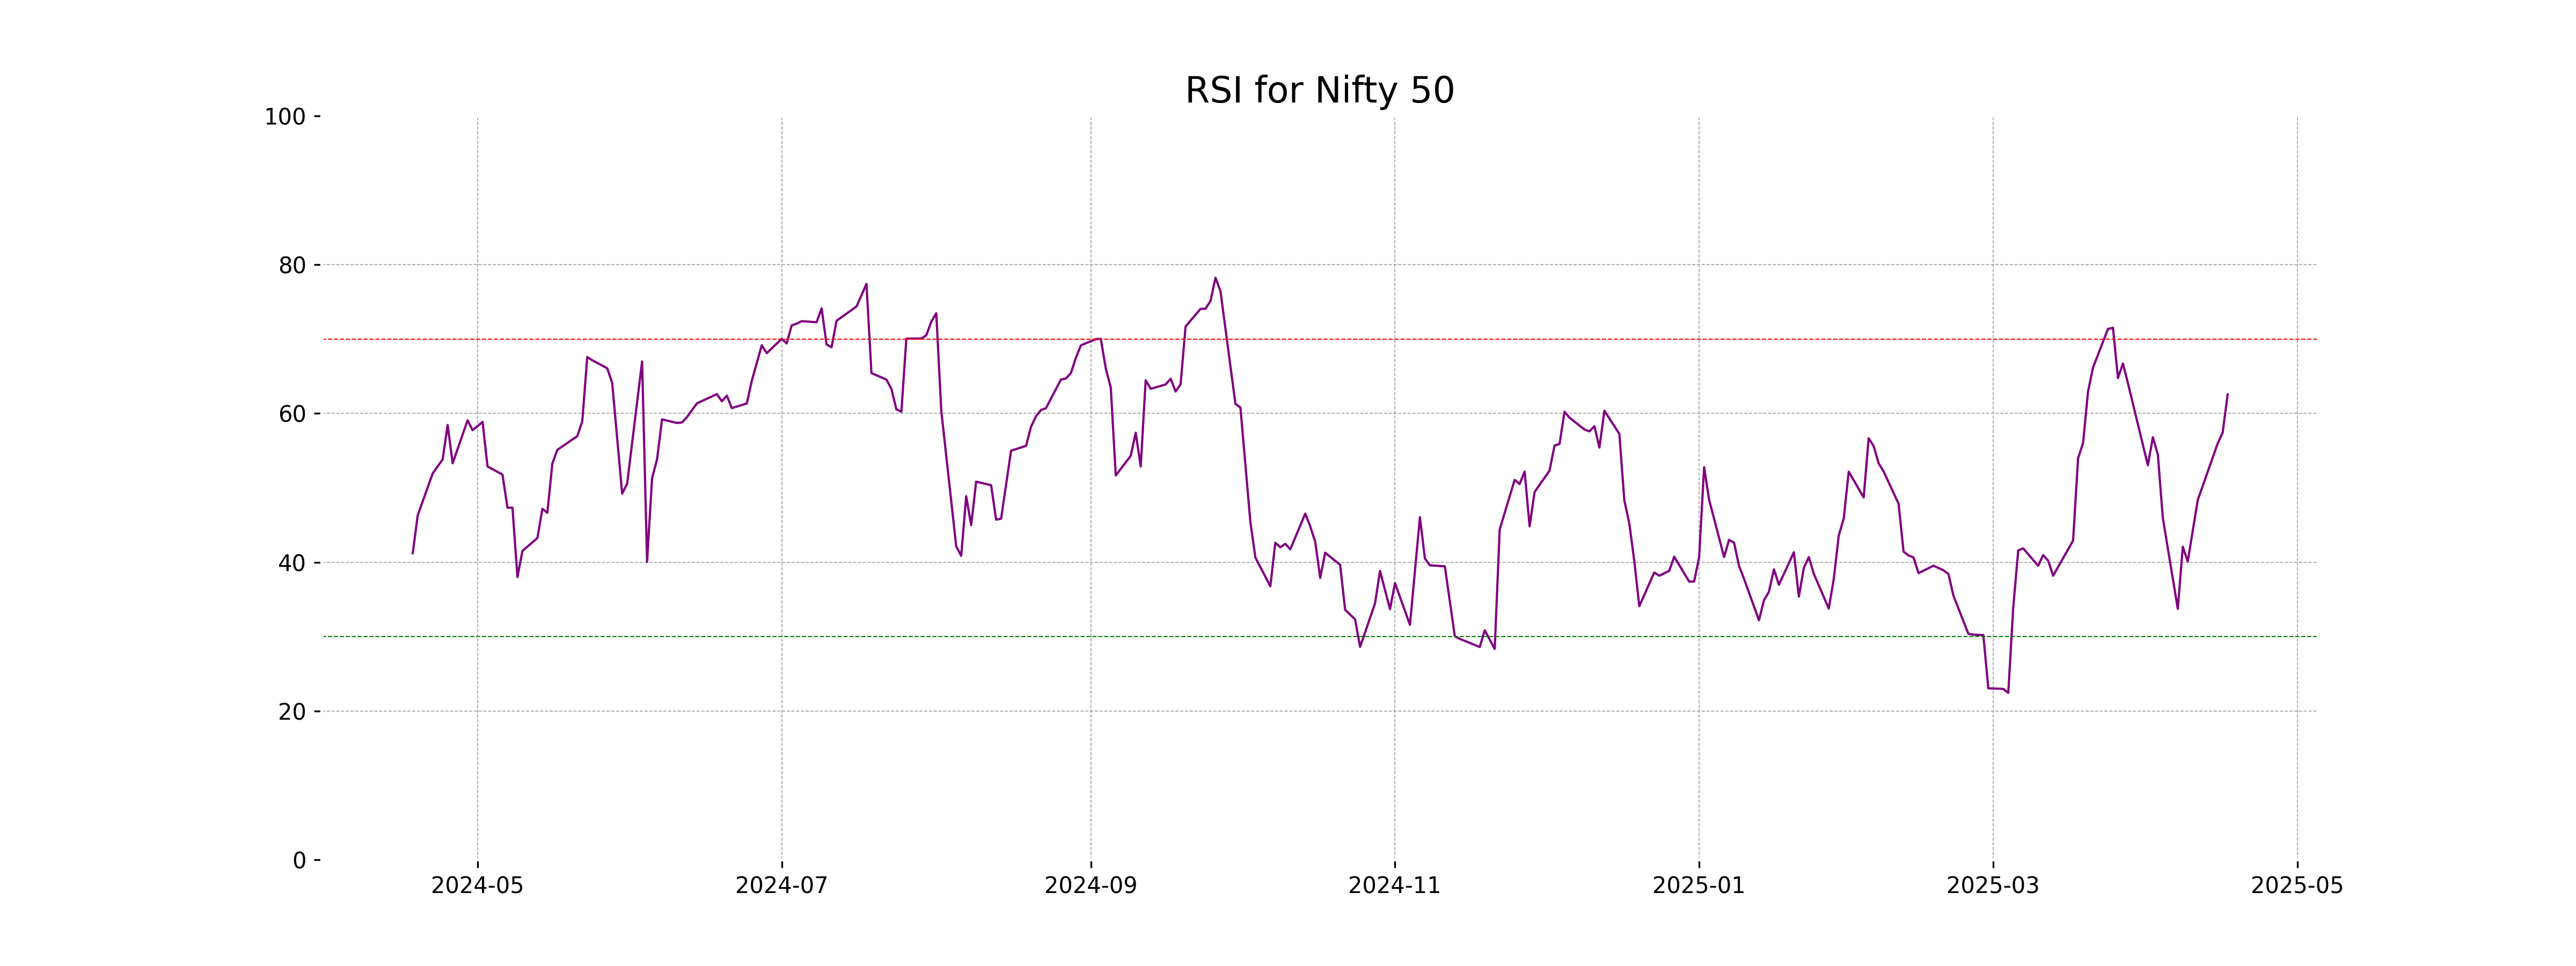
Analysis for Nifty 50 - April 17, 2025
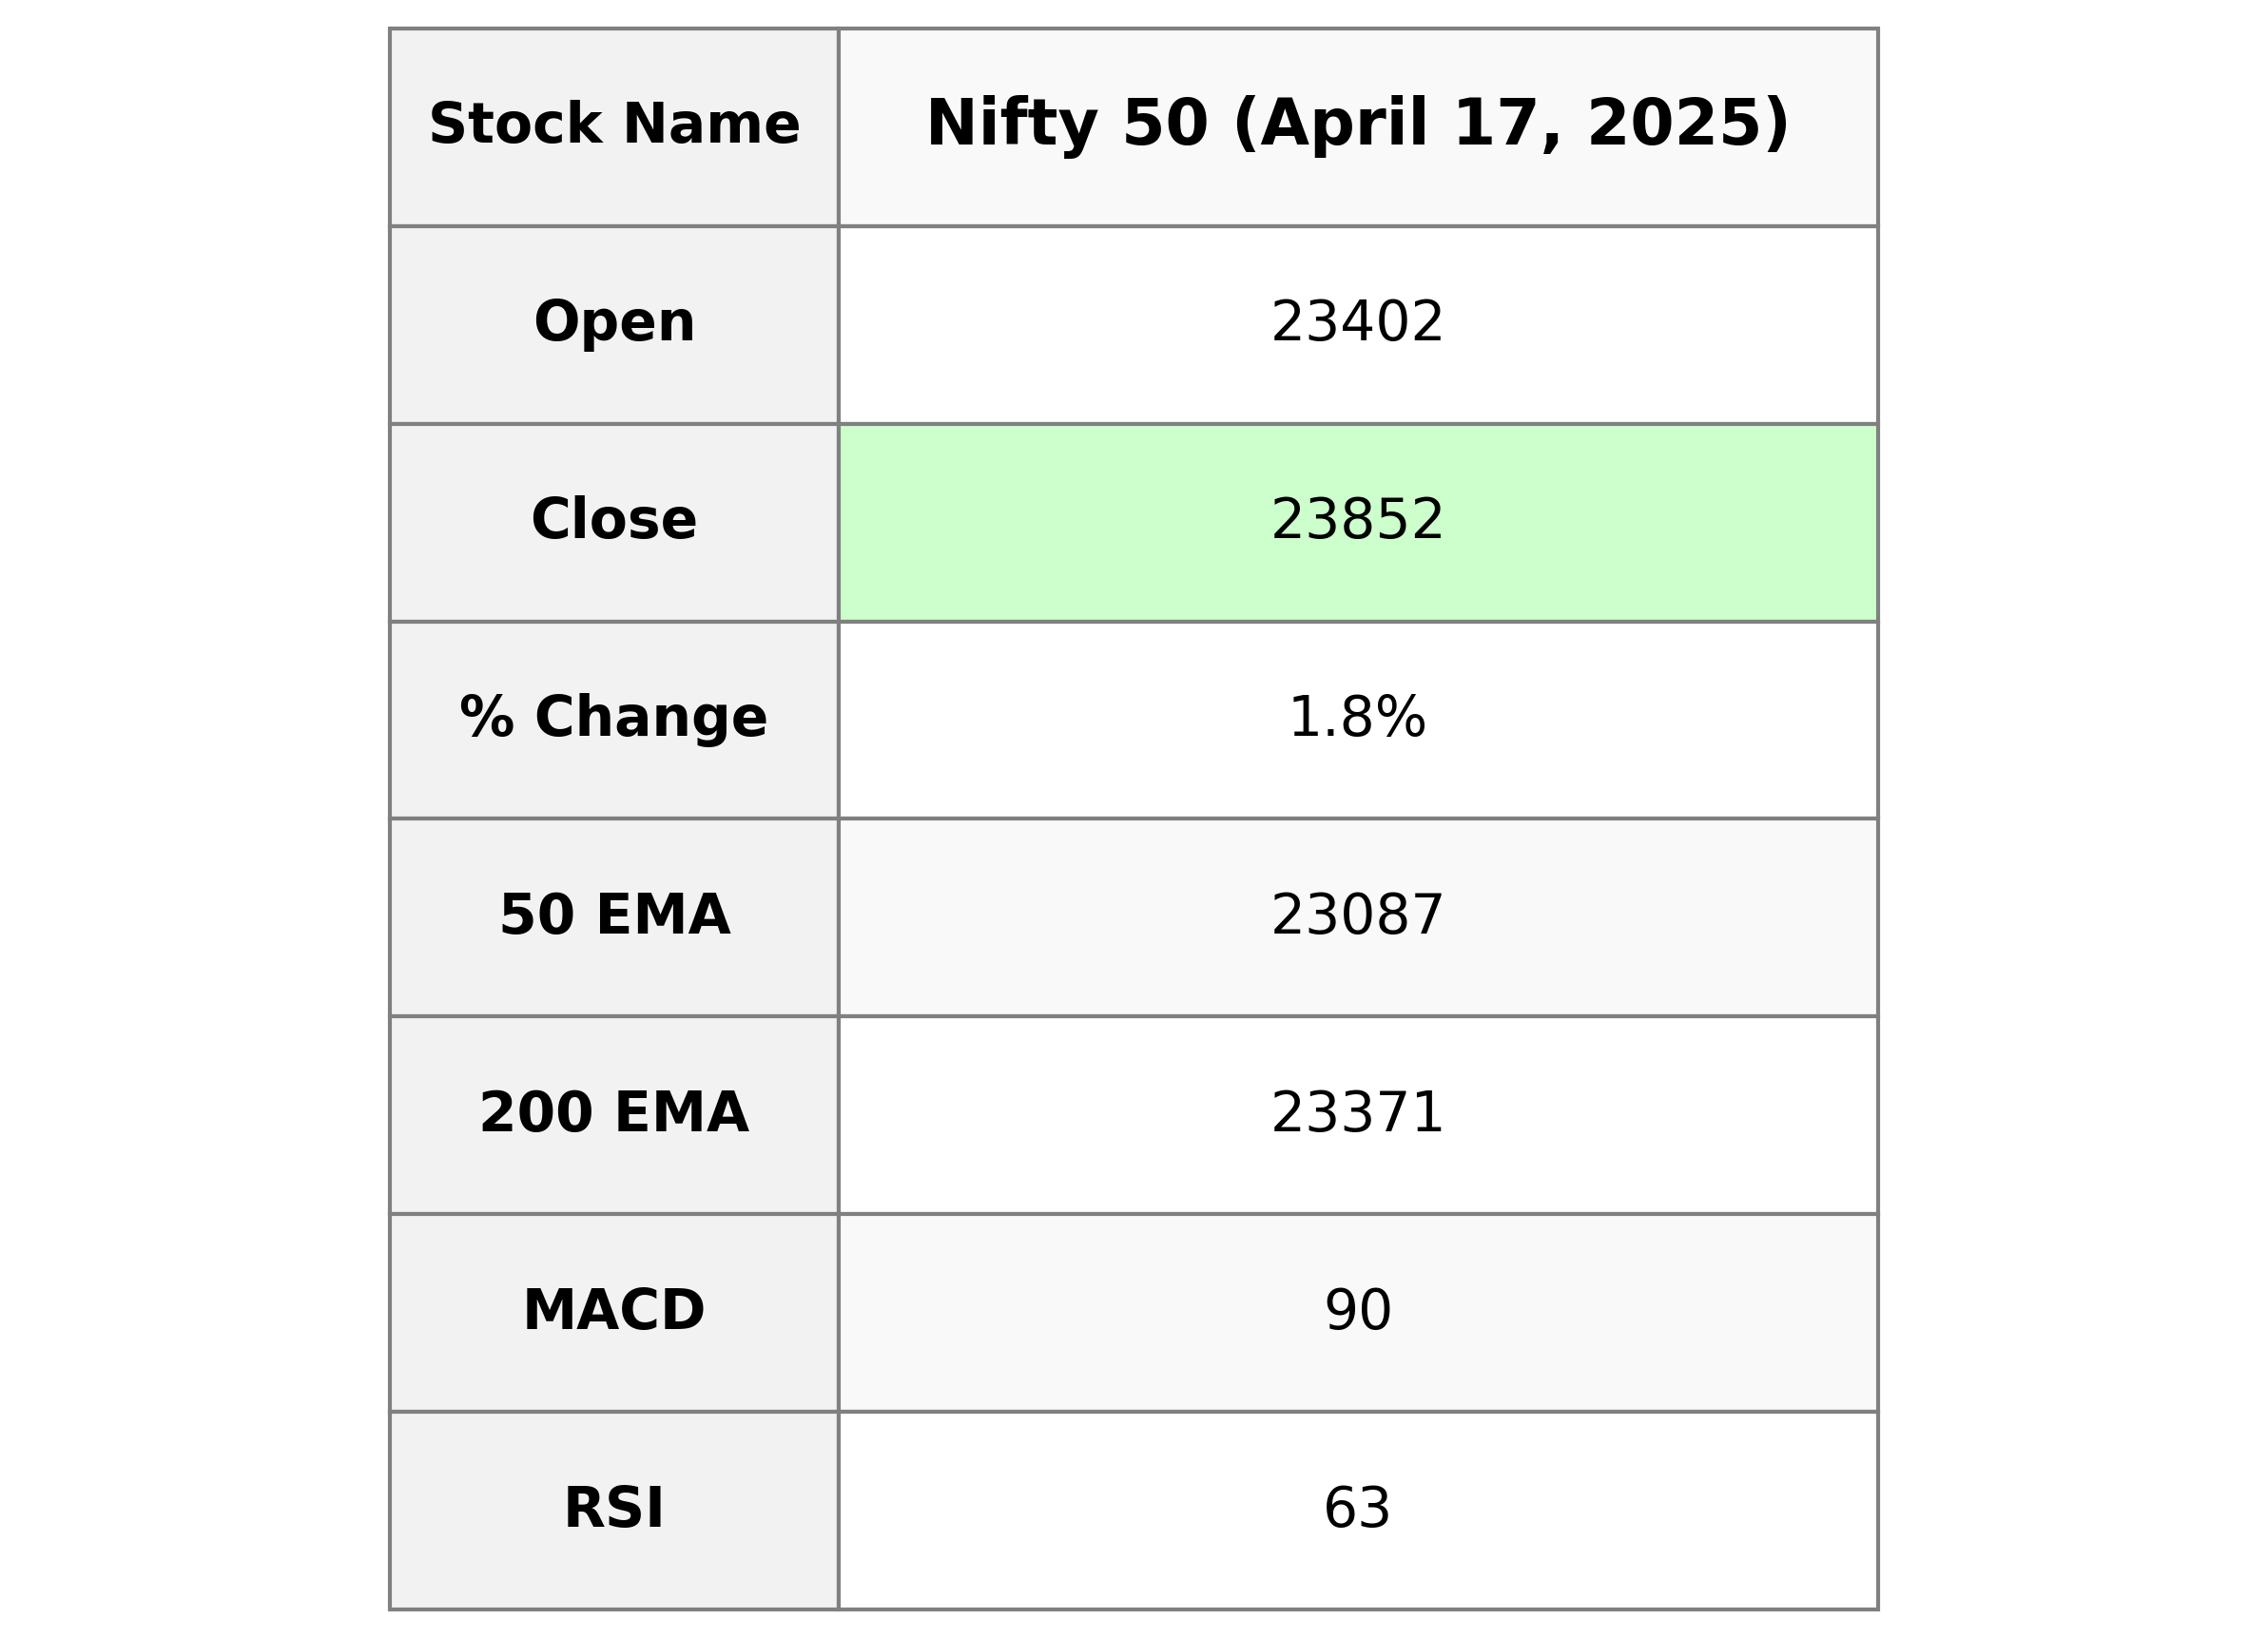
The Nifty 50 opened at 23,401.85 and closed higher at 23,851.65, with a gain of 414.45 points or a 1.77% increase from the previous close of 23,437.20. The index experienced a high of 23,872.35 and a low of 23,298.55 during the trading session. With an RSI of 62.56, the index shows bullish momentum, supported by a MACD value of 90.10, indicating strong upward momentum compared to the signal line at 33.15.
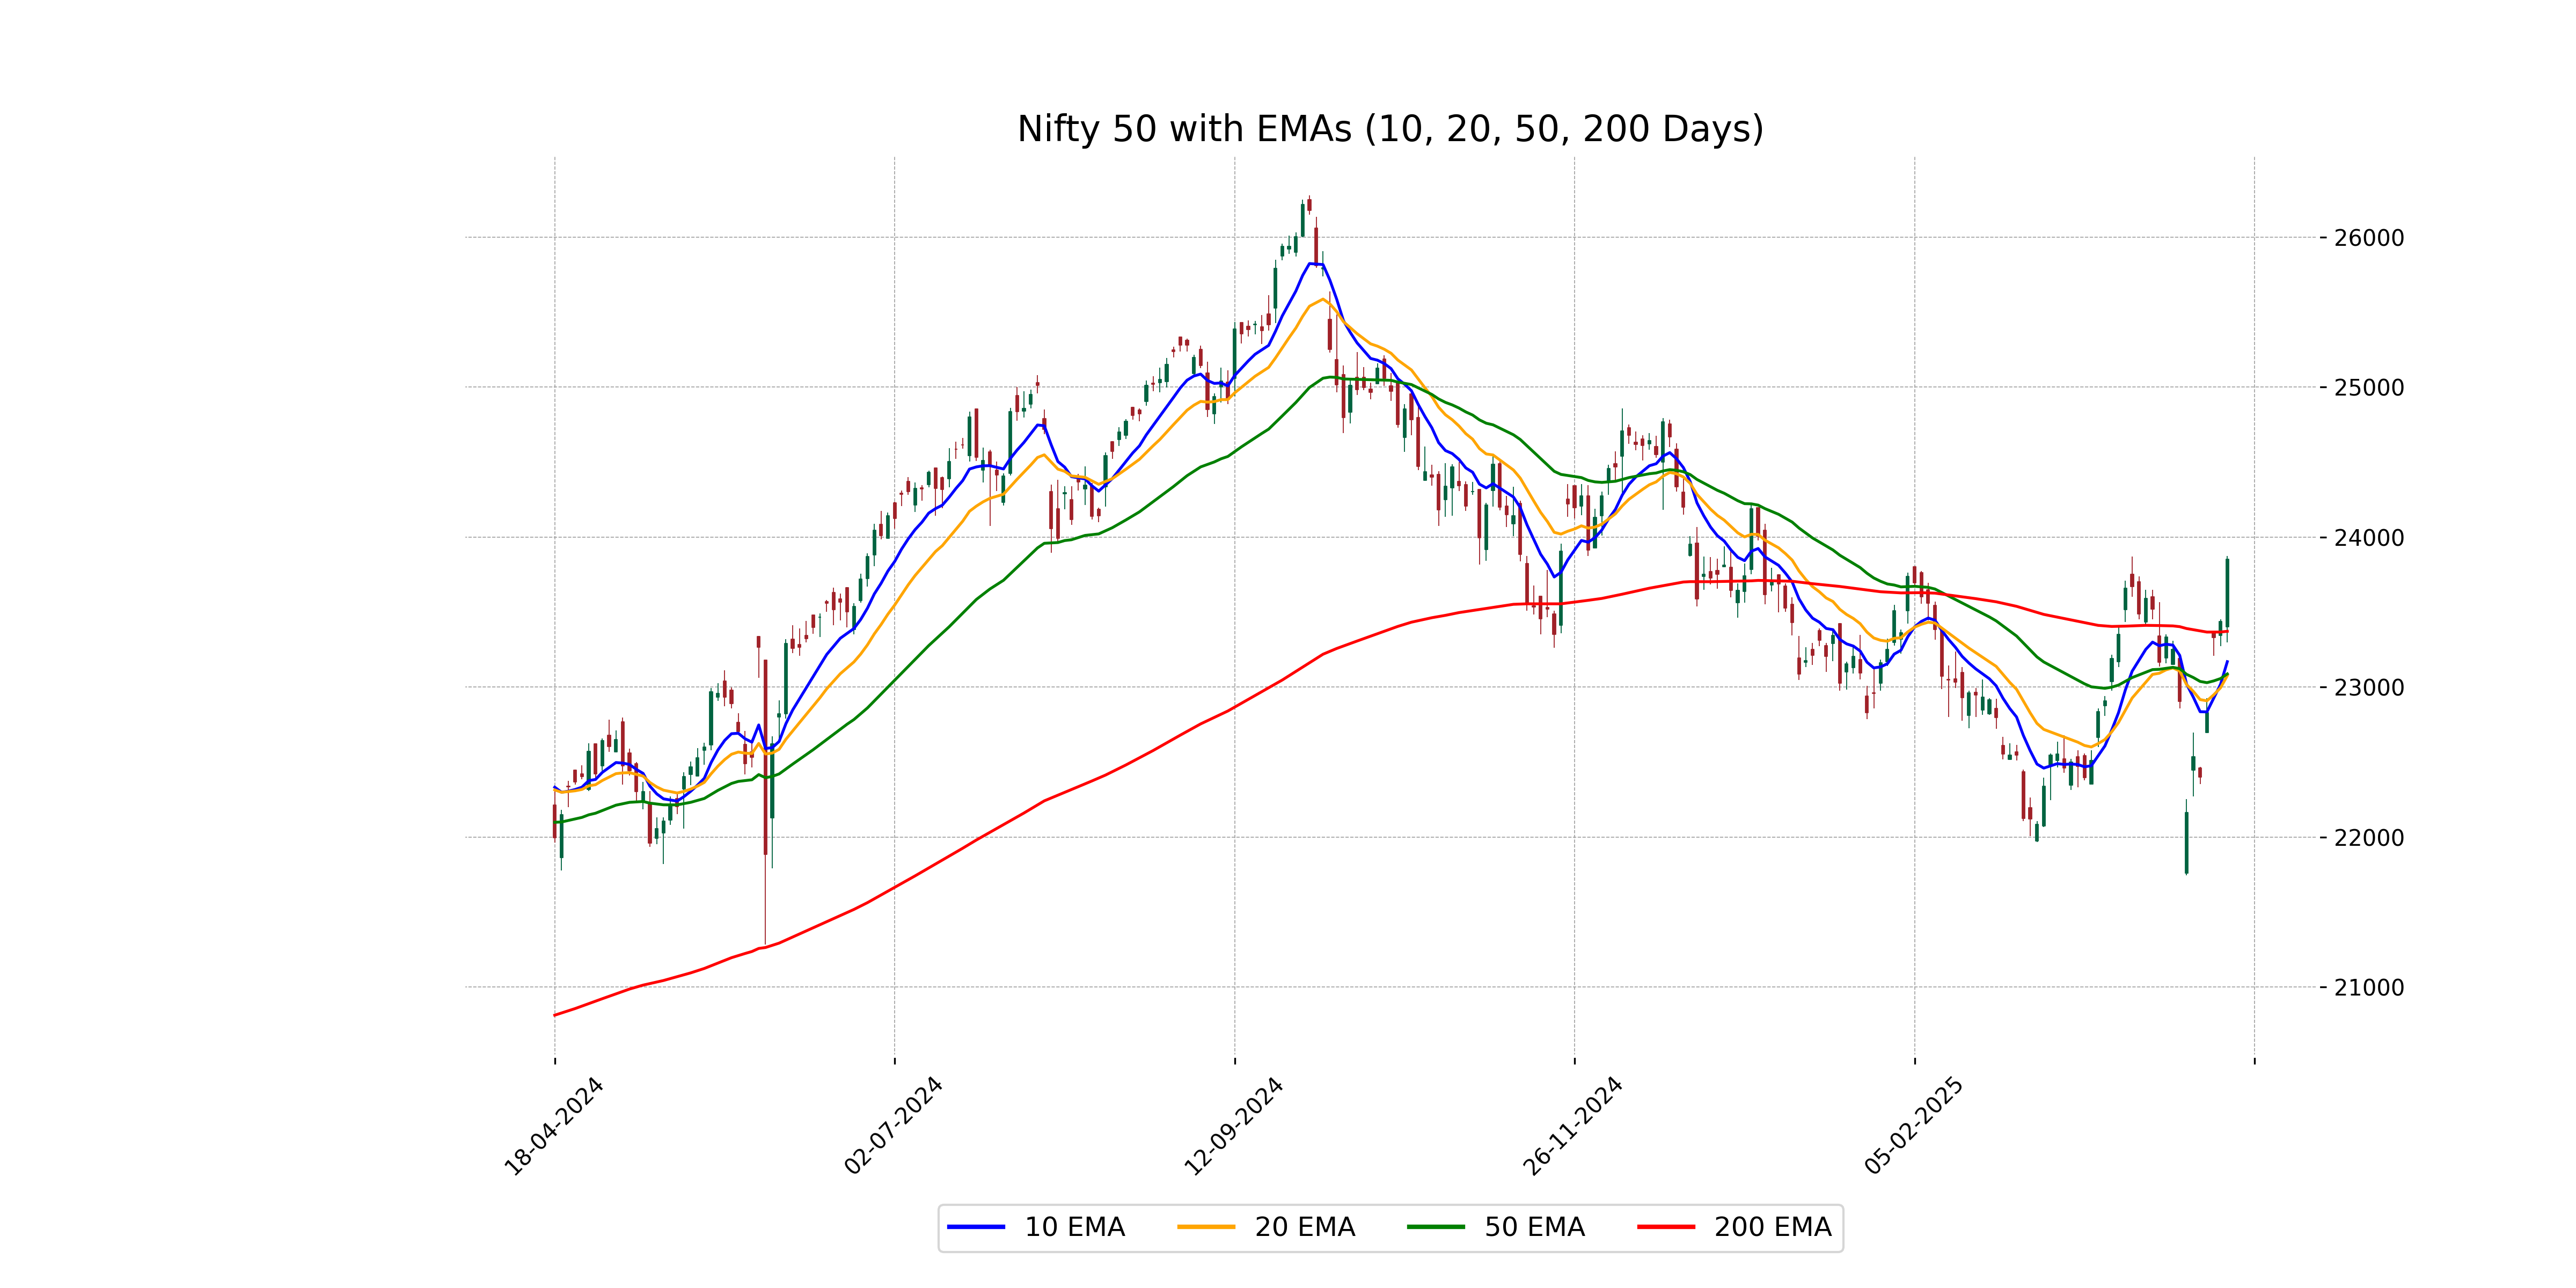
Relationship with Key Moving Averages
The closing price of Nifty 50 at 23851.65 is above all the key moving averages: the 50-day EMA at 23087.37, the 200-day EMA at 23371.40, the 10-day EMA at 23168.94, and the 20-day EMA at 23076.10, indicating a bullish trend. The RSI at 62.56 also supports positive momentum.
Moving Averages Trend (MACD)
MACD analysis for Nifty 50 indicates bullish momentum as the MACD line (90.10) is above the Signal line (33.15). This suggests potential upward movement in the price. However, traders should consider other indicators for confirmation.
RSI Analysis
Based on the stock data for Nifty 50, the RSI value is 62.56, which indicates a moderately strong momentum in the market. As it is below 70, the index is not in an overbought zone, suggesting there is room for potential upward movement without immediate overbought concerns.
Up Next
Global stock market indices: How the world markets performed today - 17 April 2025

Honda Activa 6G: Everything You Need to Know Before Buying

How much does a ULIP plan really cost? A break-down of all charges

Centre plans to borrow Rs 8.20 lakh cr from market in first half of FY27

Reliance denies buying Iranian oil amid US sanctions waiver

Premium petrol price up Rs 2, industrial diesel up Rs 22; no change in normal petrol, diesel rates

More videos

India's GDP expected to register over 8 pc growth in Sep-Dec: Report

Govt announces seven measures to help boost exports

RBI keeps interest rates on hold after US trade deal boosts outlook

RBI proposes to compensate customers up to Rs 25,000 loss due to fraud

RBI raises GDP growth projection of Q1, Q2 of FY27

RBI pauses rate cuts, retains interest rate at 5.25 pc

Rupee jumps 122 paise to close at 90.27 against US dollar on India-US trade deal

Stock markets cheer India-US trade deal: Sensex, Nifty surge 2.5 pc

UPI transactions hit record high of Rs 230 lakh crore in 2025-26 till Dec: Govt

Explained: India-US trade deal, tariffs and trade benefits