


Highlights
- US indices tumble, signaling broader market weakness
- European markets trend bearish amid low RSI levels
- Asian indices show mixed movement, weak momentum persists
Latest news

Haier Launches HQLED P7 Pro Series TVs With Google Gemini, 50W Audio And AI Picture Enhancements

Nothing's Latest Pokémon Teasers Hint At New Hardware, RCB Collaboration May Also Be In The Works

OnePlus N6 Set To Debut With Massive 8,000mAh Battery And Long-Term Performance Focus

Roblox Introduces Age-Based Accounts for Younger Users, Expands Parental Controls Globally

IIFL Capital Launches Algo Marketplace with Over 100 Ready-Made Strategies

LUMIQ Raises INR 50 Crore Pre-Series B to Become the AI Decision Layer for Financial Services

Tay Keith, producer behind Travis Scott's 'Sicko Mode' dies at 29

GenAI could lift realty sales velocity by up to 50%, speed up launches by 30%: Report
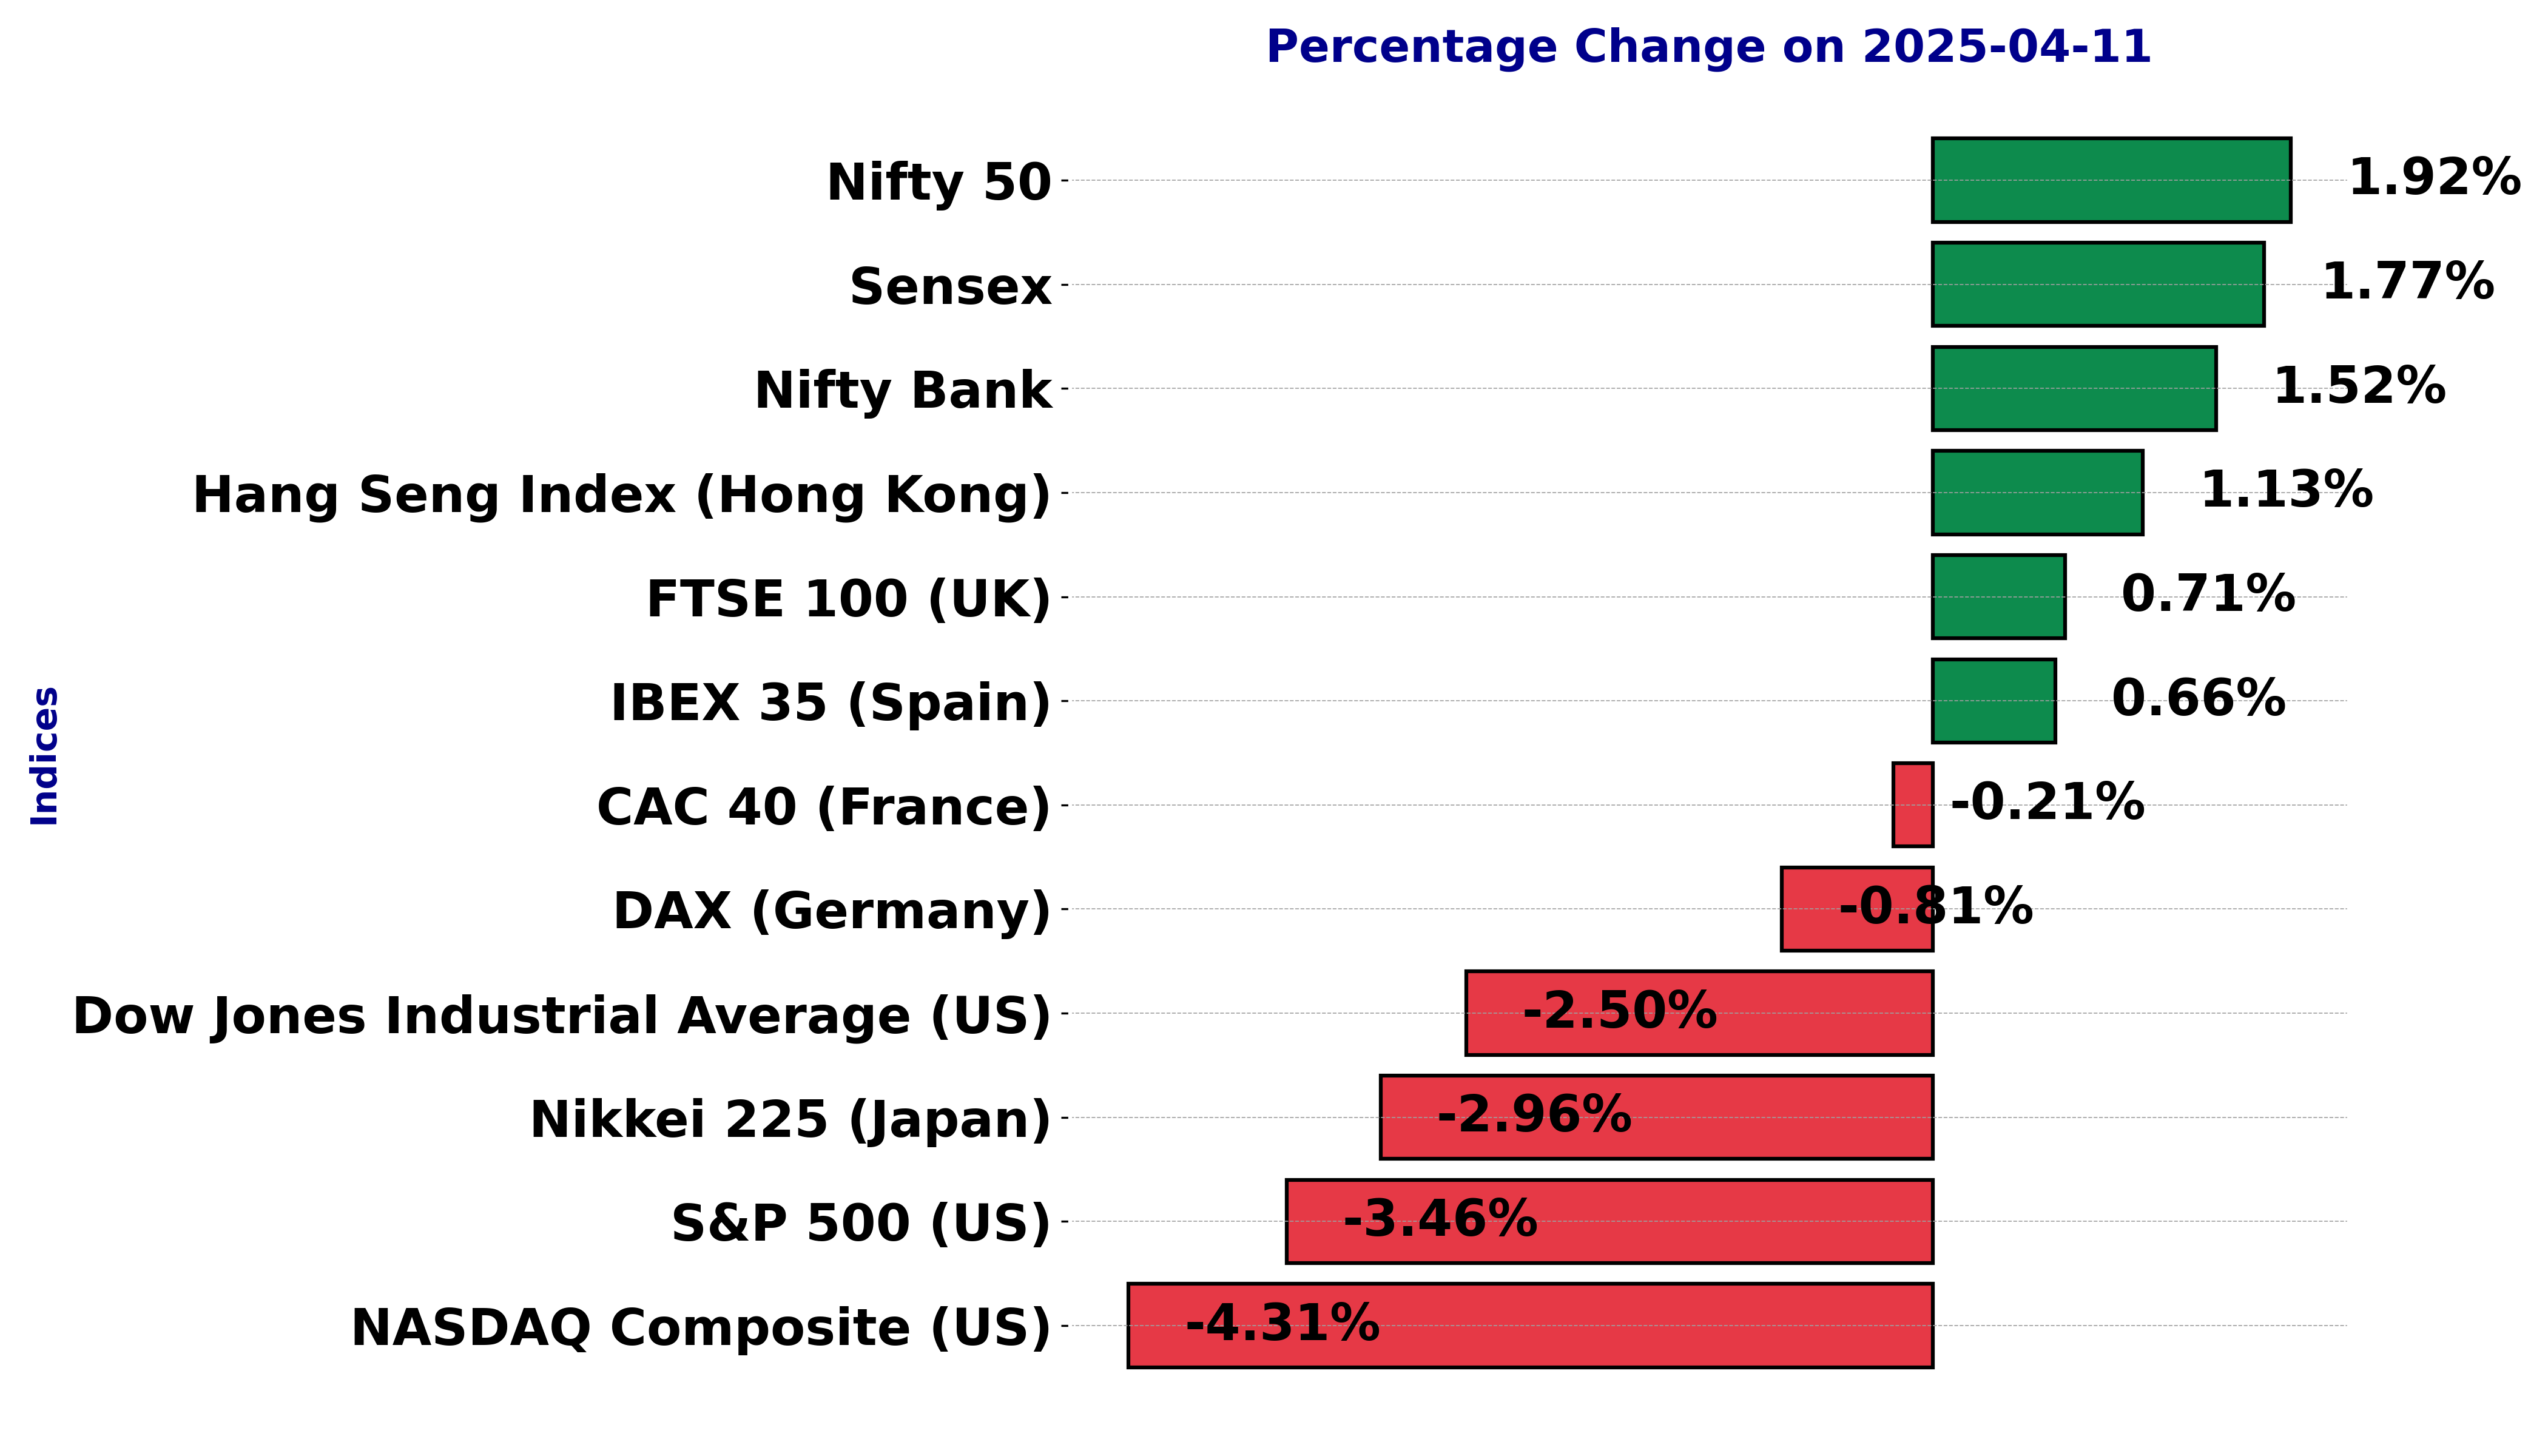
Global stock market indices: How the world markets performed today - 11 April 2025


The international stock market indices showed varied performances on April 11, 2025, reflecting the economic sentiment across different regions.
In this article, we analyze the performance of key global indices including the S&P 500, Dow Jones Industrial Average, NASDAQ Composite, FTSE 100, DAX, CAC 40, IBEX 35, Nikkei 225, Hang Seng, Nifty 50, and BSE Sensex.
Analysis for Sensex - April 11, 2025

Sensex opened at 74,835.49, closed at 75,157.26, marking a 1.77% increase from the previous close of 73,847.15, which is a points change of 1,310.11. The index had a high of 75,467.33 and a low of 74,762.84, and while no volume data is reported, the RSI stands at 47.99, indicating nearly balanced market momentum.

Relationship with Key Moving Averages
The Sensex closed at 75157.26, which is below both the 50-day EMA (75924.84) and the 200-day EMA (77015.69), indicating a potential bearish trend. However, it is slightly above the 10-day EMA (75176.45) but below the 20-day EMA (75443.52), suggesting short-term indecision.
Moving Averages Trend (MACD)
The MACD for the Sensex is -235.20, which is below the MACD Signal of 17.12, suggesting a bearish momentum. This indicates that the recent stock movement might be heading towards a downward trend.

RSI Analysis
The Relative Strength Index (RSI) for Sensex is at 47.99, which is typically considered a neutral level, indicating that the index is neither overbought nor oversold. An RSI below 30 often indicates an oversold condition, while an RSI above 70 indicates an overbought condition. Currently, Sensex is in a relatively balanced state.

Analysis for Dow Jones Industrial Average (US) - April 11, 2025

The Dow Jones Industrial Average (US) opened at 39,996.93 and closed at 39,593.66, experiencing a drop of 1,014.79 points, which corresponds to a -2.50% change from the previous close of 40,608.45. The index traded between a high of 39,996.93 and a low of 38,427.70, and the 14-day RSI indicates a reading of 41.07, suggesting relatively weak momentum. The MACD value is -937.92 compared to the signal line value of -733.85, which may indicate a bearish trend.

Relationship with Key Moving Averages
The Dow Jones Industrial Average is trading below its key moving averages, with the current close of 39593.66 under the 50 EMA of 41995.56, the 200 EMA of 41848.29, the 10 EMA of 40056.09, and the 20 EMA of 40848.37. This indicates a bearish trend in the market as it remains beneath these significant support levels.
Moving Averages Trend (MACD)
The Dow Jones Industrial Average's MACD value of -937.92 compared to its MACD Signal of -733.85 indicates a bearish momentum. The negative divergence suggests a potential continuation of the downward trend.

RSI Analysis
RSI Analysis for Dow Jones Industrial Average (US): The Relative Strength Index (RSI) stands at 41.07, indicating that the index is approaching an oversold condition but is not yet in the oversold range below 30. This suggests moderate bearish momentum.

Analysis for CAC 40 (France) - April 11, 2025

CAC 40 (France) Performance Summary: The CAC 40 index opened at 7191.48 and closed at 7111.04, experiencing a decline of 0.21%. The index witnessed a downward movement with a points change of -14.98. Notably, the RSI indicates oversold conditions at 33.85, while the MACD suggests bearish momentum.

Relationship with Key Moving Averages
The CAC 40 index is trading below its key moving averages with the current close at 7111.04, which is below the 10 EMA (7309.36), 20 EMA (7552.63), 50 EMA (7749.30), and 200 EMA (7673.01). This indicates a bearish trend in the index.
Moving Averages Trend (MACD)
The MACD for CAC 40 (France) is -261.92, which is below its signal line of -171.99, indicating a bearish trend. With the RSI at 33.85, the index appears to be in the oversold territory, suggesting possible downward momentum might continue.

RSI Analysis
The Relative Strength Index (RSI) for the CAC 40 stands at approximately 33.85, indicating that the index is nearing the oversold territory. This suggests that there may be potential for a price reversal or a buying opportunity, as RSI values below 30 generally signify oversold conditions.

Analysis for FTSE 100 (UK) - April 11, 2025

FTSE 100 closed at 7969.36 after opening at 7913.25, with a percentage gain of 0.71% and a points increase of 56.06. The Relative Strength Index (RSI) is at 36.65, indicating a weak momentum, and the MACD is negative, showing a bearish trend.

Relationship with Key Moving Averages
The FTSE 100 closed at 7969.36, positioning it below the 50-day EMA of 8450.31 and the 200-day EMA of 8333.77, indicating a potential bearish trend. The index is also below the 10-day EMA of 8095.94 and the 20-day EMA of 8290.18, reinforcing short-term downward momentum.
Moving Averages Trend (MACD)
FTSE 100 (UK) MACD Analysis: The MACD is currently at -207.25, which is below the MACD Signal line of -130.58, indicating a bearish trend. This suggests there might be continued downward momentum in the price movement, warranting caution for potential buyers.

RSI Analysis
Relative Strength Index (RSI) Analysis for FTSE 100 (UK): The RSI for FTSE 100 is 36.65, which indicates that the index is approaching oversold territory. Typically, an RSI below 30 is considered oversold, suggesting that the index may be undervalued at current levels.

Analysis for DAX (Germany) - April 11, 2025

DAX (Germany) Performance: The DAX index opened at 20,787.06 and closed at 20,396.76, marking a change of -0.81% or a drop of 165.97 points. The recent closing is below its 200-day EMA of 20,336.52, indicating potential bearish trends. Additionally, the RSI at 37.60 suggests moderately oversold conditions.

Relationship with Key Moving Averages
The DAX (Germany) closed at 20396.76, below its 50 EMA of 21810.09 and 10 EMA of 20906.40, indicating potential bearish momentum. However, it remains above the 200 EMA of 20336.52, suggesting some underlying long-term support.
Moving Averages Trend (MACD)
MACD Analysis for DAX (Germany): The MACD for DAX is -629.72, which is below the MACD Signal value of -368.04, indicating a bearish trend. This suggests that the momentum is currently decreasing, as the negative MACD Line is diverging away from the signal line.

RSI Analysis
The Relative Strength Index (RSI) for DAX (Germany) is 37.60, suggesting that it is in the lower range, typically associated with potential oversold conditions. This may indicate that the index is approaching a level where a rebound or stabilization could occur, though market conditions should be monitored for confirmation.

Analysis for S&P 500 (US) - April 11, 2025

The S&P 500 (US) opened and hit a high of 5353.15, experienced a low of 5115.27, and closed at 5268.05, marking a decrease from the previous close of 5456.90. The index saw a decline of approximately 3.46%, with a points change of -188.85. The trading volume was 6.68 billion, and technical indicators show a 50 EMA of 5677.02, RSI at 40.61, and MACD at -154.32, indicating bearish momentum.

Relationship with Key Moving Averages
S&P 500 (US) closed well below its key moving averages, with the close at 5268.05 significantly under the 50 EMA, 200 EMA, and 20 EMA, which stand at 5677.02, 5673.42, and 5480.75 respectively. The 10 EMA is the closest at 5352.43, but it still indicates the index is trending lower.
Moving Averages Trend (MACD)
The MACD for the S&P 500 indicates bearish momentum, as the MACD line at -154.32 is below the Signal line at -124.98. This suggests that selling pressure might be increasing in the market.

RSI Analysis
The RSI for S&P 500 is currently at 40.61, indicating a relatively weak momentum and suggesting the index is closer to being oversold. Values below 30 typically indicate oversold conditions, while values above 70 suggest overbought conditions.

Analysis for Hang Seng Index (Hong Kong) - April 11, 2025

The Hang Seng Index (Hong Kong) opened at 20,557.49, reaching a high of 21,127.37 and a low of 20,444.04, before closing at 20,914.69, reflecting a positive change of 1.13% from the previous close. The index shows a bearish signal as indicated by the negative MACD value of -661.88, while the RSI of 36.29 suggests it may be approaching oversold conditions.
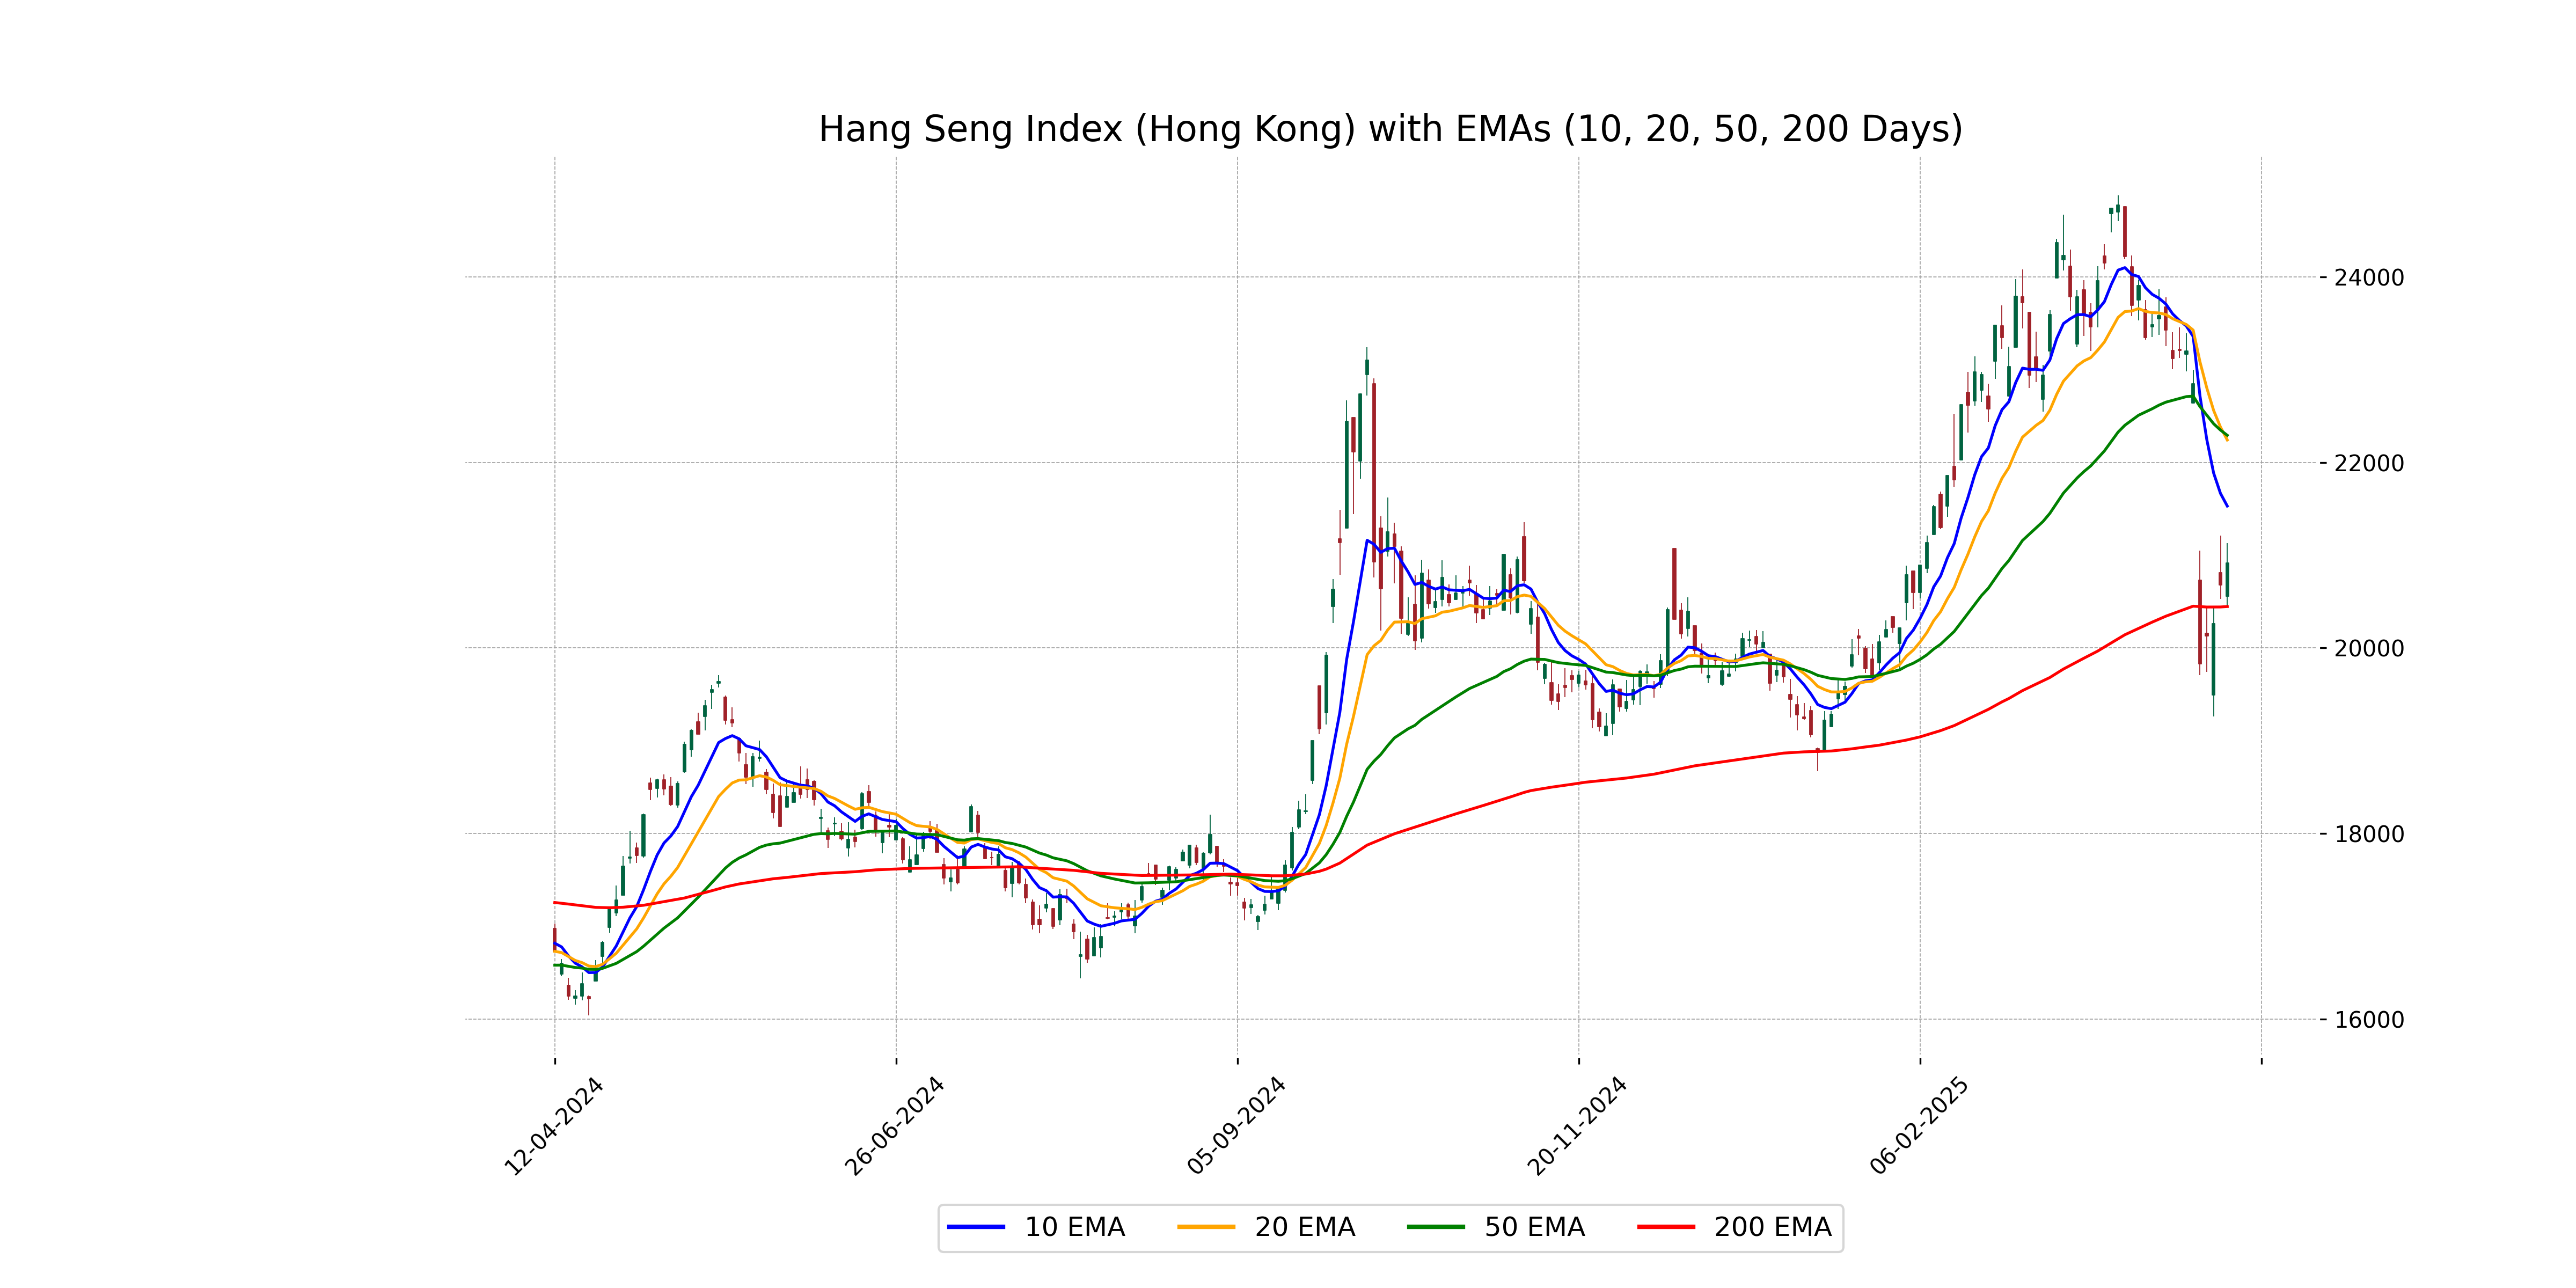
Relationship with Key Moving Averages
The Hang Seng Index (Hong Kong) current close at 20914.69 is trading below its 50 EMA of 22291.61 and 10 EMA of 21529.20, indicating a bearish sentiment. However, the close is above the 200 EMA of 20446.73, suggesting a potential support level. The technical indicators show negative MACD, reinforcing the bearish trend.
Moving Averages Trend (MACD)
MACD Analysis for Hang Seng Index (Hong Kong): The MACD line is at -661.88, while the signal line is at -273.72. This negative MACD value, being lower than the signal line, suggests a bearish sentiment in the market.

RSI Analysis
Based on the provided stock data, the RSI for Hang Seng Index (Hong Kong) is 36.29, which is below the typical neutral level of 50. This suggests that the index is moving towards an oversold condition, indicating potential bearish momentum.

Analysis for IBEX 35 (Spain) - April 11, 2025

The IBEX 35 (Spain) closed at 12,388.30, registering a 0.66% increase from the previous close. Despite this gain, the index remains below key moving averages like the 50 EMA (12,766.50) and 10 EMA (12,493.36), reflecting potential bearish momentum as indicated by an RSI of 42.53 and a negative MACD.

Relationship with Key Moving Averages
For the IBEX 35, the current closing price of 12,388.30 is below the 10 EMA of 12,493.36, the 20 EMA of 12,738.30, and the 50 EMA of 12,766.50. However, it is above the 200 EMA of 11,996.71, indicating a potential short-term bearish trend but still maintaining a long-term bullish position.
Moving Averages Trend (MACD)
The IBEX 35 exhibits a bearish momentum as indicated by a MACD value of -231.25, which is below the MACD Signal line at -100.29. This suggests that the index is in a downtrend or experiencing ongoing selling pressure.

RSI Analysis
``` The RSI value for IBEX 35 (Spain) is 42.53, indicating that the index is in the neutral range, suggesting no immediate overbought or oversold conditions. Traders might consider monitoring for any movements towards the extreme ends of the RSI scale for potential trading signals. ```

Analysis for NASDAQ Composite (US) - April 11, 2025

The NASDAQ Composite (US) experienced a significant decline, with a close at 16387.31, showing a decrease of -4.31% or -737.66 points from the previous close. The index's trading range was between a high of 16712.37 and a low of 15894.27, with a substantial trading volume of 11.86 billion. The technical indicators reveal a bearish sentiment, with the RSI at 41.62 suggesting potential overselling, and the MACD indicates a negative trend divergence.

Relationship with Key Moving Averages
Relationship with Key Moving Averages for NASDAQ Composite (US): The NASDAQ Composite's current close of 16,387.31 is below its 10 EMA of 16,608.05, 20 EMA of 17,083.86, 50 EMA of 17,938.58, and 200 EMA of 18,093.53, indicating a bearish trend as the index trades under all its key moving averages.
Moving Averages Trend (MACD)
NASDAQ Composite (US) is currently exhibiting a bearish trend as indicated by the MACD value of -601.71, which is below the MACD Signal of -533.88. This suggests downward momentum and potential continued weakness in the short term.

RSI Analysis
The RSI value for the NASDAQ Composite is 41.62, which suggests that the index is approaching an oversold condition but is not yet in the oversold territory. An RSI below 30 typically indicates oversold conditions, while a value above 70 would suggest overbought conditions.

Analysis for Nikkei 225 (Japan) - April 11, 2025

Nikkei 225 (Japan) opened at 33,951.25, with a high of 33,953.29 and a low of 32,626.58, closing at 33,585.58. This marks a decrease of 2.96% from the previous close, amounting to a point change of -1,023.42. The RSI stands at 40.82, indicating potential bearish momentum, and the MACD value is below the signal line.

Relationship with Key Moving Averages
Nikkei 225 closed at 33,585.58, which is below its 50-day EMA of 36,714.25 and 200-day EMA of 37,755.32, indicating a bearish trend. The 10-day EMA (34,094.90) and 20-day EMA (35,168.53) are also above the current close, further supporting the bearish sentiment.
Moving Averages Trend (MACD)
The current MACD for Nikkei 225 (Japan) is at -1272.88, with the MACD Signal at -1028.27. This indicates that the MACD line is below the signal line, which is generally a bearish signal, suggesting continued downward momentum in the index.

RSI Analysis
RSI Analysis for Nikkei 225 (Japan): The Relative Strength Index (RSI) for Nikkei 225 is 40.82, indicating the market is nearing an oversold condition. This suggests potential buying opportunities could arise if the RSI continues to decline closer to or below 30.

Analysis for Nifty Bank - April 11, 2025

Nifty Bank opened at 50,634.10 and closed at 51,002.35, marking a 1.52% increase with a 762.20 points change from the previous close of 50,240.15. The RSI stands at 56.08, indicating a moderately strong momentum, while the MACD suggests that the stock may experience a slight downturn in the near term, as it is below the MACD signal line.

Relationship with Key Moving Averages
The Nifty Bank index closed at 51002.35, above its 50-day EMA of 50043.32 and 200-day EMA of 50055.27, indicating a positive short-term and long-term trend. However, it trades slightly above its 10-day EMA of 50744.52, suggesting recent upward momentum.
Moving Averages Trend (MACD)
MACD Analysis for Nifty Bank: The MACD value of 413.26 is below the MACD signal line of 483.66, indicating a bearish signal in the short-term momentum. This suggests that the Nifty Bank may face downward pressure if this trend continues.

RSI Analysis
The RSI (Relative Strength Index) for Nifty Bank is 56.08, which indicates that it is neither overbought nor oversold, suggesting a neutral condition in terms of investor sentiment. At this level, the index is in a balanced state, not exhibiting extreme bullish or bearish trends.

Analysis for Nifty 50 - April 11, 2025

Nifty 50 opened at 22,695.40 and closed higher at 22,828.55, marking a gain of 1.92% with a points change of 429.40. The index saw a high of 22,923.90 and a low identical to its opening. Notably, its 10-day EMA is at 22,833.98, indicating close alignment with the closing price, while the RSI of 48.35 reflects a relatively neutral momentum.

Relationship with Key Moving Averages
The Nifty 50 closed at 22828.55, which is slightly below its 10-day EMA of 22833.98 and its 20-day EMA of 22907.79, indicating a short-term downtrend. Additionally, the close is also below the 50-day and 200-day EMAs of 23028.87 and 23365.90, respectively, suggesting a bearish outlook in the longer term as well.
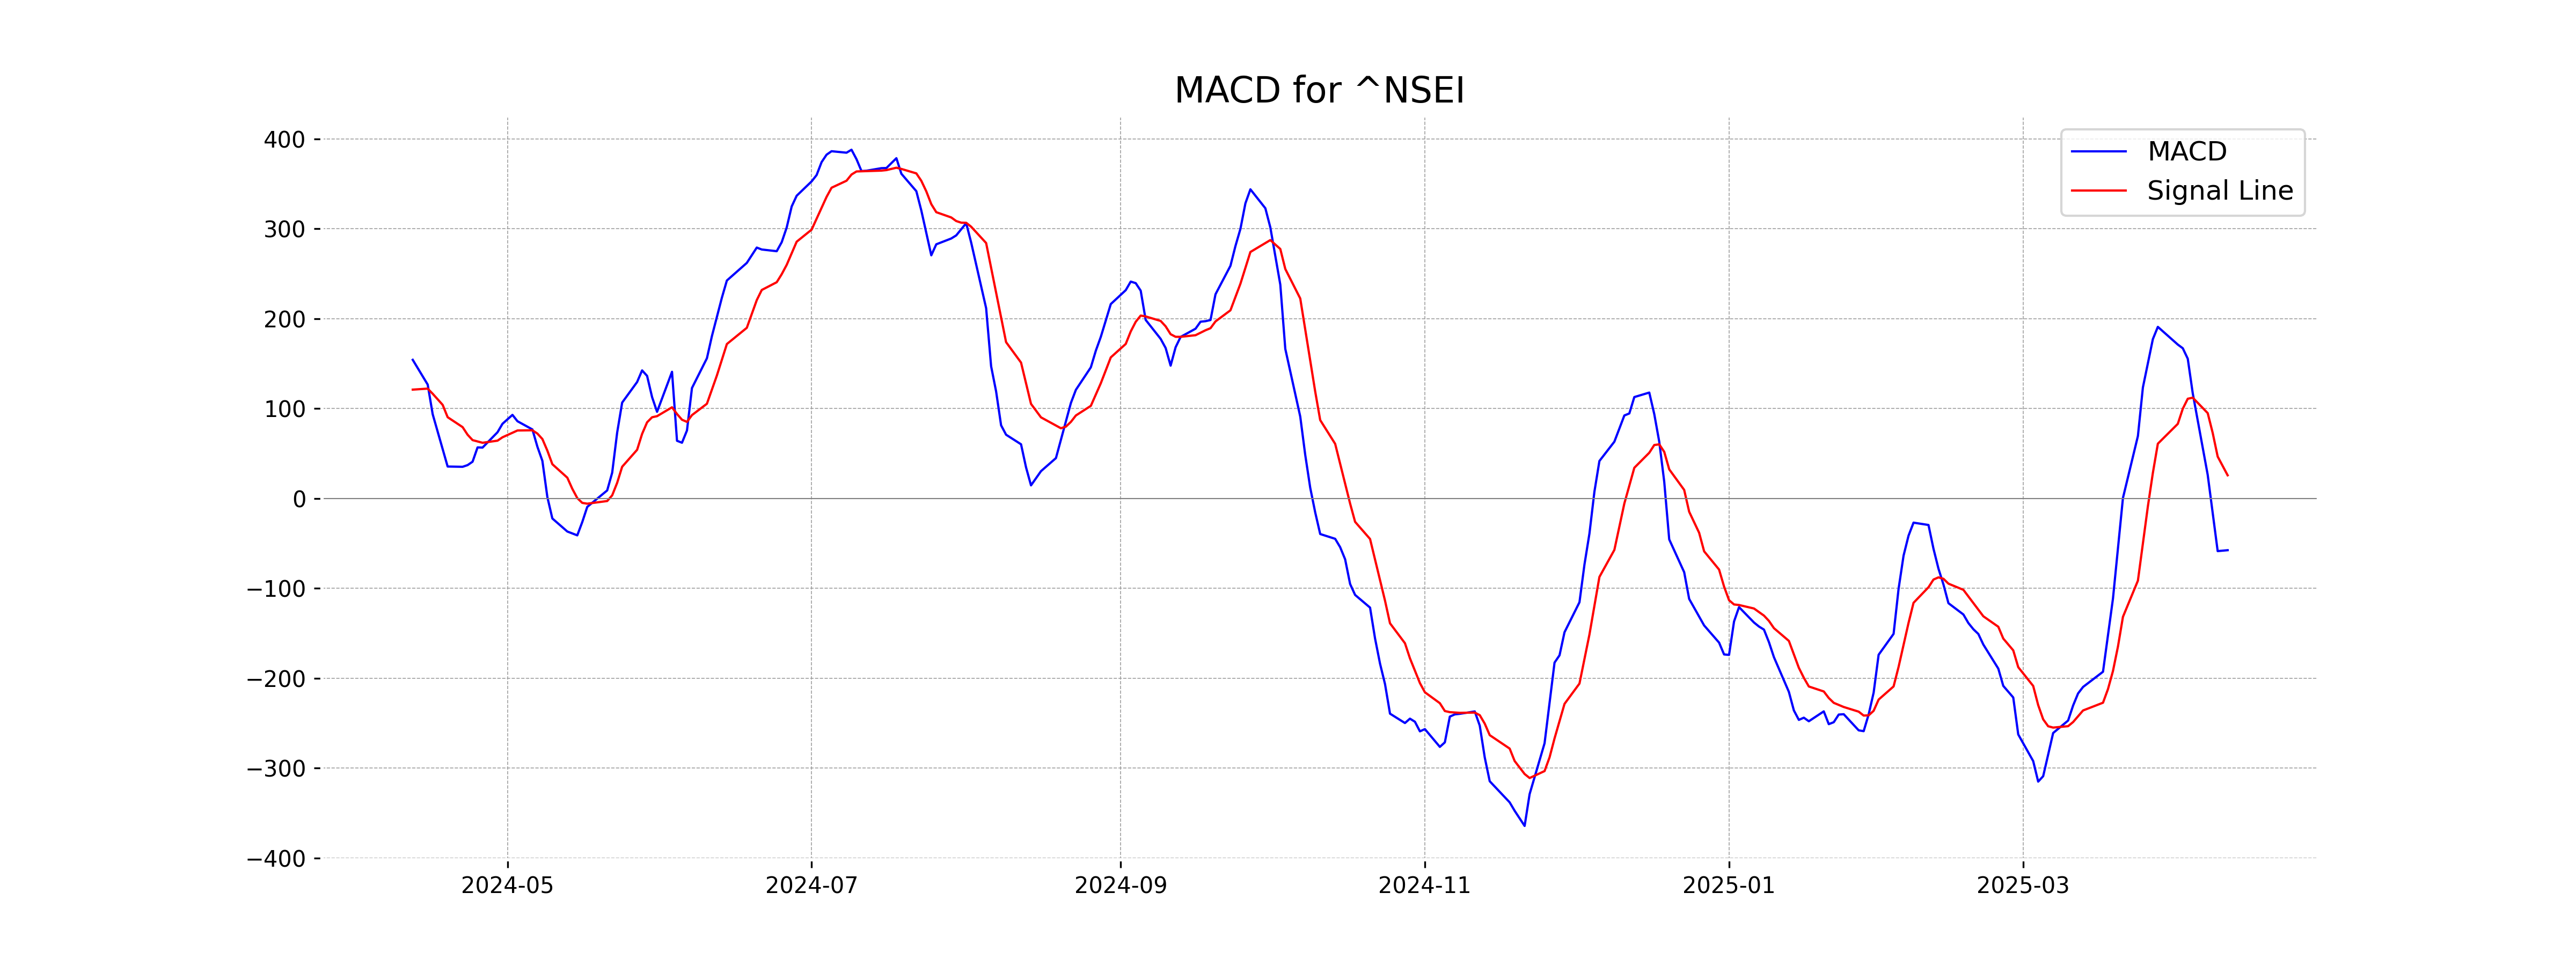
Moving Averages Trend (MACD)
Nifty 50's MACD level is -57.55, which is below the signal line at 25.79, indicating a bearish momentum. The negative MACD suggests that the current trend may continue downwards unless there is a reversal, as the index is trading below key short-term EMAs.
RSI Analysis
RSI Analysis for Nifty 50: The current Relative Strength Index (RSI) for Nifty 50 is 48.35, which is near the midpoint of the typical range (30-70). This suggests that the market is in a neutral zone and not currently indicating overbought or oversold conditions.

Up Next
Global stock market indices: How the world markets performed today - 11 April 2025

Honda Activa 6G: Everything You Need to Know Before Buying

How much does a ULIP plan really cost? A break-down of all charges

Centre plans to borrow Rs 8.20 lakh cr from market in first half of FY27

Reliance denies buying Iranian oil amid US sanctions waiver

Premium petrol price up Rs 2, industrial diesel up Rs 22; no change in normal petrol, diesel rates

More videos

India's GDP expected to register over 8 pc growth in Sep-Dec: Report

Govt announces seven measures to help boost exports

RBI keeps interest rates on hold after US trade deal boosts outlook

RBI proposes to compensate customers up to Rs 25,000 loss due to fraud

RBI raises GDP growth projection of Q1, Q2 of FY27

RBI pauses rate cuts, retains interest rate at 5.25 pc

Rupee jumps 122 paise to close at 90.27 against US dollar on India-US trade deal

Stock markets cheer India-US trade deal: Sensex, Nifty surge 2.5 pc

UPI transactions hit record high of Rs 230 lakh crore in 2025-26 till Dec: Govt

Explained: India-US trade deal, tariffs and trade benefits