


Highlights
- Global markets show mixed trends amid uncertainty
- MACD signals bearish momentum across major indices
- RSI indicates indexes nearing oversold territory
Latest news

Haier Launches HQLED P7 Pro Series TVs With Google Gemini, 50W Audio And AI Picture Enhancements

Nothing's Latest Pokémon Teasers Hint At New Hardware, RCB Collaboration May Also Be In The Works

OnePlus N6 Set To Debut With Massive 8,000mAh Battery And Long-Term Performance Focus

Roblox Introduces Age-Based Accounts for Younger Users, Expands Parental Controls Globally

IIFL Capital Launches Algo Marketplace with Over 100 Ready-Made Strategies

LUMIQ Raises INR 50 Crore Pre-Series B to Become the AI Decision Layer for Financial Services

Tay Keith, producer behind Travis Scott's 'Sicko Mode' dies at 29

GenAI could lift realty sales velocity by up to 50%, speed up launches by 30%: Report
Global stock market indices: How the world markets performed today - 10 April 2025


The international stock market indices showed varied performances on April 10, 2025, reflecting the economic sentiment across different regions.
In this article, we analyze the performance of key global indices including the S&P 500, Dow Jones Industrial Average, NASDAQ Composite, FTSE 100, DAX, CAC 40, IBEX 35, Nikkei 225, Hang Seng, Nifty 50, and BSE Sensex.

Analysis for Sensex - April 10, 2025
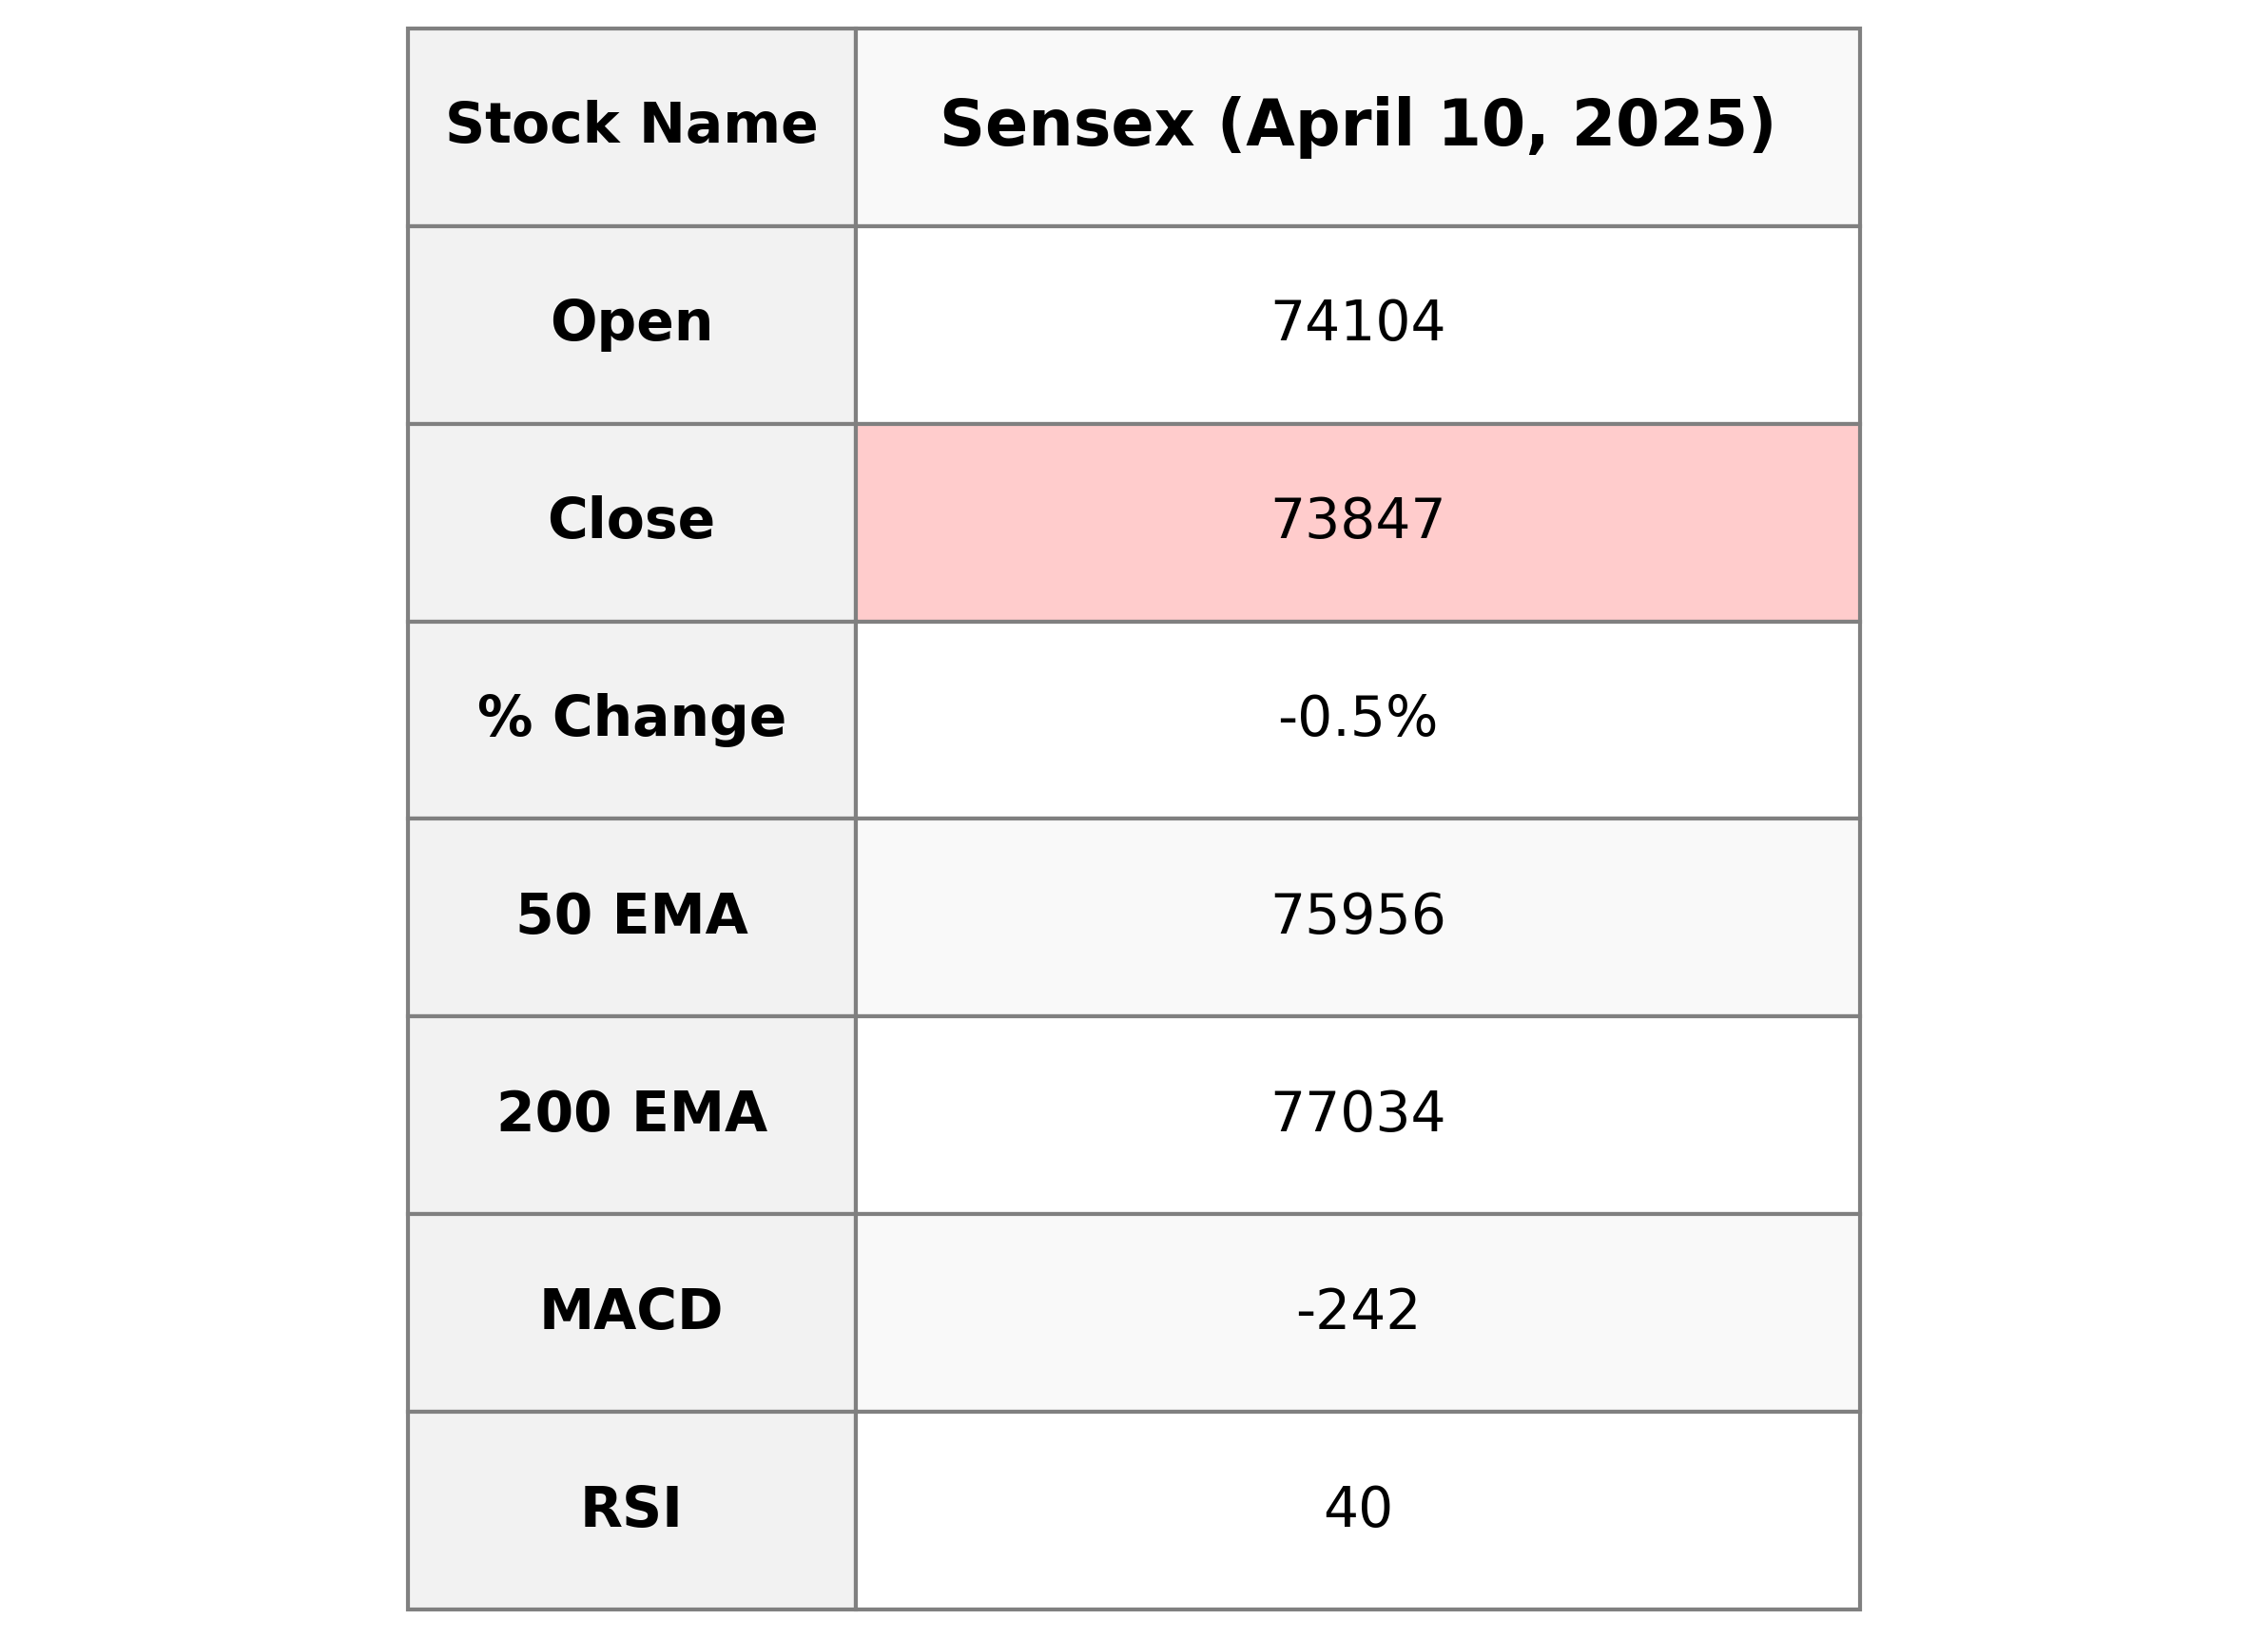
The Sensex opened at 74,103.83 and closed lower at 73,847.15, experiencing a negative change of 0.51% or a drop of approximately 379.93 points. Technical indicators show the 10-day EMA is 75,180.72, while the RSI is at 39.98, suggesting bearish momentum.

Relationship with Key Moving Averages
The Sensex closed at 73,847.15, below its 10 EMA of 75,180.72, 20 EMA of 75,473.65, 50 EMA of 75,956.17, and 200 EMA of 77,034.11, indicating a short-term bearish trend. The MACD value of -241.97 compared to the MACD Signal of 80.19 further supports this bearish outlook.
Moving Averages Trend (MACD)
The MACD for Sensex is -241.97, which is below the MACD Signal of 80.19, indicating a bearish momentum. This suggests that the current trend might continue downwards, and traders may expect further price decreases unless momentum shifts.

RSI Analysis
The Relative Strength Index (RSI) for Sensex is 39.98, indicating that the stock is approaching the oversold territory, as it is below the typical overbought/oversold levels which are 70 and 30 respectively. This suggests that Sensex may experience a price reversal or trend change if this downward momentum continues.

Analysis for Dow Jones Industrial Average (US) - April 10, 2025

The Dow Jones Industrial Average (US) opened at 37,387.91 and closed at 40,608.45, marking a notable increase of approximately 7.87% or a gain of 2,962.86 points. Despite this positive movement, the index's RSI indicates a relatively neutral momentum at 45.77, and the MACD suggests a bearish sentiment, being below its signal line. The 50-day EMA remains above the current price, suggesting a negative short-term trend.

Relationship with Key Moving Averages
The Dow Jones Industrial Average closed at 40608.45, trading below its 50-day EMA of 42093.60 and 200-day EMA of 41870.86, indicating potential bearish sentiment. However, it closed above the 10-day EMA of 40158.85, suggesting short-term bullishness within a broader downtrend.
Moving Averages Trend (MACD)
The MACD for the Dow Jones Industrial Average indicates a bearish trend as the MACD value of -946.42 is below the MACD Signal of -682.83. This suggests that the recent momentum might be weak, cautioning investors about potential short-term declines.
RSI Analysis
Dow Jones Industrial Average (US) currently has an RSI of 45.77, indicating that it is in a neutral zone. This suggests that the stock is neither overbought nor oversold, providing no strong directional signals for investors at this point.

Analysis for CAC 40 (France) - April 10, 2025

The CAC 40 (France) index opened at 7296.5 and closed at 7233.44, experiencing a significant rise from the previous close, with a percentage change of 5.40%. The index faced a trading range with a high of 7384.47 and a low of 7183.54. The RSI indicates a neutral zone at 37.67, while the MACD suggests a bearish sentiment in the market.

Relationship with Key Moving Averages
Based on the given data for CAC 40 (France), the closing price of 7233.44 is below the 50 EMA (7779.57), 200 EMA (7679.72), 10 EMA (7372.96), and 20 EMA (7609.34), indicating a potential bearish trend. The Relative Strength Index (RSI) of 37.67 further suggests that the index may be approaching oversold conditions.
Moving Averages Trend (MACD)
CAC 40 (France) MACD Analysis: The MACD value is -247.72, while the MACD Signal value is -147.80, indicating a bearish trend as the MACD line is below the signal line. Traders may view this as a potential signal for continued downward movement, given the negative MACD value.

RSI Analysis
Based on the stock data for CAC 40 (France), the RSI (Relative Strength Index) is at 37.67, which indicates that the market is approaching oversold territory. An RSI below 30 is typically considered oversold, so current levels suggest potential for a buying opportunity if the downward momentum continues without reversal.

Analysis for FTSE 100 (UK) - April 10, 2025

FTSE 100 (UK) opened at 7679.48 and closed higher at 8026.42, indicating a positive change of approximately 4.52% and a points gain of 346.92. The RSI of 38.55 suggests the index is somewhat close to being oversold, while the MACD indicates a bearish trend. However, the significant rise in the closing price shows some short-term recovery.

Relationship with Key Moving Averages
FTSE 100 is trading below its key moving averages, with the current close of 8026.42 being below the 50-day EMA (8474.37), the 200-day EMA (8338.55), the 10-day EMA (8144.64), and the 20-day EMA (8334.73). This indicates a potential downtrend or weakness in the market.
Moving Averages Trend (MACD)
The FTSE 100's MACD value is -196.72, which is below the MACD Signal of -109.61. This indicates a bearish trend, suggesting potential downward momentum.

RSI Analysis
The RSI of the FTSE 100 index is 38.55, suggesting that the market is approaching oversold conditions. Typically, an RSI below 30 is considered oversold, indicating potential for a reversal or a buying opportunity, but at the current level, the index is not significantly oversold.
Analysis for DAX (Germany) - April 10, 2025

DAX (Germany) Performance: The DAX index opened at 21,207.76, achieving a high of 21,300.31 and closing at 20,796.35. The index experienced a significant increase of approximately 5.72% from the previous close, marking a points change of 1,125.47. Despite a positive change, the RSI indicates relative neutral momentum at 41.01, while the MACD reflects bearish traits being under the signal line.

Relationship with Key Moving Averages
The DAX index closed at 20,796.35, which is below its 50-day EMA of 21,876.94 and 20-day EMA of 21,662.35, but above the 200-day EMA of 20,338.17. This suggests short-term bearish sentiment while maintaining a long-term bullish perspective.
Moving Averages Trend (MACD)
The MACD analysis for DAX (Germany) indicates bearish momentum, as the MACD line is significantly below the MACD Signal line. With the MACD value at -592.86 and the Signal line at -298.90, it suggests strong negative sentiment in the present market environment.

RSI Analysis
RSI Analysis for DAX (Germany): The Relative Strength Index (RSI) for DAX is 41.01, suggesting that the index is approaching the oversold territory. Typically, an RSI below 30 indicates oversold conditions, which might imply that the index could be undervalued and may experience a price correction or rebound in the near term.

Analysis for S&P 500 (US) - April 10, 2025

The S&P 500 Index opened at 4965.28 and closed at 5456.90, marking a gain of 9.52% with a points change of 474.13. The trading volume was 9,489,600,000. Despite the RSI indicating a neutral market sentiment at 46.08, the market is exhibiting bearish trends with negative MACD of -154.99.

Relationship with Key Moving Averages
The S&P 500 closed at 5456.90, above its 10 EMA of 5371.18 but below its 50 EMA of 5693.71 and 200 EMA of 5677.48. This indicates a short-term bullish trend relative to the 10 EMA while remaining in a bearish stance compared to the longer-term moving averages.
Moving Averages Trend (MACD)
MACD Analysis for S&P 500: The MACD value of -154.99, which is lower than the signal line value of -117.65, suggests bearish momentum for the S&P 500. This indicates potential downward pressure in the market.

RSI Analysis
The RSI for S&P 500 is 46.08, indicating it is neither overbought nor oversold. Generally, an RSI above 70 suggests overbought conditions, while below 30 indicates oversold conditions. Therefore, the index is currently in a neutral range.

Analysis for Hang Seng Index (Hong Kong) - April 10, 2025

The Hang Seng Index opened at 20,810.43, reaching a high of 21,211.13 and a low of 20,530.43, before closing at 20,681.78. It experienced a positive change of 2.06% from the previous close, gaining 417.29 points. The index shows a bearish momentum with a low RSI of 33.66 and a negative MACD of -631.50, while trading below its 50 EMA and 20 EMA trends.

Relationship with Key Moving Averages
The Hang Seng Index opened at 20810.43 and closed at 20681.78, showing a positive change from the previous close. Despite this, it remains below the 50-day EMA of 22347.81 and the 20-day EMA of 22380.47, as well as the 10-day EMA of 21665.76. Additionally, the index is slightly above the 200-day EMA of 20442.02, indicating it is in a short-term downtrend relative to the longer-term trend.
Moving Averages Trend (MACD)
MACD Analysis for Hang Seng Index (Hong Kong): The MACD value is -631.50, which is significantly below its signal line at -176.68, indicating a bearish trend. This suggests negative momentum in the market, and the index may continue to face selling pressure.

RSI Analysis
RSI Analysis for Hang Seng Index (Hong Kong): The RSI value at 33.66 suggests that the index is nearing the oversold territory, which typically begins below 30. This could indicate potential buying opportunities if other indicators align, but caution is advised as it may still experience downward pressure.

Analysis for IBEX 35 (Spain) - April 10, 2025

The IBEX 35 index opened at 12,801.20, saw a high of 12,810.80 and a low of 12,343.80, before closing at 12,490.70, showing a percent change of 5.87% from its previous close. The index experienced a points change of 693.10 and has a Relative Strength Index (RSI) of 44.21 indicating a neutral momentum. The Moving Average Convergence Divergence (MACD) is -217.33, suggesting a bearish trend with a signal line at -64.63.

Relationship with Key Moving Averages
The IBEX 35 closed at 12,490.70, which is below the 50 EMA of 12,789.11 and the 20 EMA of 12,792.58, but above the 200 EMA of 11,994.56, indicating a bearish short-term trend but a bullish long-term trend. The 10 EMA at 12,549.99 is slightly above the closing price, suggesting slight short-term bearish pressure.
Moving Averages Trend (MACD)
The MACD for IBEX 35 is -217.33, which is below the MACD Signal line at -64.63. This indicates a bearish momentum in the market. The negative value of the MACD suggests that the short-term moving average is below the long-term moving average, reflecting downward pressure on the index.

RSI Analysis
RSI Analysis for IBEX 35 (Spain): The RSI for IBEX 35 is 44.21, indicating that the index is currently neither overbought nor oversold. It is closer to the lower end, suggesting a potential oversold condition if it continues to decrease.

Analysis for NASDAQ Composite (US) - April 10, 2025

The NASDAQ Composite (US) opened at 15,295 and closed significantly higher at 17,125, marking a substantial daily increase of approximately 12.16% or 1,857 points. The trading volume was 13.48 billion. While the 50-day and 200-day EMAs are at 18,002 and 18,111 respectively, indicating a shorter-term downward trend, the RSI is at 47.25, suggesting no significant overbought or oversold conditions.

Relationship with Key Moving Averages
The NASDAQ Composite closed at 17124.97, below the 50 EMA at 18001.90 and the 200 EMA at 18110.63, indicating a downward trend relative to these key moving averages. However, the close is above the 10 EMA at 16657.11 and the 20 EMA at 17157.18, suggesting some recent momentum.
Moving Averages Trend (MACD)
MACD Analysis for NASDAQ Composite (US): The MACD value of -616.62, which is below the MACD signal line at -516.93, indicates a bearish trend for the NASDAQ Composite. This suggests that the index may experience downward momentum or continued weakening in the short term.
RSI Analysis
The Relative Strength Index (RSI) for the NASDAQ Composite is 47.25, indicating a neutral position. This suggests there is no significant momentum favoring either overbought or oversold conditions in the market.

Analysis for Nikkei 225 (Japan) - April 10, 2025

Nikkei 225 opened at 32,321.21, saw a high of 34,639.39, and closed at 34,609.0, marking a significant 9.13% increase from its previous close of 31,714.03, with a points change of 2,894.97. The 10-day EMA at 34,208.08 indicates a bullish short-term trend, although the RSI at 44.51 suggests a neutral momentum with no heavy buying or selling pressure.

Relationship with Key Moving Averages
The Nikkei 225 closed at 34,609, which is above the 10 EMA of 34,208.08 but below both the 50 EMA of 36,841.95 and the 200 EMA of 37,797.14. This suggests a short-term bullish movement, though the longer-term trend is still bearish.
Moving Averages Trend (MACD)
The MACD for Nikkei 225 is negative at -1297.09, indicating bearish momentum as the MACD is below the signal line at -967.11. This suggests potential selling pressure, despite a recent positive price change.

RSI Analysis
Nikkei 225 (Japan) RSI Analysis: The RSI for Nikkei 225 is currently at 44.51, which suggests that the index is neither overbought nor oversold. This value indicates a neutral momentum, leaving room for potential buying or selling pressures based on future market movements.

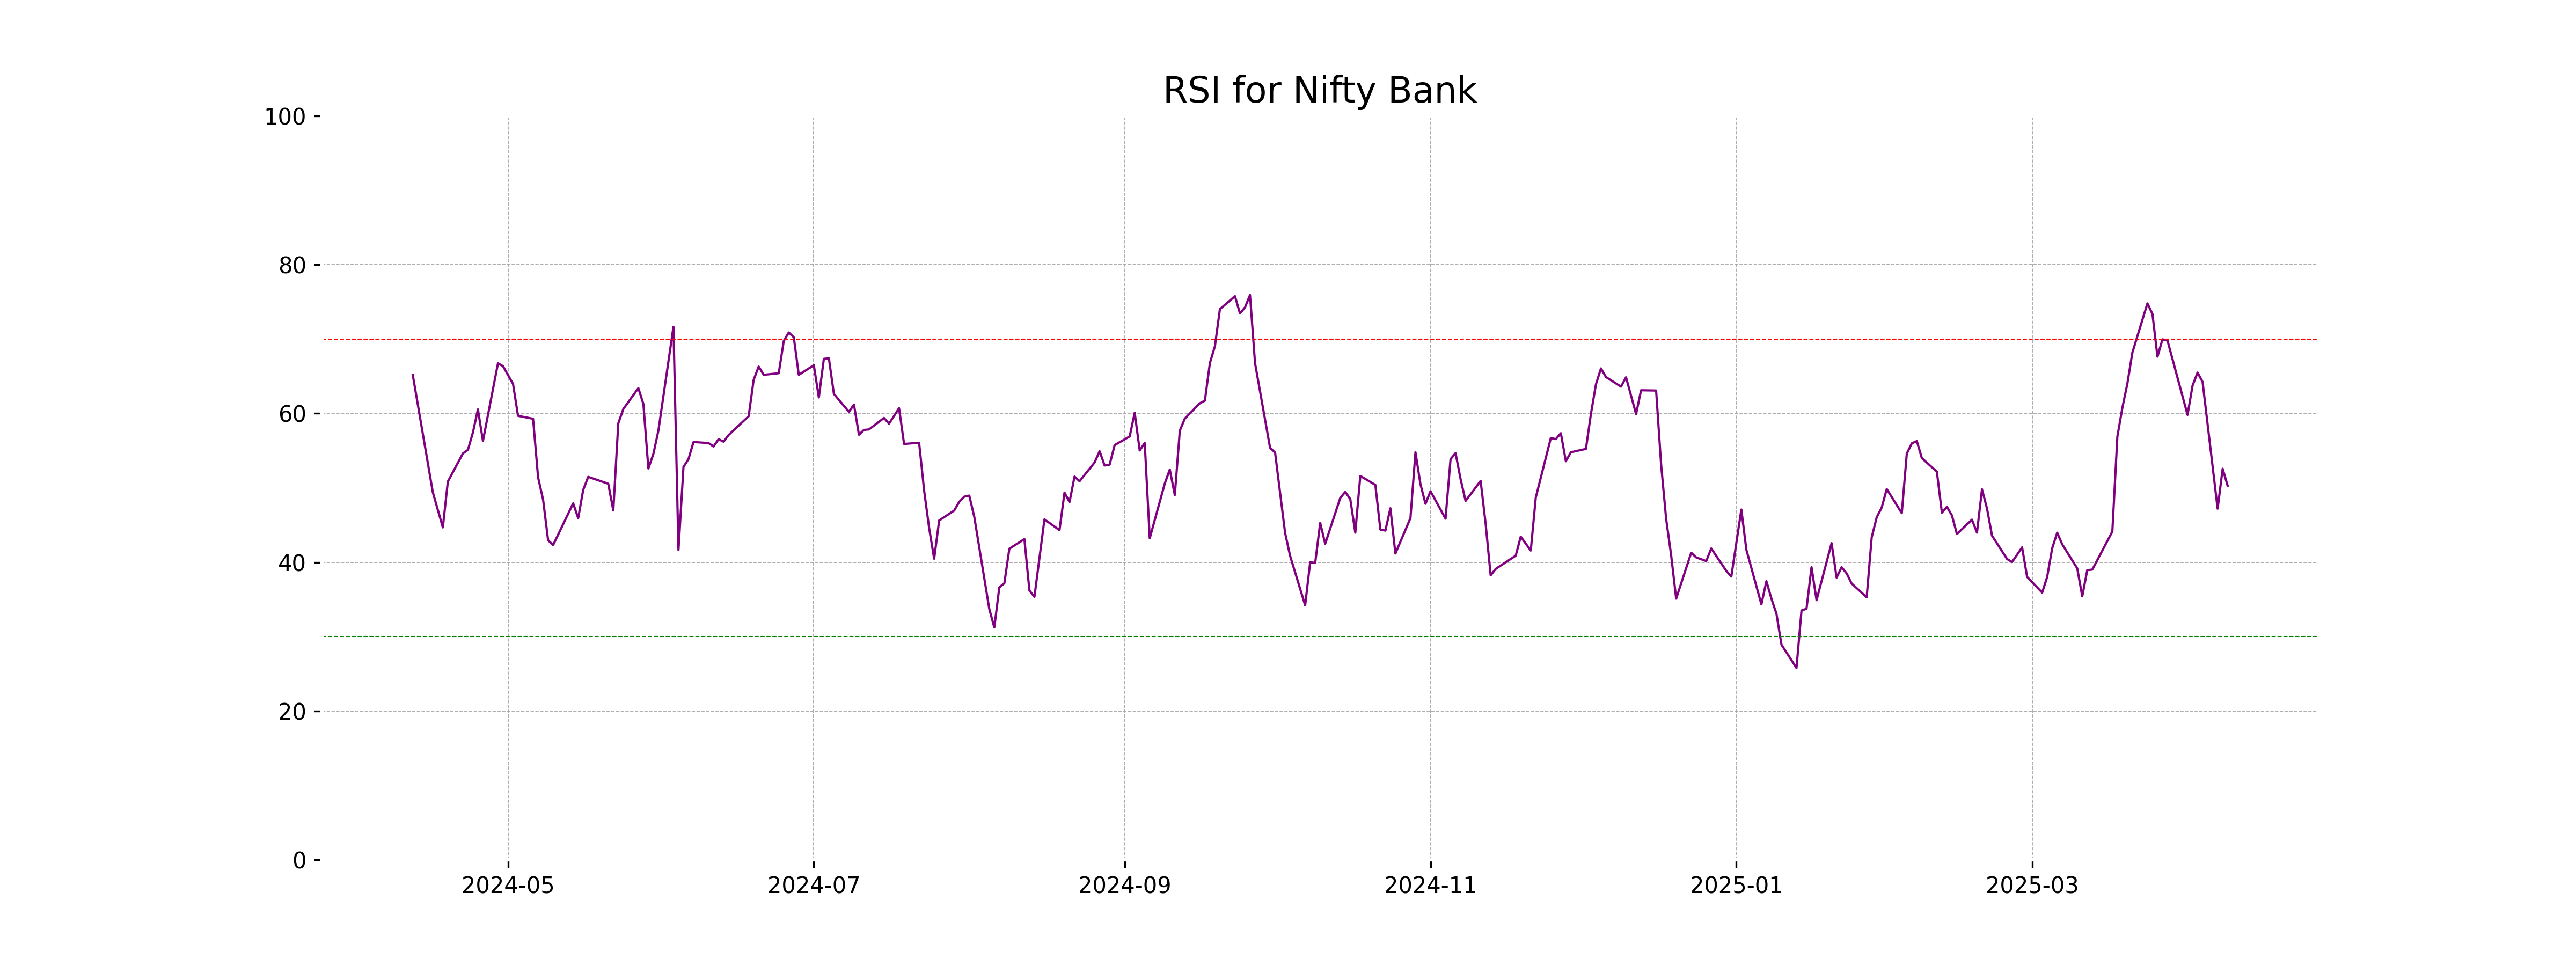
Analysis for Nifty Bank - April 10, 2025

Nifty Bank opened at 50,487.10 and closed at 50,240.15, marking a decrease of approximately 0.54% or 270.85 points from the previous close of 50,511. It traded between a high of 50,496.90 and a low of 49,910.85, with a volume of 141,800. The 50-day and 200-day EMAs were 50,004.17 and 50,045.55, respectively, while the RSI stood at 50.27, suggesting a relatively neutral momentum. The MACD was below its signal line, indicating a potential bearish trend.

Relationship with Key Moving Averages
The Nifty Bank closed at 50240.15, which is above the 50-day EMA of 50004.17 and the 200-day EMA of 50045.55, indicating a potential bullish sentiment in the short and long term. However, it remains below the 10-day EMA of 50687.22, suggesting recent short-term weakness.
Moving Averages Trend (MACD)
MACD Analysis for Nifty Bank: The MACD for Nifty Bank is 415.63, which is below the MACD Signal of 501.26. This suggests that the stock may be experiencing bearish momentum. Investors might watch for further developments to see if the trend continues or reverses.

RSI Analysis
RSI Analysis for Nifty Bank: Based on the provided stock data, the Relative Strength Index (RSI) for Nifty Bank is 50.27. This indicates a neutral trend, as it is around the midpoint of the typical RSI scale from 0 to 100, suggesting that neither strong buying nor selling pressures are currently dominant.
Analysis for Nifty 50 - April 10, 2025

The Nifty 50 experienced a decline, closing at 22,399.15, down from the previous close of 22,535.85, marking a percentage change of -0.61% and a points change of -136.70. The RSI stands at 40.10, indicating potential bearish sentiment, and the MACD of -58.57 further suggests a negative trend as it is below the MACD Signal of 46.63. The stock is trading below its 10, 20, 50, and 200 EMAs, which indicates bearish momentum.

Relationship with Key Moving Averages
Nifty 50 is currently trading below its key moving averages, with the latest closing price of 22399.15 falling under the 10-EMA of 22835.18, 20-EMA of 22916.13, 50-EMA of 23037.05, and 200-EMA of 23371.22. This suggests a bearish trend in the short and long term.
Moving Averages Trend (MACD)
The MACD for Nifty 50 is -58.57, while the Signal Line is 46.63, indicating a bearish momentum as the MACD line is below the Signal Line. This divergence suggests a potential downward trend in the short term.

RSI Analysis
The RSI for Nifty 50 is 40.10, indicating a moderate bearish momentum. Typically, an RSI below 50 suggests a potential downward trend, while levels closer to 30 could suggest the index is nearing oversold conditions.

Up Next
Global stock market indices: How the world markets performed today - 10 April 2025

Honda Activa 6G: Everything You Need to Know Before Buying

How much does a ULIP plan really cost? A break-down of all charges

Centre plans to borrow Rs 8.20 lakh cr from market in first half of FY27

Reliance denies buying Iranian oil amid US sanctions waiver

Premium petrol price up Rs 2, industrial diesel up Rs 22; no change in normal petrol, diesel rates

More videos

India's GDP expected to register over 8 pc growth in Sep-Dec: Report

Govt announces seven measures to help boost exports

RBI keeps interest rates on hold after US trade deal boosts outlook

RBI proposes to compensate customers up to Rs 25,000 loss due to fraud

RBI raises GDP growth projection of Q1, Q2 of FY27

RBI pauses rate cuts, retains interest rate at 5.25 pc

Rupee jumps 122 paise to close at 90.27 against US dollar on India-US trade deal

Stock markets cheer India-US trade deal: Sensex, Nifty surge 2.5 pc

UPI transactions hit record high of Rs 230 lakh crore in 2025-26 till Dec: Govt

Explained: India-US trade deal, tariffs and trade benefits