


Highlights
- Global indices closed lower amid heavy selling pressure
- RSI levels signal oversold conditions across markets
- MACD trends indicate continued bearish momentum globally
Latest news

Haier Launches HQLED P7 Pro Series TVs With Google Gemini, 50W Audio And AI Picture Enhancements

Nothing's Latest Pokémon Teasers Hint At New Hardware, RCB Collaboration May Also Be In The Works

OnePlus N6 Set To Debut With Massive 8,000mAh Battery And Long-Term Performance Focus

Roblox Introduces Age-Based Accounts for Younger Users, Expands Parental Controls Globally

IIFL Capital Launches Algo Marketplace with Over 100 Ready-Made Strategies

LUMIQ Raises INR 50 Crore Pre-Series B to Become the AI Decision Layer for Financial Services

Tay Keith, producer behind Travis Scott's 'Sicko Mode' dies at 29

GenAI could lift realty sales velocity by up to 50%, speed up launches by 30%: Report
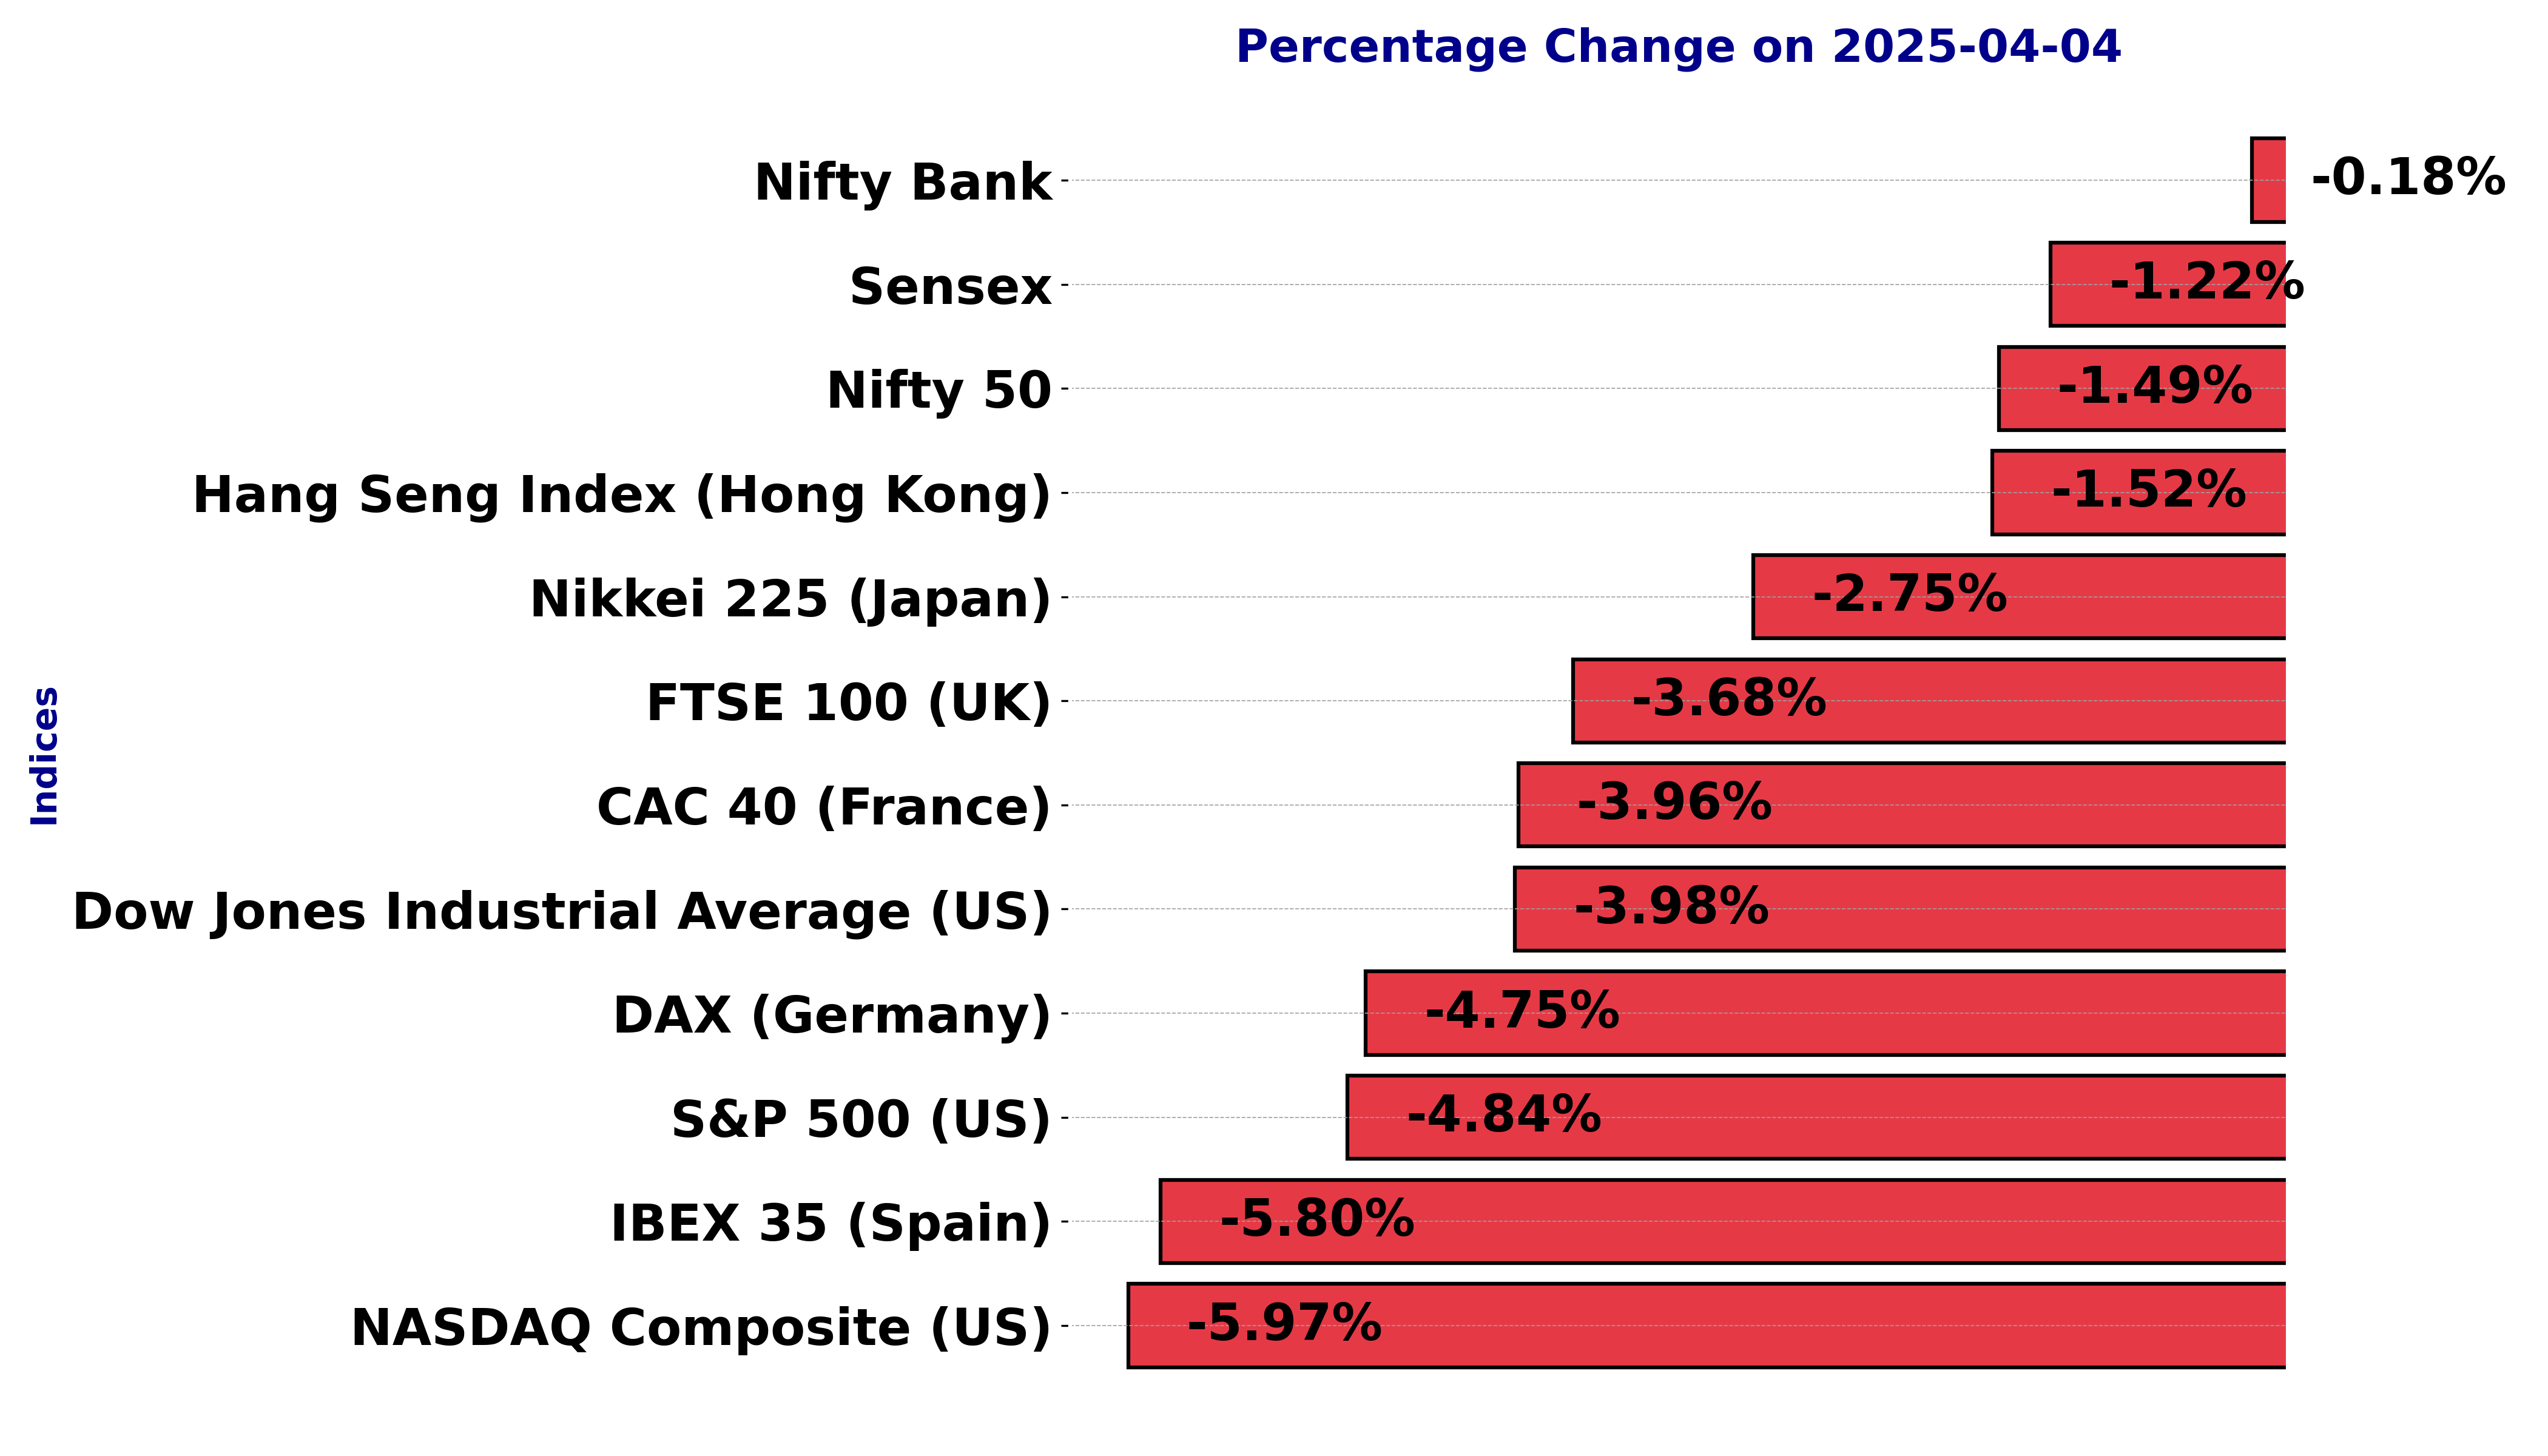
Global stock market indices: How the world markets performed today - 4 April 2025


The international stock market indices showed varied performances on April 04, 2025, reflecting the economic sentiment across different regions.
In this article, we analyze the performance of key global indices including the S&P 500, Dow Jones Industrial Average, NASDAQ Composite, FTSE 100, DAX, CAC 40, IBEX 35, Nikkei 225, Hang Seng, Nifty 50, and BSE Sensex.
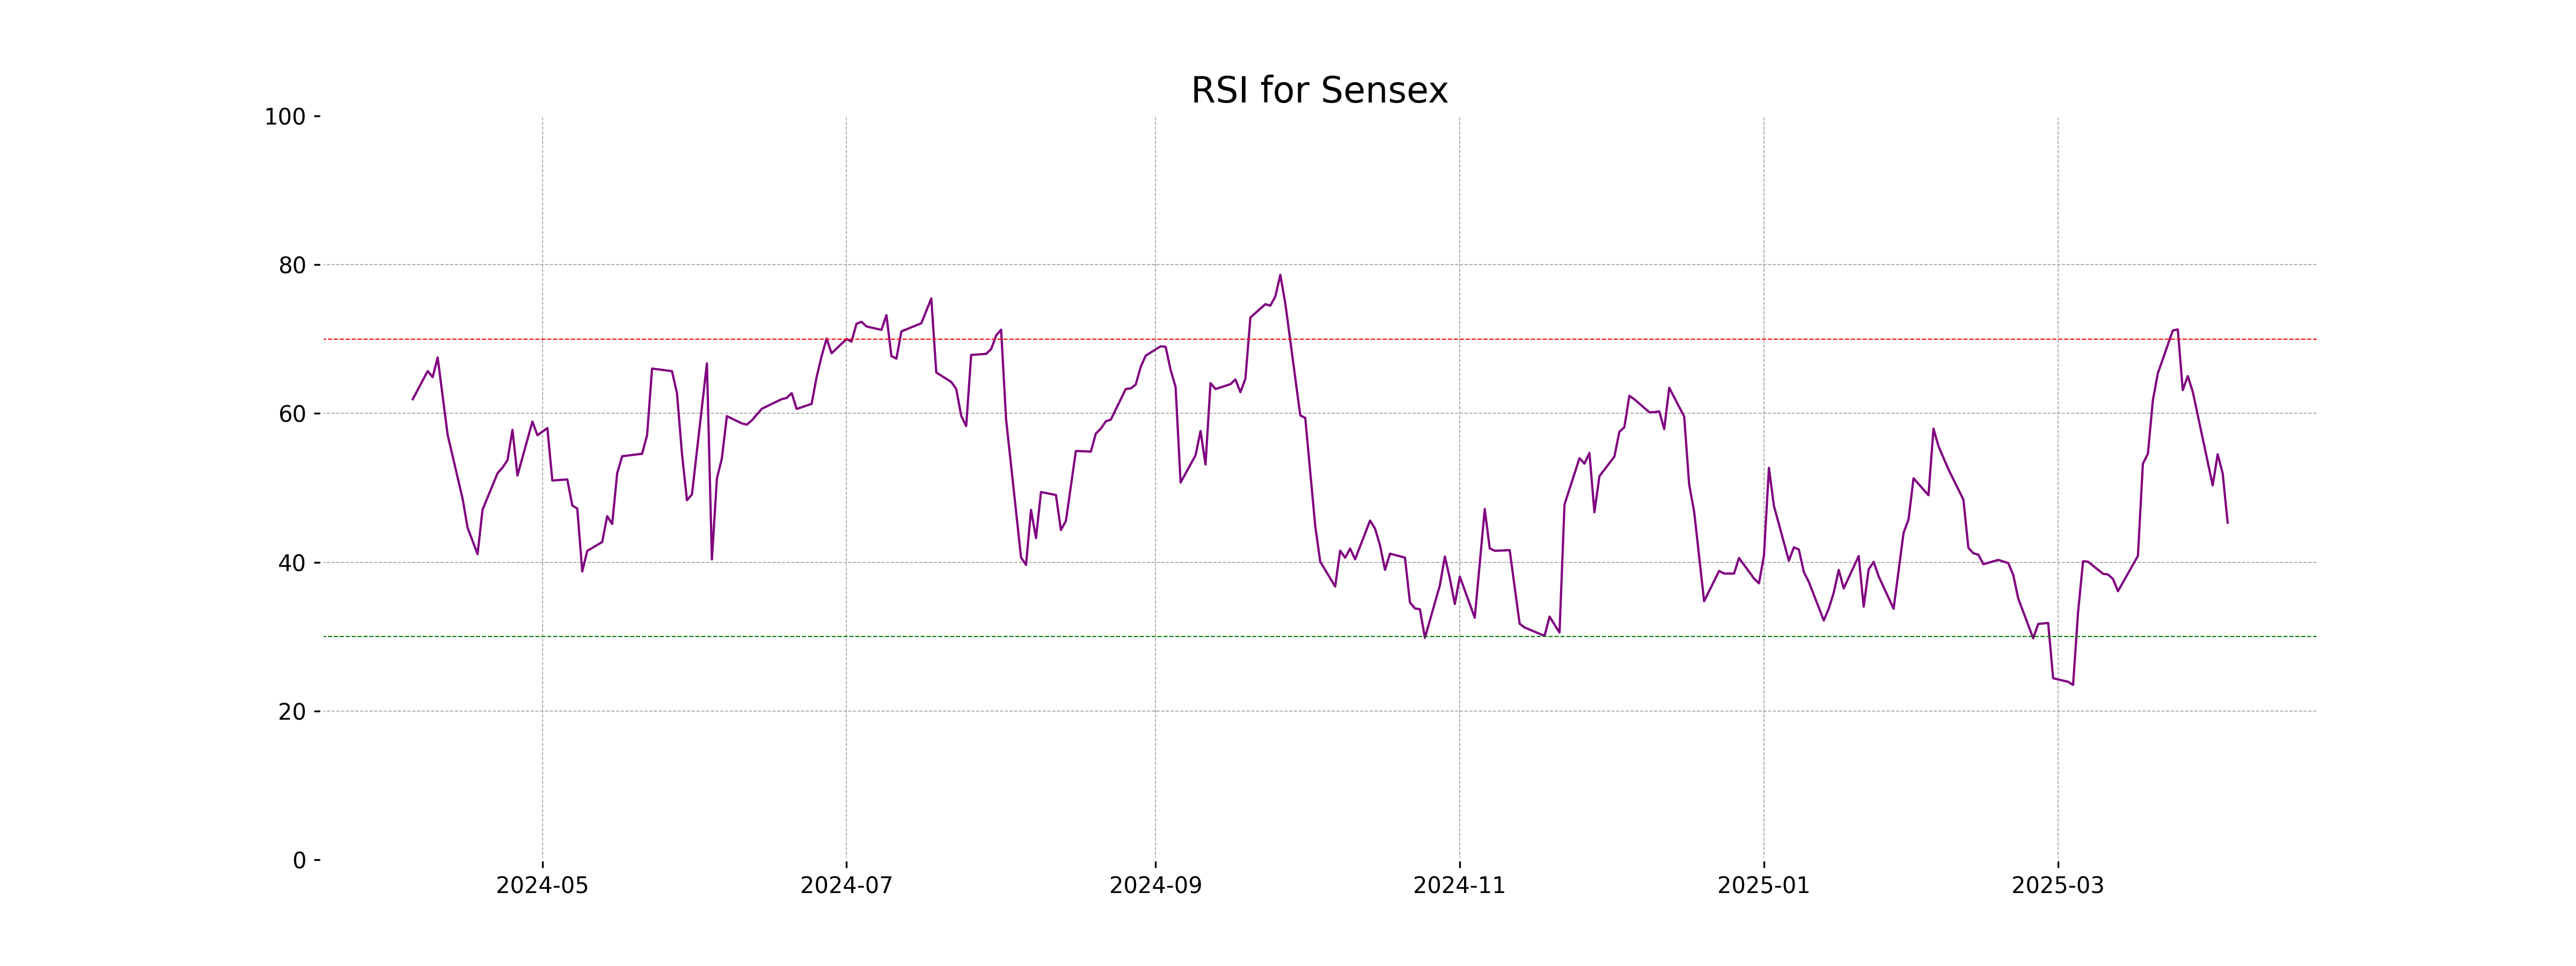
Analysis for Sensex - April 04, 2025

Sensex opened at 76,160.09 and closed lower at 75,364.69, experiencing a significant drop of 930.67 points or -1.22% from the previous close of 76,295.36. The RSI value of 45.33 indicates a weakening momentum, whereas the MACD value of 285.38 slightly surpasses the signal line, suggesting limited bullish action in the current downtrend.

Relationship with Key Moving Averages
Sensex is trading below its 50 EMA of 76,237.91 and 200 EMA of 77,133.43, indicating a bearish sentiment in the short to long term. It is also below the 10 EMA and 20 EMA, which suggests continued downward momentum in the near-term. The current RSI value is 45.33, which suggests the index is nearing oversold territory.
Moving Averages Trend (MACD)
The MACD for Sensex is slightly above the MACD Signal, indicating a potential bullish divergence. However, with an RSI of 45.33, the market might not have strong momentum in either direction. Traders should watch closely for changes.

RSI Analysis
The Sensex has an RSI of 45.33, indicating that it is approaching an oversold condition but is currently in the neutral range. This suggests potential consolidation or a slowdown in bearish momentum, as the RSI is below the midpoint of 50.
Analysis for Dow Jones Industrial Average (US) - April 04, 2025

Dow Jones Industrial Average (US) opened at 40,986.52 and closed at 40,545.93, marking a decrease of 1,679.39 points, which is a -3.98% change from the previous close of 42,225.32. The index experienced a notable downward trend, with an RSI of 33.53 indicating it may be approaching oversold conditions.

Relationship with Key Moving Averages
Dow Jones Industrial Average is trading below key moving averages, indicating a bearish trend. The current closing price of 40,545.93 is below the 50 EMA of 42,688.22, the 200 EMA of 42,002.31, and the 10 EMA of 41,816.21, which suggests negative momentum and potential further declines.
Moving Averages Trend (MACD)
The Dow Jones Industrial Average's MACD of -381.71, which is below its MACD Signal of -368.57, indicates a bearish momentum. The negative MACD value suggests that the index is currently in a downward trend, further supported by the oversold RSI of 33.53.

RSI Analysis
RSI Analysis for Dow Jones Industrial Average (US): The Relative Strength Index (RSI) is currently at 33.53, suggesting that the index is nearing the oversold territory, which traditionally is below 30. This may indicate that the index could be undervalued at the moment, and investors might be cautious or looking for potential buying opportunities.

Analysis for CAC 40 (France) - April 04, 2025

The CAC 40 (France) experienced a significant decline with a close at 7298.04, down by 3.96% or 300.94 points from its previous close at 7598.98. Notably, the Relative Strength Index (RSI) stands at 24.32, indicating that the index may be in oversold territory. The MACD is -107.73, further reinforcing bearish momentum.

Relationship with Key Moving Averages
The closing price of CAC 40 (France) at 7298.04 is below its key moving averages, specifically the 50-day EMA (7909.78), 200-day EMA (7706.35), 10-day EMA (7776.14), and 20-day EMA (7891.96), indicating a bearish trend. The RSI is at 24.32, which suggests the index is oversold.
Moving Averages Trend (MACD)
CAC 40 (France) MACD Analysis: The MACD value is -107.73, indicating a bearish momentum, as it is below the MACD Signal line of -36.23. This suggests a potential continuation of the current downtrend in the CAC 40 index.

RSI Analysis
The RSI for CAC 40 (France) is 24.32, indicating that the index is in oversold territory. This suggests that the recent selling pressure might lead to a potential upward correction or reversal, as values below 30 typically signify a market that may be undervalued.

Analysis for FTSE 100 (UK) - April 04, 2025

FTSE 100 (UK) opened and hit a high of 8474.74, but closed significantly lower at 8162.87, resulting in a negative change of -3.68%. The index has bearish technical indicators, with the current close below both the 50 and 200 EMAs, an RSI of 23.16 indicating potential oversold conditions, and a negative MACD value suggesting a downward trend.

Relationship with Key Moving Averages
The FTSE 100 is currently trading below its key moving averages, with a close of 8162.87, which is below the 50-EMA (8589.84), the 200-EMA (8360.33), the 10-EMA (8528.56), and the 20-EMA (8589.02). This indicates a bearish trend as the index is also substantially lower than its recent average levels.
Moving Averages Trend (MACD)
The FTSE 100 shows a bearish momentum as indicated by the MACD value of -54.85, which is significantly below the MACD Signal line of -13.99. This suggests a potential for further downside movement unless there's a reversal in trend.

RSI Analysis
The RSI for FTSE 100 is at 23.16, which is below the standard oversold threshold of 30. This suggests that the index is currently in an oversold condition, potentially indicating a buying opportunity if the market anticipates a reversal.

Analysis for DAX (Germany) - April 04, 2025

The DAX (Germany) index experienced a significant decline, closing at 20,686.83, down by approximately 4.75% with a points change of -1,030.56 from its previous close of 21,717.39. The index's RSI is at 29.65, indicating that it may be in an oversold condition, while the MACD shows a bearish divergence with a value of -197.98 against the signal line of 37.65.

Relationship with Key Moving Averages
The close price of 20686.83 for DAX (Germany) is significantly below its key moving averages, with the 10 EMA at 22135.14 and the 50 EMA at 22179.01, indicating a bearish trend. Additionally, the 200 EMA of 20346.54 suggests the current price is slightly above the long-term average, but still indicates overall downward pressure.
Moving Averages Trend (MACD)
The MACD for DAX (Germany) is -197.98, while the MACD Signal is 37.66. The negative MACD value compared to the positive MACD Signal suggests a bearish trend, indicating potential downward momentum in the market.

RSI Analysis
The RSI for the DAX (Germany) index is 29.65, which indicates that it is in the oversold territory. This suggests that the index may be due for a potential reversal or a bounce if buying interest increases.

Analysis for S&P 500 (US) - April 04, 2025

The S&P 500 index opened at 5492.74 and closed at 5396.52, experiencing a decline of approximately 4.84% from its previous close of 5670.97. This drop is reflected in a negative points change of -274.45. The Relative Strength Index (RSI) indicates a bearish trend at 31.92, and the Moving Average Convergence Divergence (MACD) is -76.49, which is below the signal line, indicating potential downward momentum.

Relationship with Key Moving Averages
The S&P 500 (US) closed at 5396.52, below its 10-day, 20-day, 50-day, and 200-day Exponential Moving Averages (EMAs), which are 5615.28, 5673.08, 5788.16, and 5699.14, respectively. This indicates a bearish trend as the index is trading below all key moving averages.
Moving Averages Trend (MACD)
S&P 500: The MACD value of -76.49 is below the MACD Signal line of -70.05, which indicates a potential bearish trend. With the RSI at 31.92, the index might be oversold, suggesting caution for investors considering current market conditions.

RSI Analysis
The RSI for S&P 500 is 31.92, indicating that the index is currently in the oversold territory. This suggests that the S&P 500 may be undervalued and could potentially face upward pressure as market conditions adjust.

Analysis for Hang Seng Index (Hong Kong) - April 04, 2025

The Hang Seng Index reported an opening value of 22,638.21 and closed at 22,849.81, indicating a points change of -352.72 from the previous close at 23,202.53, translating to a percentage change of -1.52%. The index had a trading volume of 4,249,900,000, with technical indicators such as the 50-day EMA at 22,713.75, the 200-day EMA at 20,450.74, the 10-day EMA at 23,356.23, and the 20-day EMA at 23,424.74. Overall sentiment, as suggested by the RSI at 43.56, is on the lower side, implying potential market weakness.

Relationship with Key Moving Averages
The Hang Seng Index (Hong Kong) closed at 22,849.81, which is above its 50-day EMA of 22,713.75 but below its 10-day EMA of 23,356.23 and 20-day EMA of 23,424.74, indicating a short-term bearish trend. However, it remains well above the 200-day EMA of 20,450.74, reflecting a longer-term positive trend.
Moving Averages Trend (MACD)
MACD Analysis for Hang Seng Index (Hong Kong): The MACD value of 74.35 is below the MACD Signal line of 280.30, indicating a potential bearish trend. The declining MACD suggests that the momentum may be weakening.

RSI Analysis
The RSI for the Hang Seng Index stands at 43.56, which suggests that the index is approaching the oversold territory. Generally, an RSI below 30 is considered oversold, and above 70 is considered overbought, so the index is currently in a neutral to slightly bearish zone.

Analysis for IBEX 35 (Spain) - April 04, 2025

The IBEX 35 Index opened at 13091.60 and closed at 12426.10, marking a significant drop with a percentage change of -5.80%. This resulted in a points change of -765.10, with the index experiencing a low of 12389.20 within the trading session. Despite a high trading volume of 141,497,171, bearish momentum is indicated by a low RSI of 32.63.

Relationship with Key Moving Averages
For IBEX 35 (Spain), the closing price is below the 50-day EMA, 10-day EMA, and 20-day EMA, indicating a short-term downtrend. Additionally, its RSI of 32.63 suggests it may be nearing oversold conditions.
Moving Averages Trend (MACD)
The MACD for IBEX 35 is 20.60, which is below the MACD Signal of 104.85, indicating a potential bearish trend. This suggests that the stock might continue to face downward pressure unless there is a positive reversal. Additionally, the RSI of 32.63 suggests that the index is nearing oversold conditions.

RSI Analysis
The RSI for IBEX 35 is 32.63, indicating that the index is approaching oversold conditions. This could suggest a potential buying opportunity if the market stabilizes.

Analysis for NASDAQ Composite (US) - April 04, 2025

The NASDAQ Composite (US) experienced a significant drop with a closing value of 16,550.61, showing a percentage change of -5.97% and a points change of -1,050.44 from the previous close of 17,601.05. The trading volume was 9,461,330,000 with the RSI at 30.96, indicating it might be nearing oversold conditions. Additionally, the MACD value of -396.37 is slightly lower than the MACD Signal of -365.59, suggesting continued bearish momentum.

Relationship with Key Moving Averages
The NASDAQ Composite is trading below its 50-day EMA of 18,363.58 and 200-day EMA of 18,200.59, suggesting a bearish trend. Additionally, it is also below its 10-day EMA of 17,452.30 and 20-day EMA of 17,750.68, which indicates short-term downward momentum.
Moving Averages Trend (MACD)
The NASDAQ Composite's MACD is currently at -396.37, with the MACD Signal at -365.59, indicating a bearish trend as the MACD line is below the signal line. This suggests that there may be further downside pressure in the short term for the index. The significant negative value reinforces the bearish sentiment.

RSI Analysis
NASDAQ Composite (US) RSI Analysis: The Relative Strength Index (RSI) for NASDAQ Composite is currently at 30.96, indicating that it is nearing the oversold condition. This suggests that the market could be due for a potential rebound or reversal if the RSI continues to stay below or near 30.

Analysis for Nikkei 225 (Japan) - April 04, 2025

Nikkei 225 (Japan) opened at 34,304.66 and closed at 33,780.58, registering a decline of 955.35 points or -2.75% from the previous close of 34,735.93. The stock showed a downtrend with a low RSI of 20.83, indicating oversold conditions, and a negative MACD of -813.28, which is significantly below its signal line of -499.36.

Relationship with Key Moving Averages
The current close of Nikkei 225 at 33,780.58 is below all key moving averages, with the 50-day EMA at 37,566.99, the 200-day EMA at 38,007.73, and the 10-day EMA at 35,880.60. This suggests a bearish trend, further supported by a low RSI of 20.83, indicating that the index may be oversold.
Moving Averages Trend (MACD)
The MACD for Nikkei 225 is -813.28, and the MACD signal is -499.36, indicating that the MACD line is below the signal line. This suggests a bearish trend, where the downward momentum may continue unless there’s a significant change in direction.

RSI Analysis
The RSI value for the Nikkei 225 is 20.83, which indicates that the index is in the oversold territory. An RSI below 30 generally suggests that the stock or index may be undervalued and could potentially see a price correction or rebound.

Analysis for Nifty Bank - April 04, 2025

Nifty Bank opened at 51711.60, reached a high of 51893.60, and closed at 51502.70, showing a slight decline from the previous close of 51597.35 with a percentage change of -0.18%. The Relative Strength Index (RSI) stands at 64.23, indicating a bullish trend. The MACD value is positive at 686.17, suggesting upward momentum.

Relationship with Key Moving Averages
The closing value of Nifty Bank at 51502.70 is above its 10-day EMA of 51067.30 but below both its 50-day EMA of 49978.09 and 200-day EMA of 50039.94. This indicates short-term strength relative to recent averages, but the proximity to its longer-term EMAs suggests a mixed outlook.
Moving Averages Trend (MACD)
Nifty Bank MACD Analysis: The MACD value for Nifty Bank stands at 686.17, with a signal line at 525.80. The positive MACD indicates a bullish momentum, as it is above the signal line, but the strength of the trend should be monitored closely.

RSI Analysis
The Nifty Bank's RSI is currently at 64.23, which suggests that the stock is in a slightly overbought territory. Generally, an RSI above 70 is considered overbought and below 30 is considered oversold. This indicates that Nifty Bank may experience a period of consolidation or minor correction.

Analysis for Nifty 50 - April 04, 2025

The Nifty 50 opened at 23,190.40, experienced a high of 23,214.70 and a low of 22,857.45, closing at 22,904.45. It saw a decline of 1.49% from the previous close of 23,250.10, with a points change of -345.65. The RSI is at 45.95, indicating a weakening momentum, and the MACD is slightly above the signal line, suggesting limited bullish divergence.

Relationship with Key Moving Averages
The Nifty 50 closed at 22,904.45, below the 50-day EMA of 23,122.27 and also below the 10-day EMA of 23,210.92, indicating short-term bearish momentum. It remains under the 200-day EMA of 23,401.51, which suggests a longer-term downtrend.
Moving Averages Trend (MACD)
The MACD value is 117.00, while the MACD Signal is 112.17, suggesting a positive trend as the MACD line is above the signal line. However, with the Nifty 50 closing below its previous close and the RSI at 45.95, indicating a bearish momentum, caution may be warranted despite the MACD trend.

RSI Analysis
Certainly! The Relative Strength Index (RSI) for Nifty 50 is currently at 45.95. This suggests a neutral market position, slightly leaning towards being oversold, as RSI values below 50 generally indicate a weaker market sentiment. Traders often use RSI levels to identify potential reversal points, with levels below 30 considered oversold and above 70 overbought.

Up Next
Global stock market indices: How the world markets performed today - 4 April 2025

Honda Activa 6G: Everything You Need to Know Before Buying

How much does a ULIP plan really cost? A break-down of all charges

Centre plans to borrow Rs 8.20 lakh cr from market in first half of FY27

Reliance denies buying Iranian oil amid US sanctions waiver

Premium petrol price up Rs 2, industrial diesel up Rs 22; no change in normal petrol, diesel rates

More videos

India's GDP expected to register over 8 pc growth in Sep-Dec: Report

Govt announces seven measures to help boost exports

RBI keeps interest rates on hold after US trade deal boosts outlook

RBI proposes to compensate customers up to Rs 25,000 loss due to fraud

RBI raises GDP growth projection of Q1, Q2 of FY27

RBI pauses rate cuts, retains interest rate at 5.25 pc

Rupee jumps 122 paise to close at 90.27 against US dollar on India-US trade deal

Stock markets cheer India-US trade deal: Sensex, Nifty surge 2.5 pc

UPI transactions hit record high of Rs 230 lakh crore in 2025-26 till Dec: Govt

Explained: India-US trade deal, tariffs and trade benefits