


Highlights
- Global indices show mixed trends amid market volatility
- Dow Jones remains neutral, with weak momentum signs
- CAC 40 drops, indicating potential bearish pressure
Latest news

Haier Launches HQLED P7 Pro Series TVs With Google Gemini, 50W Audio And AI Picture Enhancements

Nothing's Latest Pokémon Teasers Hint At New Hardware, RCB Collaboration May Also Be In The Works

OnePlus N6 Set To Debut With Massive 8,000mAh Battery And Long-Term Performance Focus

Roblox Introduces Age-Based Accounts for Younger Users, Expands Parental Controls Globally

IIFL Capital Launches Algo Marketplace with Over 100 Ready-Made Strategies

LUMIQ Raises INR 50 Crore Pre-Series B to Become the AI Decision Layer for Financial Services

Tay Keith, producer behind Travis Scott's 'Sicko Mode' dies at 29

GenAI could lift realty sales velocity by up to 50%, speed up launches by 30%: Report
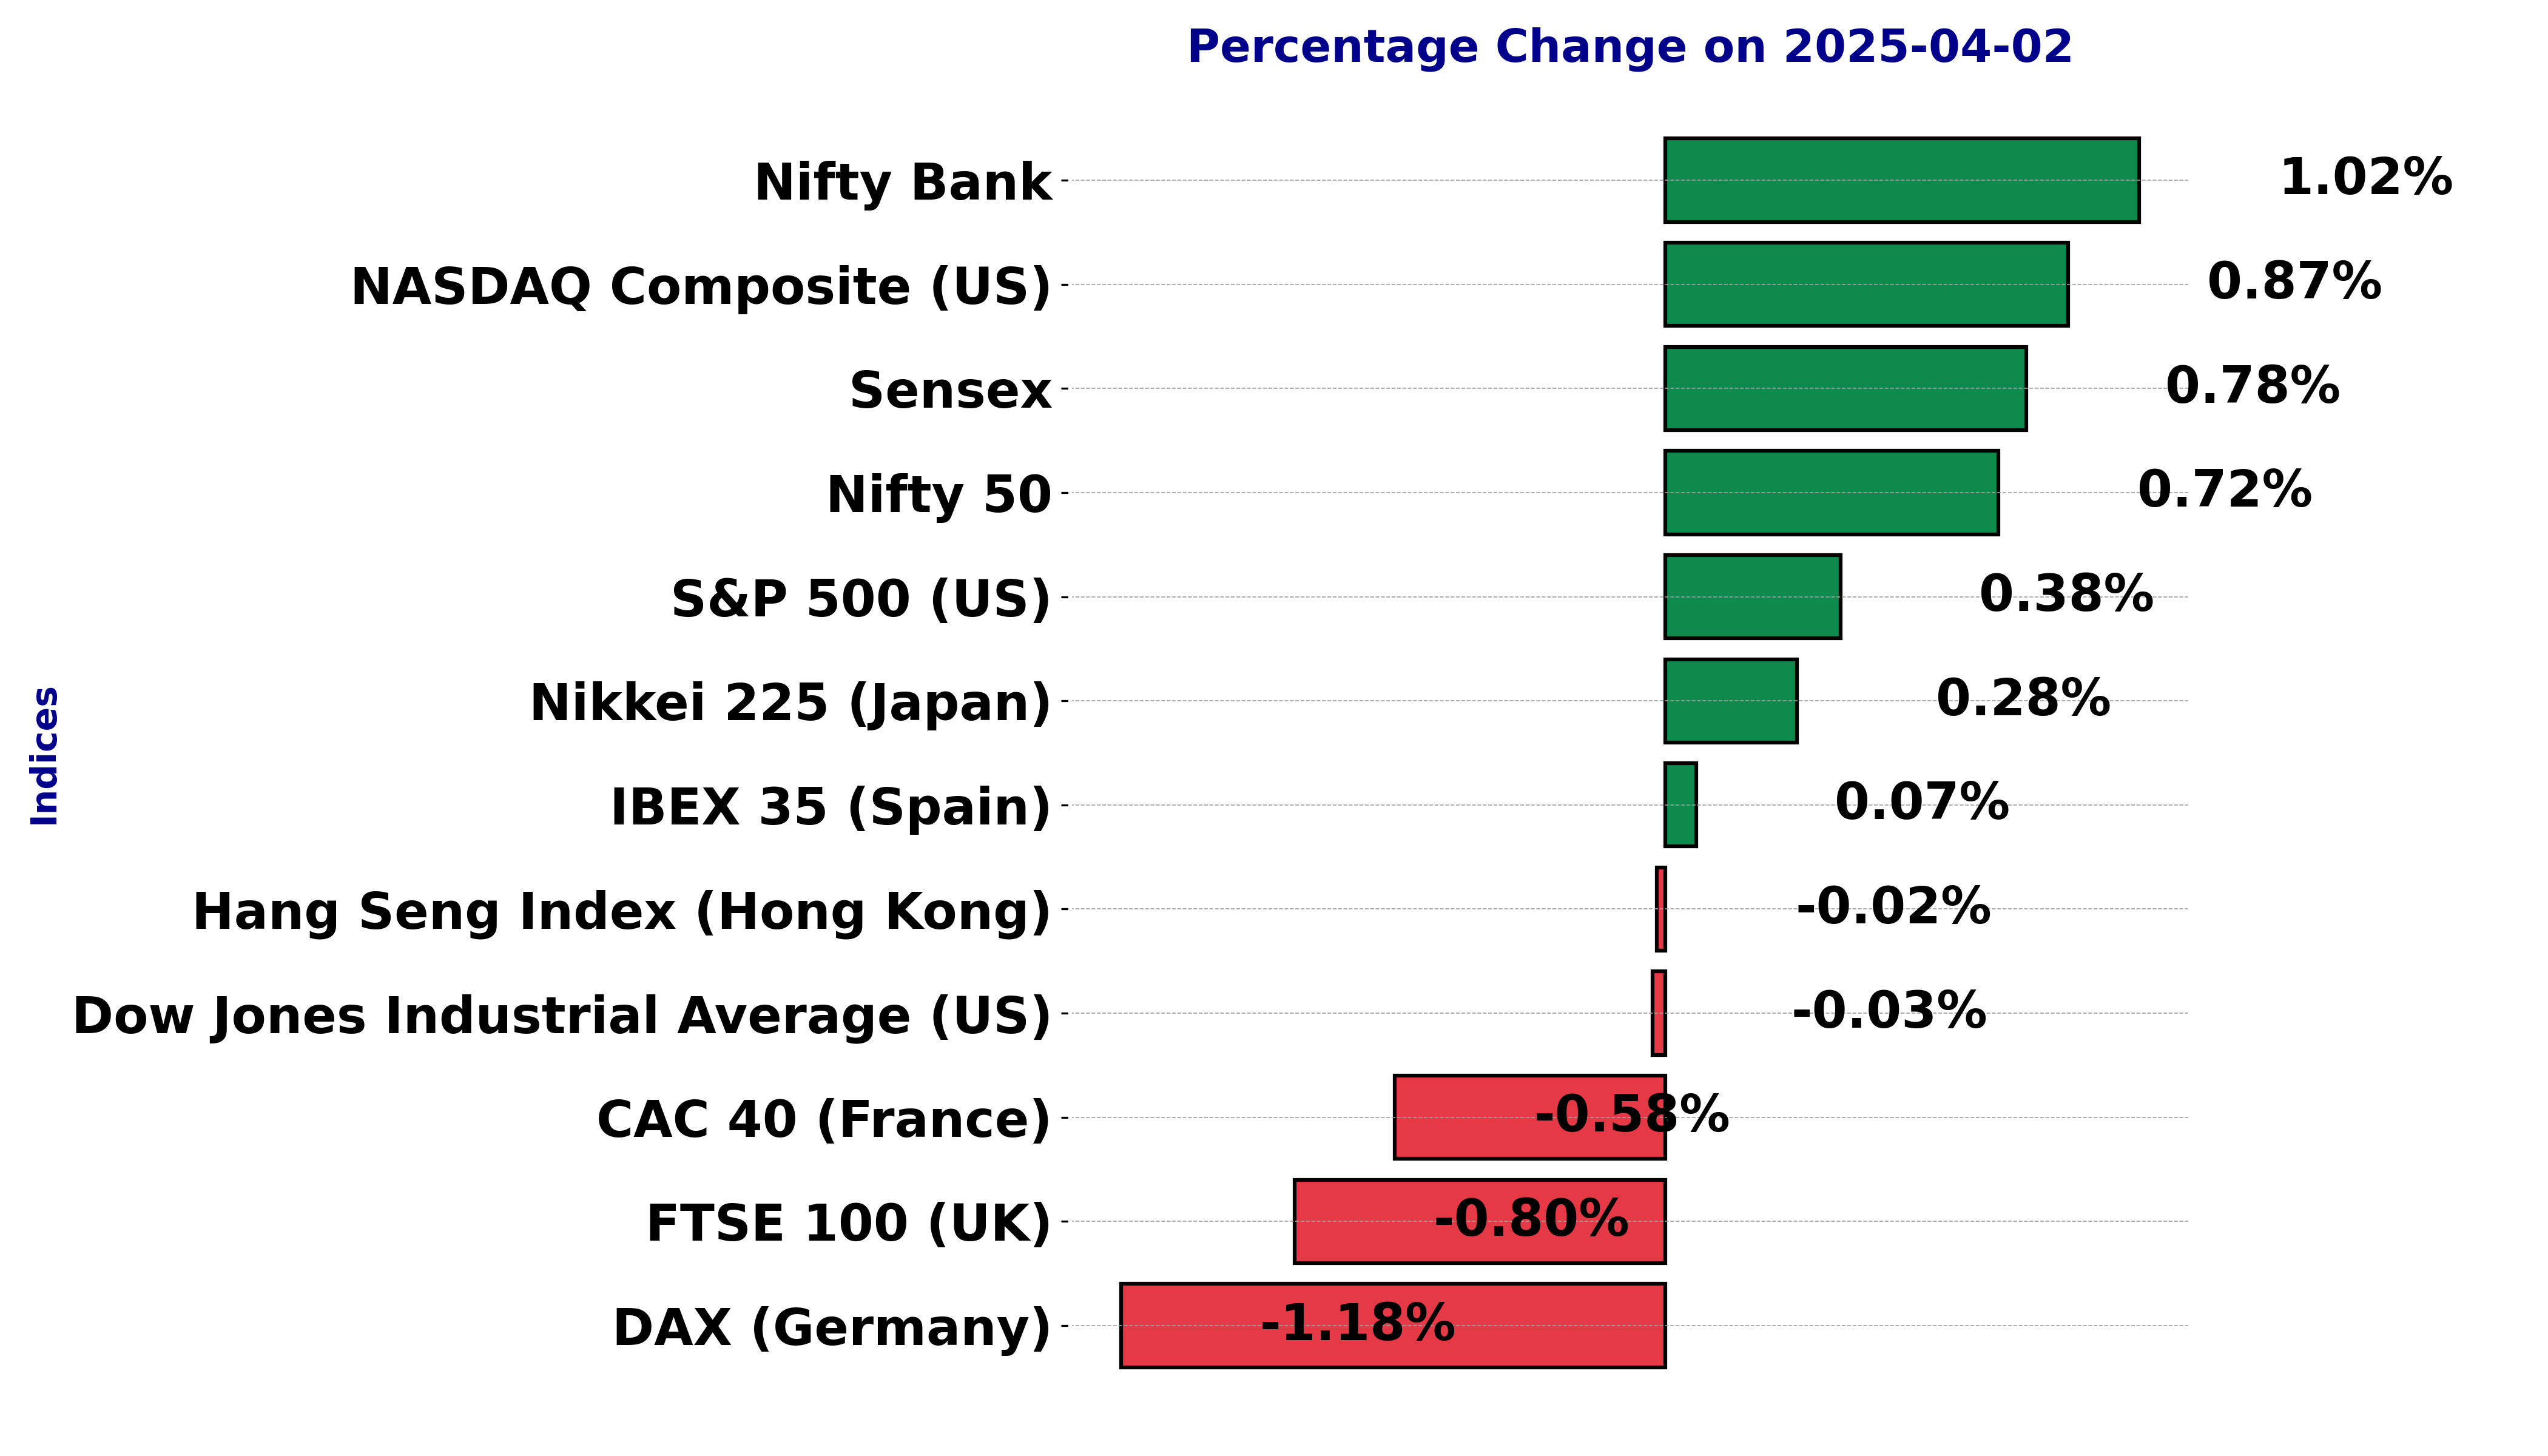
Global stock market indices: How the world markets performed today - 2 April 2025


The international stock market indices showed varied performances on April 02, 2025, reflecting the economic sentiment across different regions.
In this article, we analyze the performance of key global indices including the S&P 500, Dow Jones Industrial Average, NASDAQ Composite, FTSE 100, DAX, CAC 40, IBEX 35, Nikkei 225, Hang Seng, Nifty 50, and BSE Sensex.
Analysis for Sensex - April 02, 2025

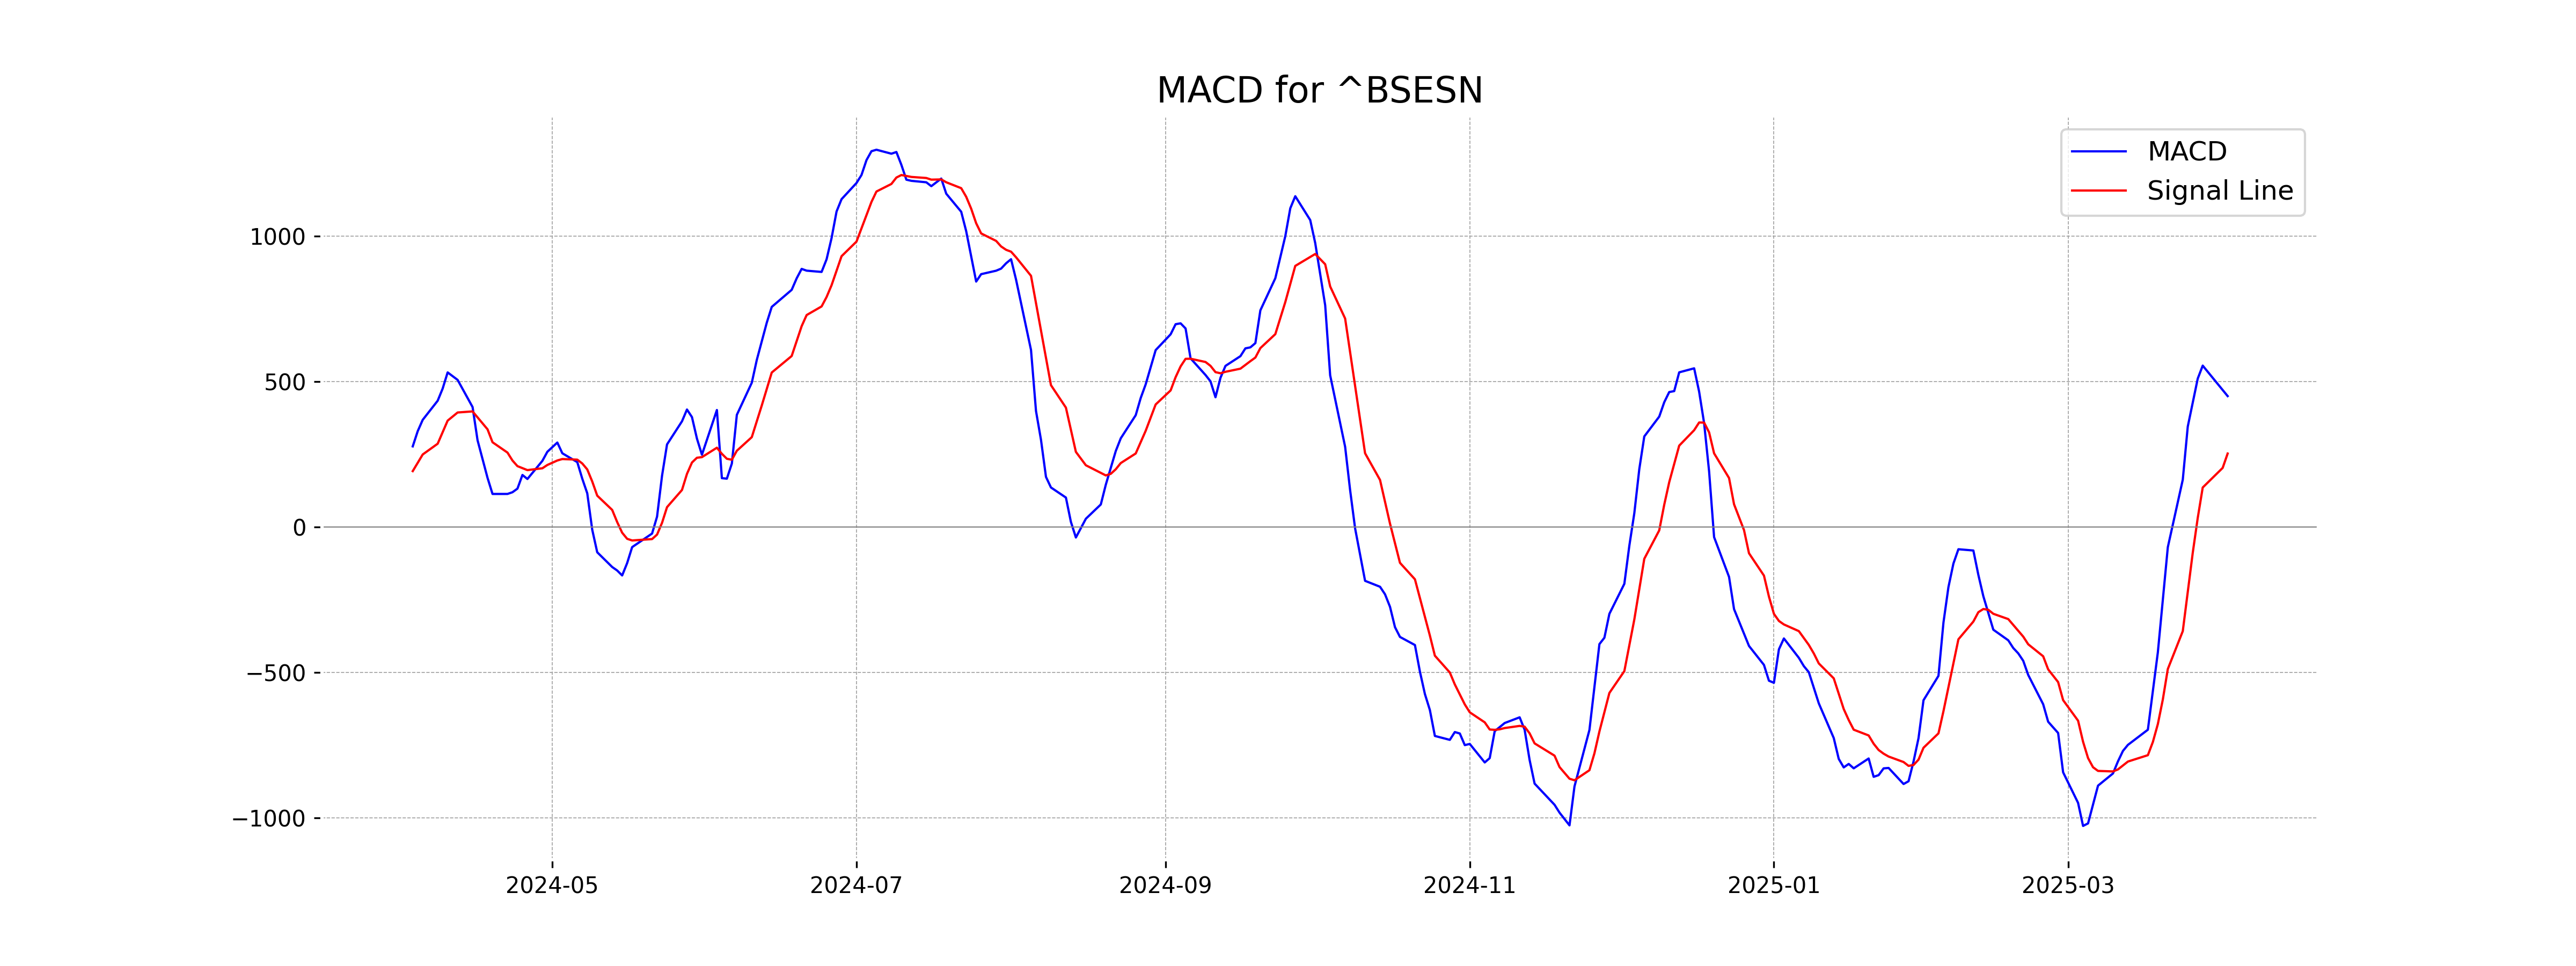
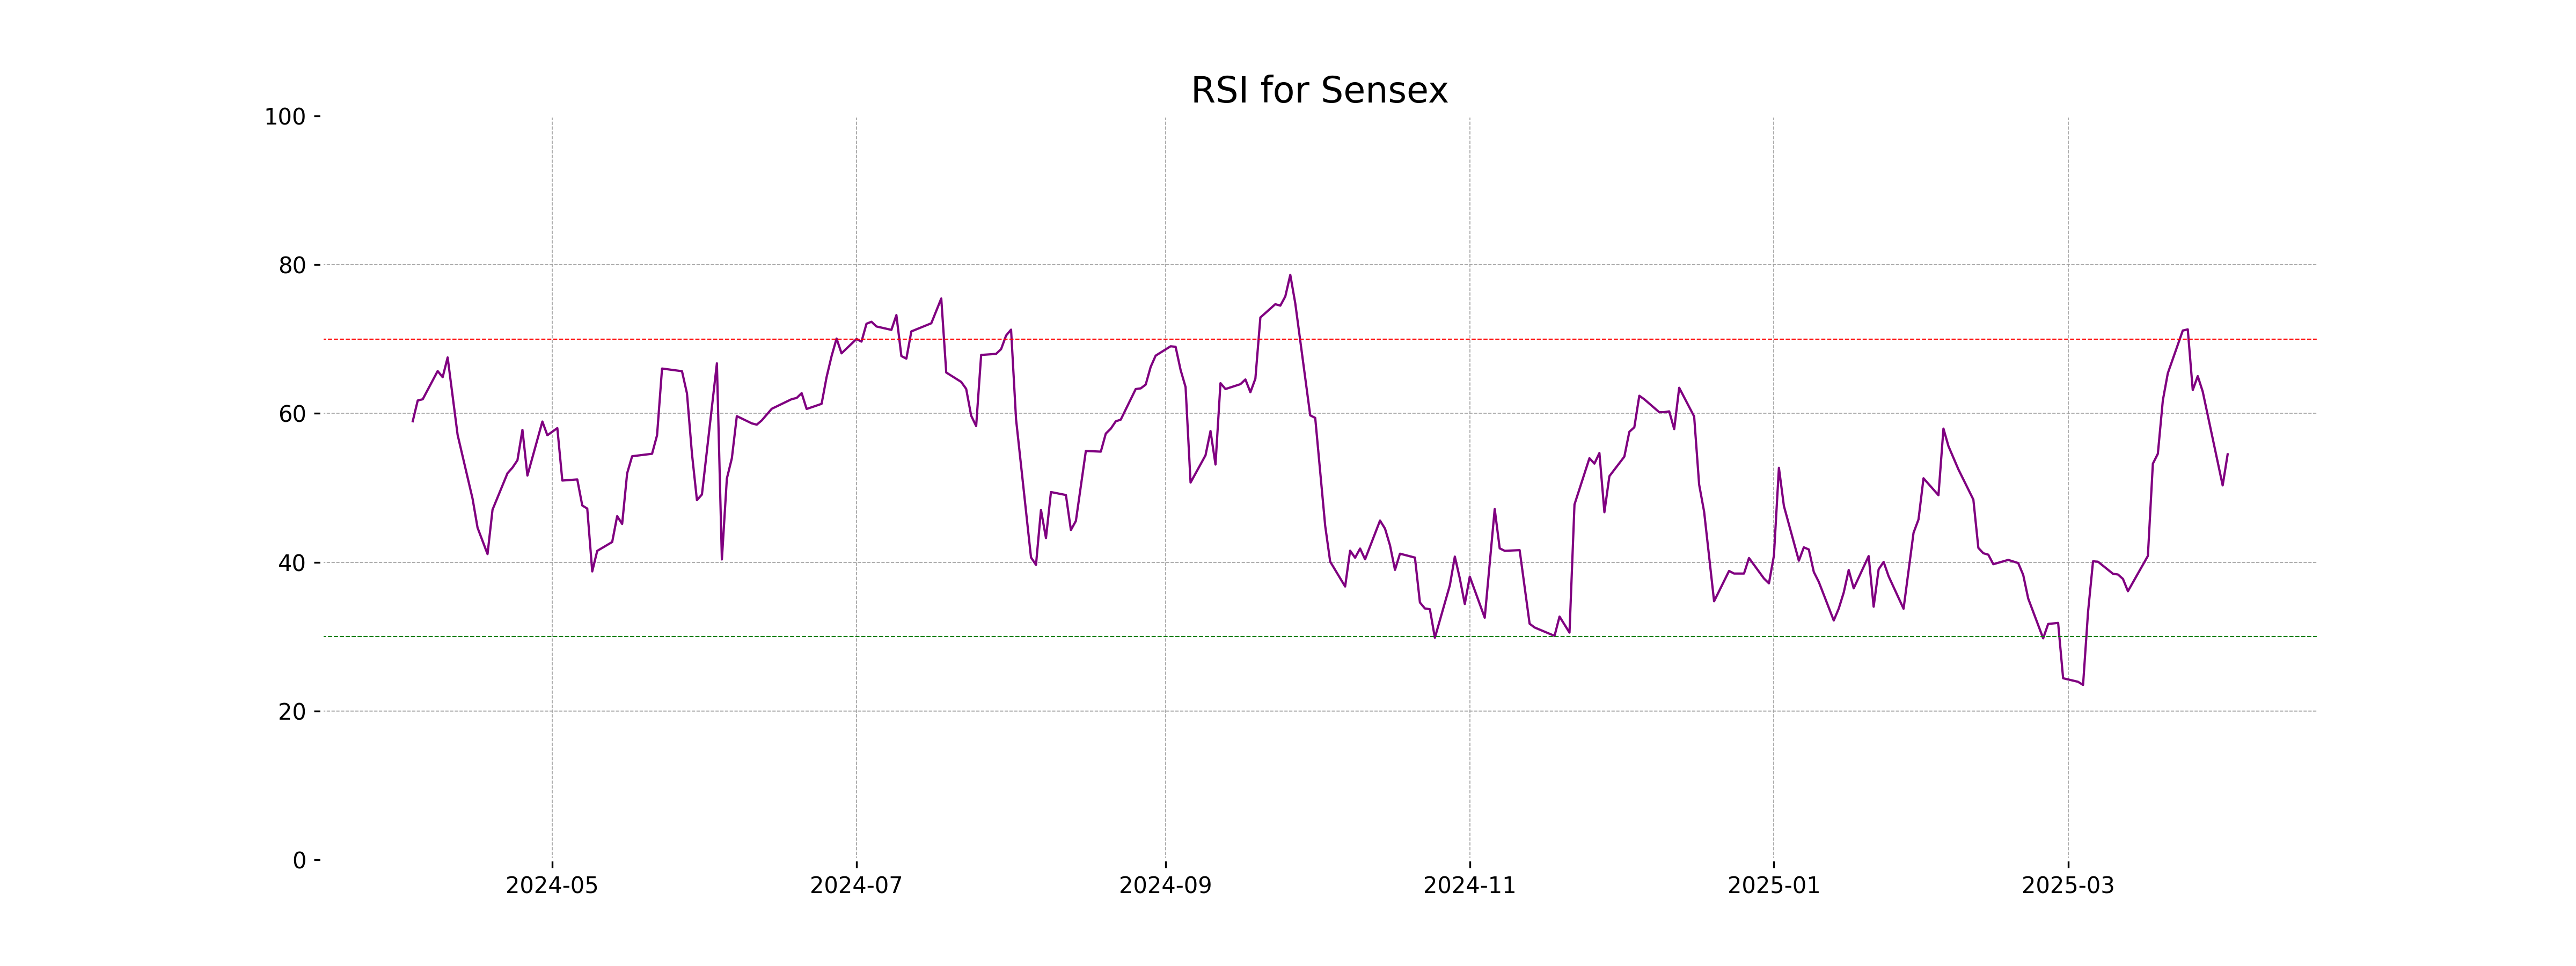
The Sensex performance for the day opened at 76,146.28 and closed higher at 76,617.44, experiencing a notable points change of 592.93 from the previous close of 76,024.51. The percentage change was 0.78%, indicating a positive movement. The current RSI is 54.51, showing moderate strength, while the MACD suggests a bullish trend continuation with a value significantly above its signal line.
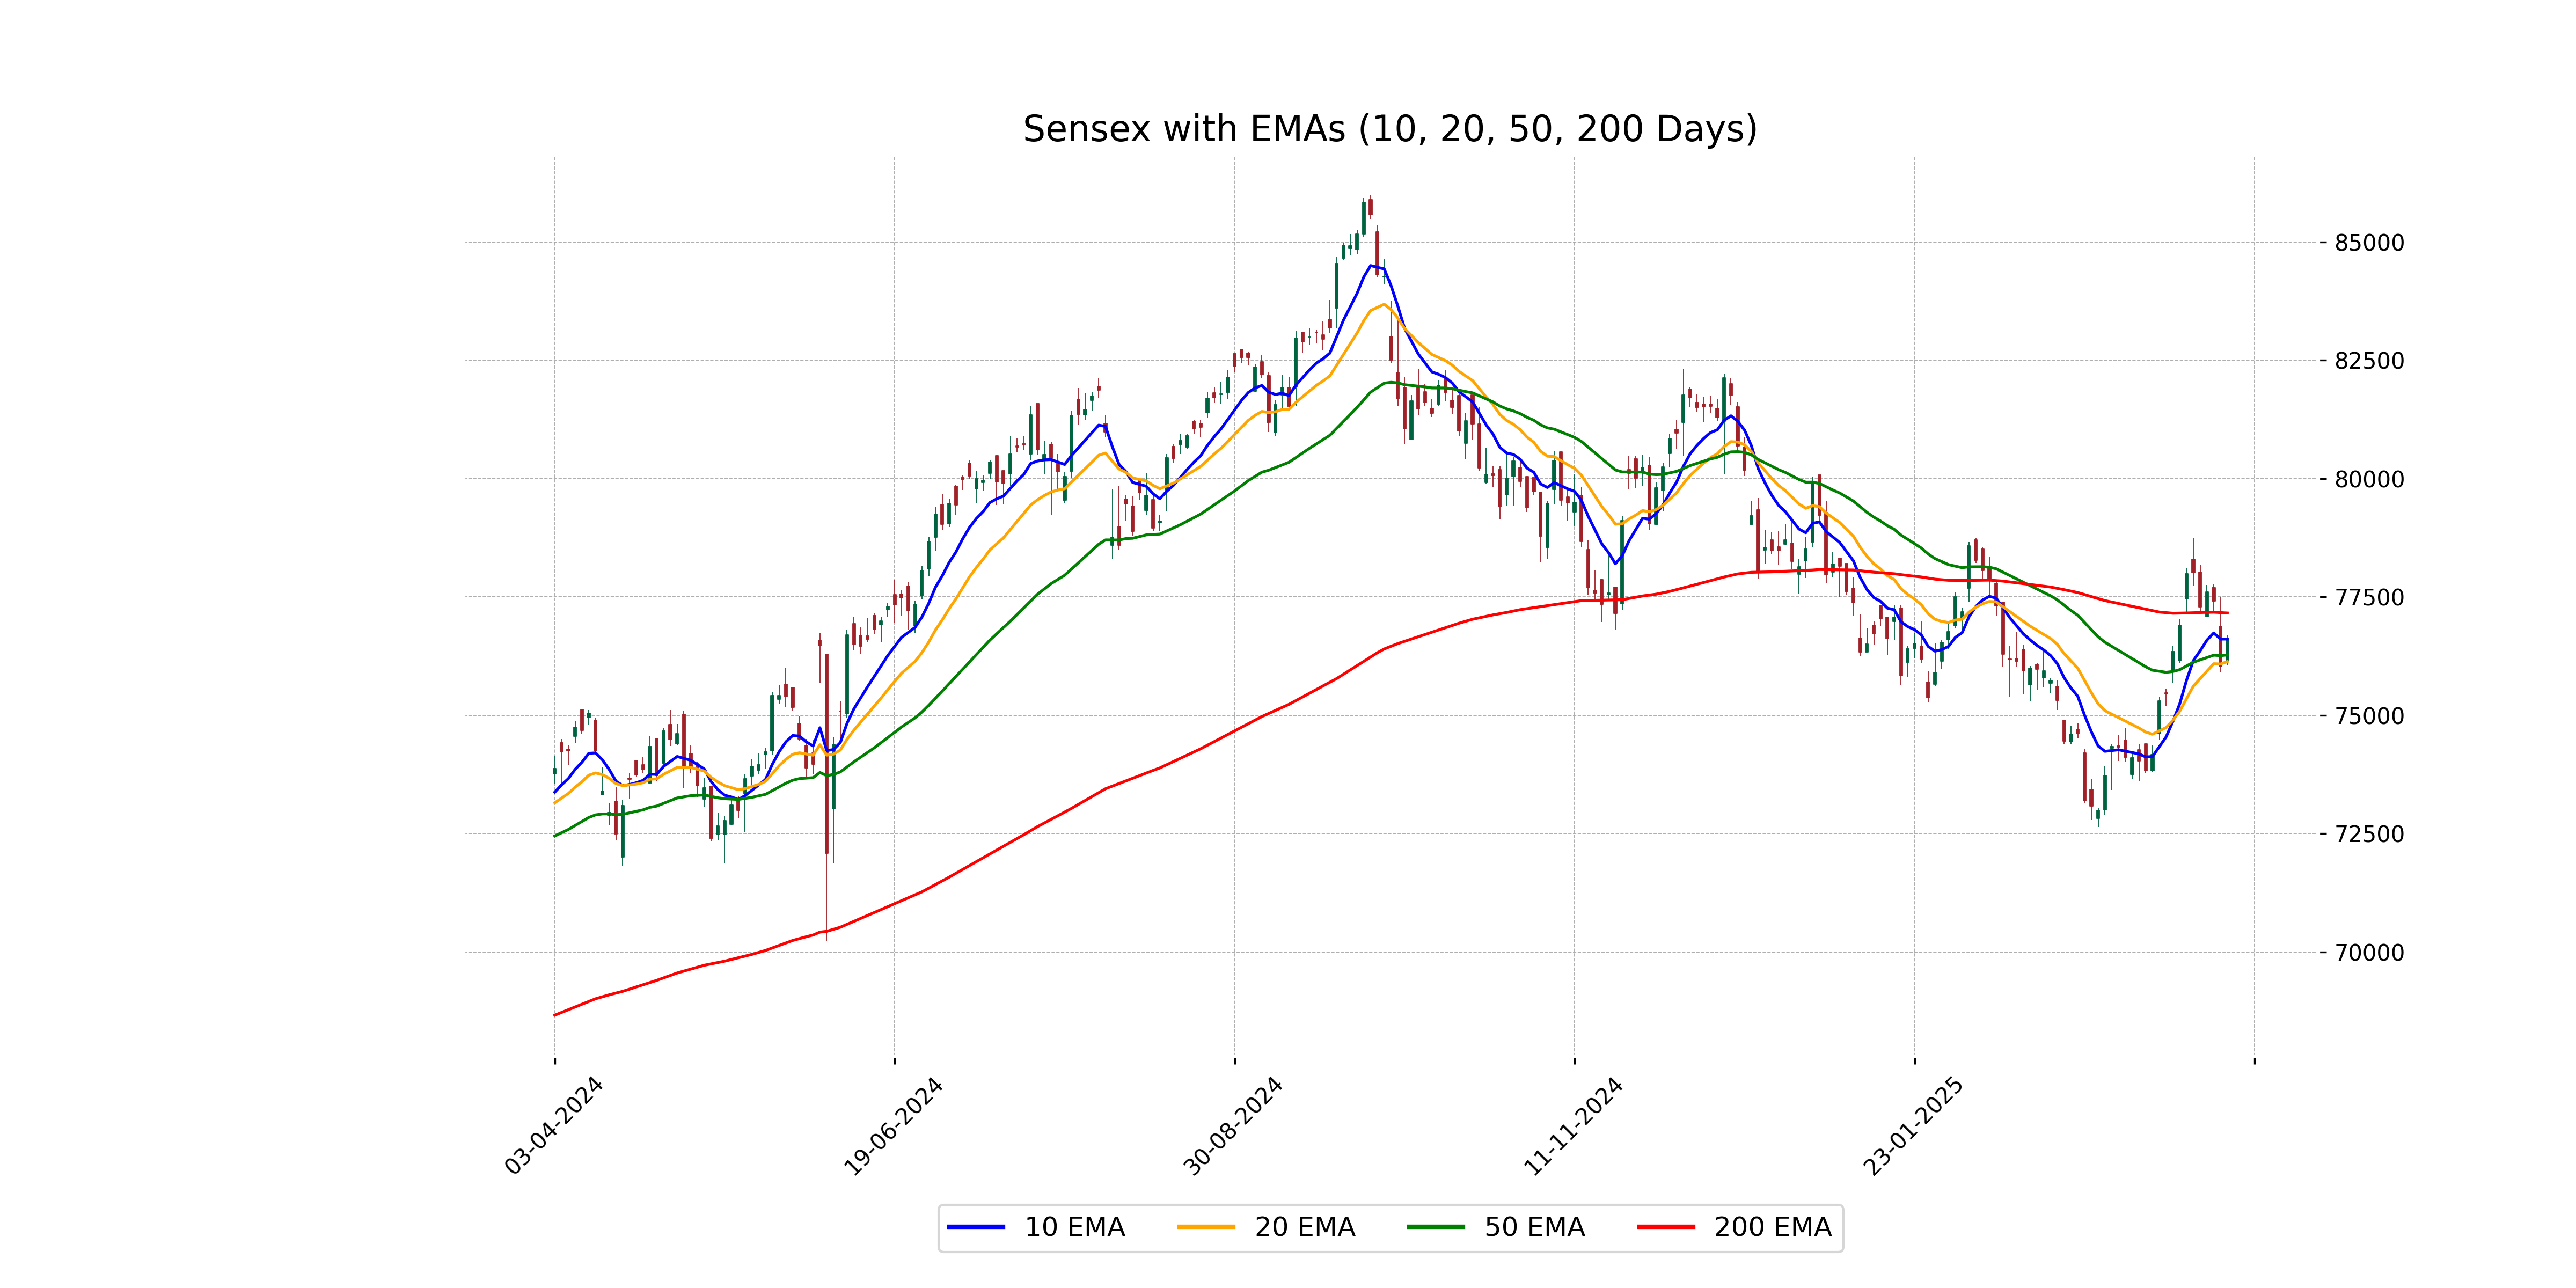
Relationship with Key Moving Averages
The Sensex closed at 76,617.44, which is above its 50-day EMA of 76,272.66 and its 10-day EMA of 76,609.42, suggesting a short-term bullish trend. However, it remains below its 200-day EMA of 77,159.30, indicating potential longer-term resistance.
Moving Averages Trend (MACD)
Based on the stock data for Sensex, the MACD is currently at 450.67, which is above the MACD Signal of 253.15. This indicates a potential bullish momentum, suggesting that the stock price may continue to rise in the near term if the trend persists.
RSI Analysis
The Relative Strength Index (RSI) for Sensex is currently at 54.51. This indicates that the index is in a neutral zone, suggesting neither overbought nor oversold conditions. Typically, an RSI above 70 suggests overbought conditions, while an RSI below 30 indicates oversold conditions.
Analysis for Dow Jones Industrial Average (US) - April 02, 2025
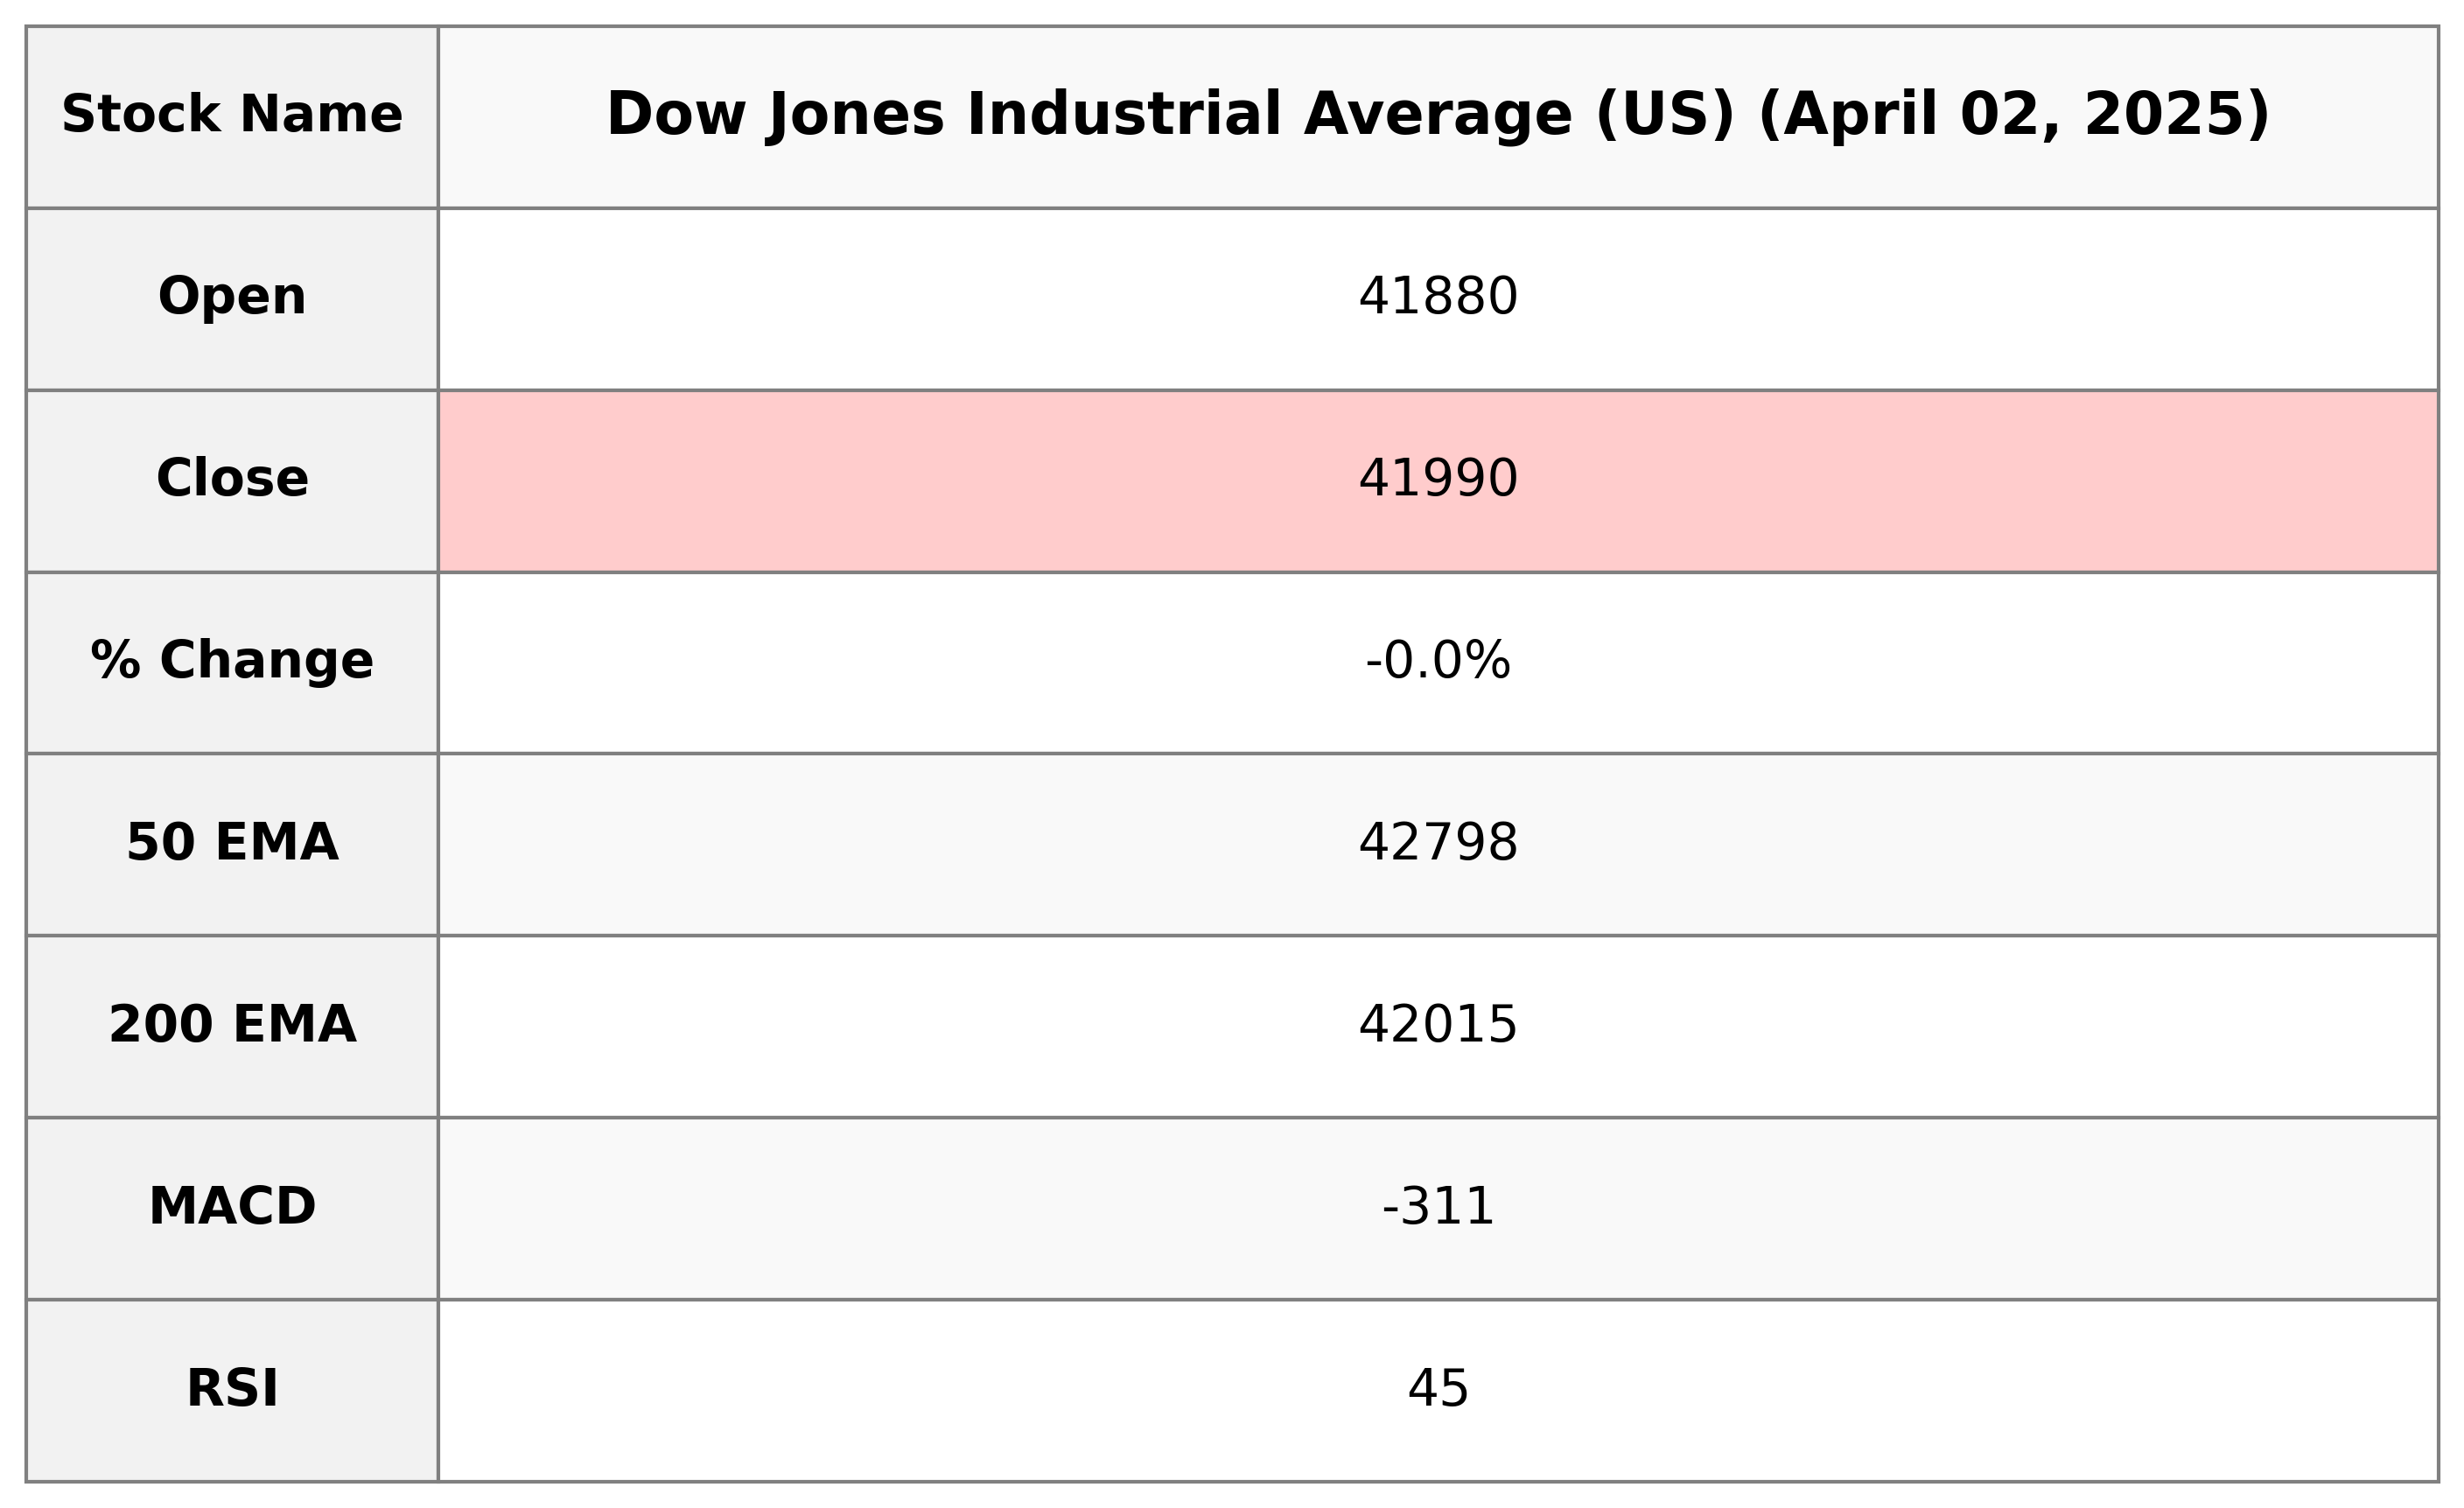
The Dow Jones Industrial Average (US) opened at 41,879.75 and closed at 41,989.96, showing a slight decline with a percentage change of -0.03%. The index had a high of 42,140.66 and a low of 41,519.90. The volume of shares traded was 514,610,000. The Relative Strength Index (RSI) is at 44.61, indicating a potentially neutral market trend.
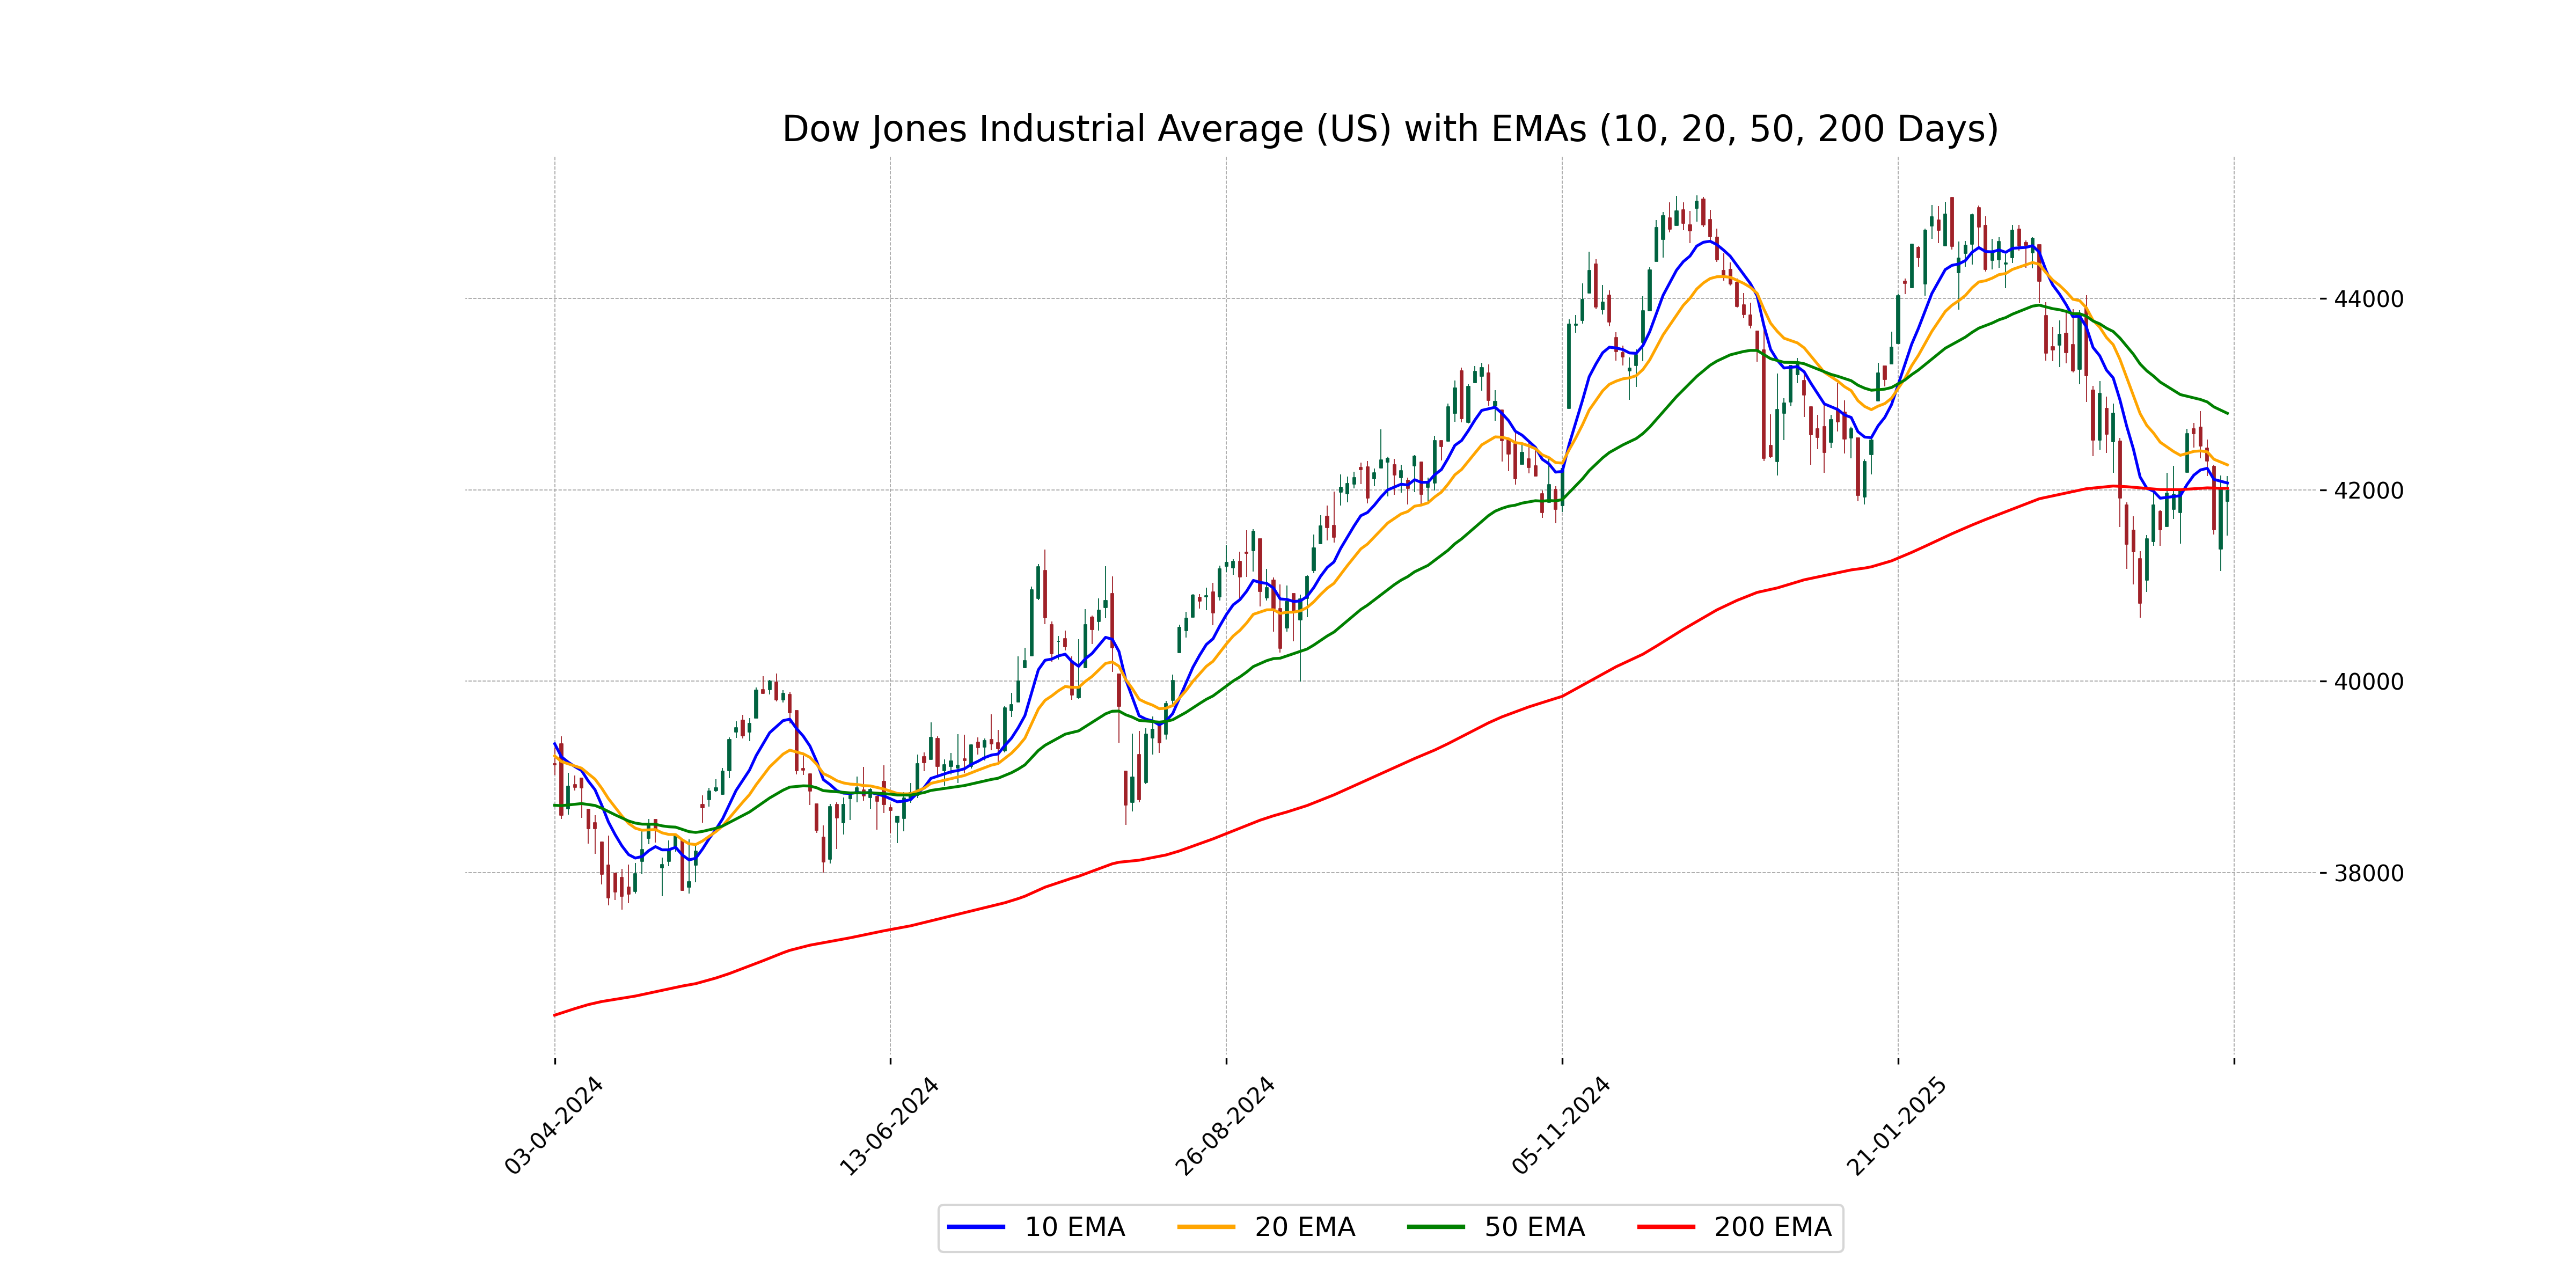
Relationship with Key Moving Averages
The Dow Jones Industrial Average closed below its 50-day EMA of 42798.13 and its 20-day EMA of 42259.65, indicating a bearish trend. However, it's trading above the 200-day EMA of 42014.65, which could still suggest a long-term support.
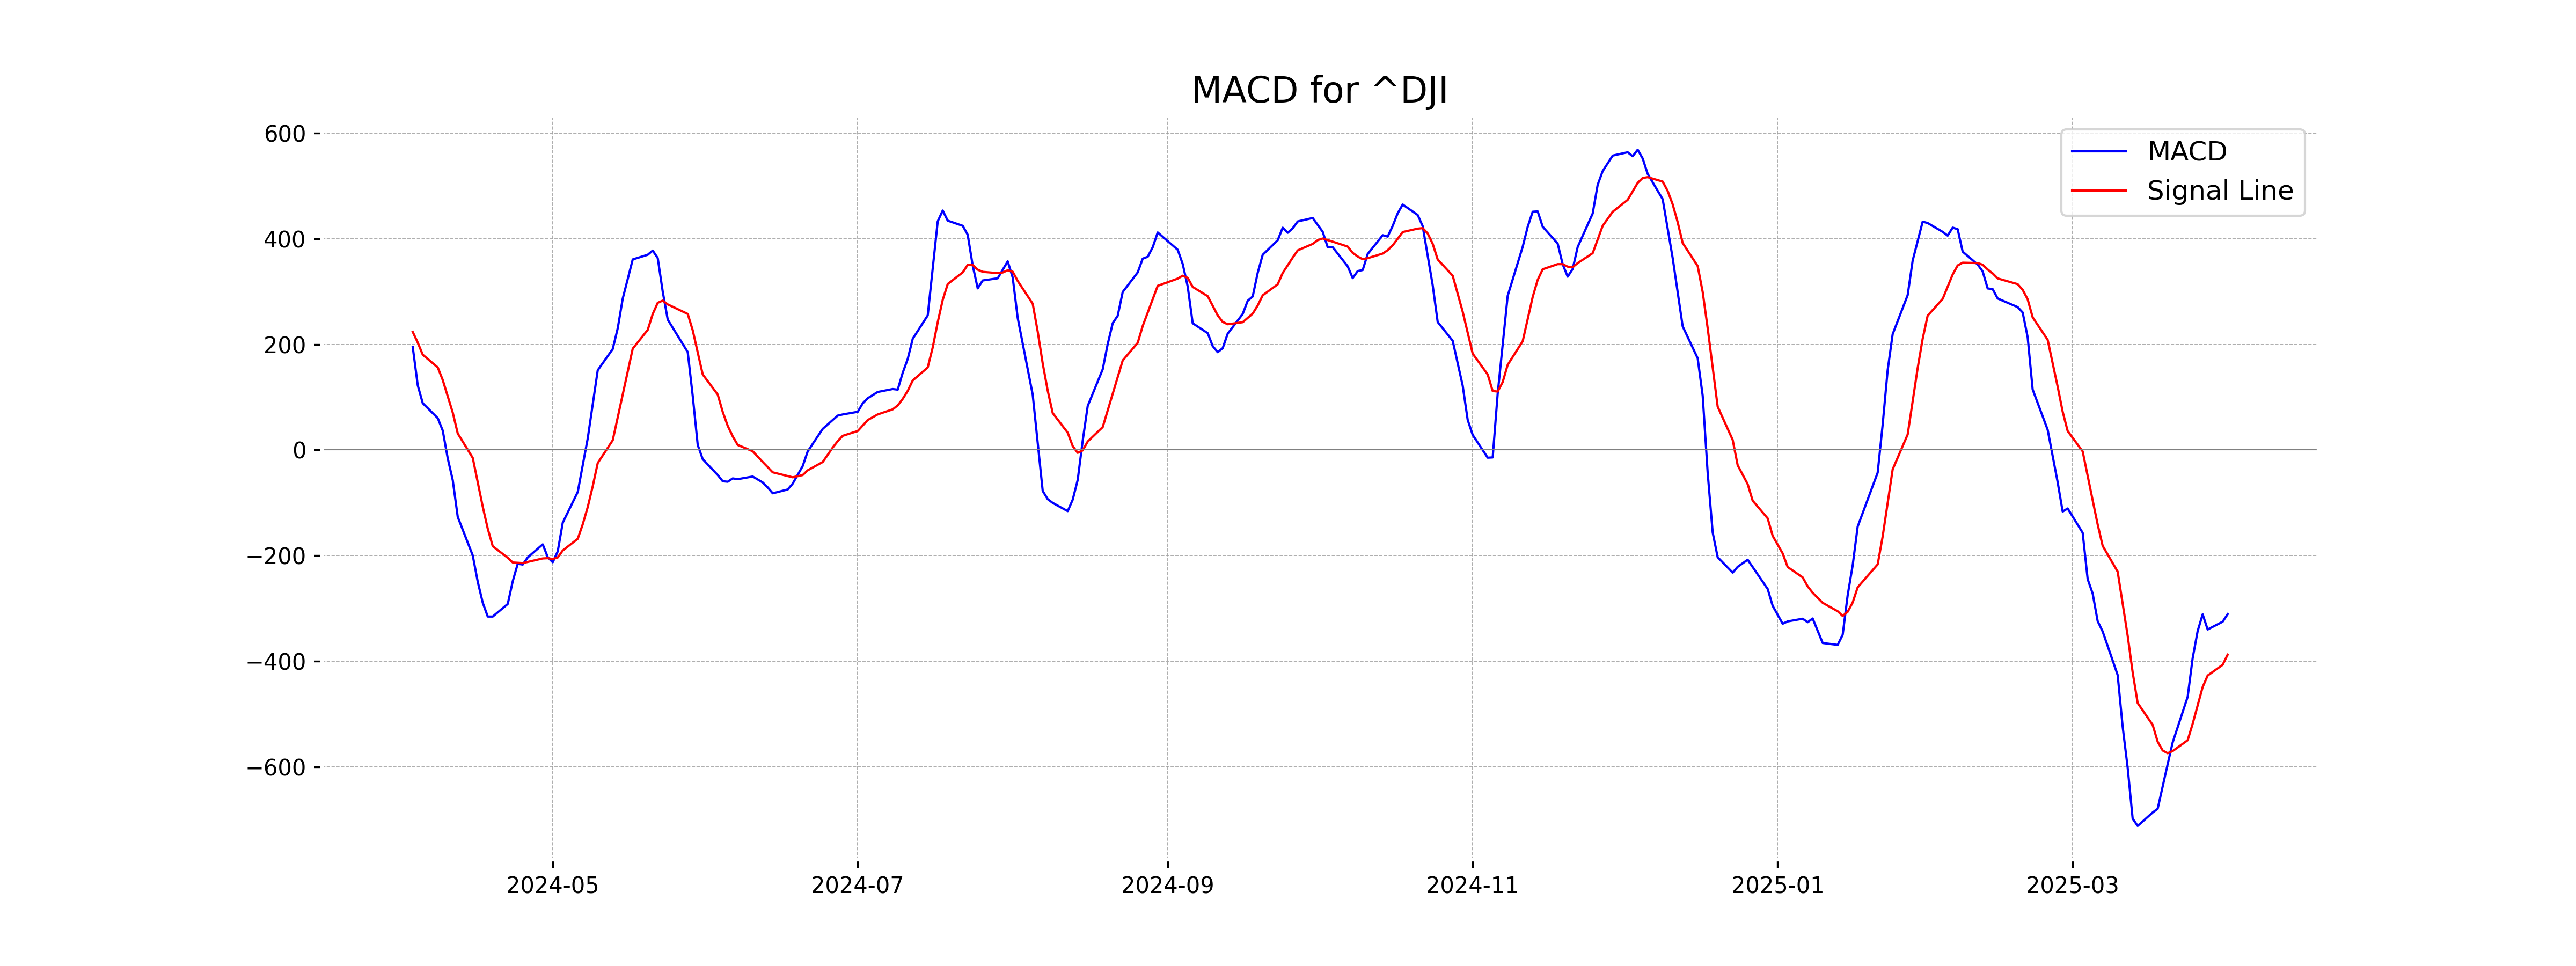
Moving Averages Trend (MACD)
The Dow Jones Industrial Average's MACD value is -310.67, which is above the MACD Signal line of -387.32. This indicates a potential bullish momentum, as the MACD line is moving upward towards the signal line, suggesting that the recent bearish trend might be weakening.
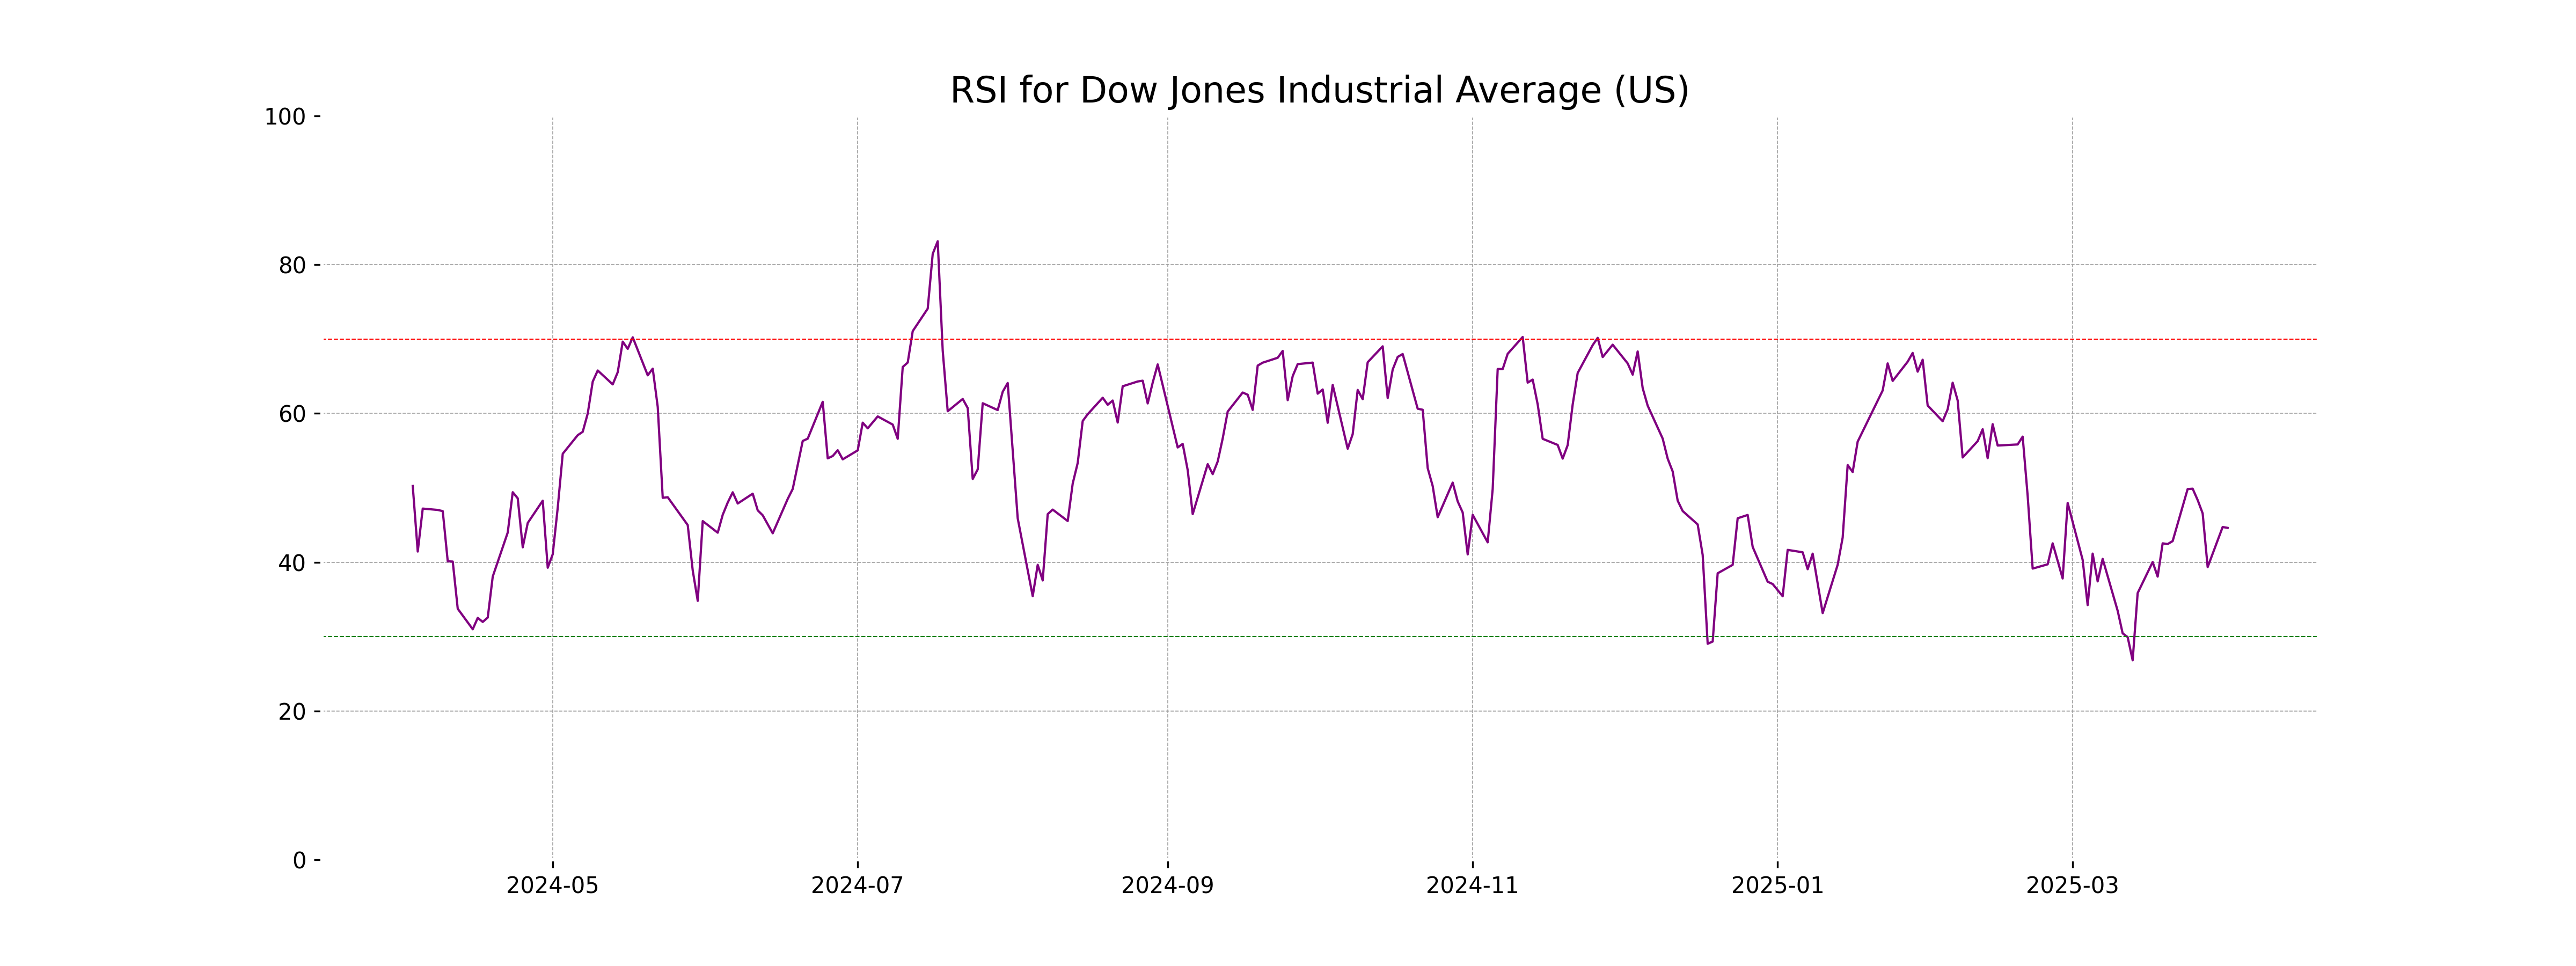
RSI Analysis
RSI Analysis for Dow Jones Industrial Average (US): The Relative Strength Index (RSI) is at 44.61, indicating that the market is in a neutral zone, closer to being oversold than overbought. This suggests a potential buying opportunity if the trend continues downward, as values below 30 typically indicate an oversold condition.
Analysis for CAC 40 (France) - April 02, 2025
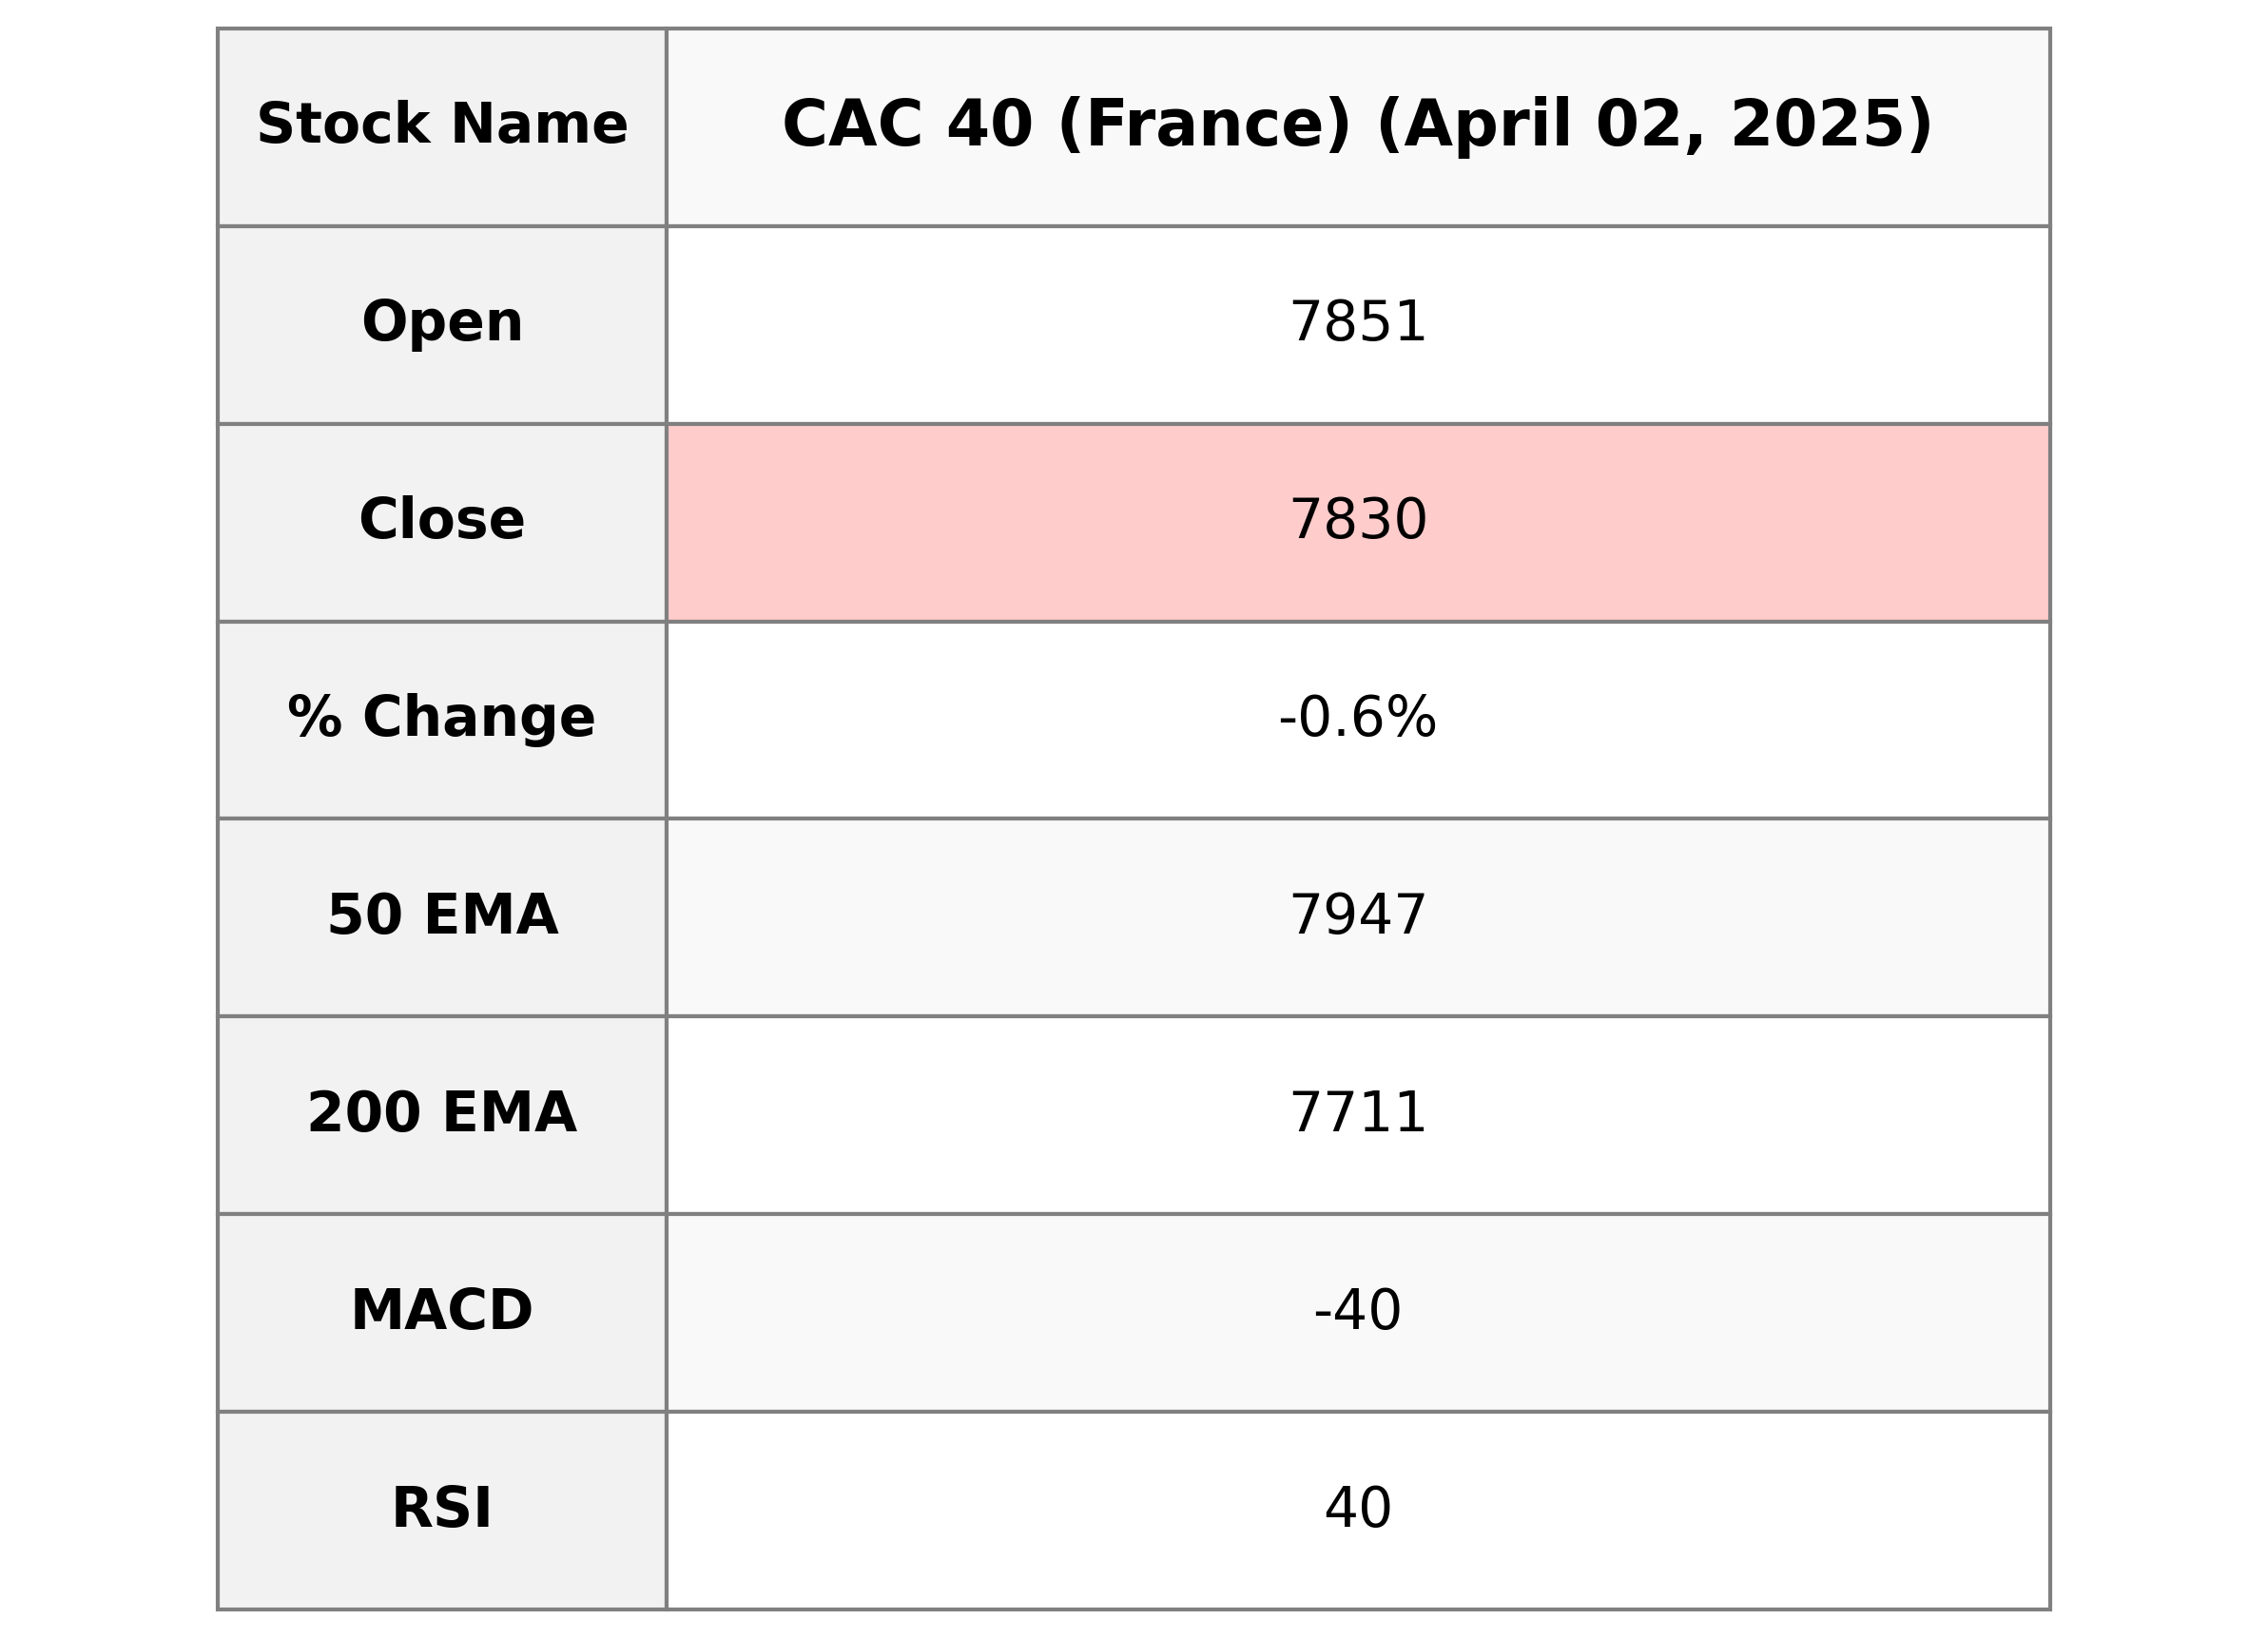
The CAC 40 (France) opened at 7850.88 and closed at 7830.33, marking a decrease of 0.58% from the previous close of 7876.36. The index experienced a range between a high of 7859.41 and a low of 7811.00. The RSI is at 40.28, indicating potential bearish momentum, while the MACD suggests a negative trend with a value of -40.48.
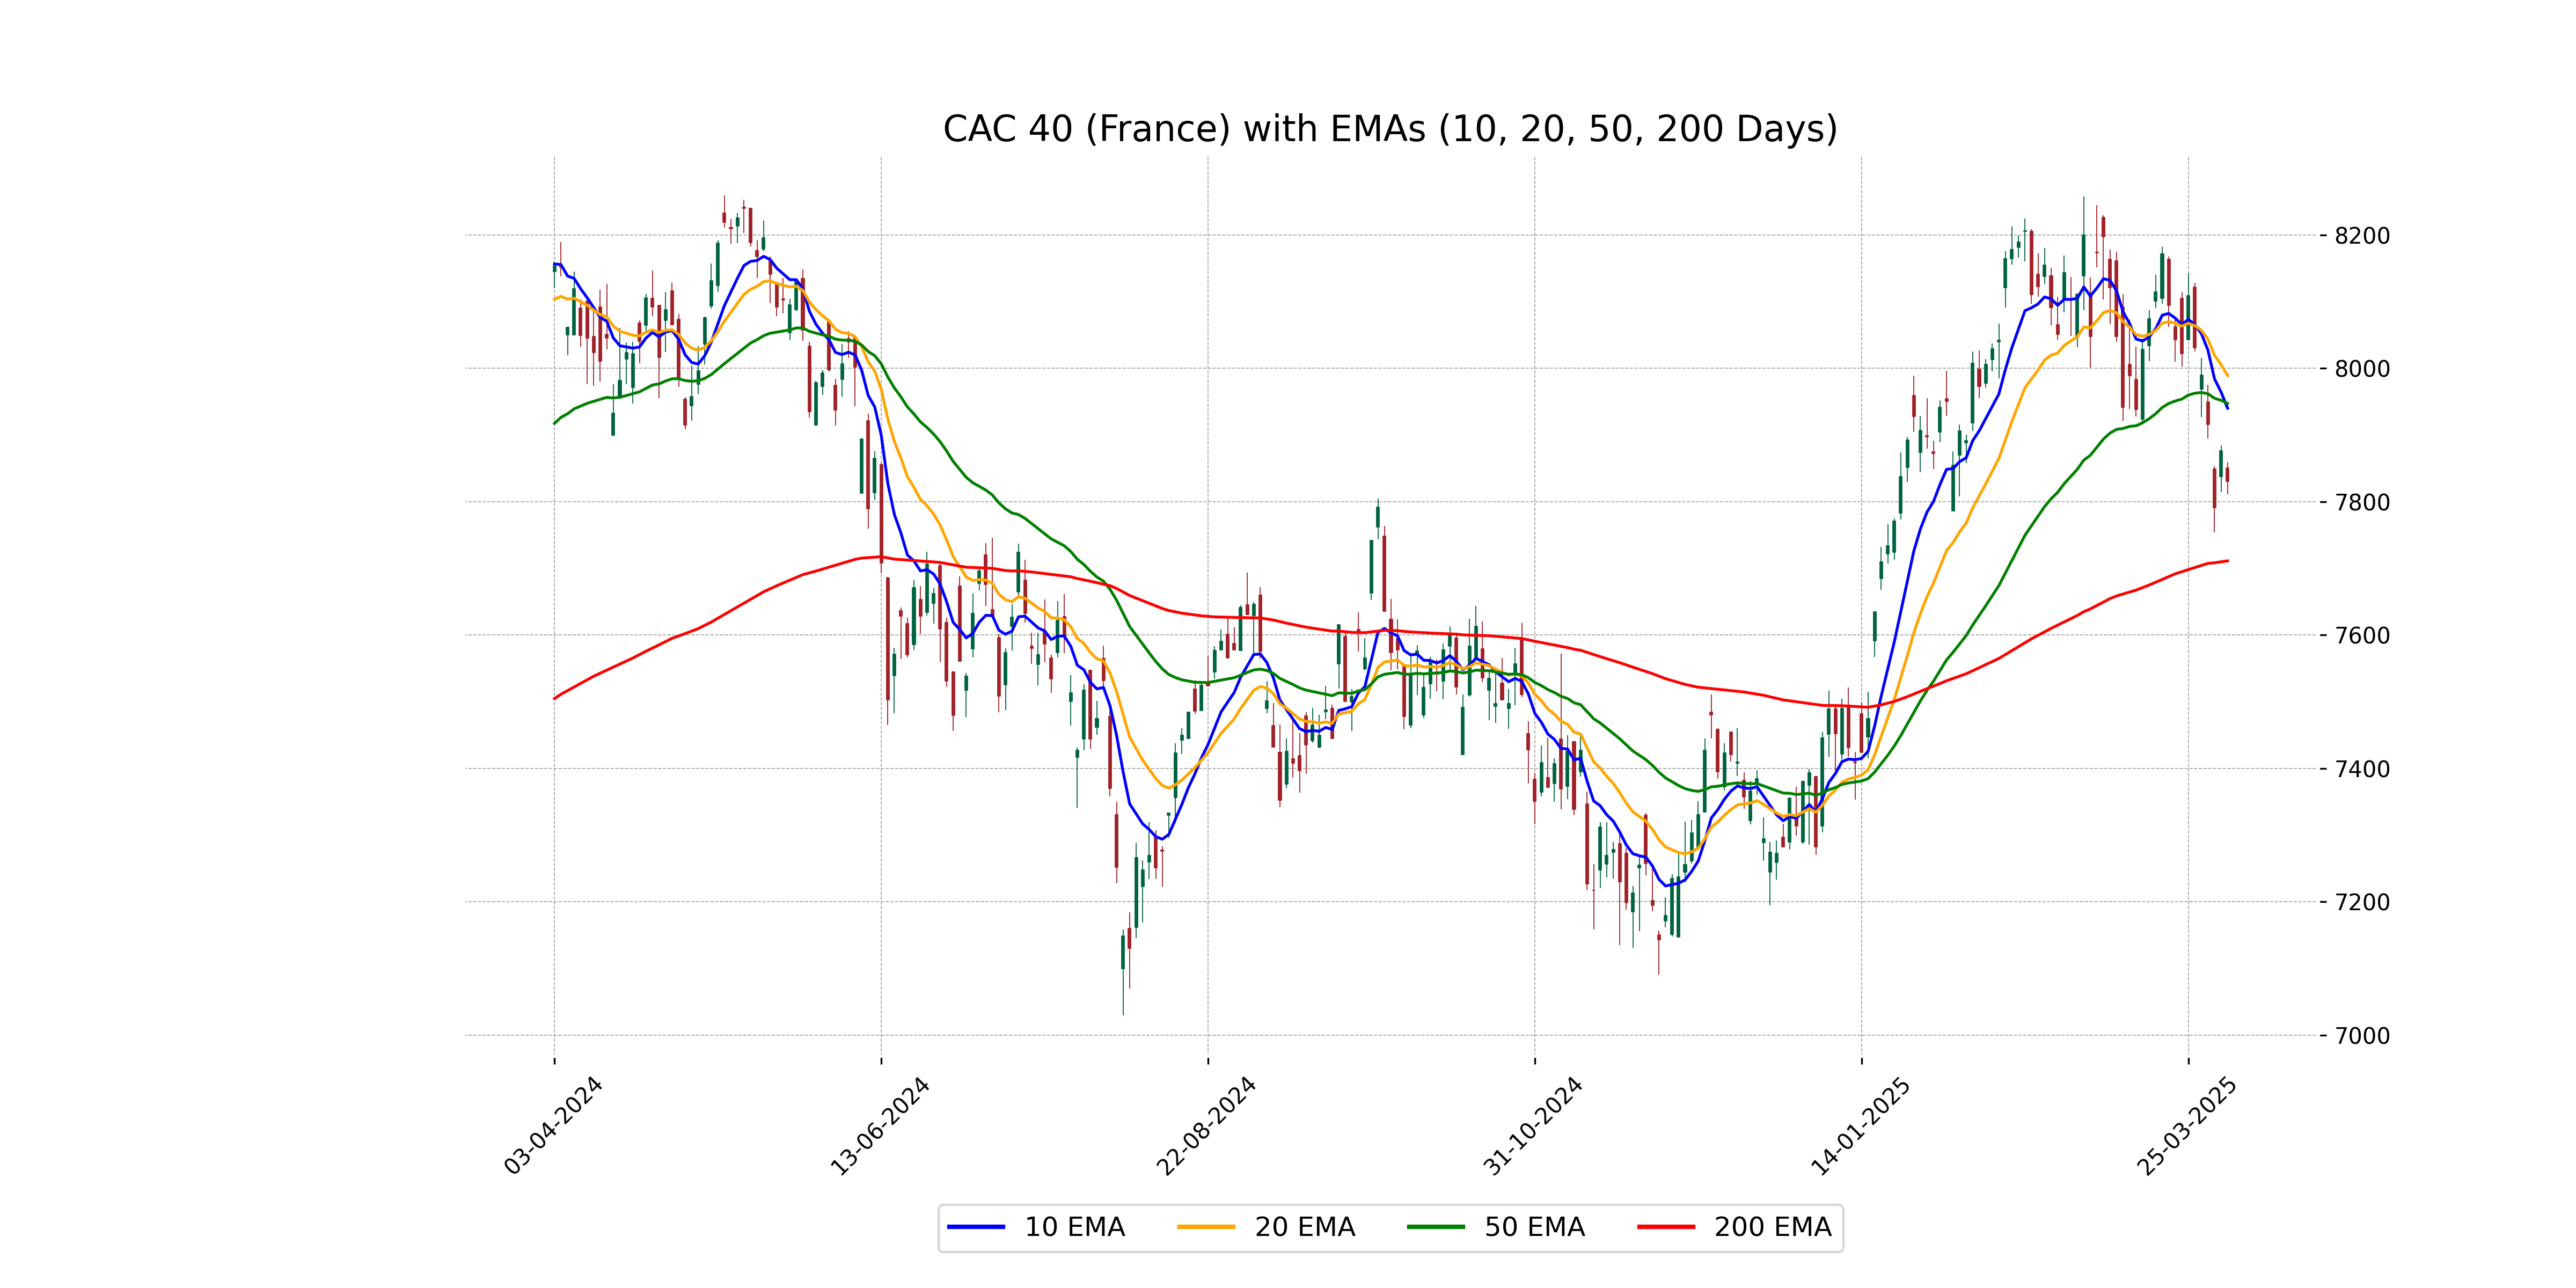
Relationship with Key Moving Averages
The CAC 40's closing price of 7830.33 is currently below its 50-day EMA (7947.34), 10-day EMA (7940.19), and 20-day EMA (7989.18), indicating potential bearish momentum. The 200-day EMA is at 7711.27, and with the RSI at 40.28, the index is nearing oversold territory.
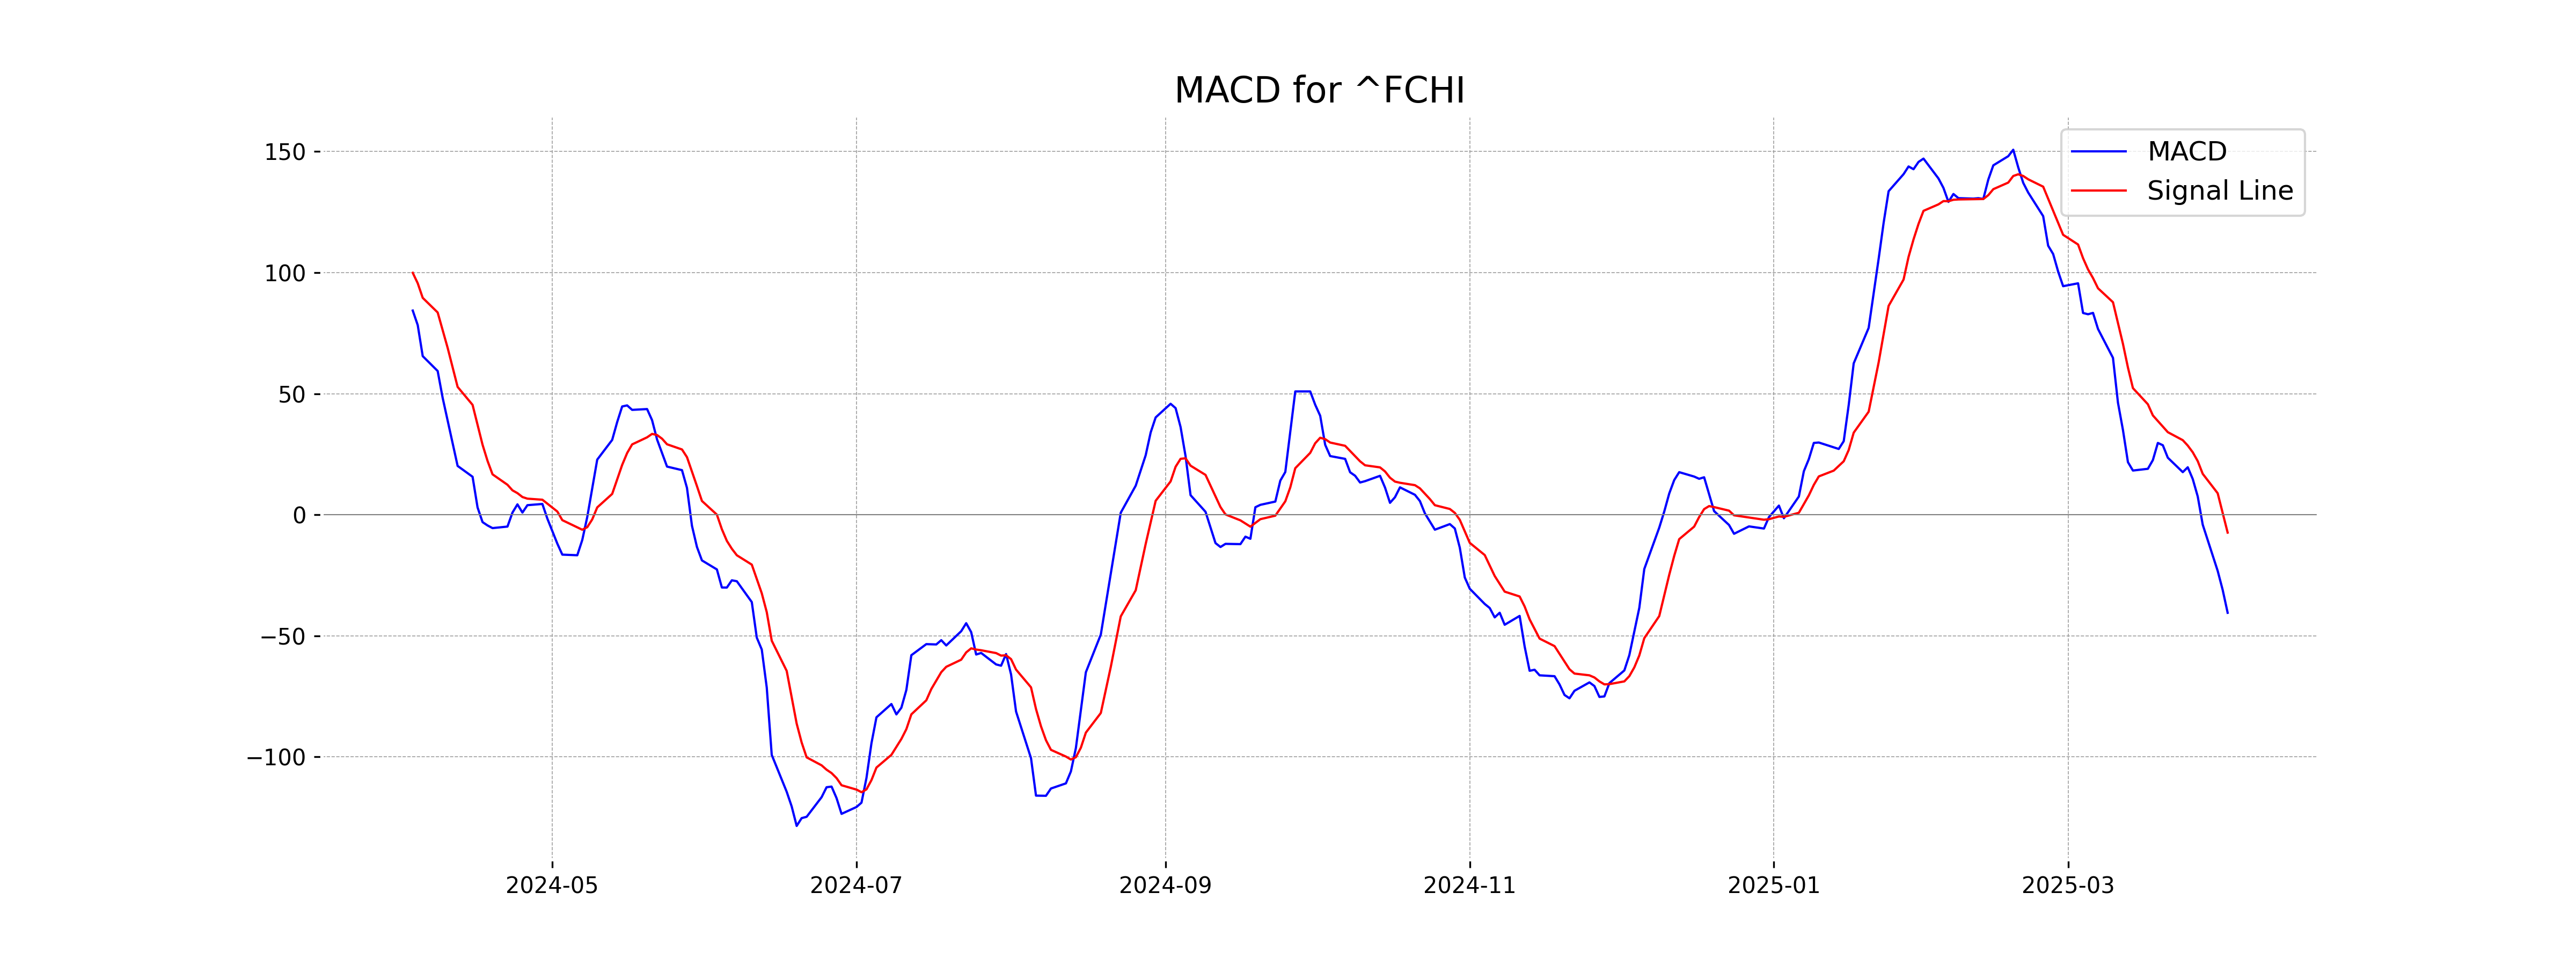
Moving Averages Trend (MACD)
The CAC 40 (France) is currently showing a negative MACD of -40.48, along with a MACD Signal of -7.36, indicating a bearish momentum. This suggests potential downward pressure on the index in the short term.
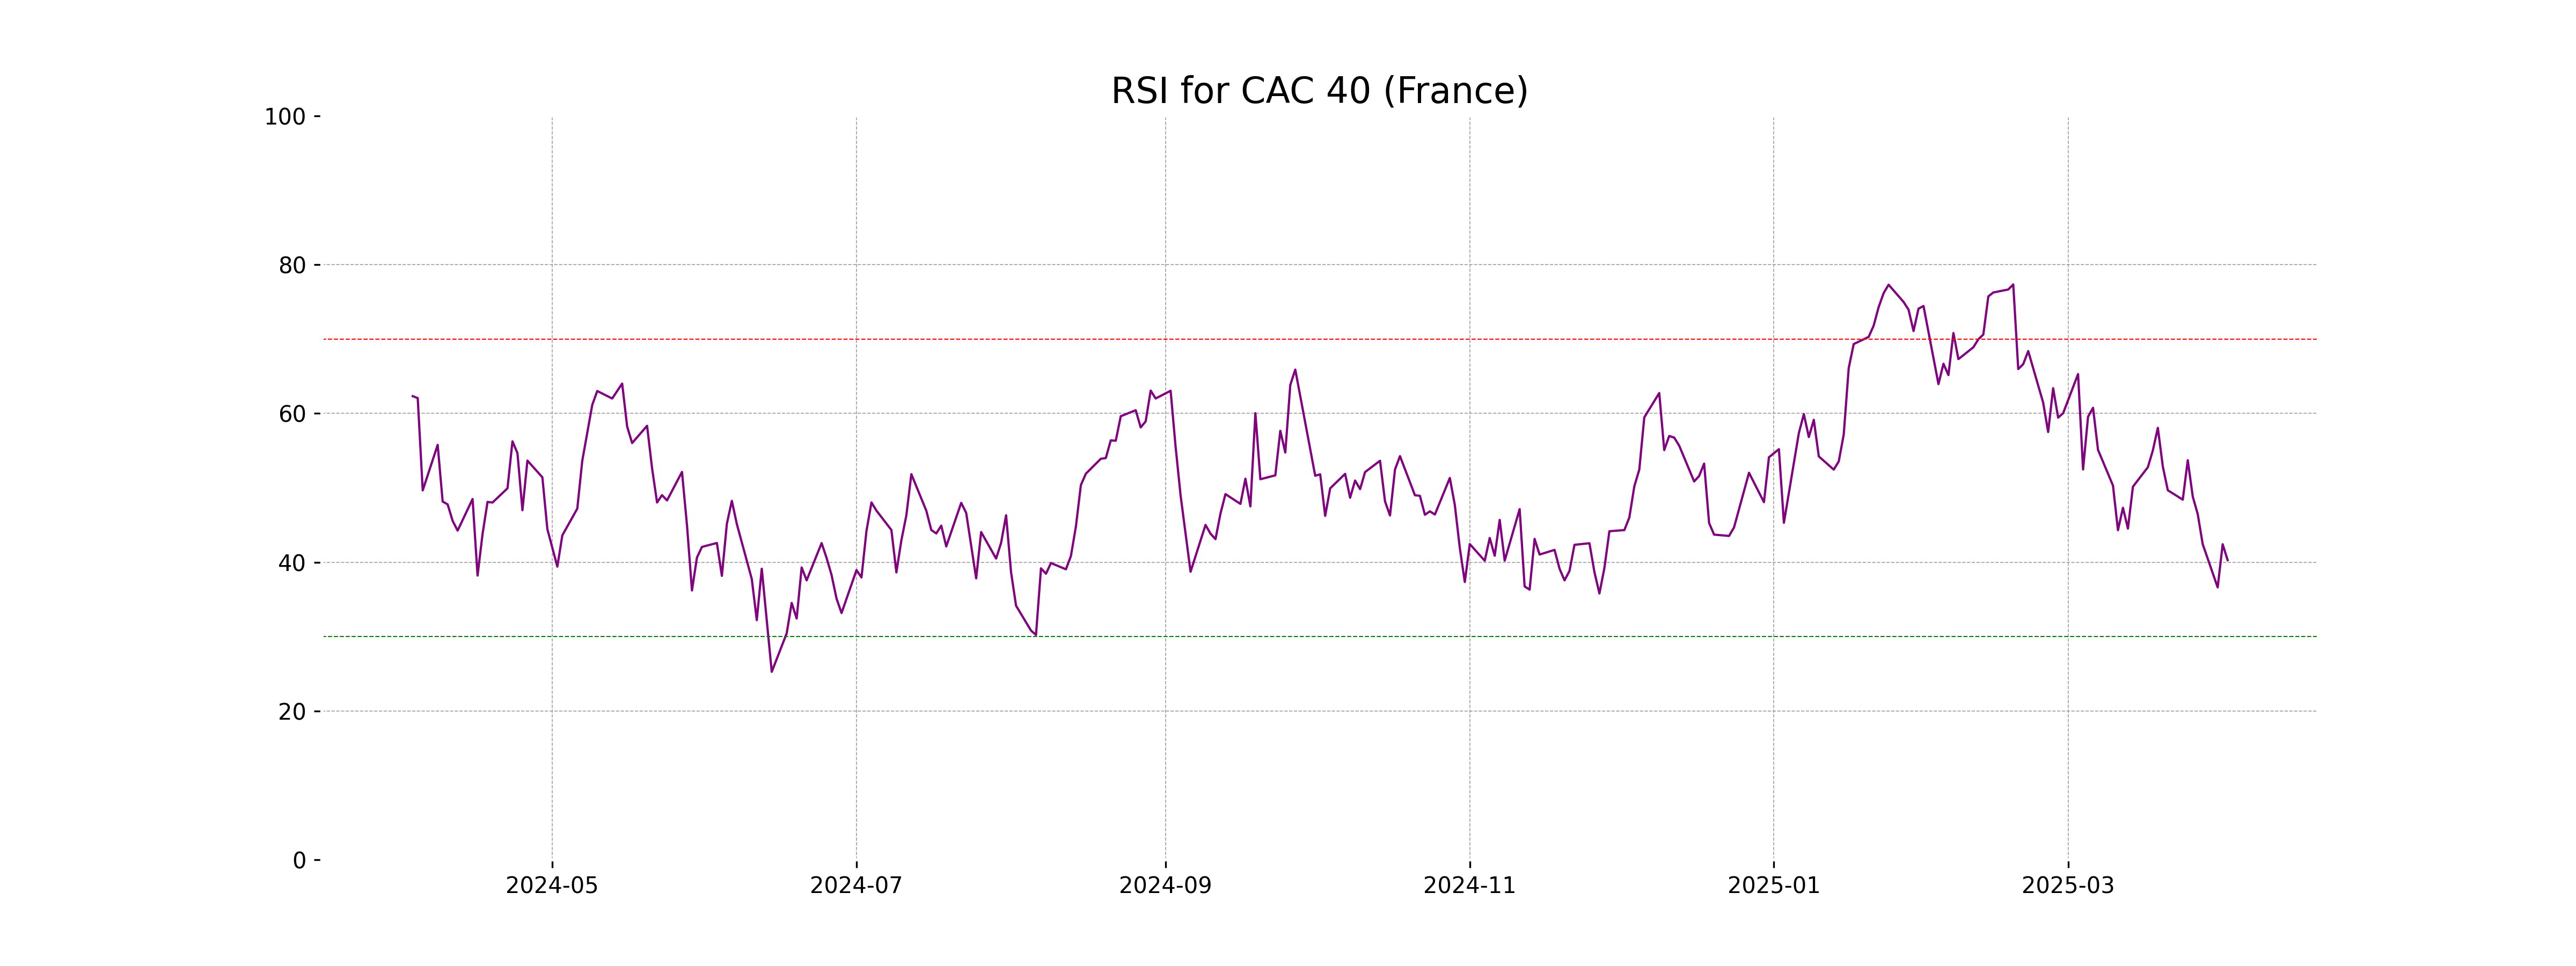
RSI Analysis
Relative Strength Index (RSI) Analysis for CAC 40 (France): The RSI value for CAC 40 is 40.28, indicating a bearish trend as it remains below the neutral level of 50. This suggests that the index might be experiencing selling pressure, with potential for further downside unless buying interest increases.
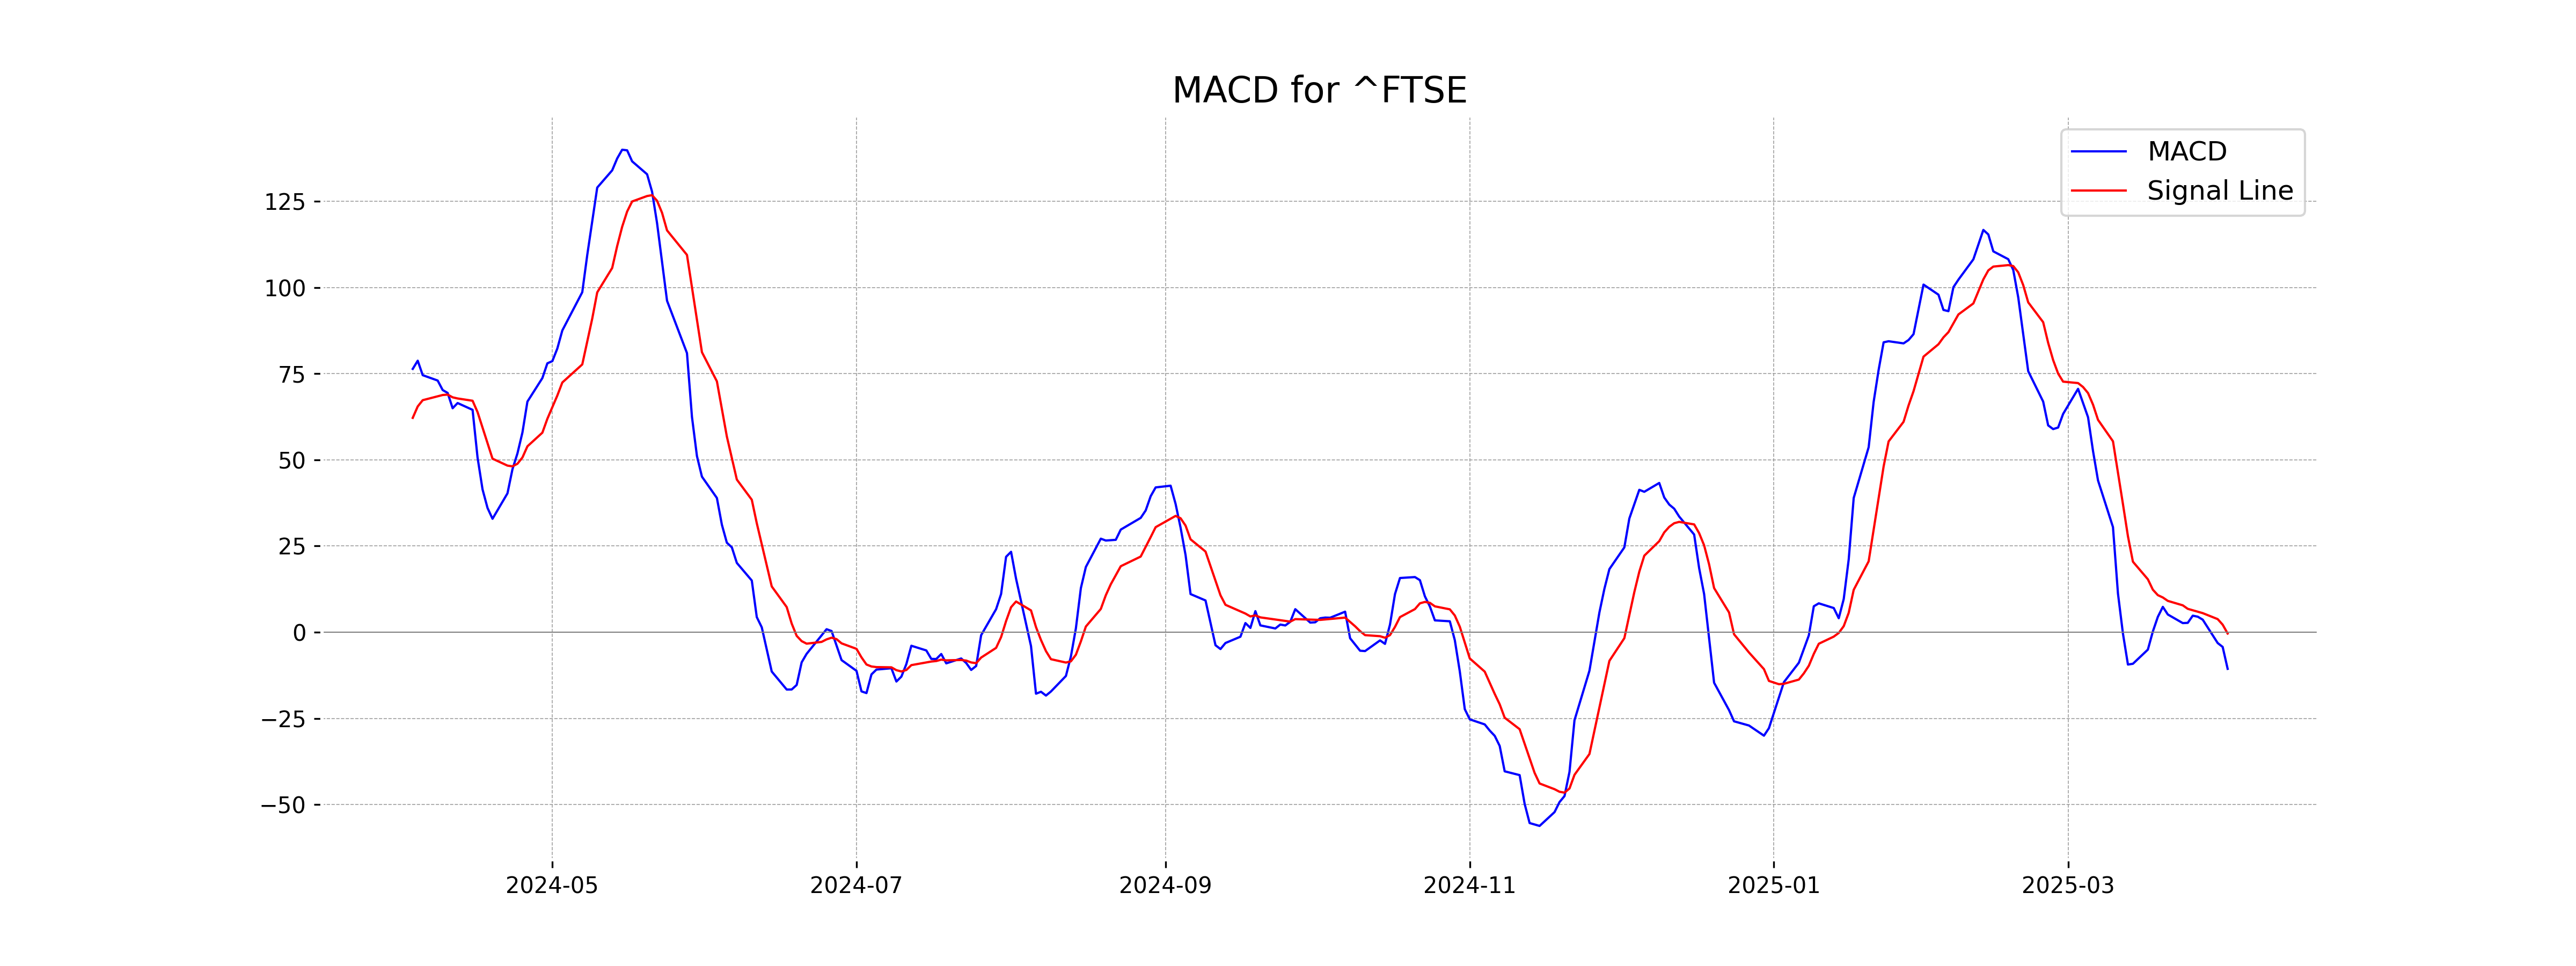
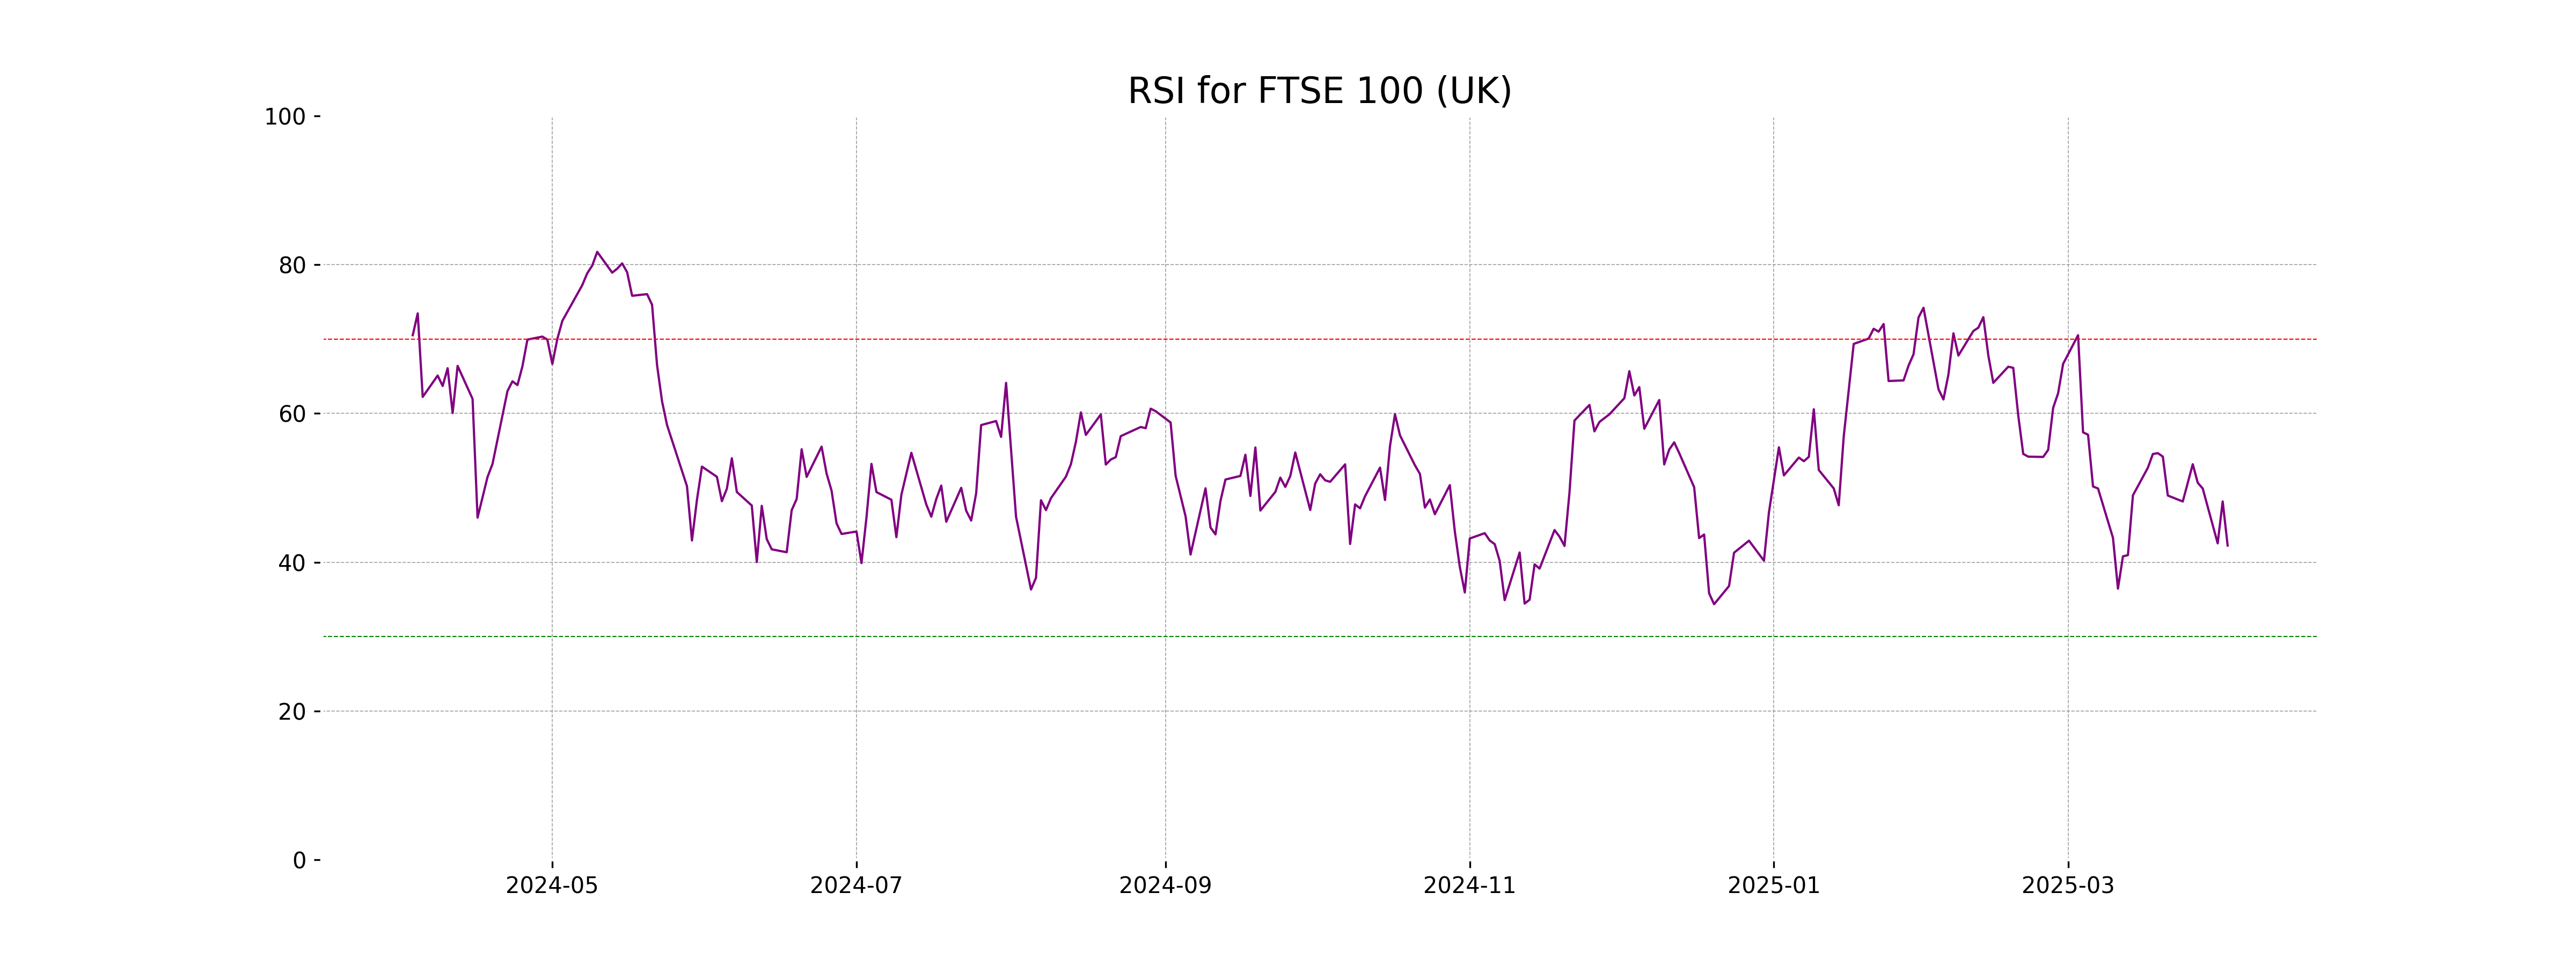
Analysis for FTSE 100 (UK) - April 02, 2025
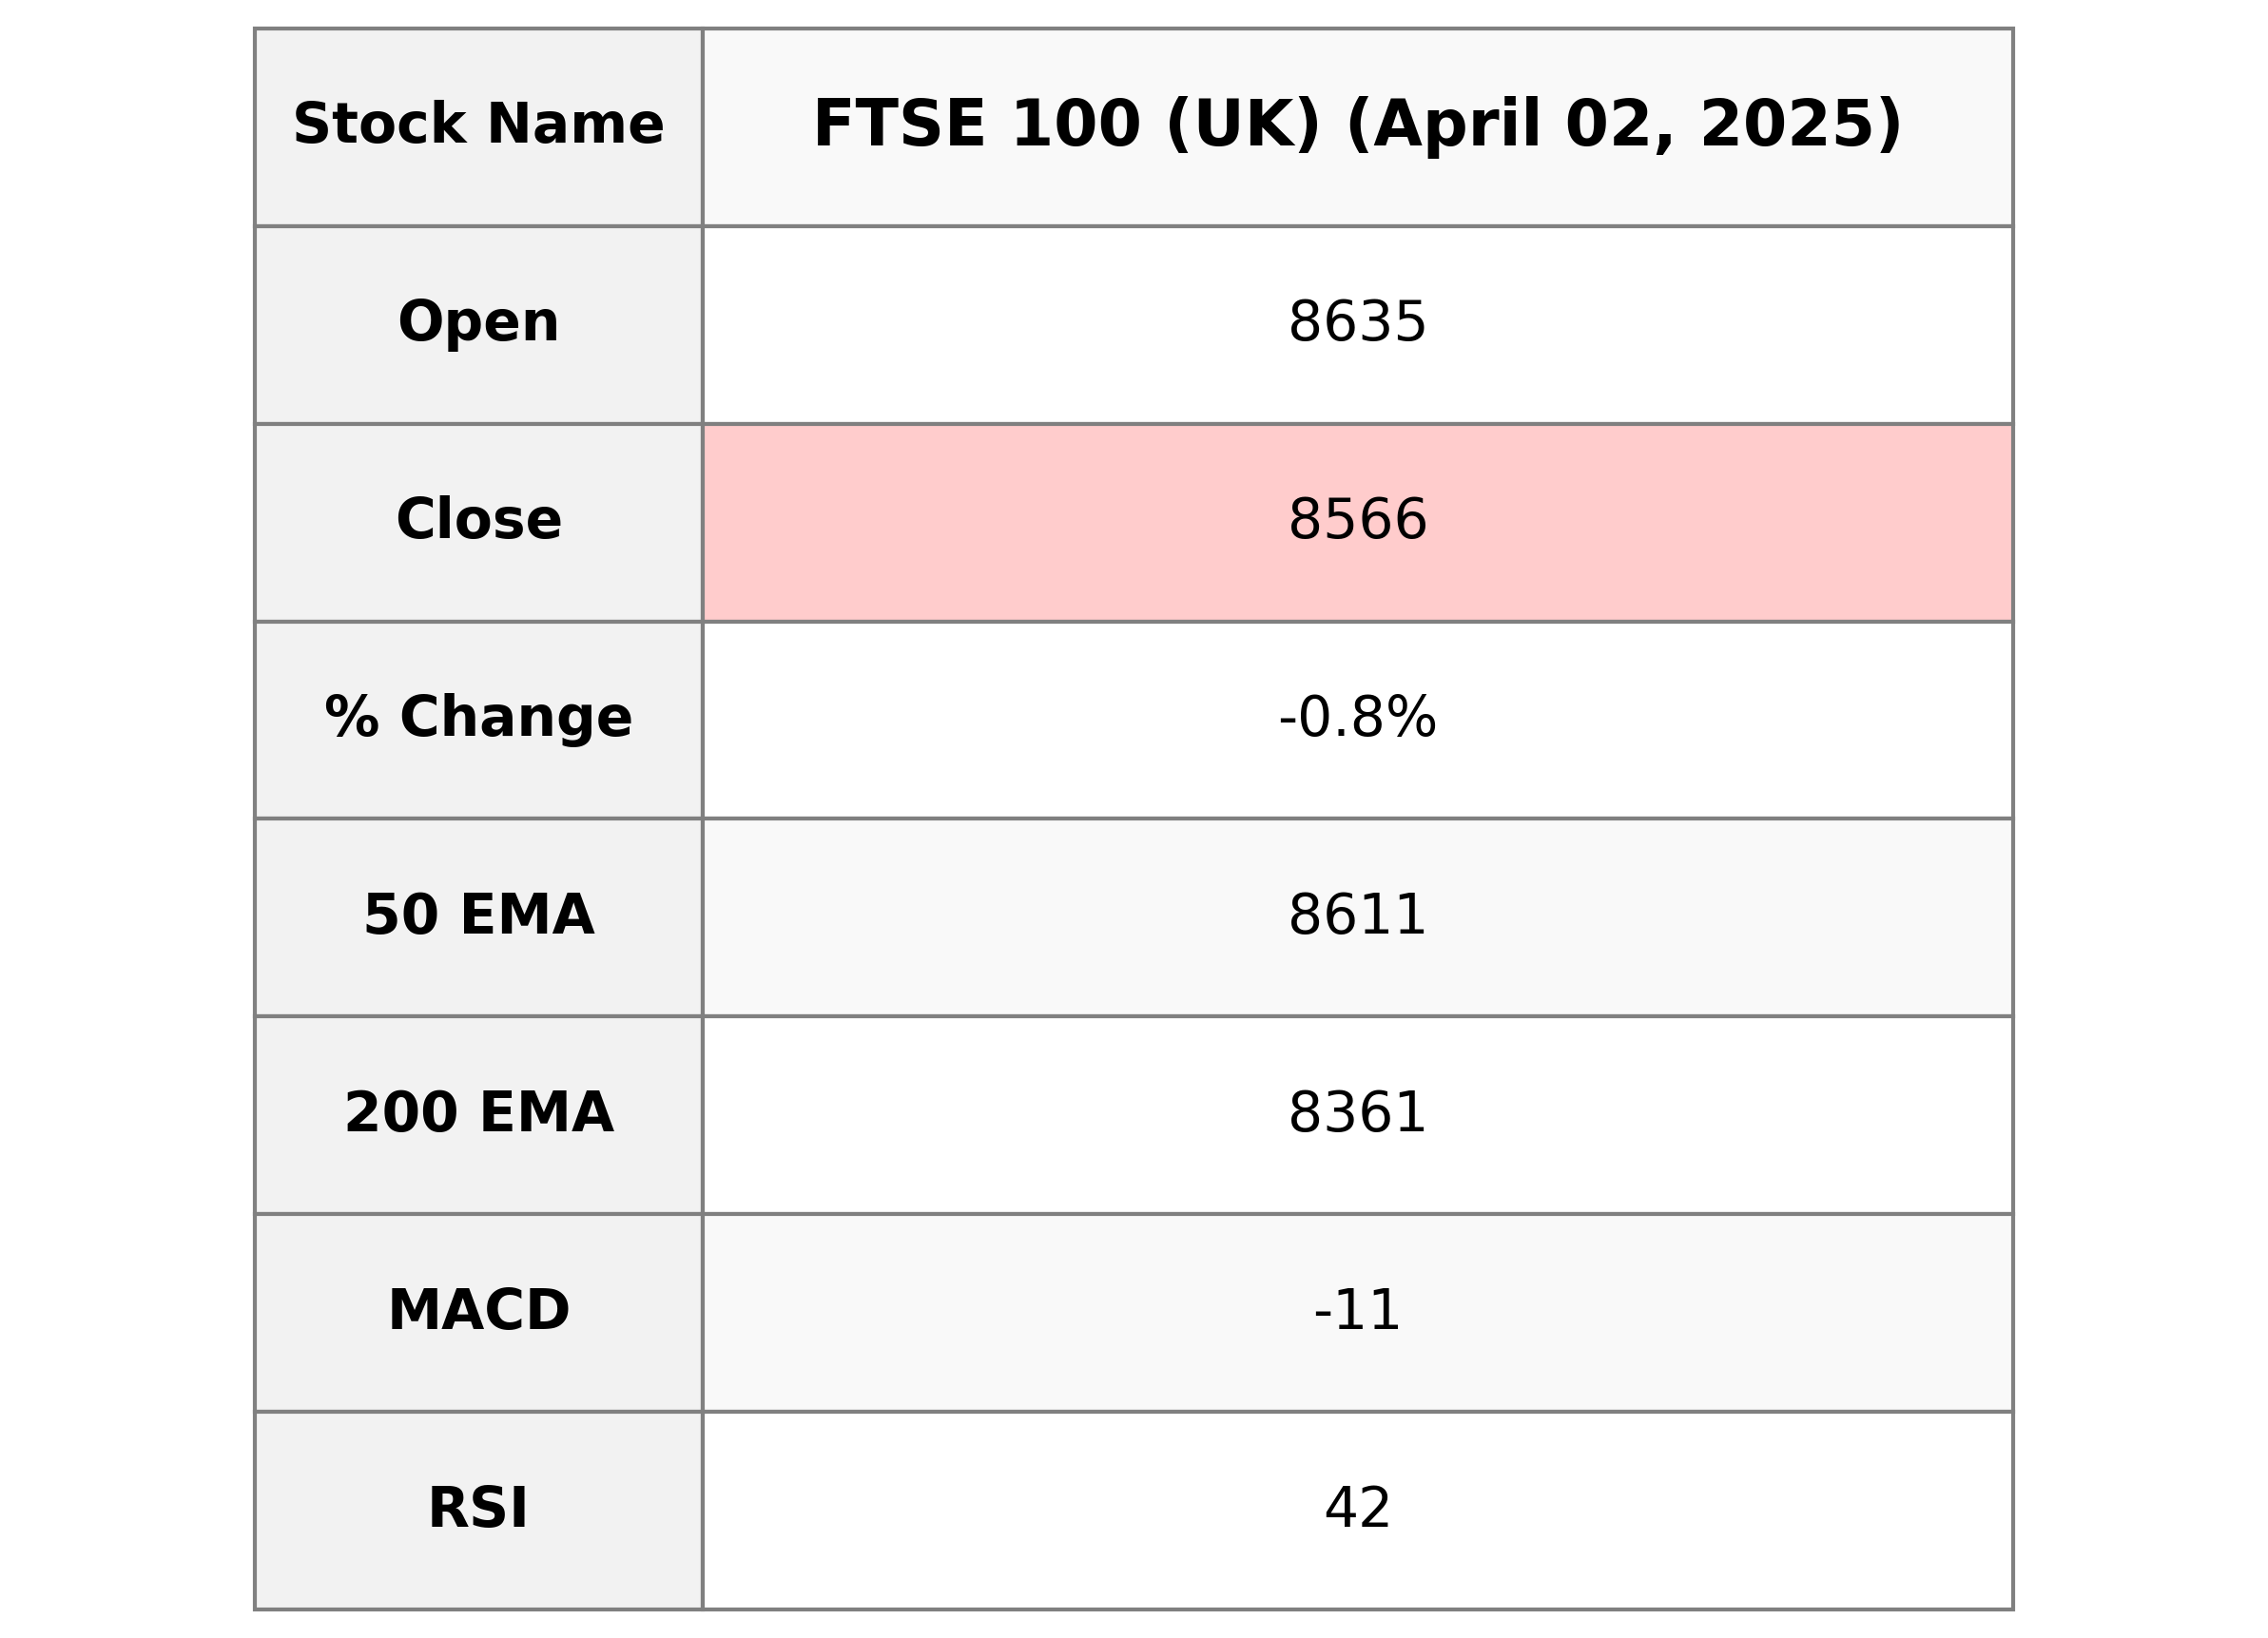
FTSE 100 (UK) opened at 8634.80, with a high of the same value and closed at 8565.62, indicating a daily decline of 69.18 points or -0.80%. The Relative Strength Index (RSI) is at 42.24, suggesting a generally bearish trend, and the MACD of -10.64 with the signal at -0.39 points to negative momentum in the market.
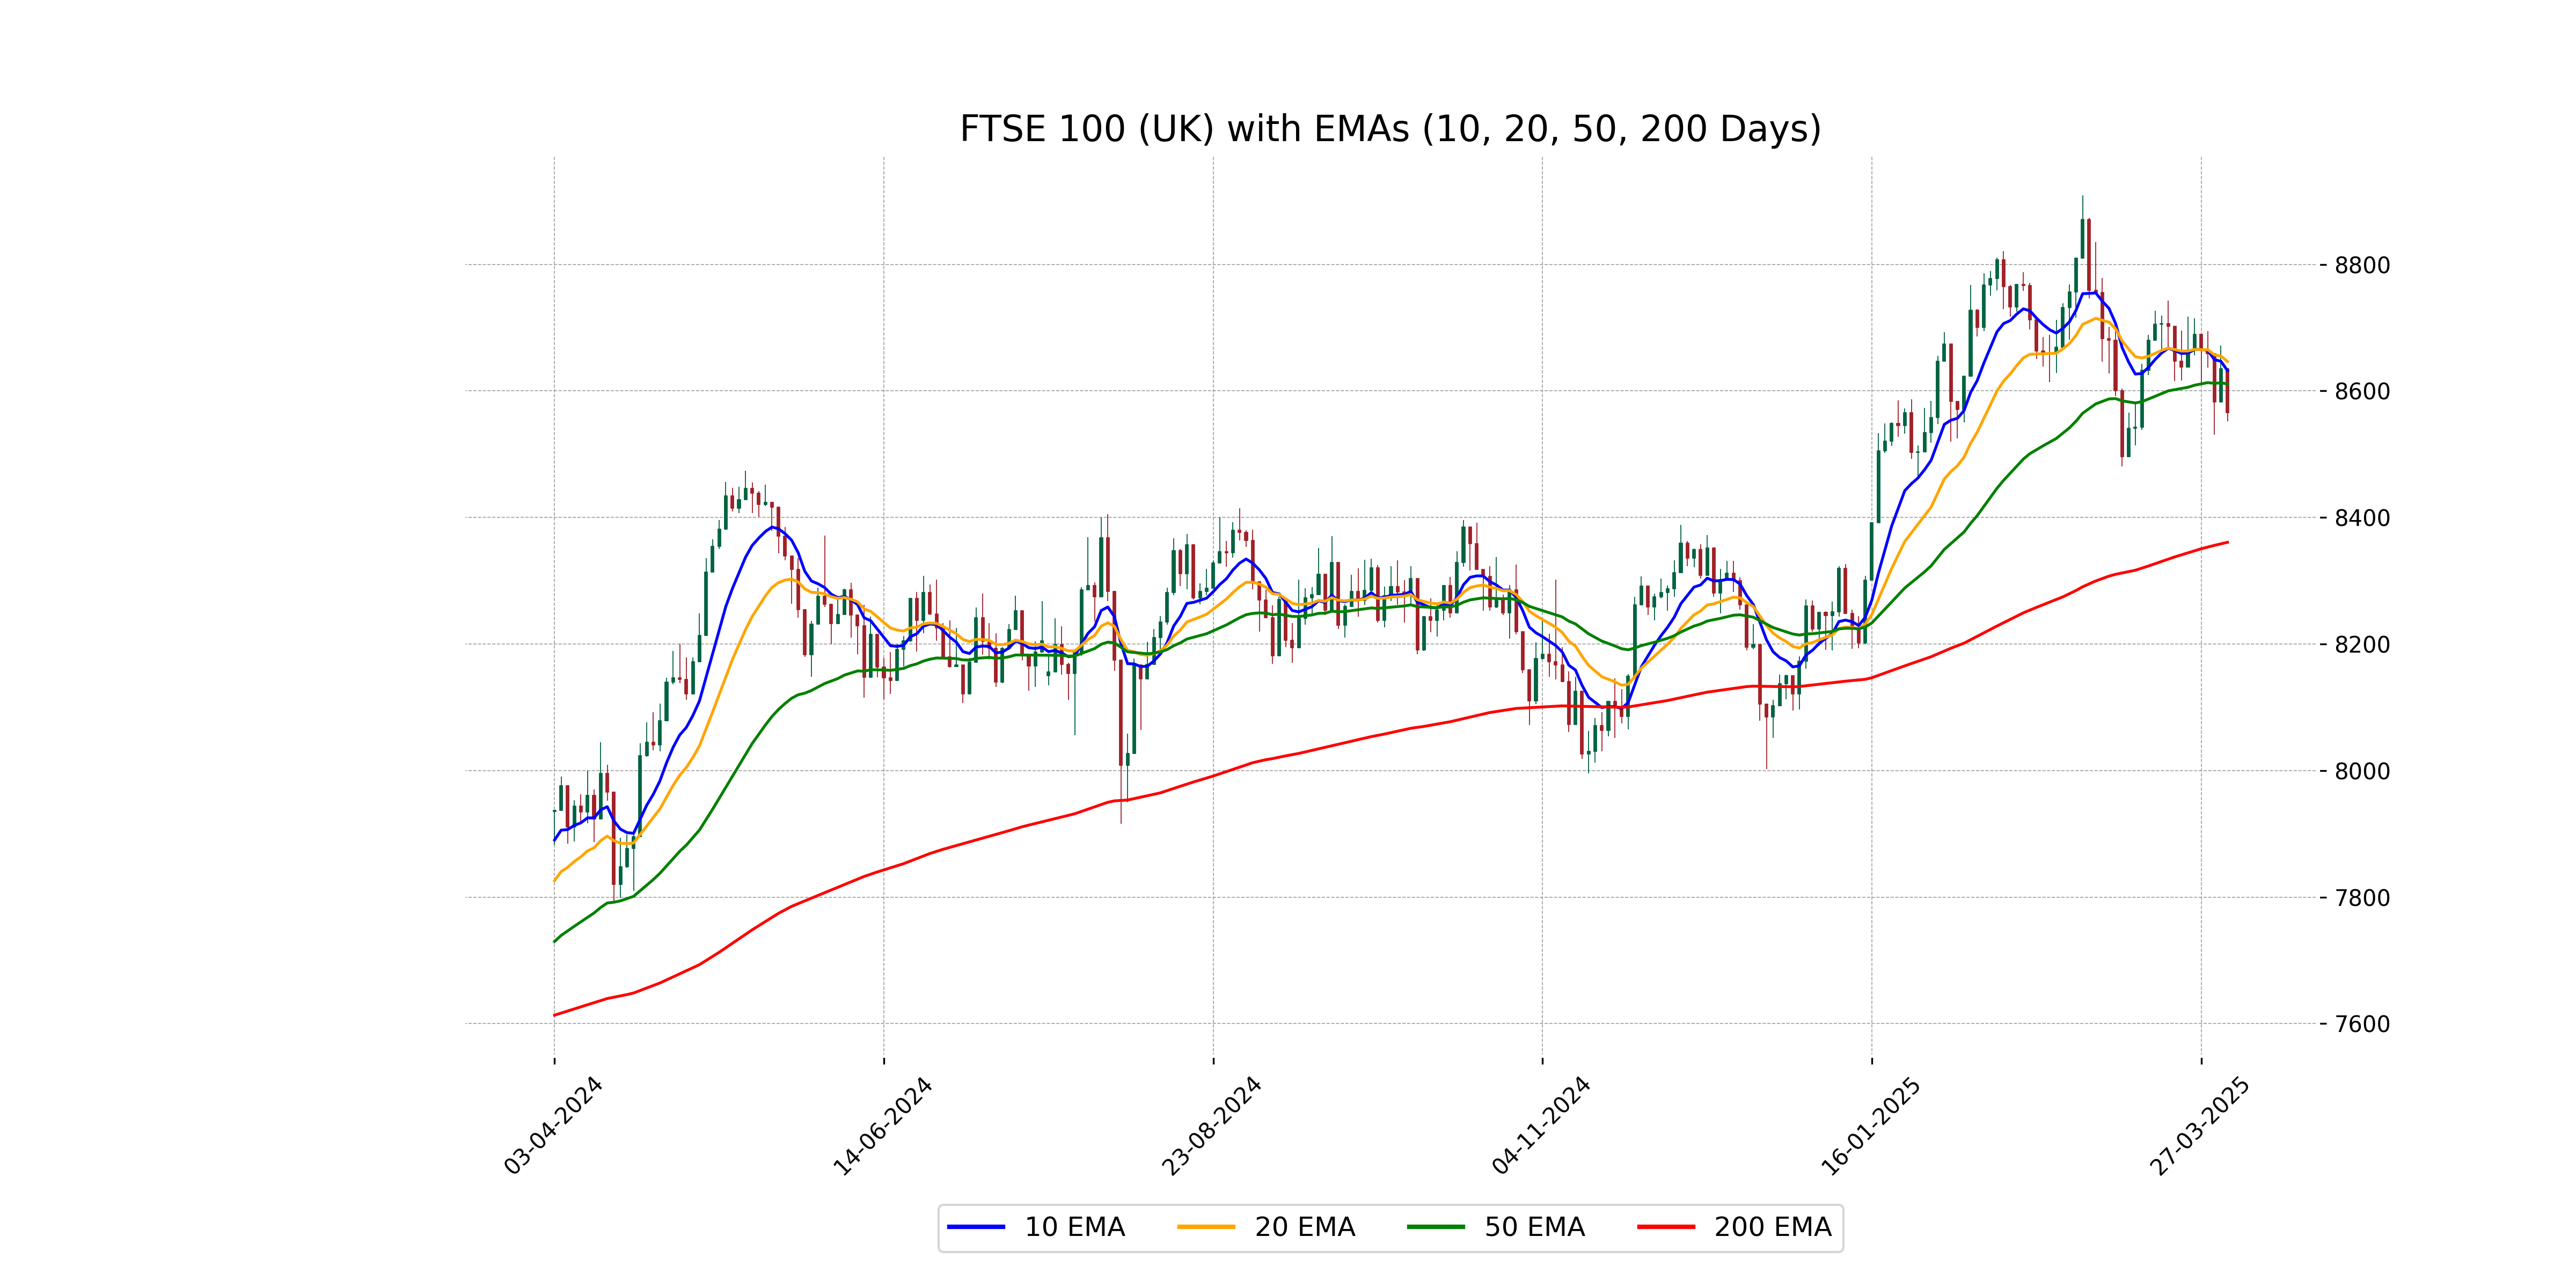
Relationship with Key Moving Averages
FTSE 100 is trading below its 10 EMA, 20 EMA, and 50 EMA, indicating a bearish trend in the short to medium term. The index's close of 8565.62 is below the 10 EMA of 8632.05, 20 EMA of 8646.55, and 50 EMA of 8610.99, supporting a potential downward momentum.
Moving Averages Trend (MACD)
MACD Analysis for FTSE 100 (UK): The MACD is negative at -10.64, which is below the signal line at -0.39. This indicates a bearish momentum for FTSE 100, suggesting a potential downward trend continuation.
RSI Analysis
The RSI value of 42.24 for FTSE 100 indicates that the index is approaching the lower neutral range. This suggests that the FTSE 100 is not currently overbought or oversold but may be trending towards a possible oversold condition if the RSI continues to decrease.
Analysis for DAX (Germany) - April 02, 2025
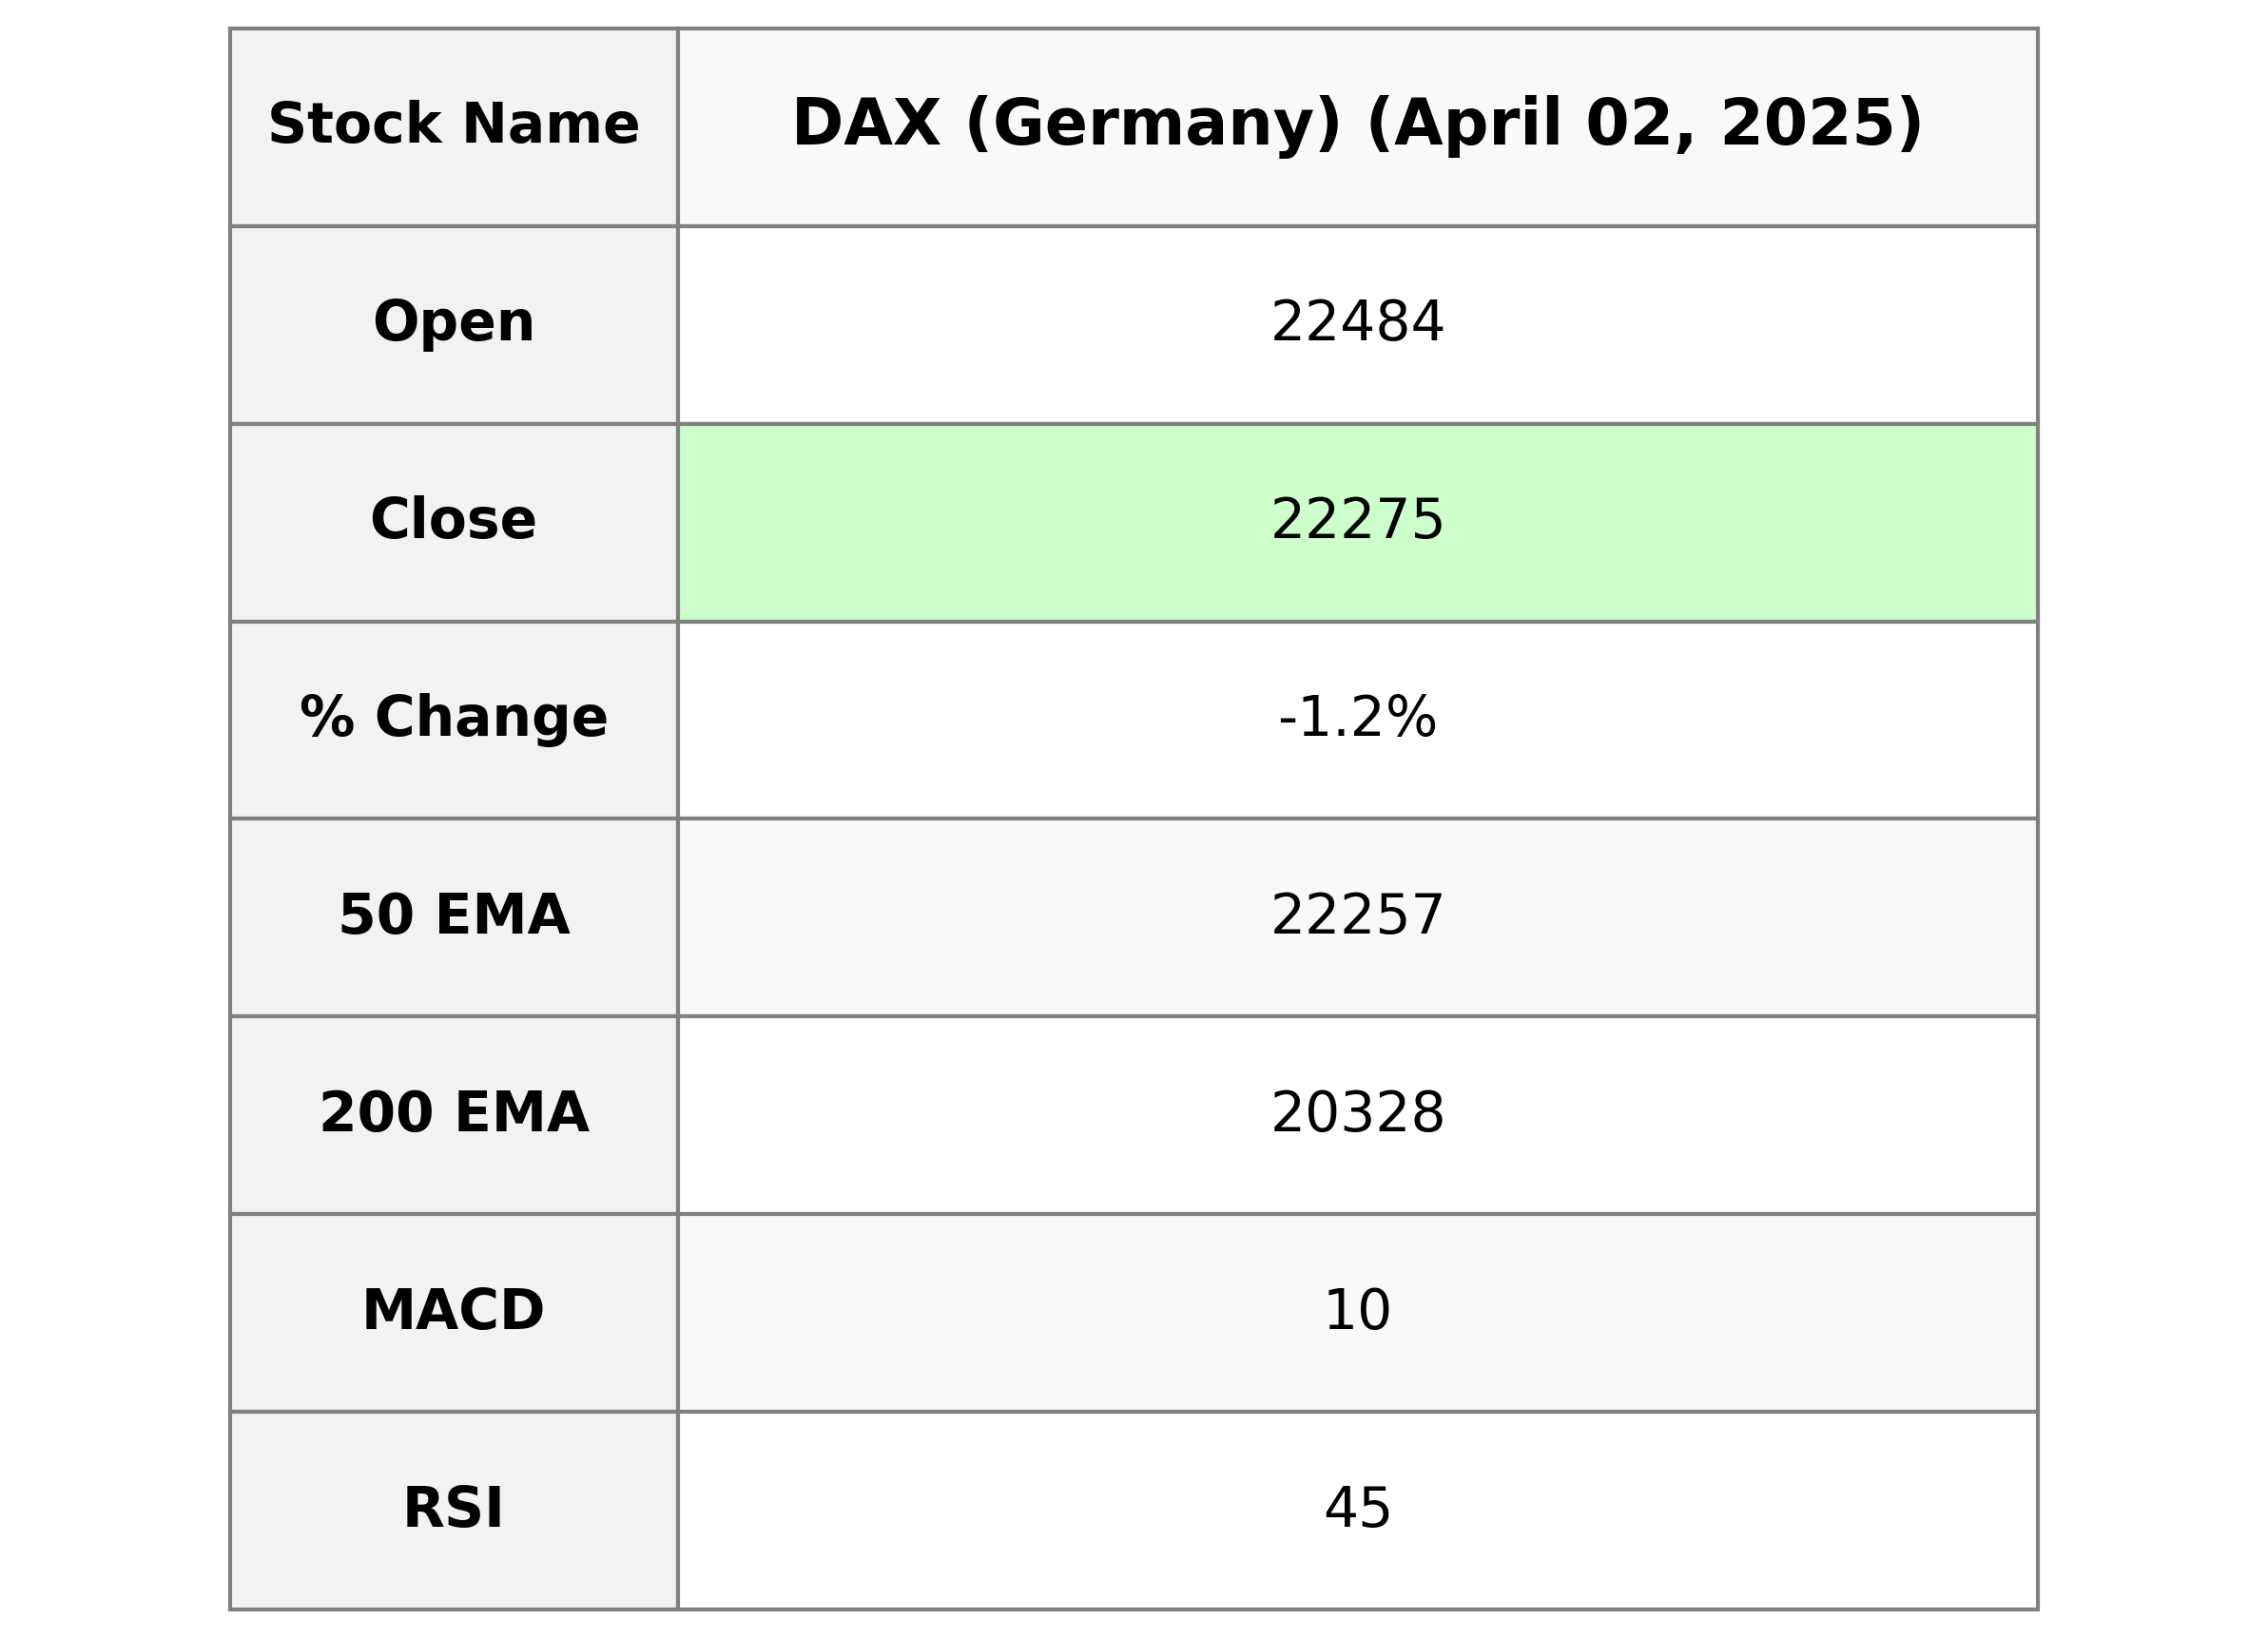
The DAX (Germany) index opened at 22,483.93 and closed at 22,274.91, marking a decline with a closing position lower than both its 50-day and 10-day EMAs. The daily performance showed a percentage change of -1.18%, with a points decrease of -265.07. The RSI at 44.83 indicates a mild downward momentum, whereas the MACD at 9.61 suggests weaker bullish momentum compared to the signal line.
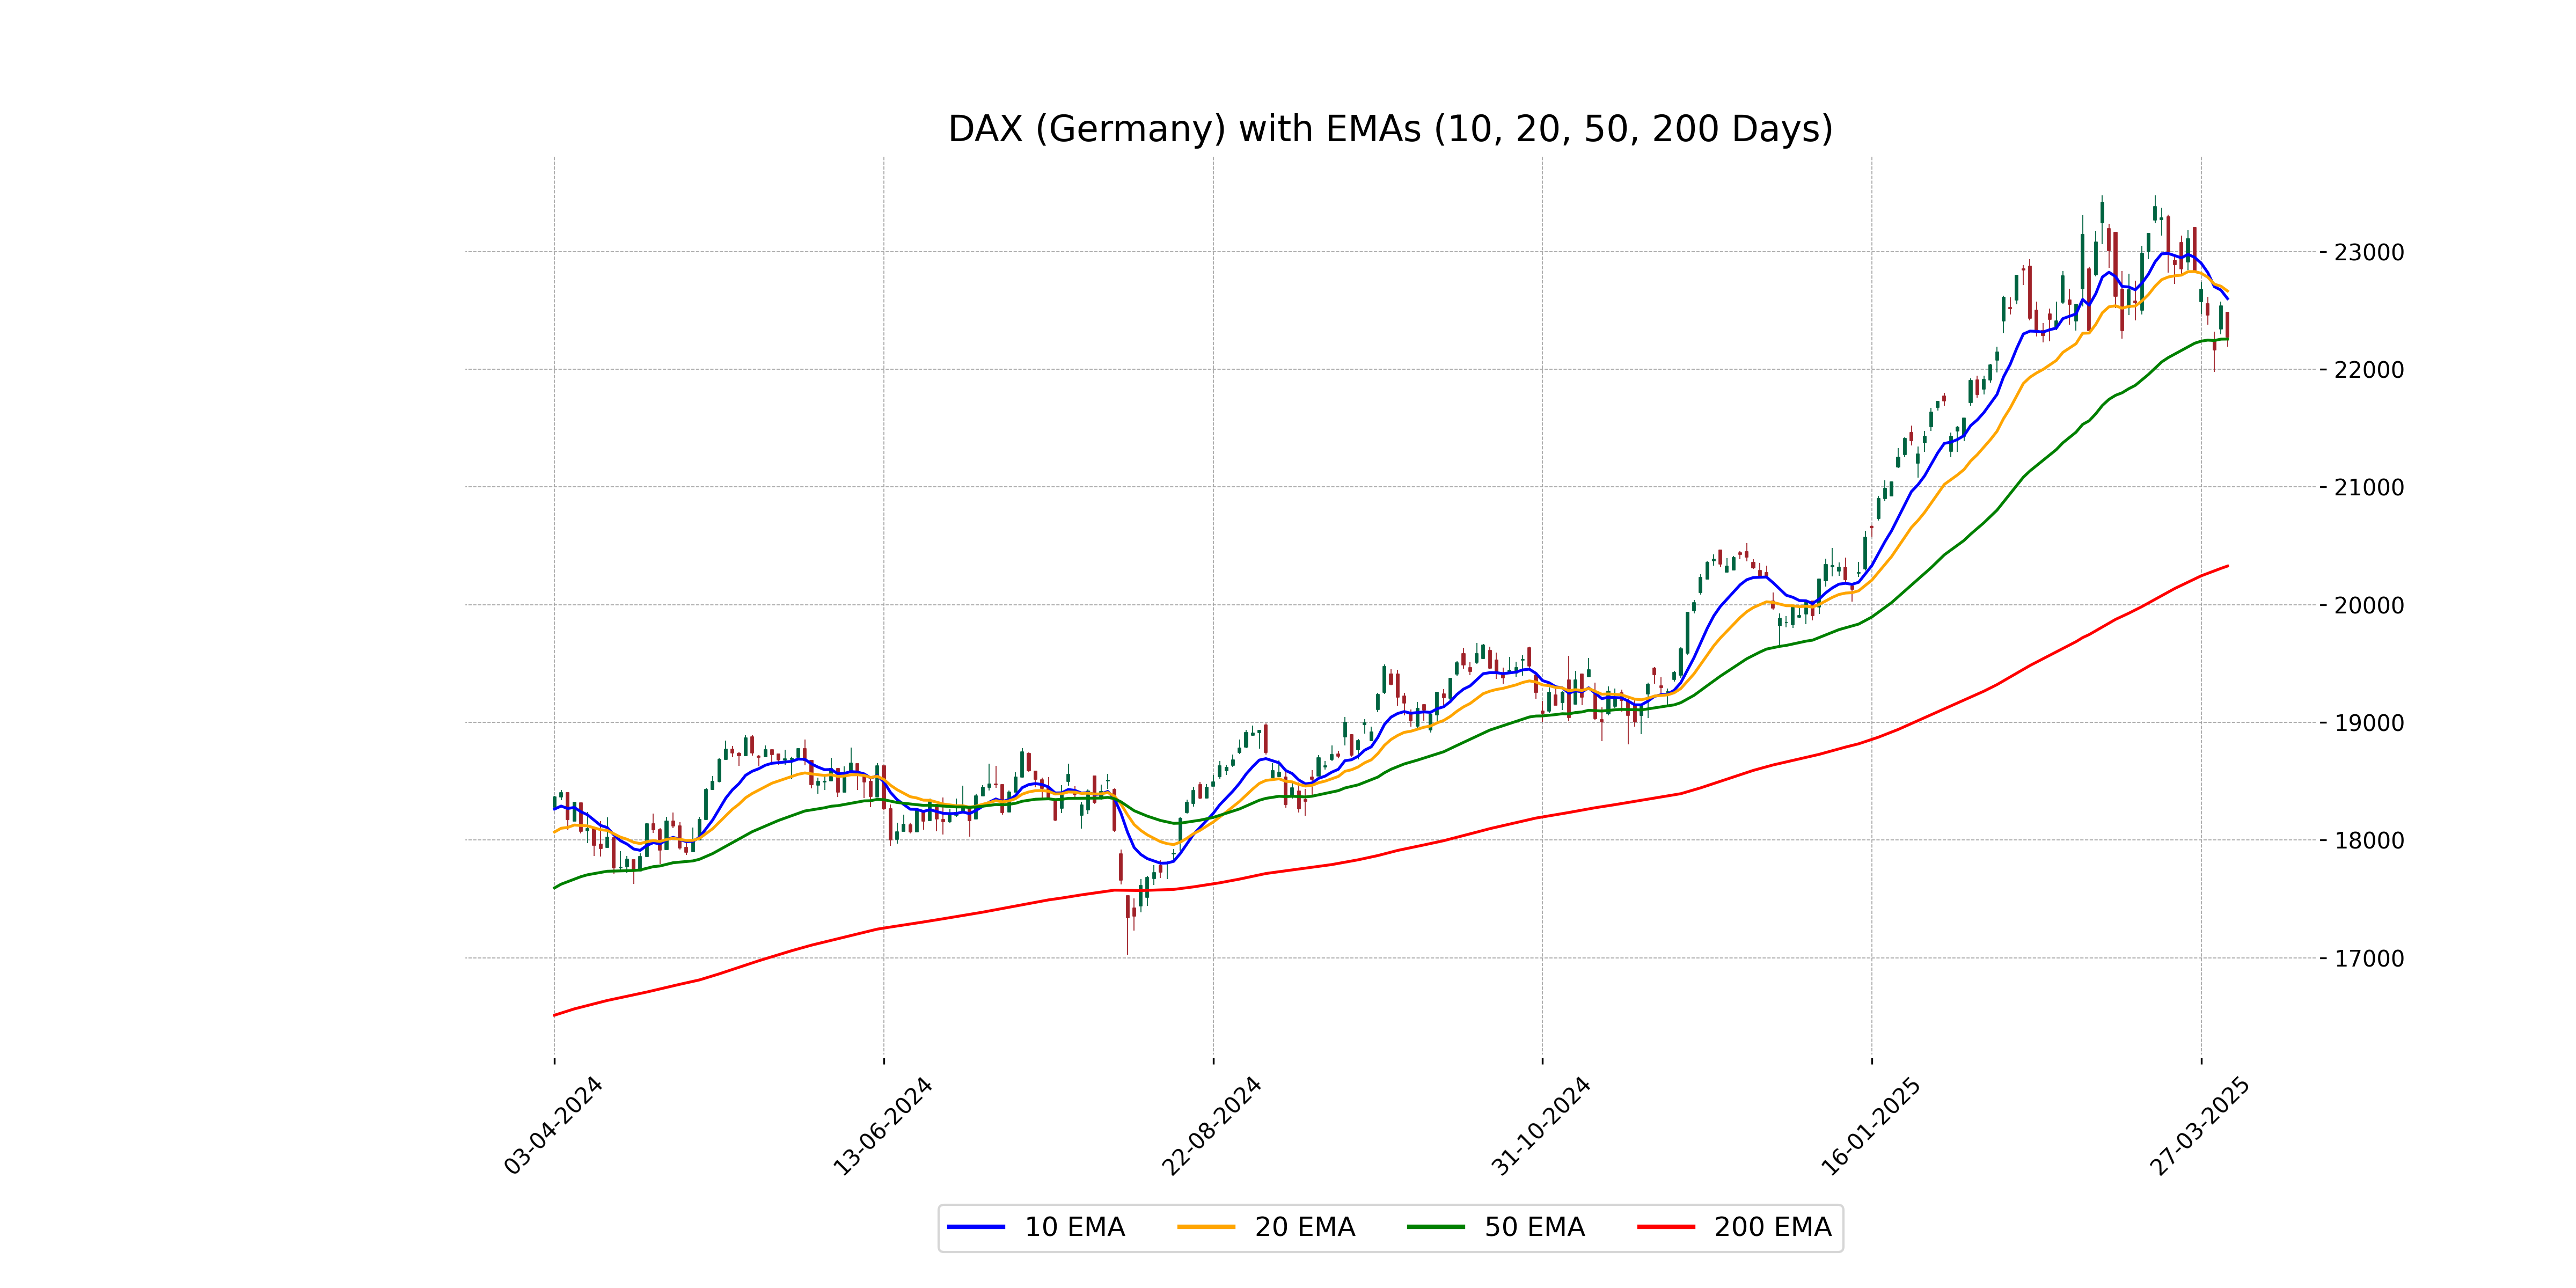
Relationship with Key Moving Averages
The DAX closed at 22,274.91, which is above its 50 EMA of 22,256.70 but below its 10 EMA of 22,600.26 and 20 EMA of 22,664.70. The index is currently trading under short-term EMAs, indicating potential bearish sentiment, while staying slightly above the intermediate 50 EMA.
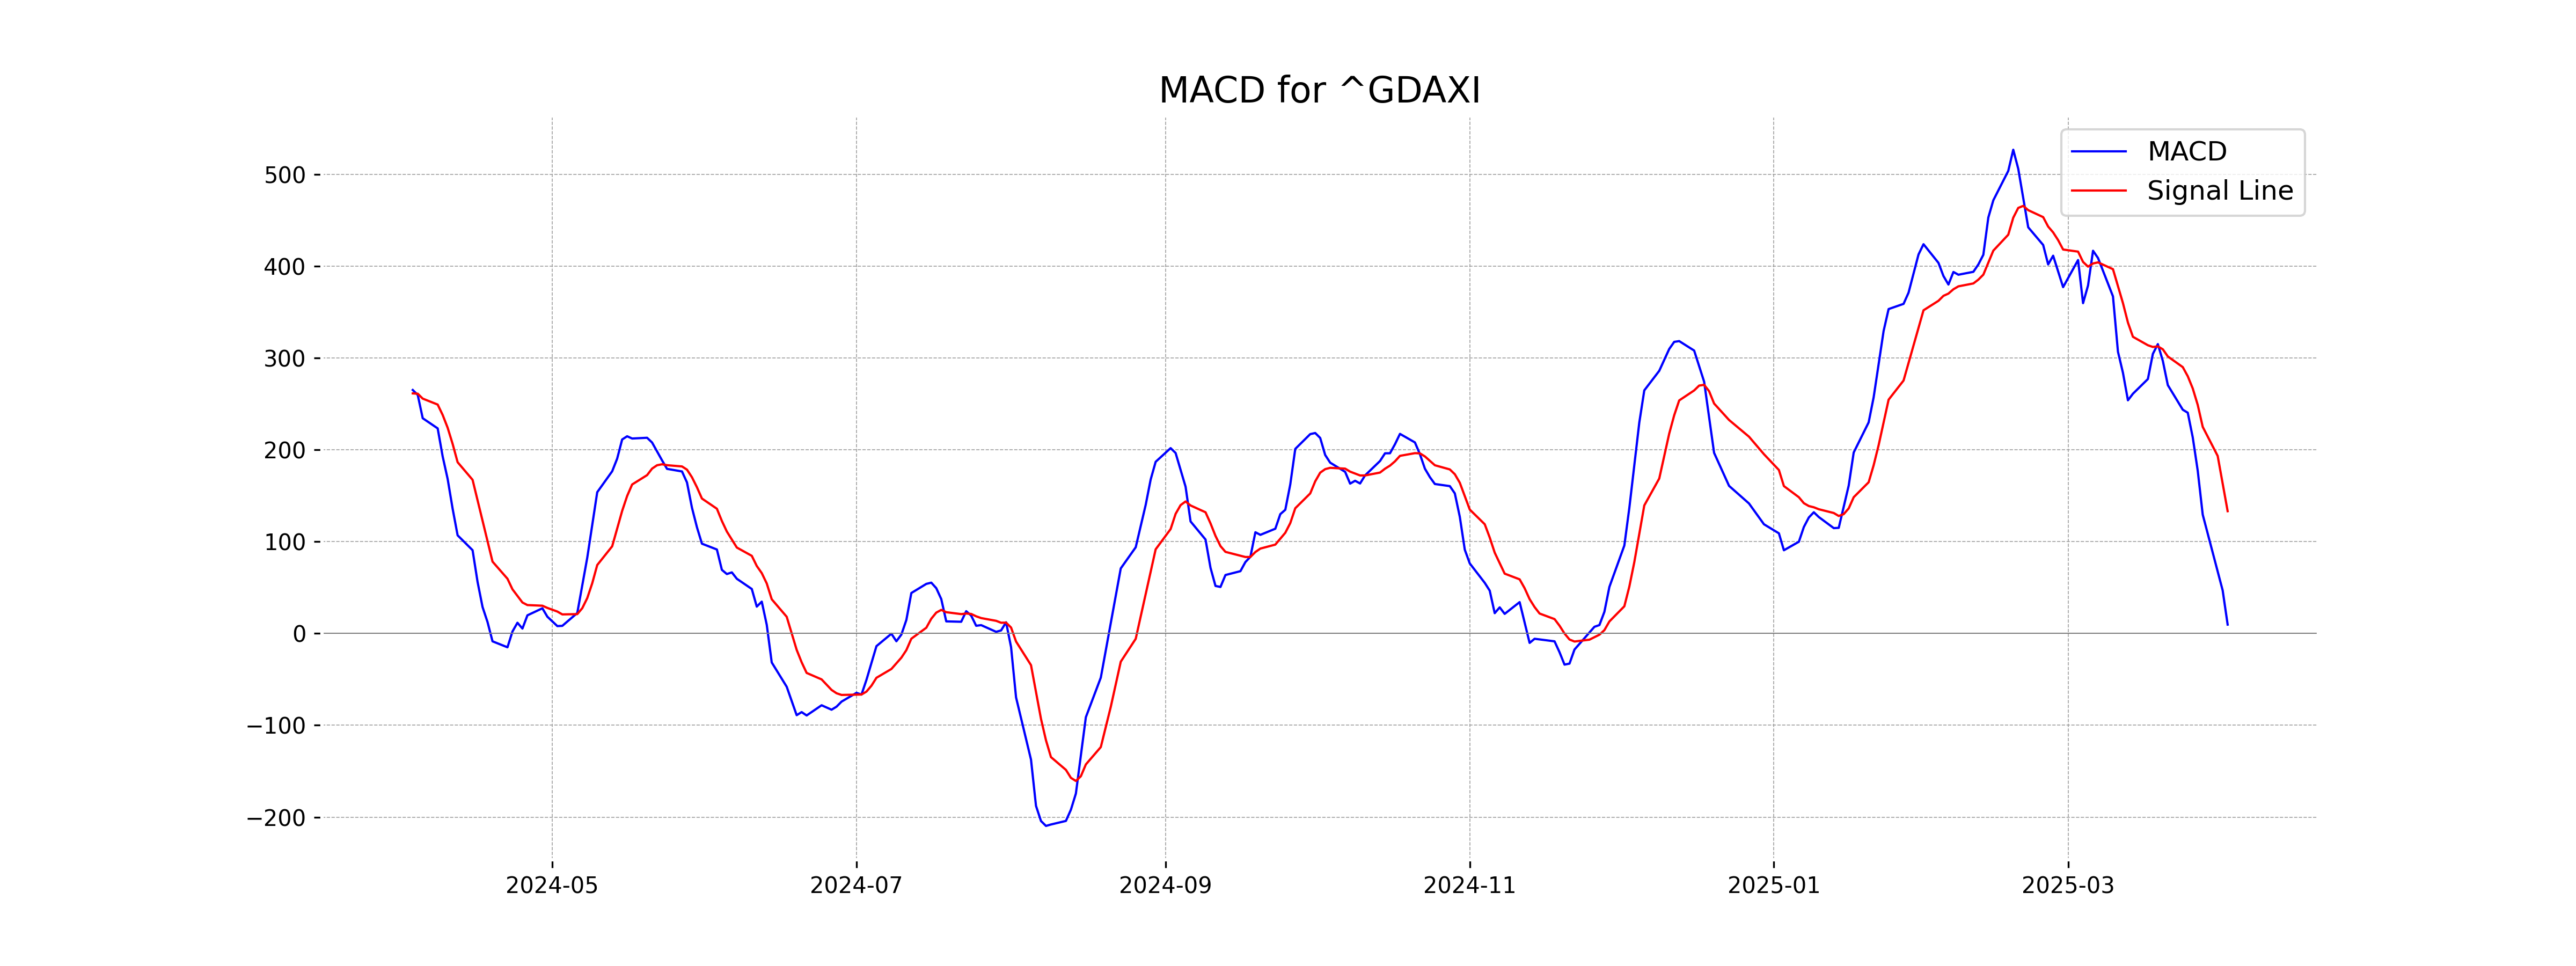
Moving Averages Trend (MACD)
MACD (Moving Average Convergence Divergence) Analysis for DAX (Germany): The MACD value is 9.61, which is below the MACD Signal value of 133.10. This suggests a bearish trend, indicating potential downward momentum for the index.
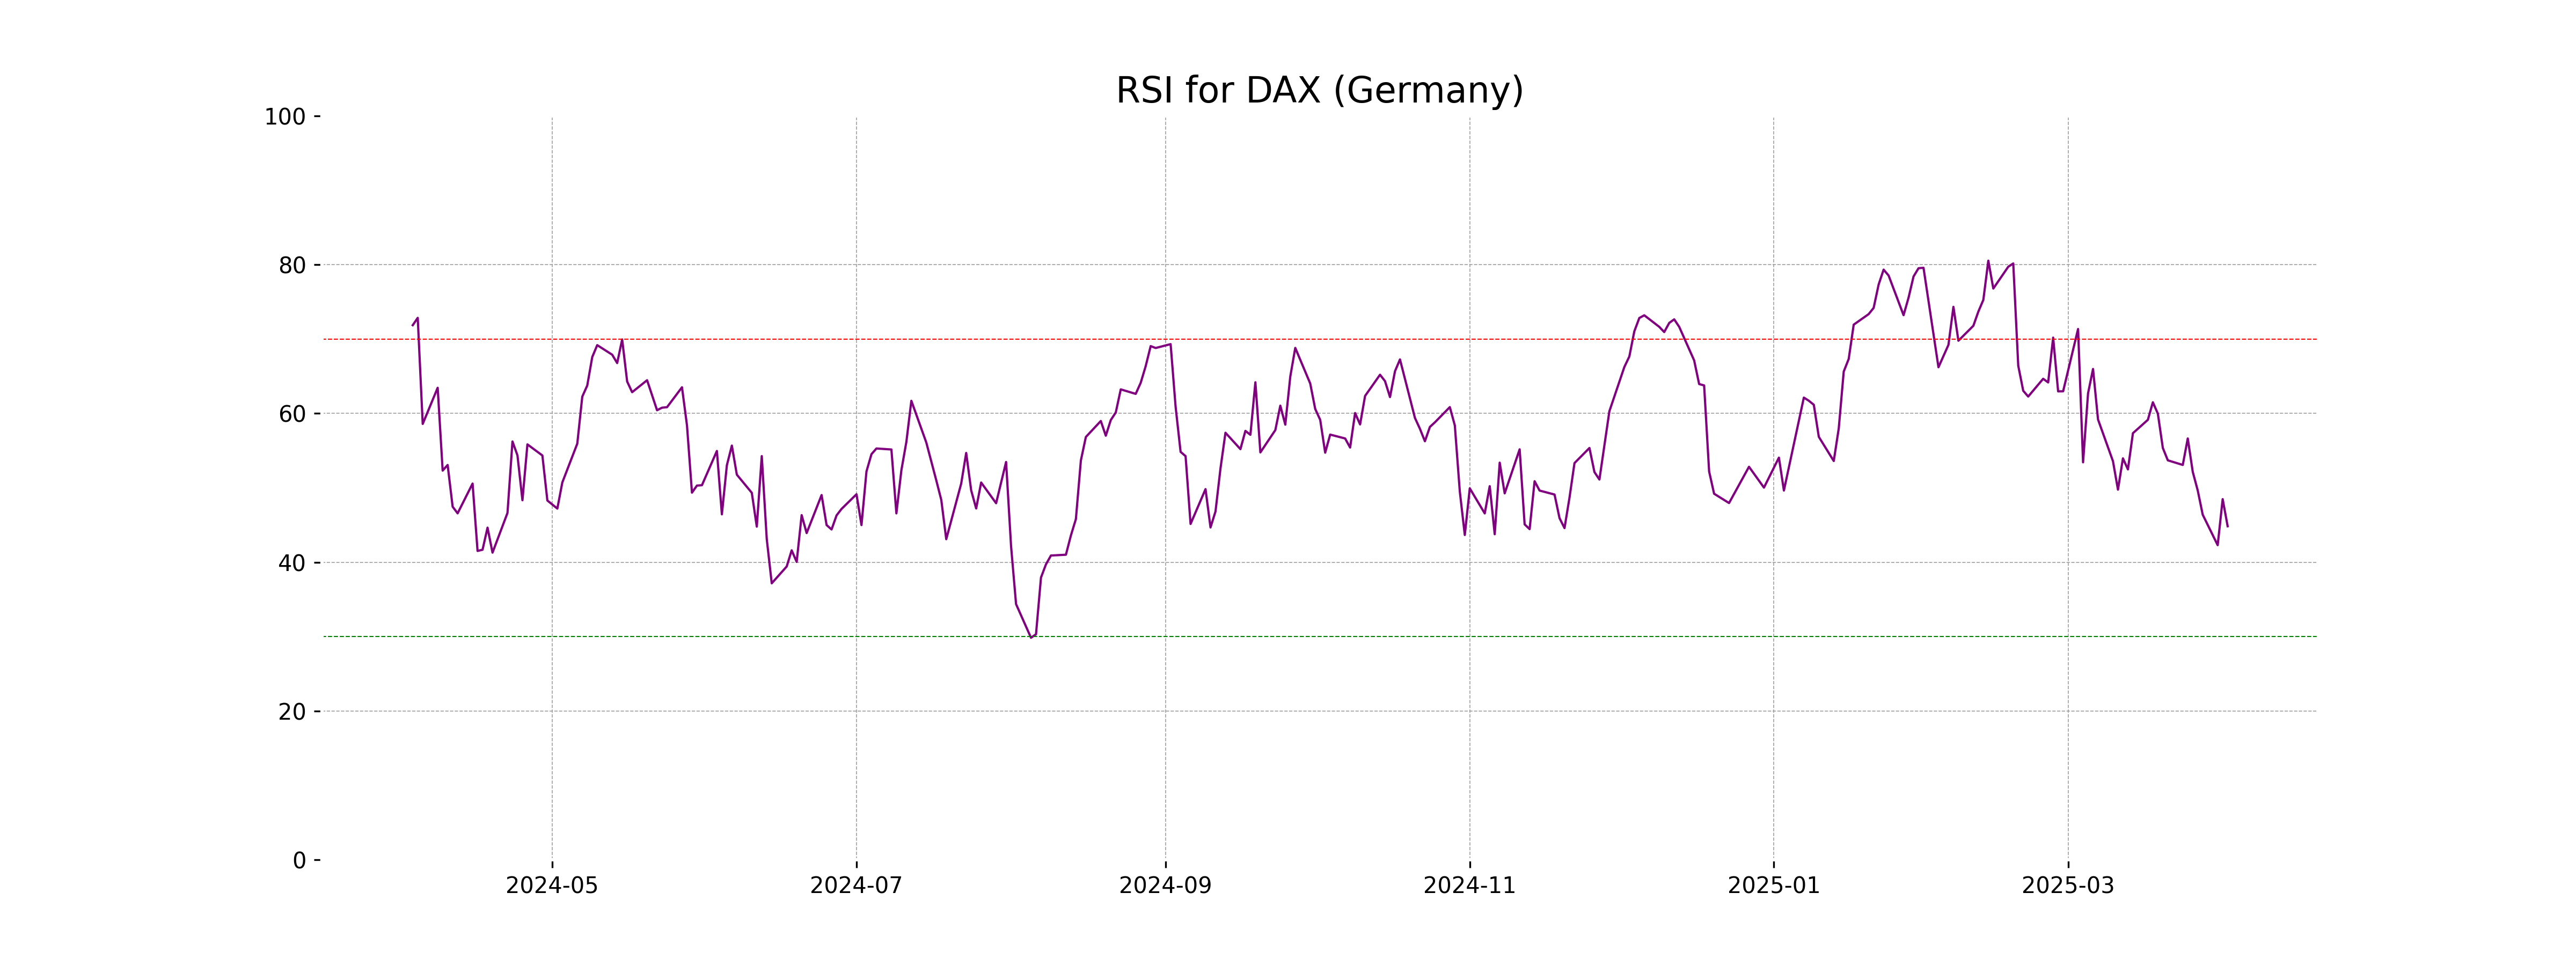
RSI Analysis
The DAX (Germany) has an RSI of 44.83, placing it in the neutral range, which suggests that the index is neither overbought nor oversold. This indicates a balanced trading condition, with no extreme market sentiment in either direction.
Analysis for S&P 500 (US) - April 02, 2025
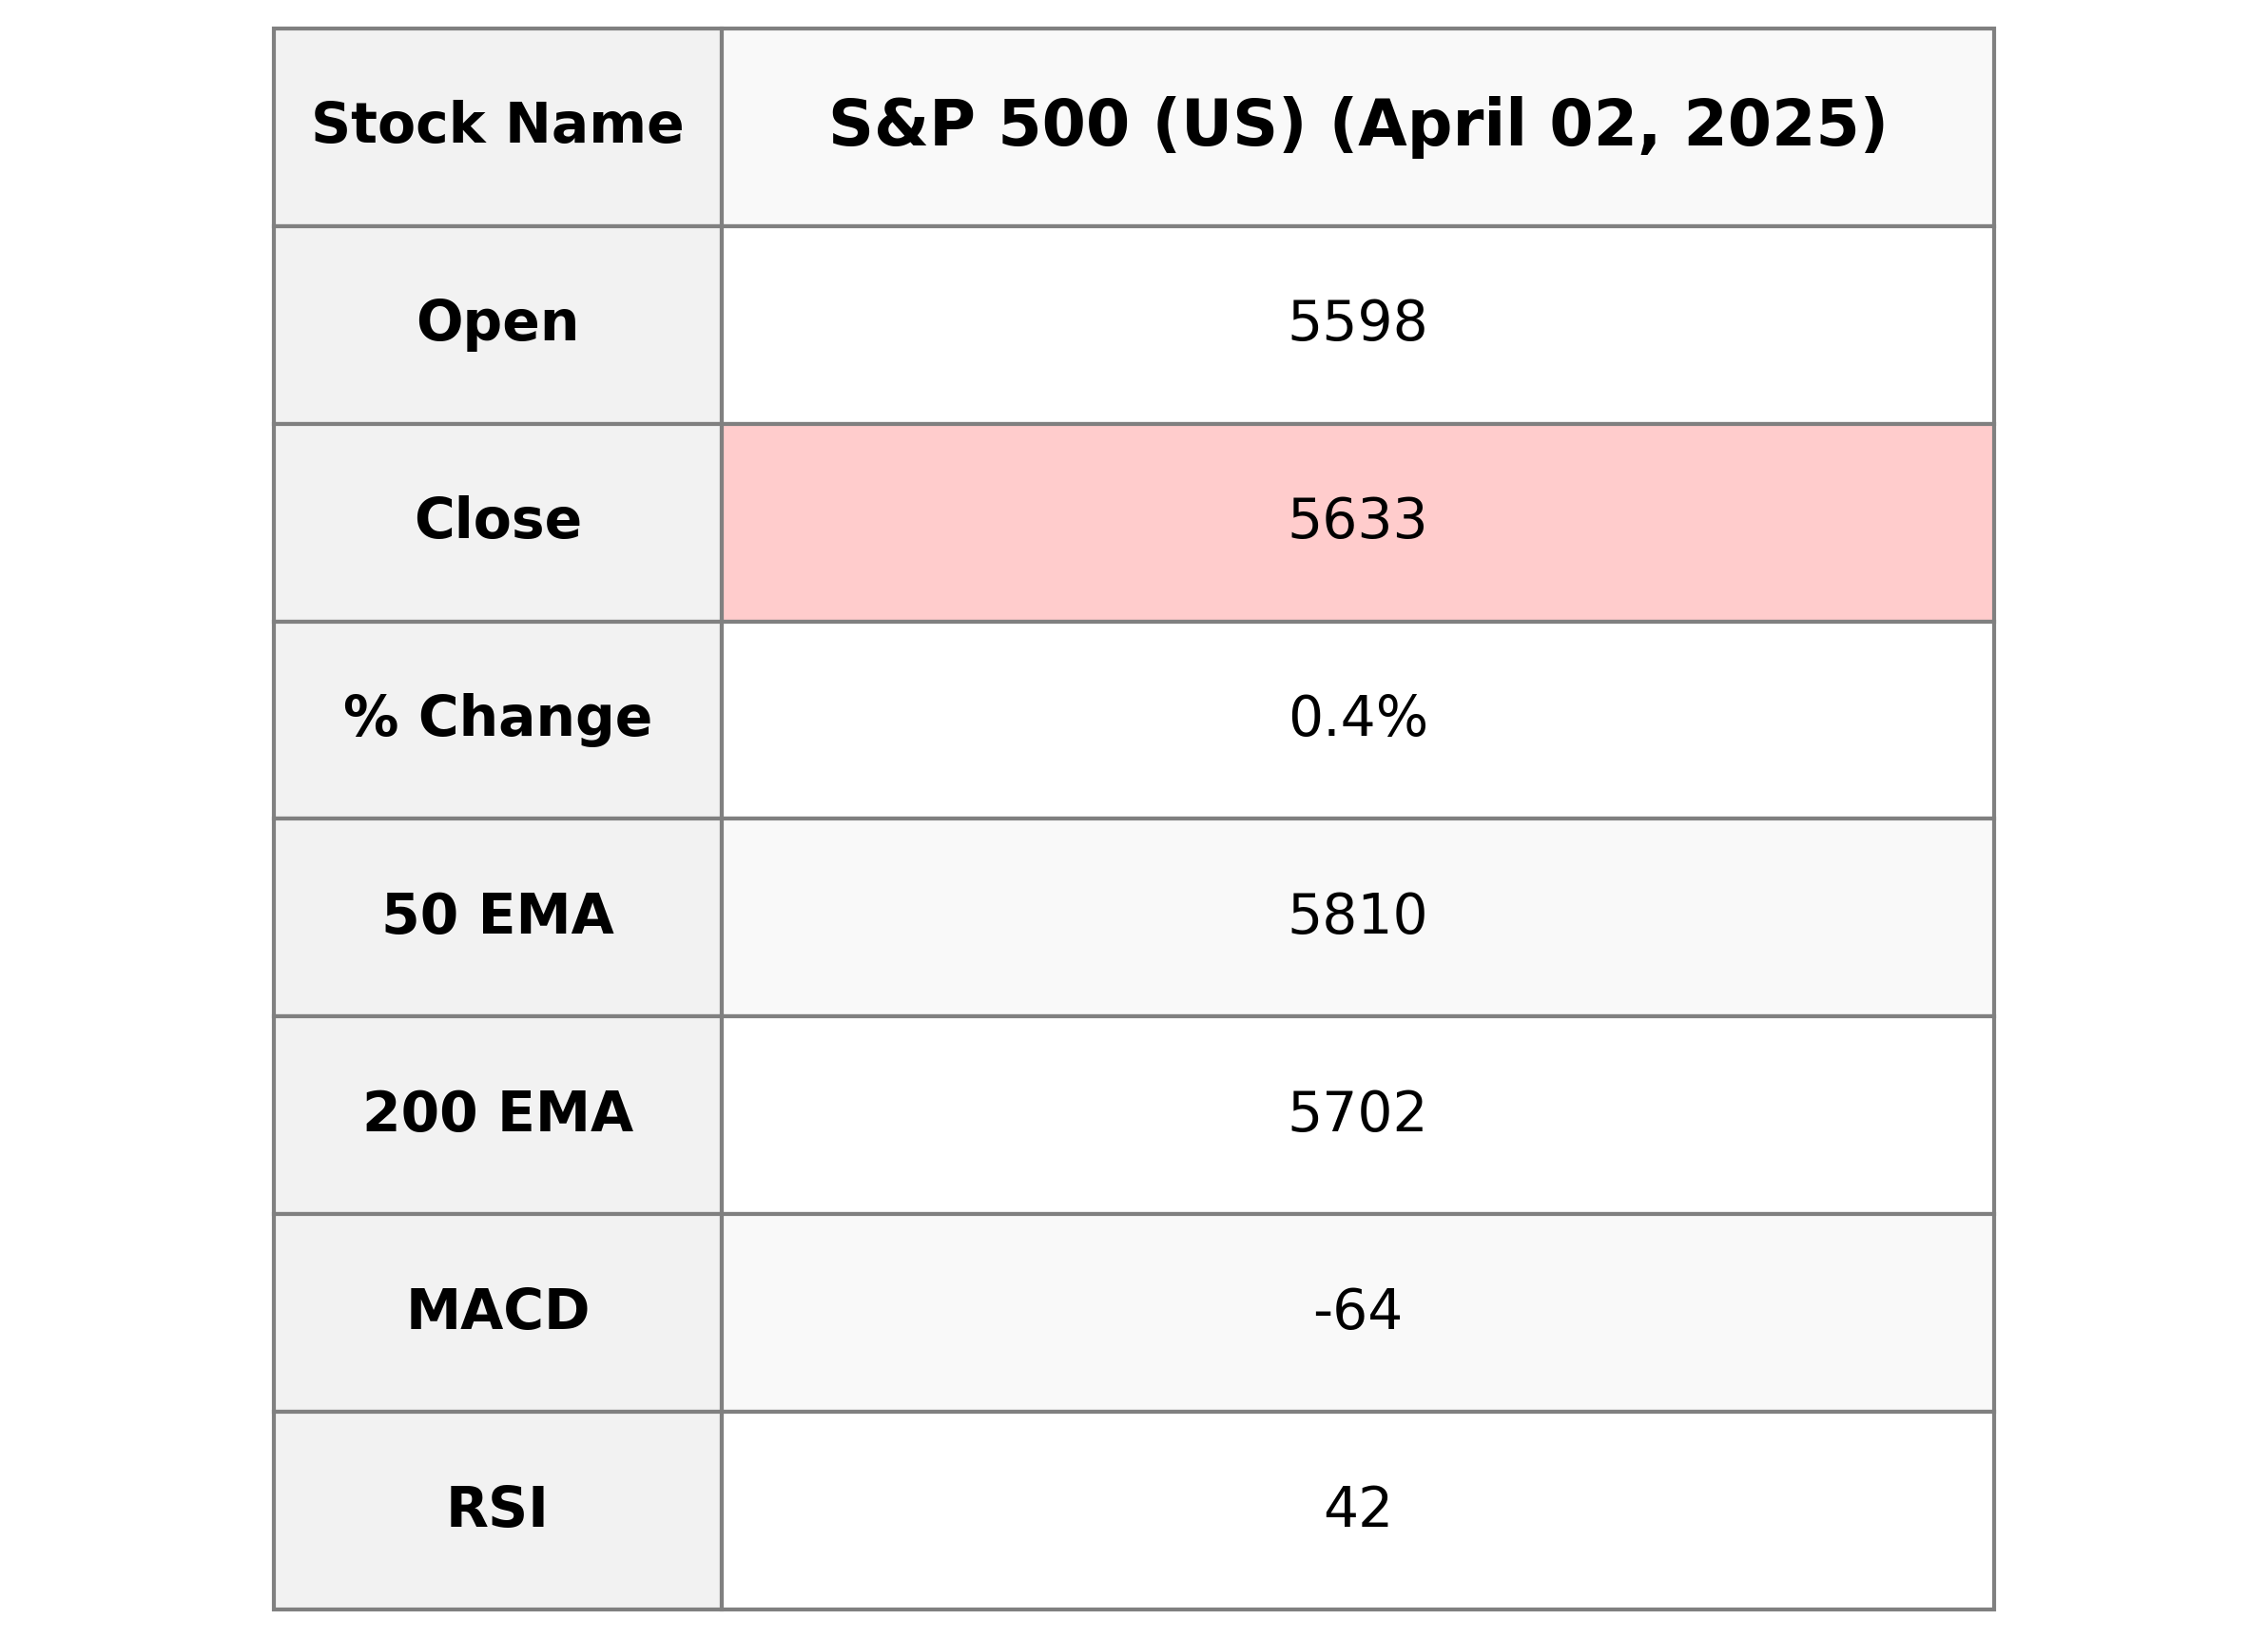
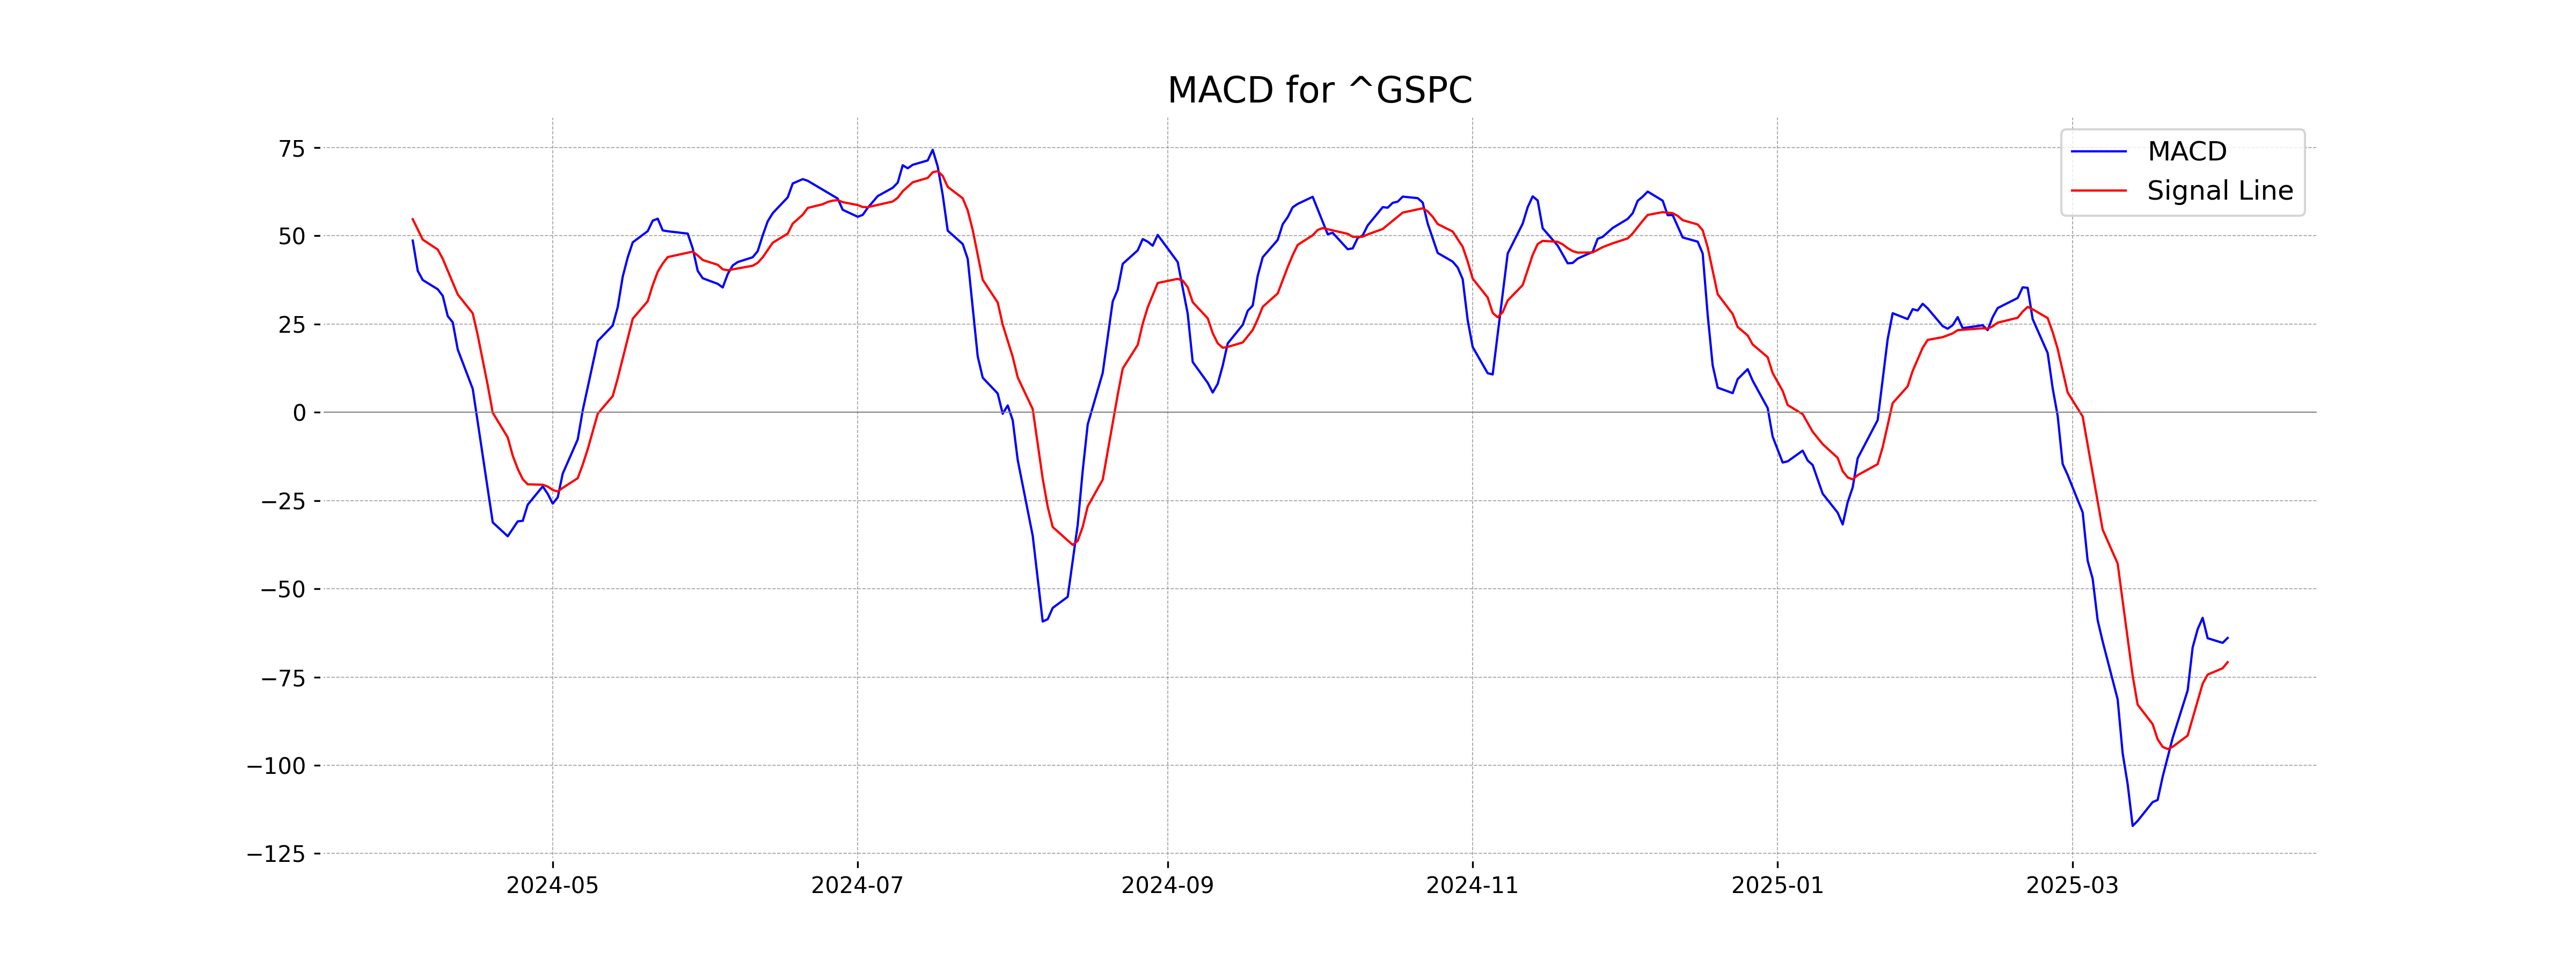
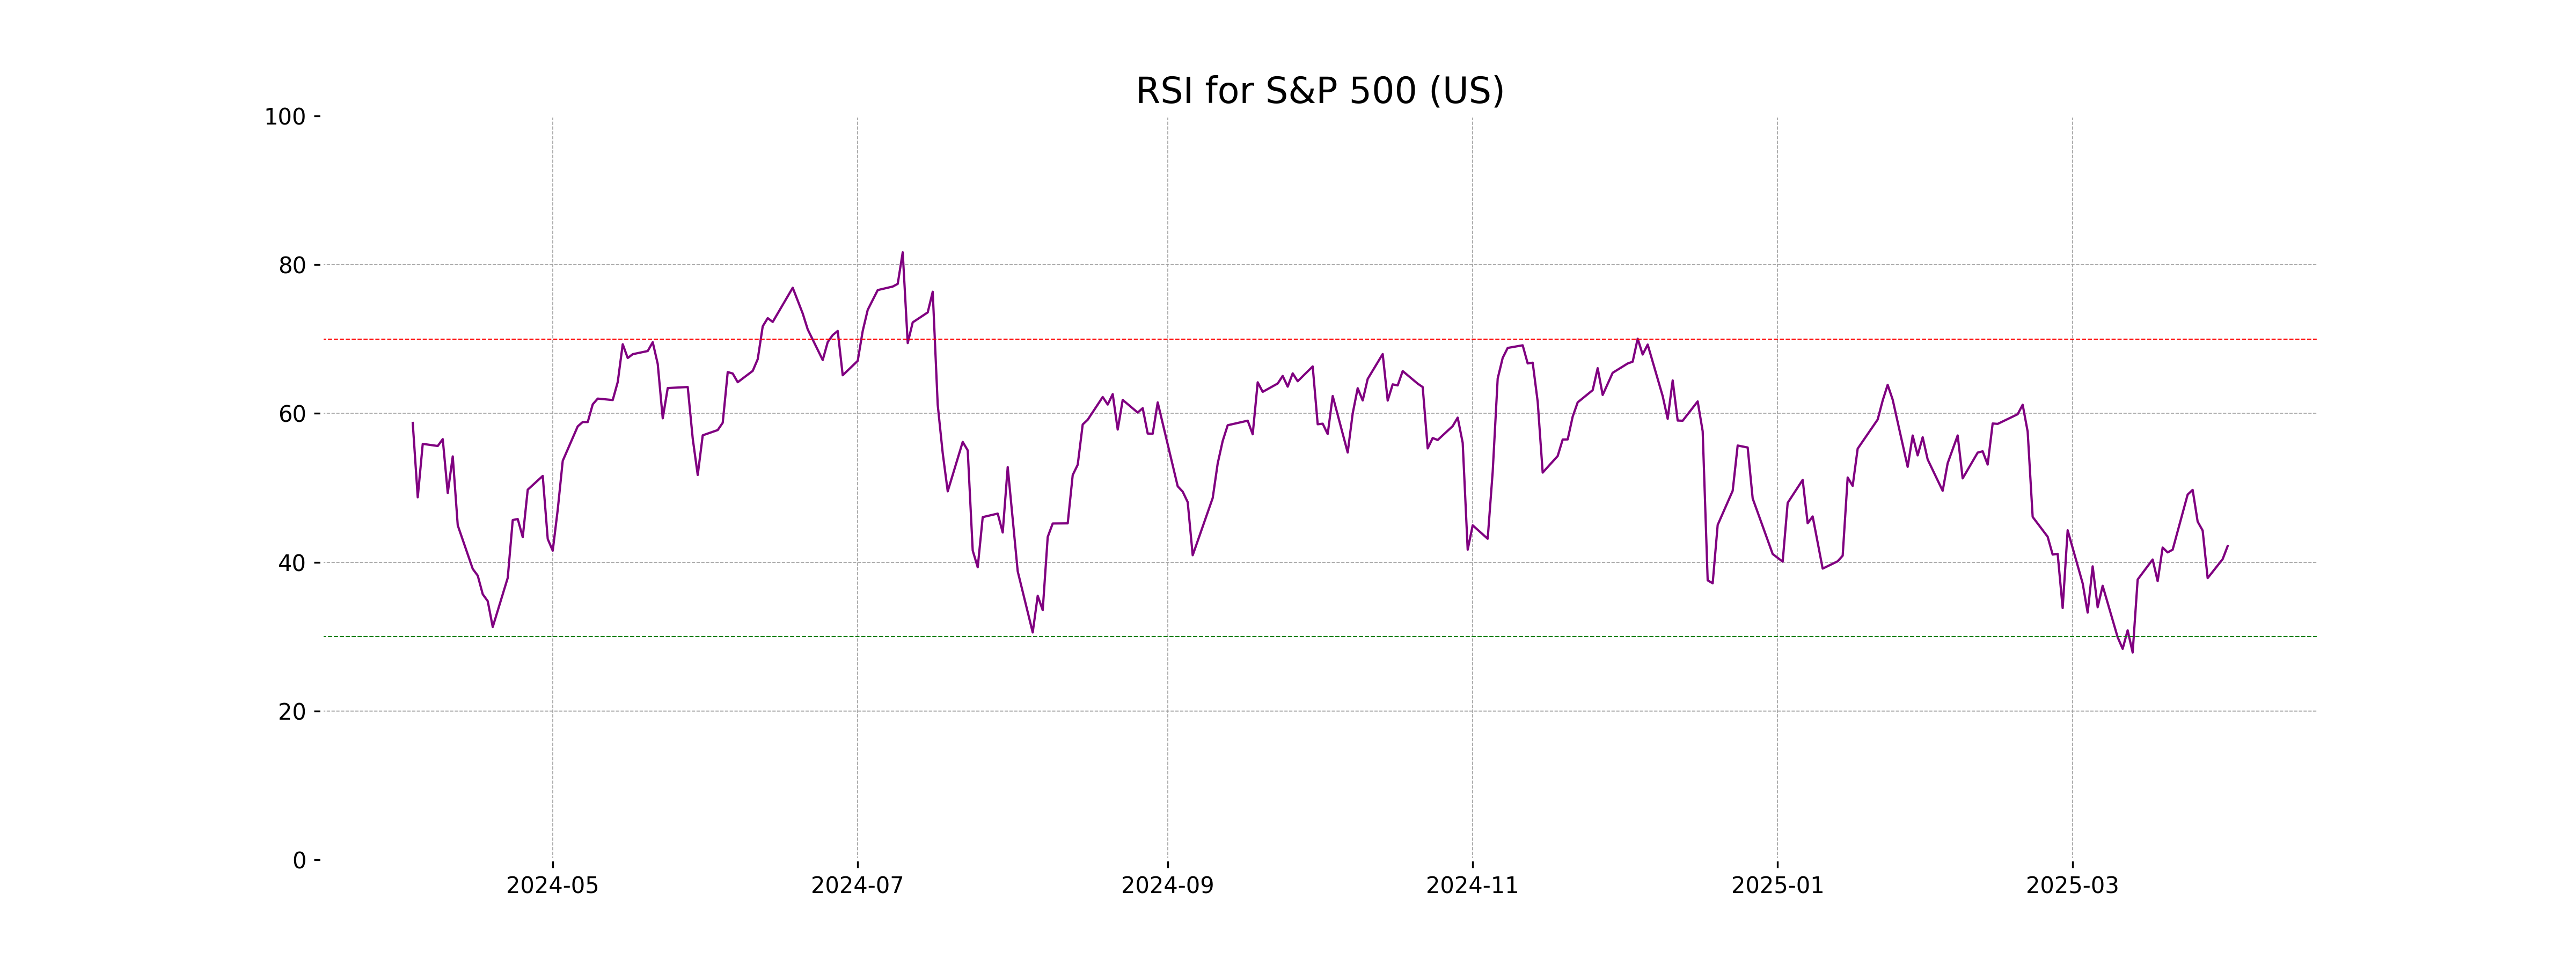
The S&P 500 (US) opened at 5597.53, closed at 5633.07, showing a slight increase over the previous close of 5611.85, with a percentage change of 0.38% and a points change of 21.22. While the 50-day EMA (5809.58) and 20-day EMA (5705.48) are above the closing price, the RSI of 42.17 suggests the index is nearing oversold conditions. The MACD of -63.91 indicates a bearish trend, although it is improving towards the MACD Signal of -70.79.
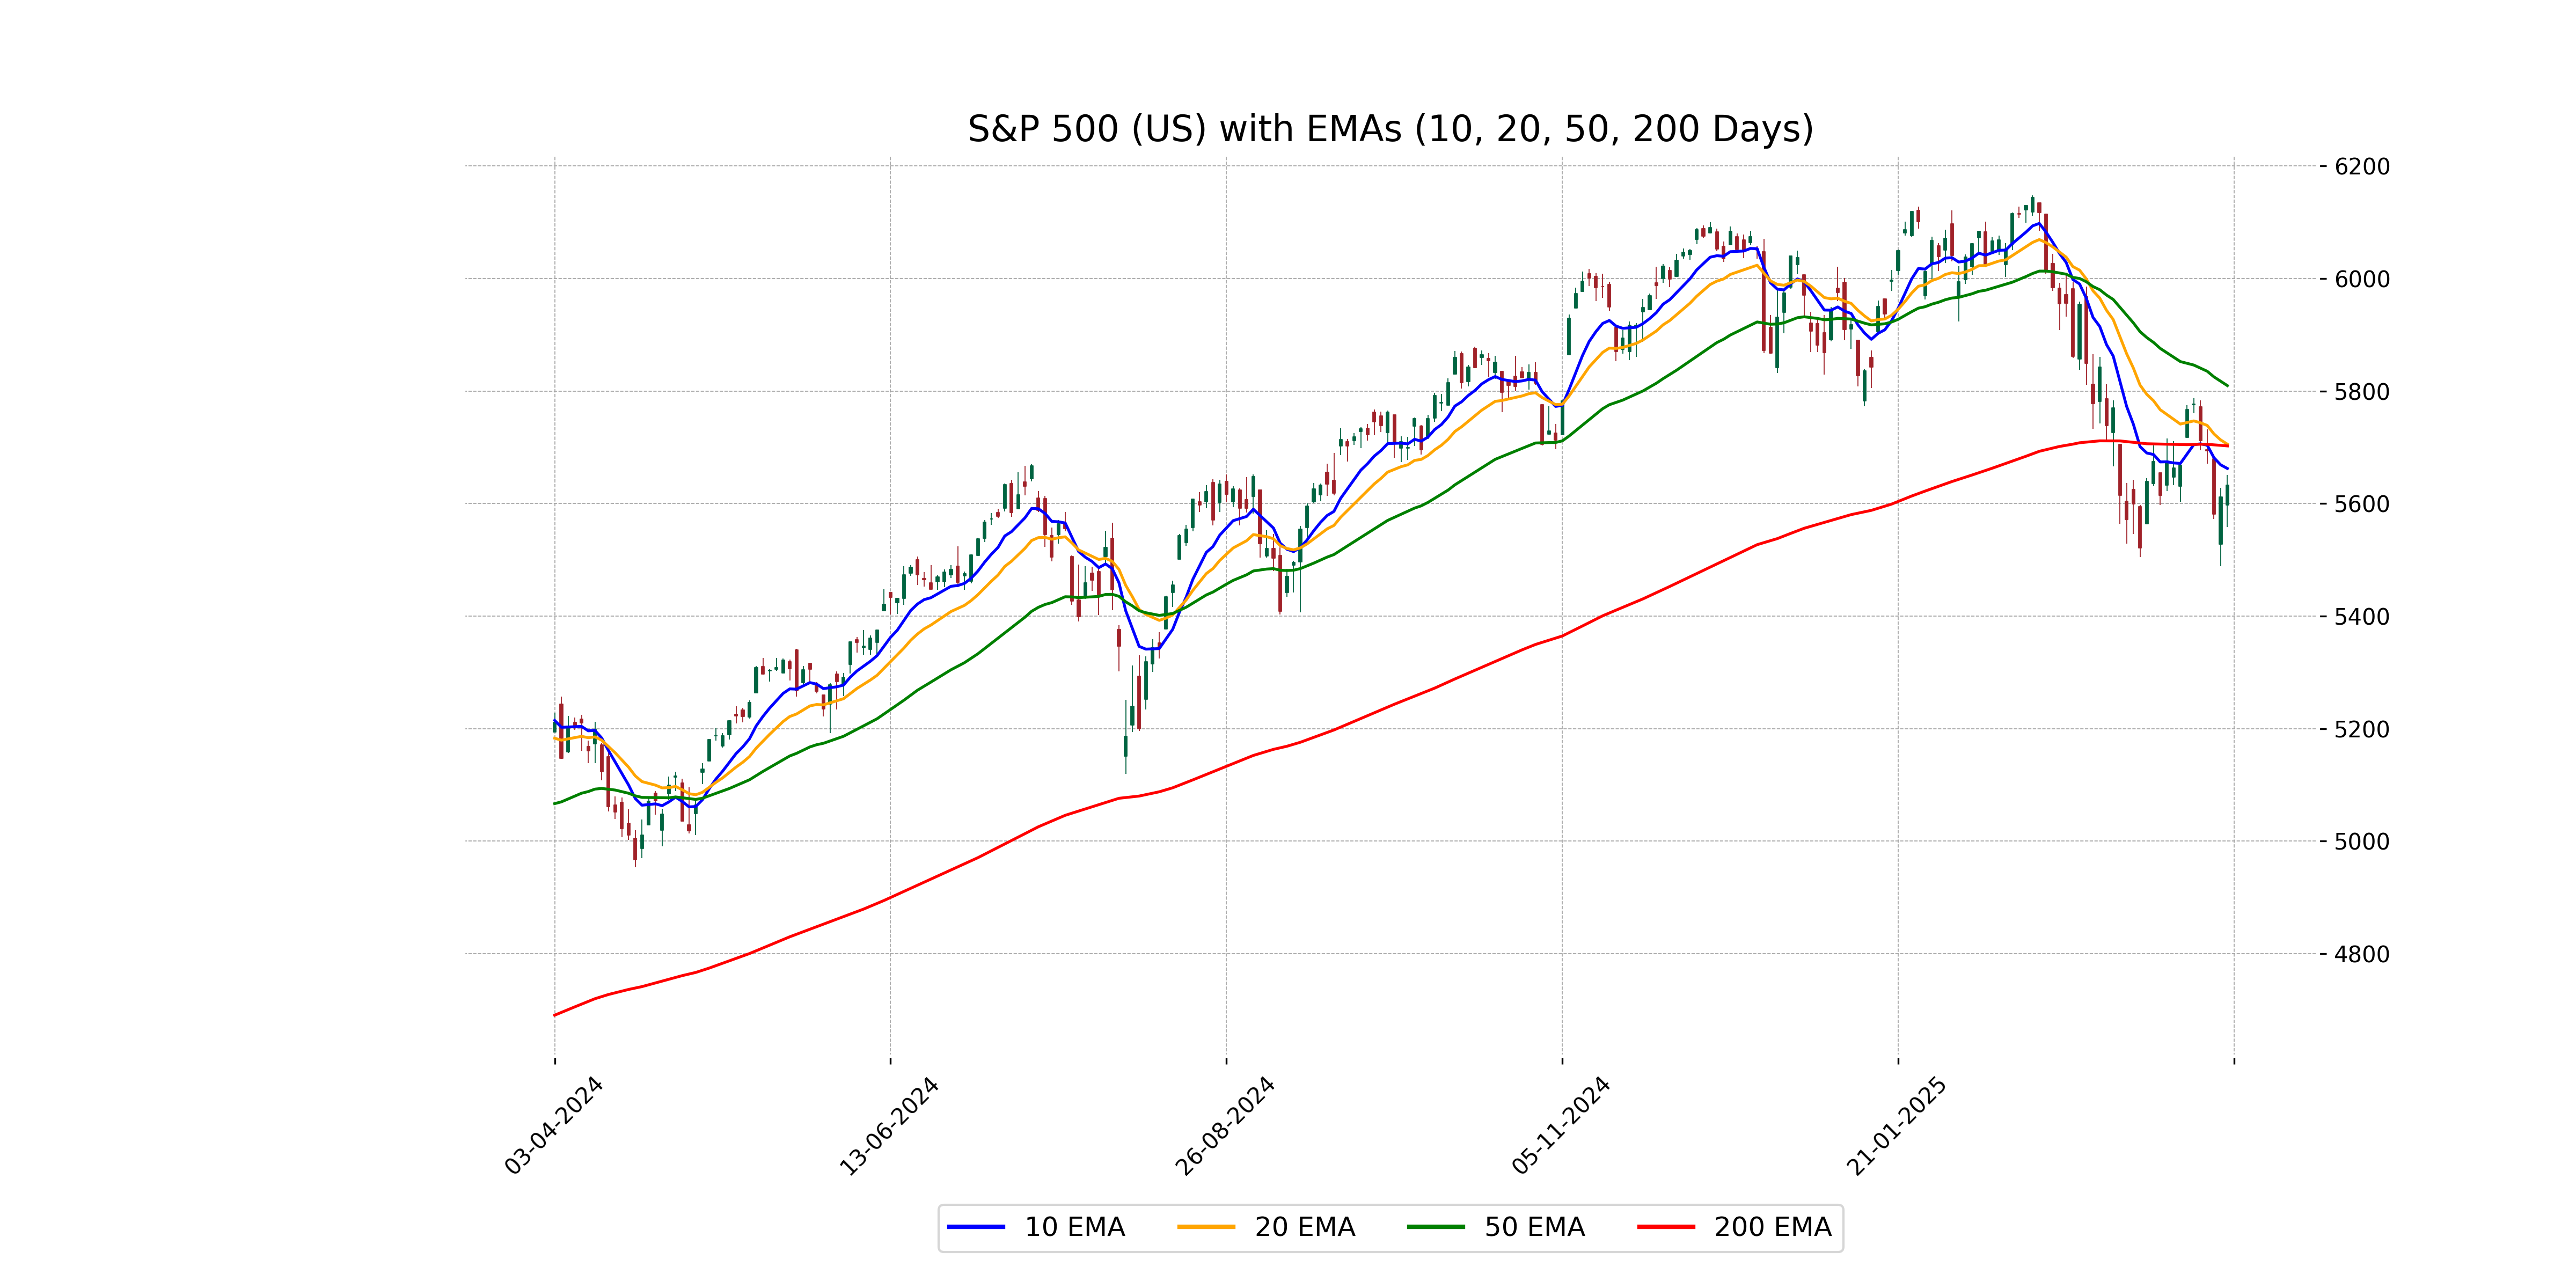
Relationship with Key Moving Averages
The S&P 500 closed below its 10 EMA, 20 EMA, 50 EMA, and 200 EMA, indicating a bearish trend relative to these key moving averages. The 50 EMA is higher than both the 20 EMA and 200 EMA, reflecting a potential longer-term bearish sentiment. Additionally, the current position of the close shows weakening momentum with the RSI at 42.17 and MACD indicating bearishness being below the MACD Signal.
Moving Averages Trend (MACD)
S&P 500's MACD indicator is negative, at -63.91, which suggests a bearish sentiment, but since it is above the MACD Signal line of -70.79, this may imply a potential reversal or weakening bearish trend. The overall momentum still indicates downward pressure on the stock.
RSI Analysis
RSI Analysis for S&P 500 (US): The RSI value for S&P 500 is 42.17, which suggests that the market is approaching oversold conditions. This indicates potential buying opportunities, as an RSI below 30 typically signifies an oversold market.
Analysis for Hang Seng Index (Hong Kong) - April 02, 2025
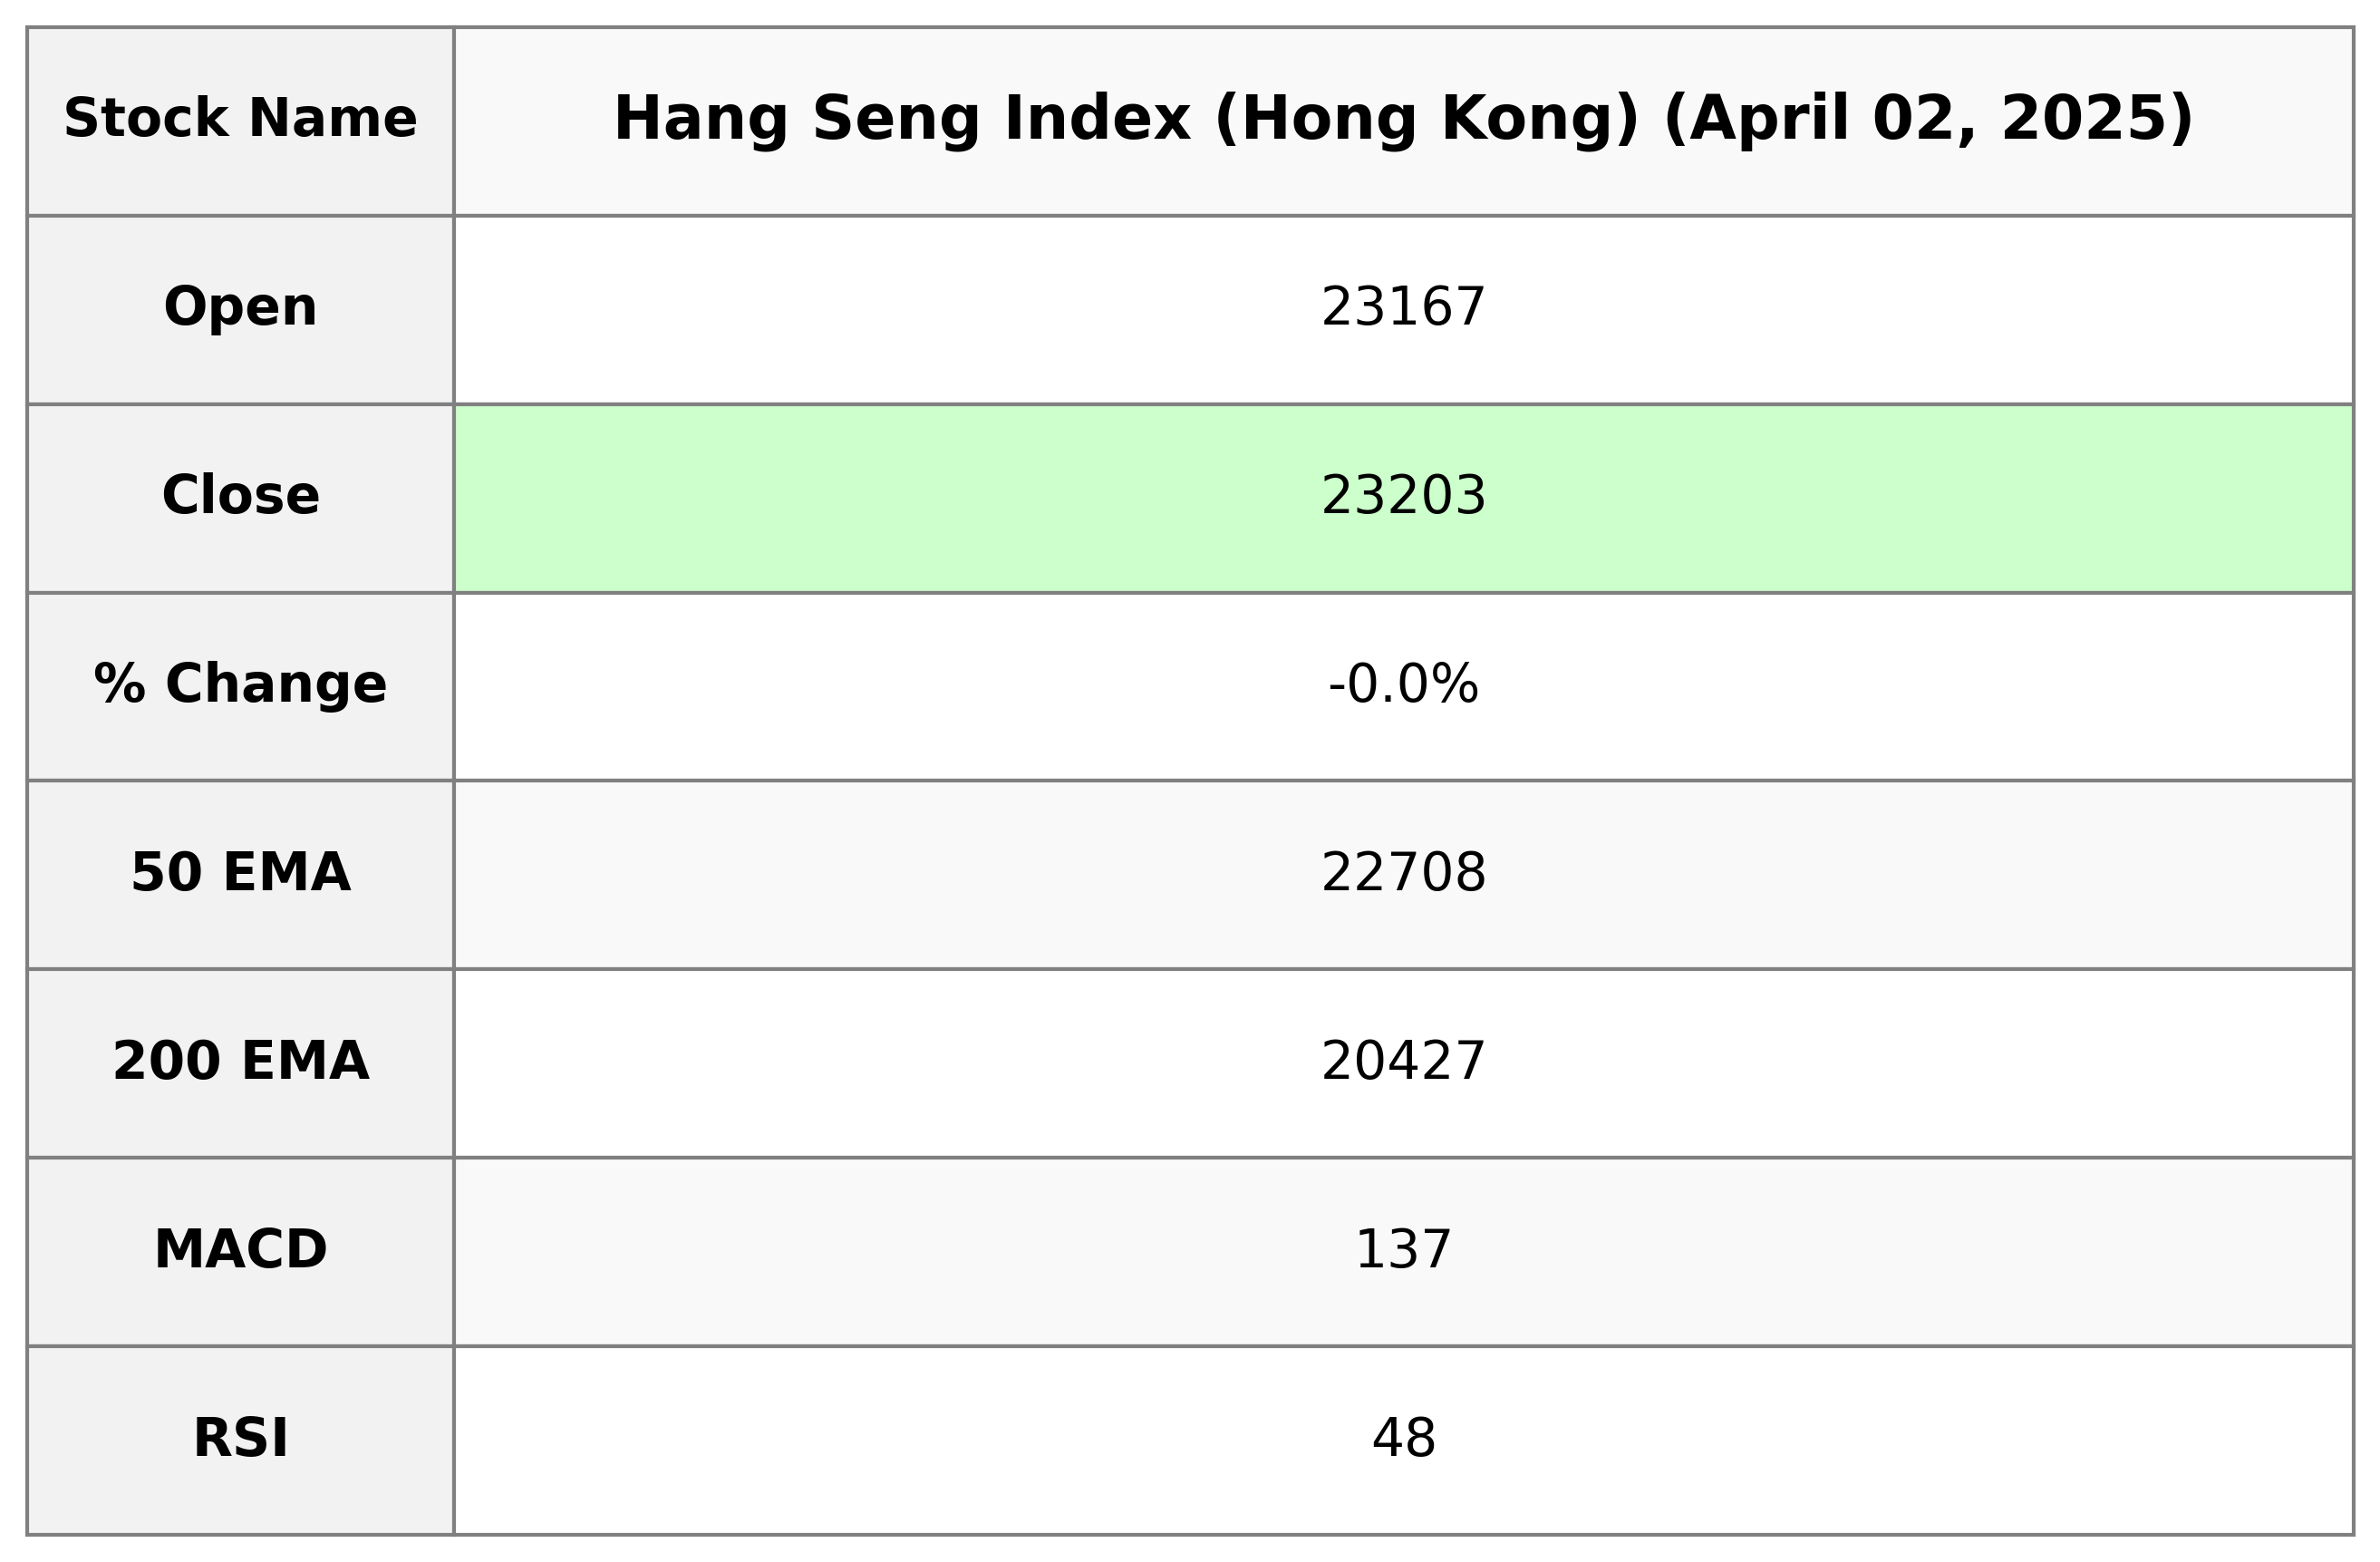
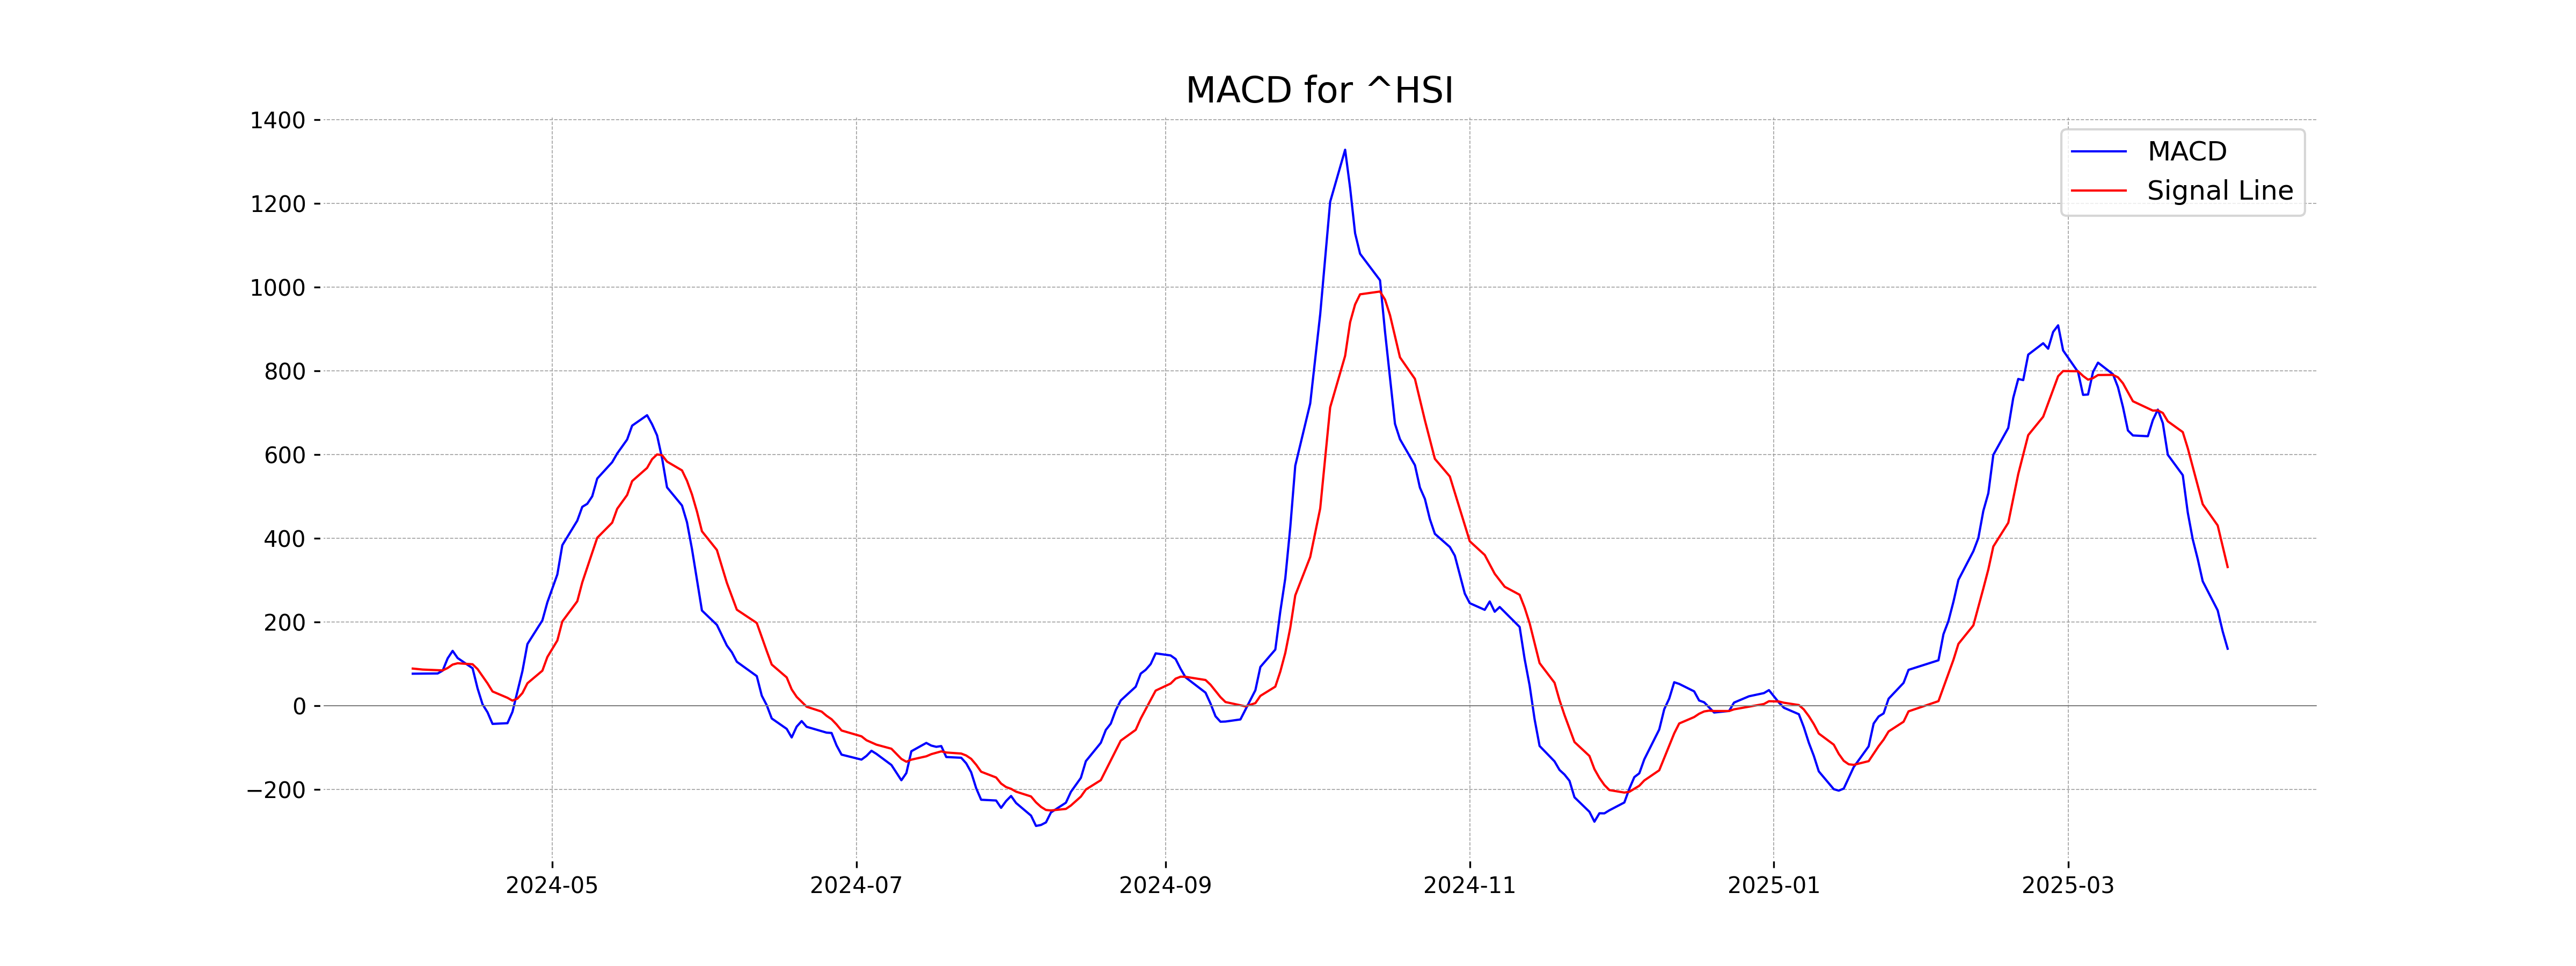
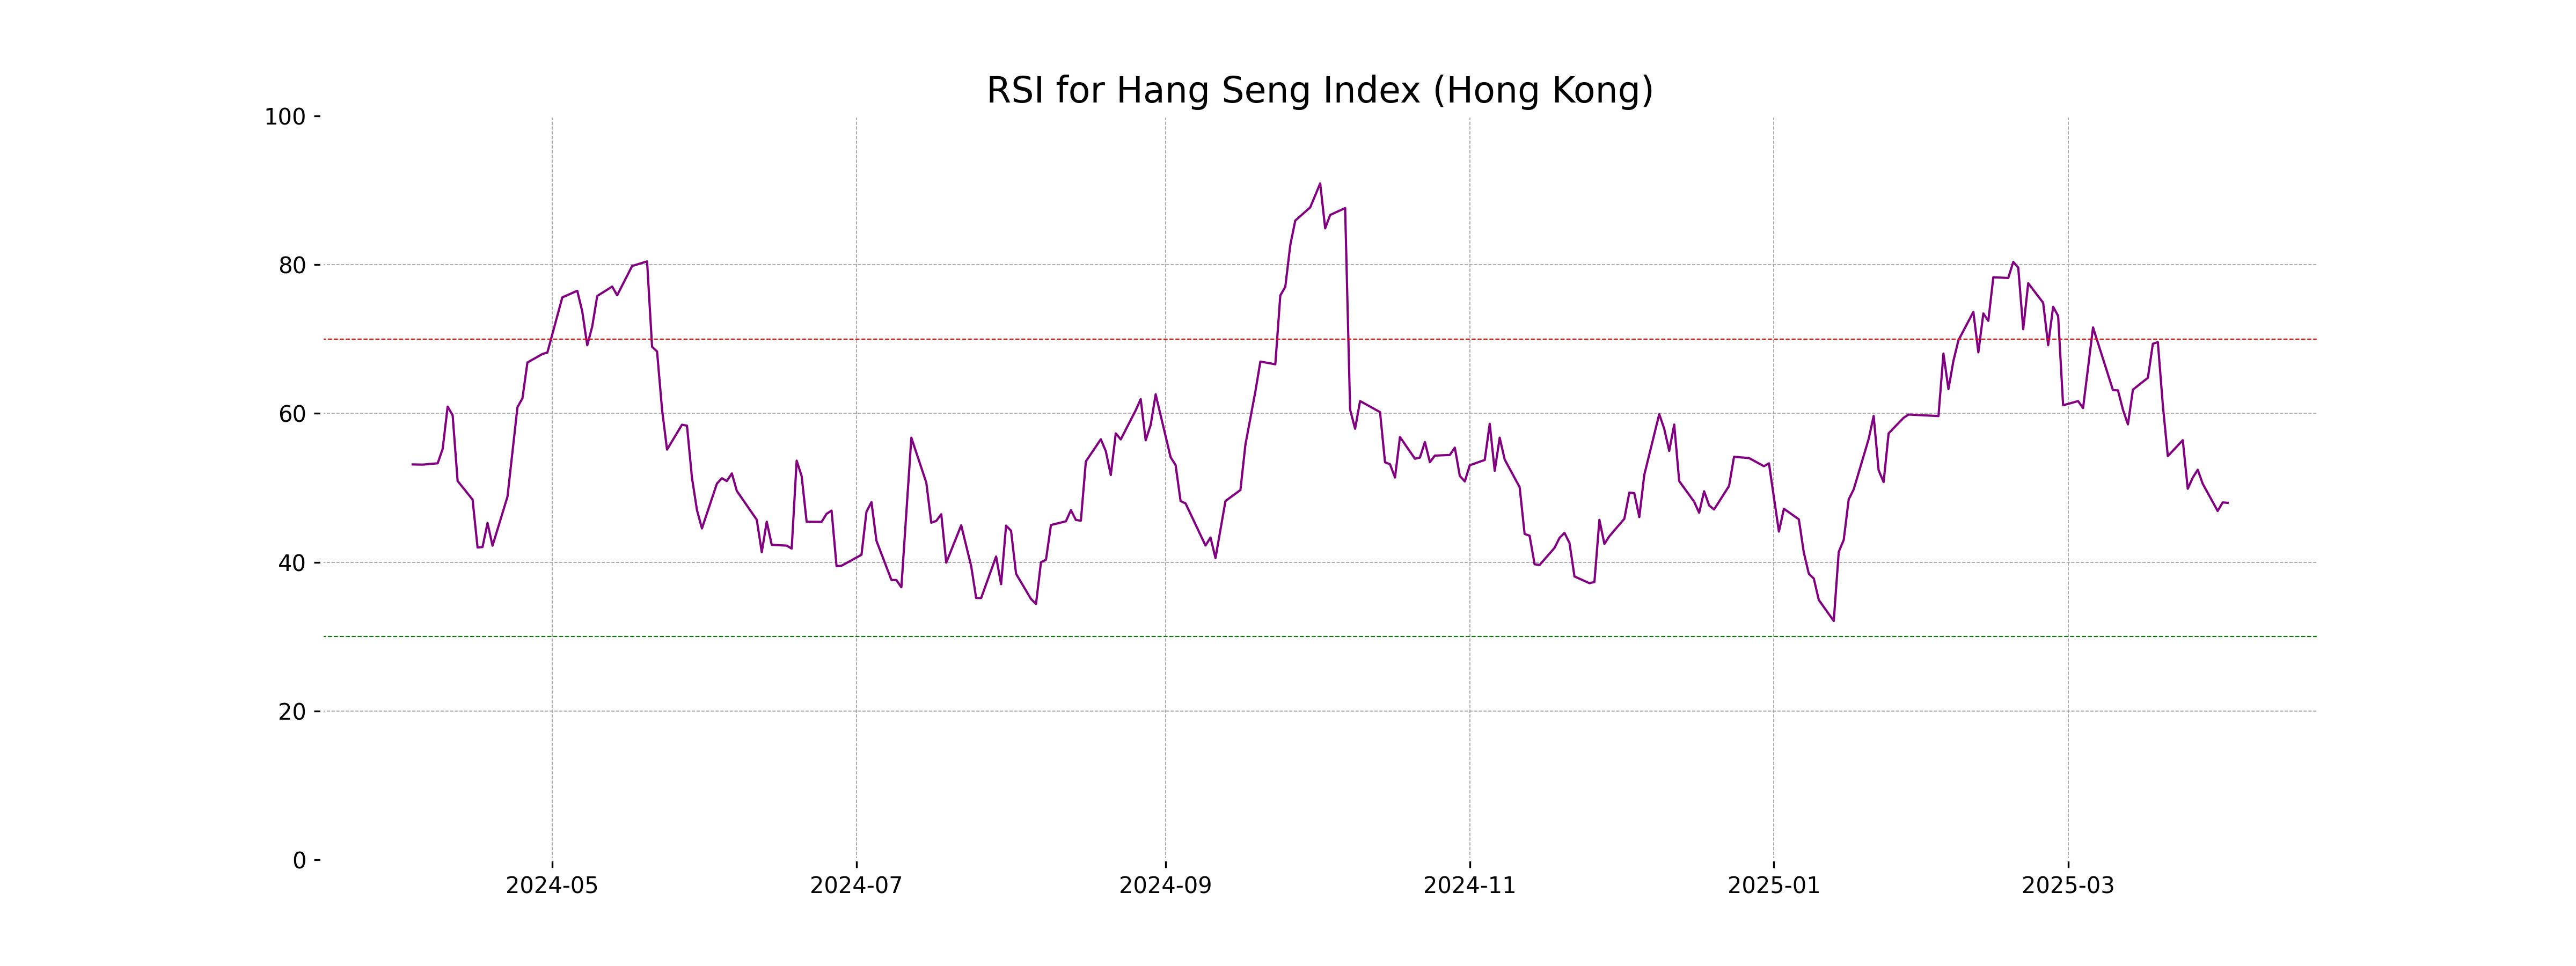
Hang Seng Index opened at 23167.31 and closed slightly lower at 23202.53, marking a slight decline of 0.02% with a points change of -4.31. The RSI is at 47.98, indicating neutral momentum, and the MACD is -195.16 while the signal line is 331.79, pointing to potential bearish sentiment. The index is trading above the 50 EMA of 22708.20, but well above the 200 EMA of 20426.63, suggesting short-term volatility amidst a long-term uptrend.
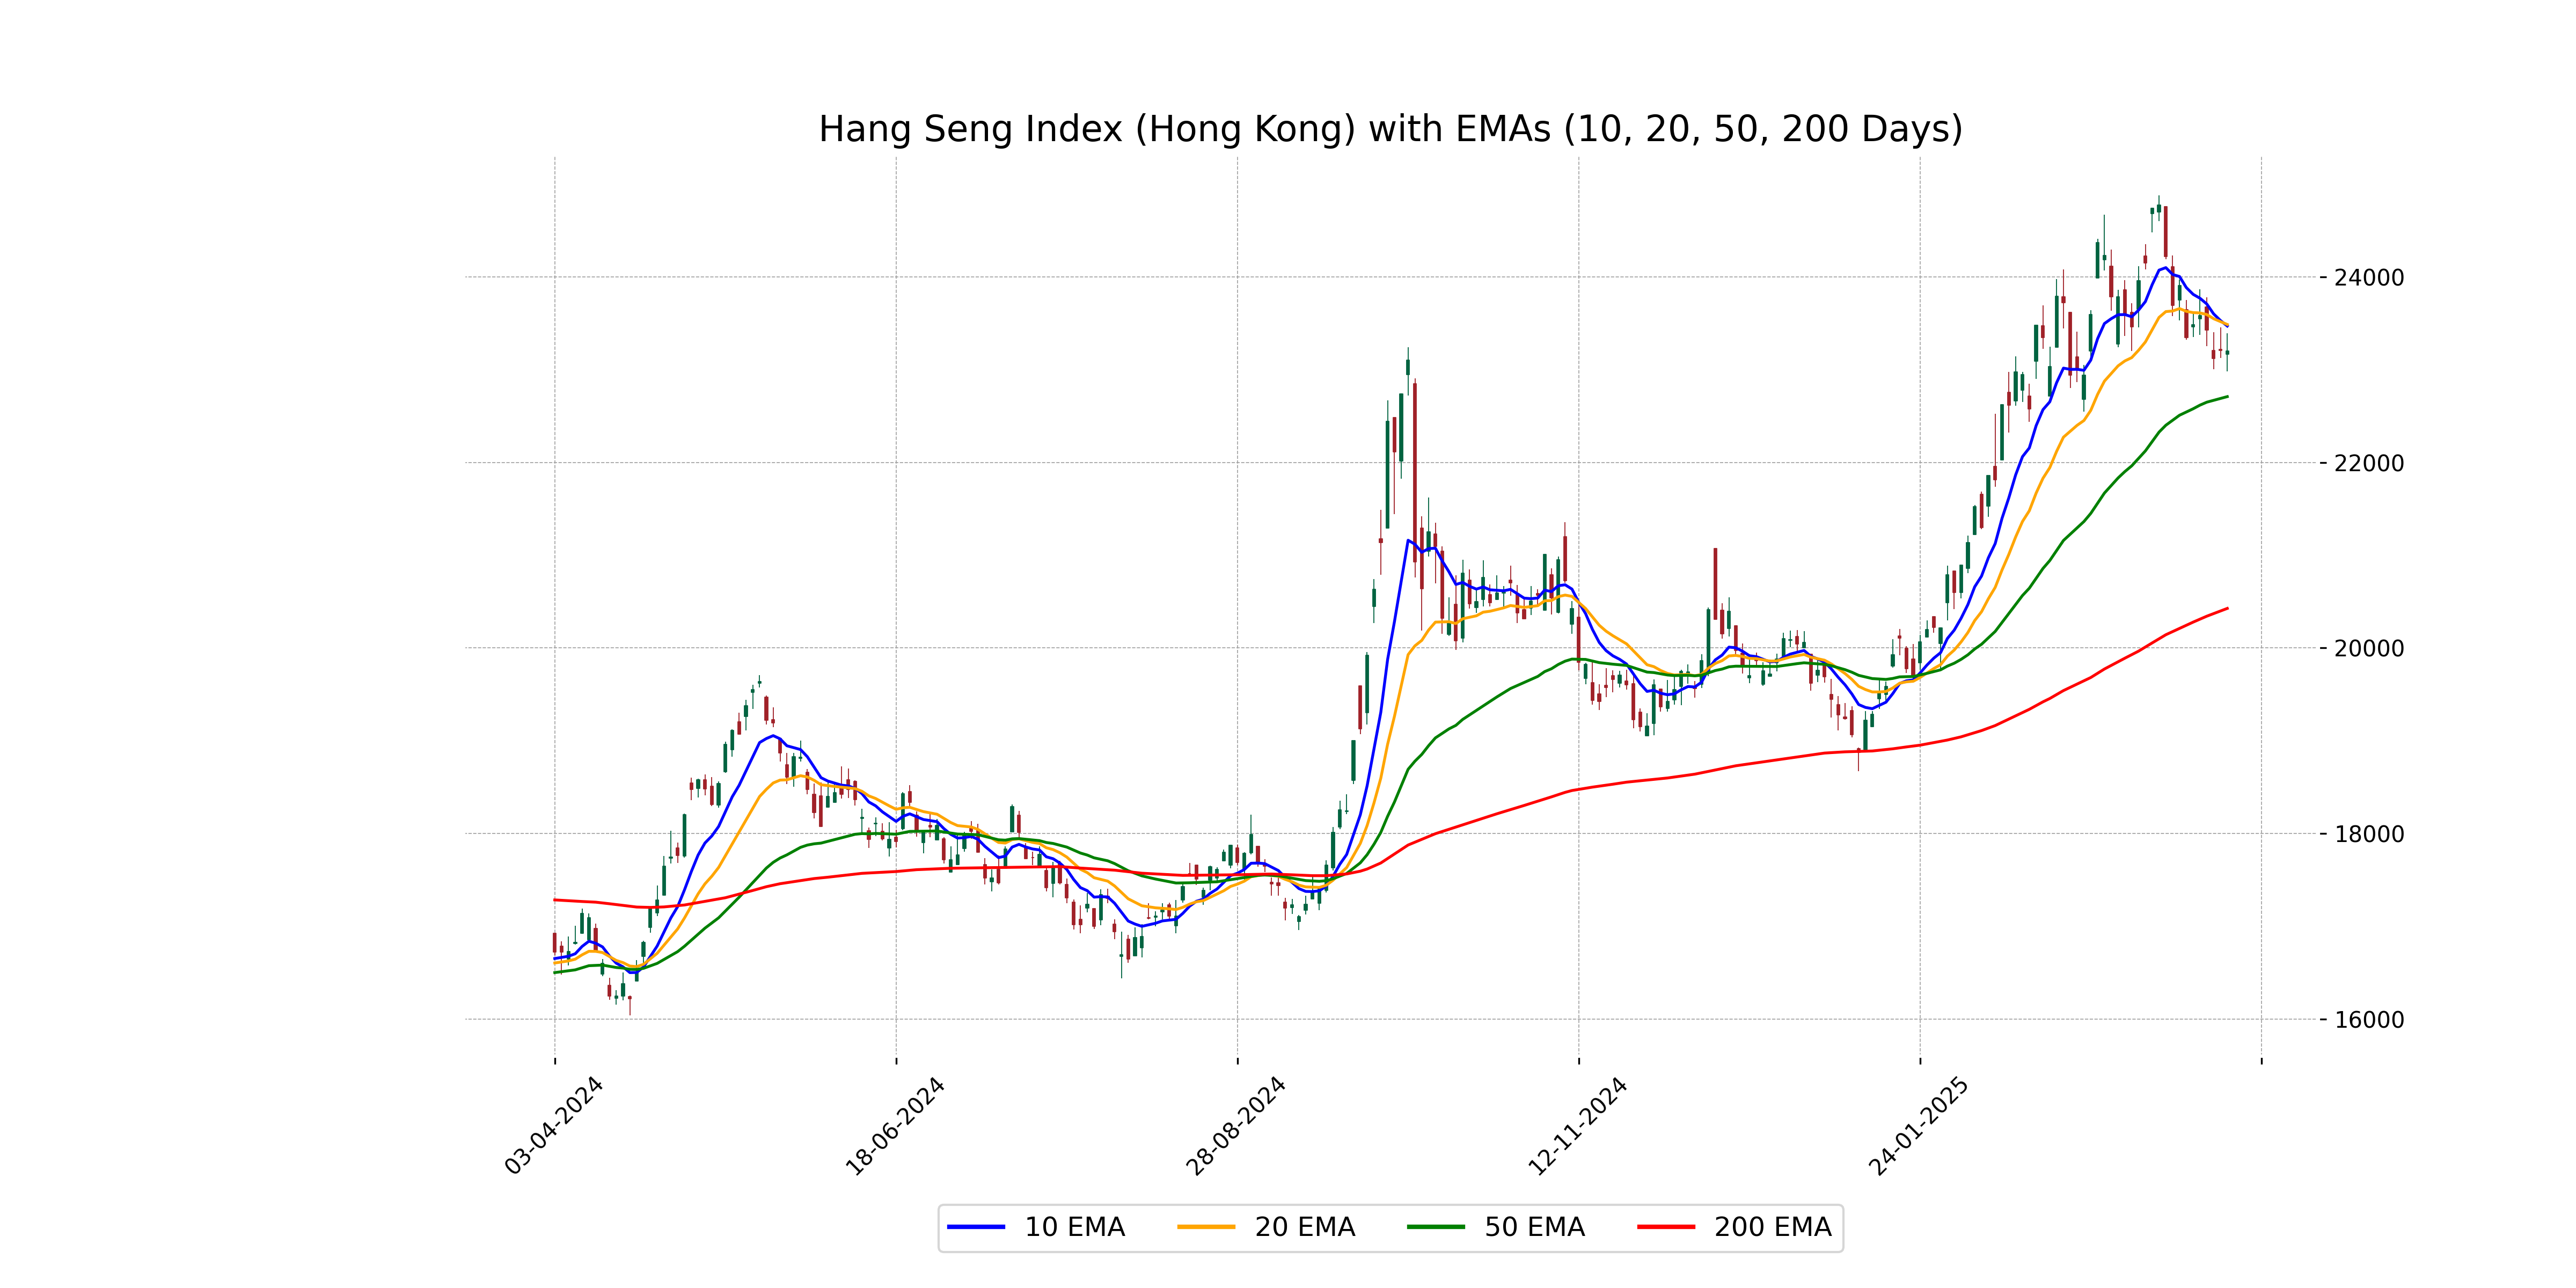
Relationship with Key Moving Averages
Hang Seng Index (Hong Kong) is currently trading close to its previous close, with a minor downward change of -0.0186%. The current close of 23,202.53 is above the 50 EMA of 22,708.20 and significantly above the 200 EMA of 20,426.63, indicating a longer-term upward trend, but it remains below the 10 EMA of 23,468.77 and 20 EMA of 23,485.26, suggesting potential short-term downward pressures.
Moving Averages Trend (MACD)
MACD Analysis for Hang Seng Index (Hong Kong): The MACD for the Hang Seng Index is 136.63, while the MACD Signal is higher at 331.79. This indicates that the index might be experiencing a bearish trend as the MACD line is below the MACD Signal line.
RSI Analysis
RSI Analysis for Hang Seng Index (Hong Kong): The Relative Strength Index (RSI) for the Hang Seng Index is approximately 48, which suggests a neutral position since RSI values below 30 typically indicate that a stock is oversold, while values above 70 suggest it is overbought. With an RSI close to 50, the index shows balanced momentum without a strong bullish or bearish trend.
Analysis for IBEX 35 (Spain) - April 02, 2025
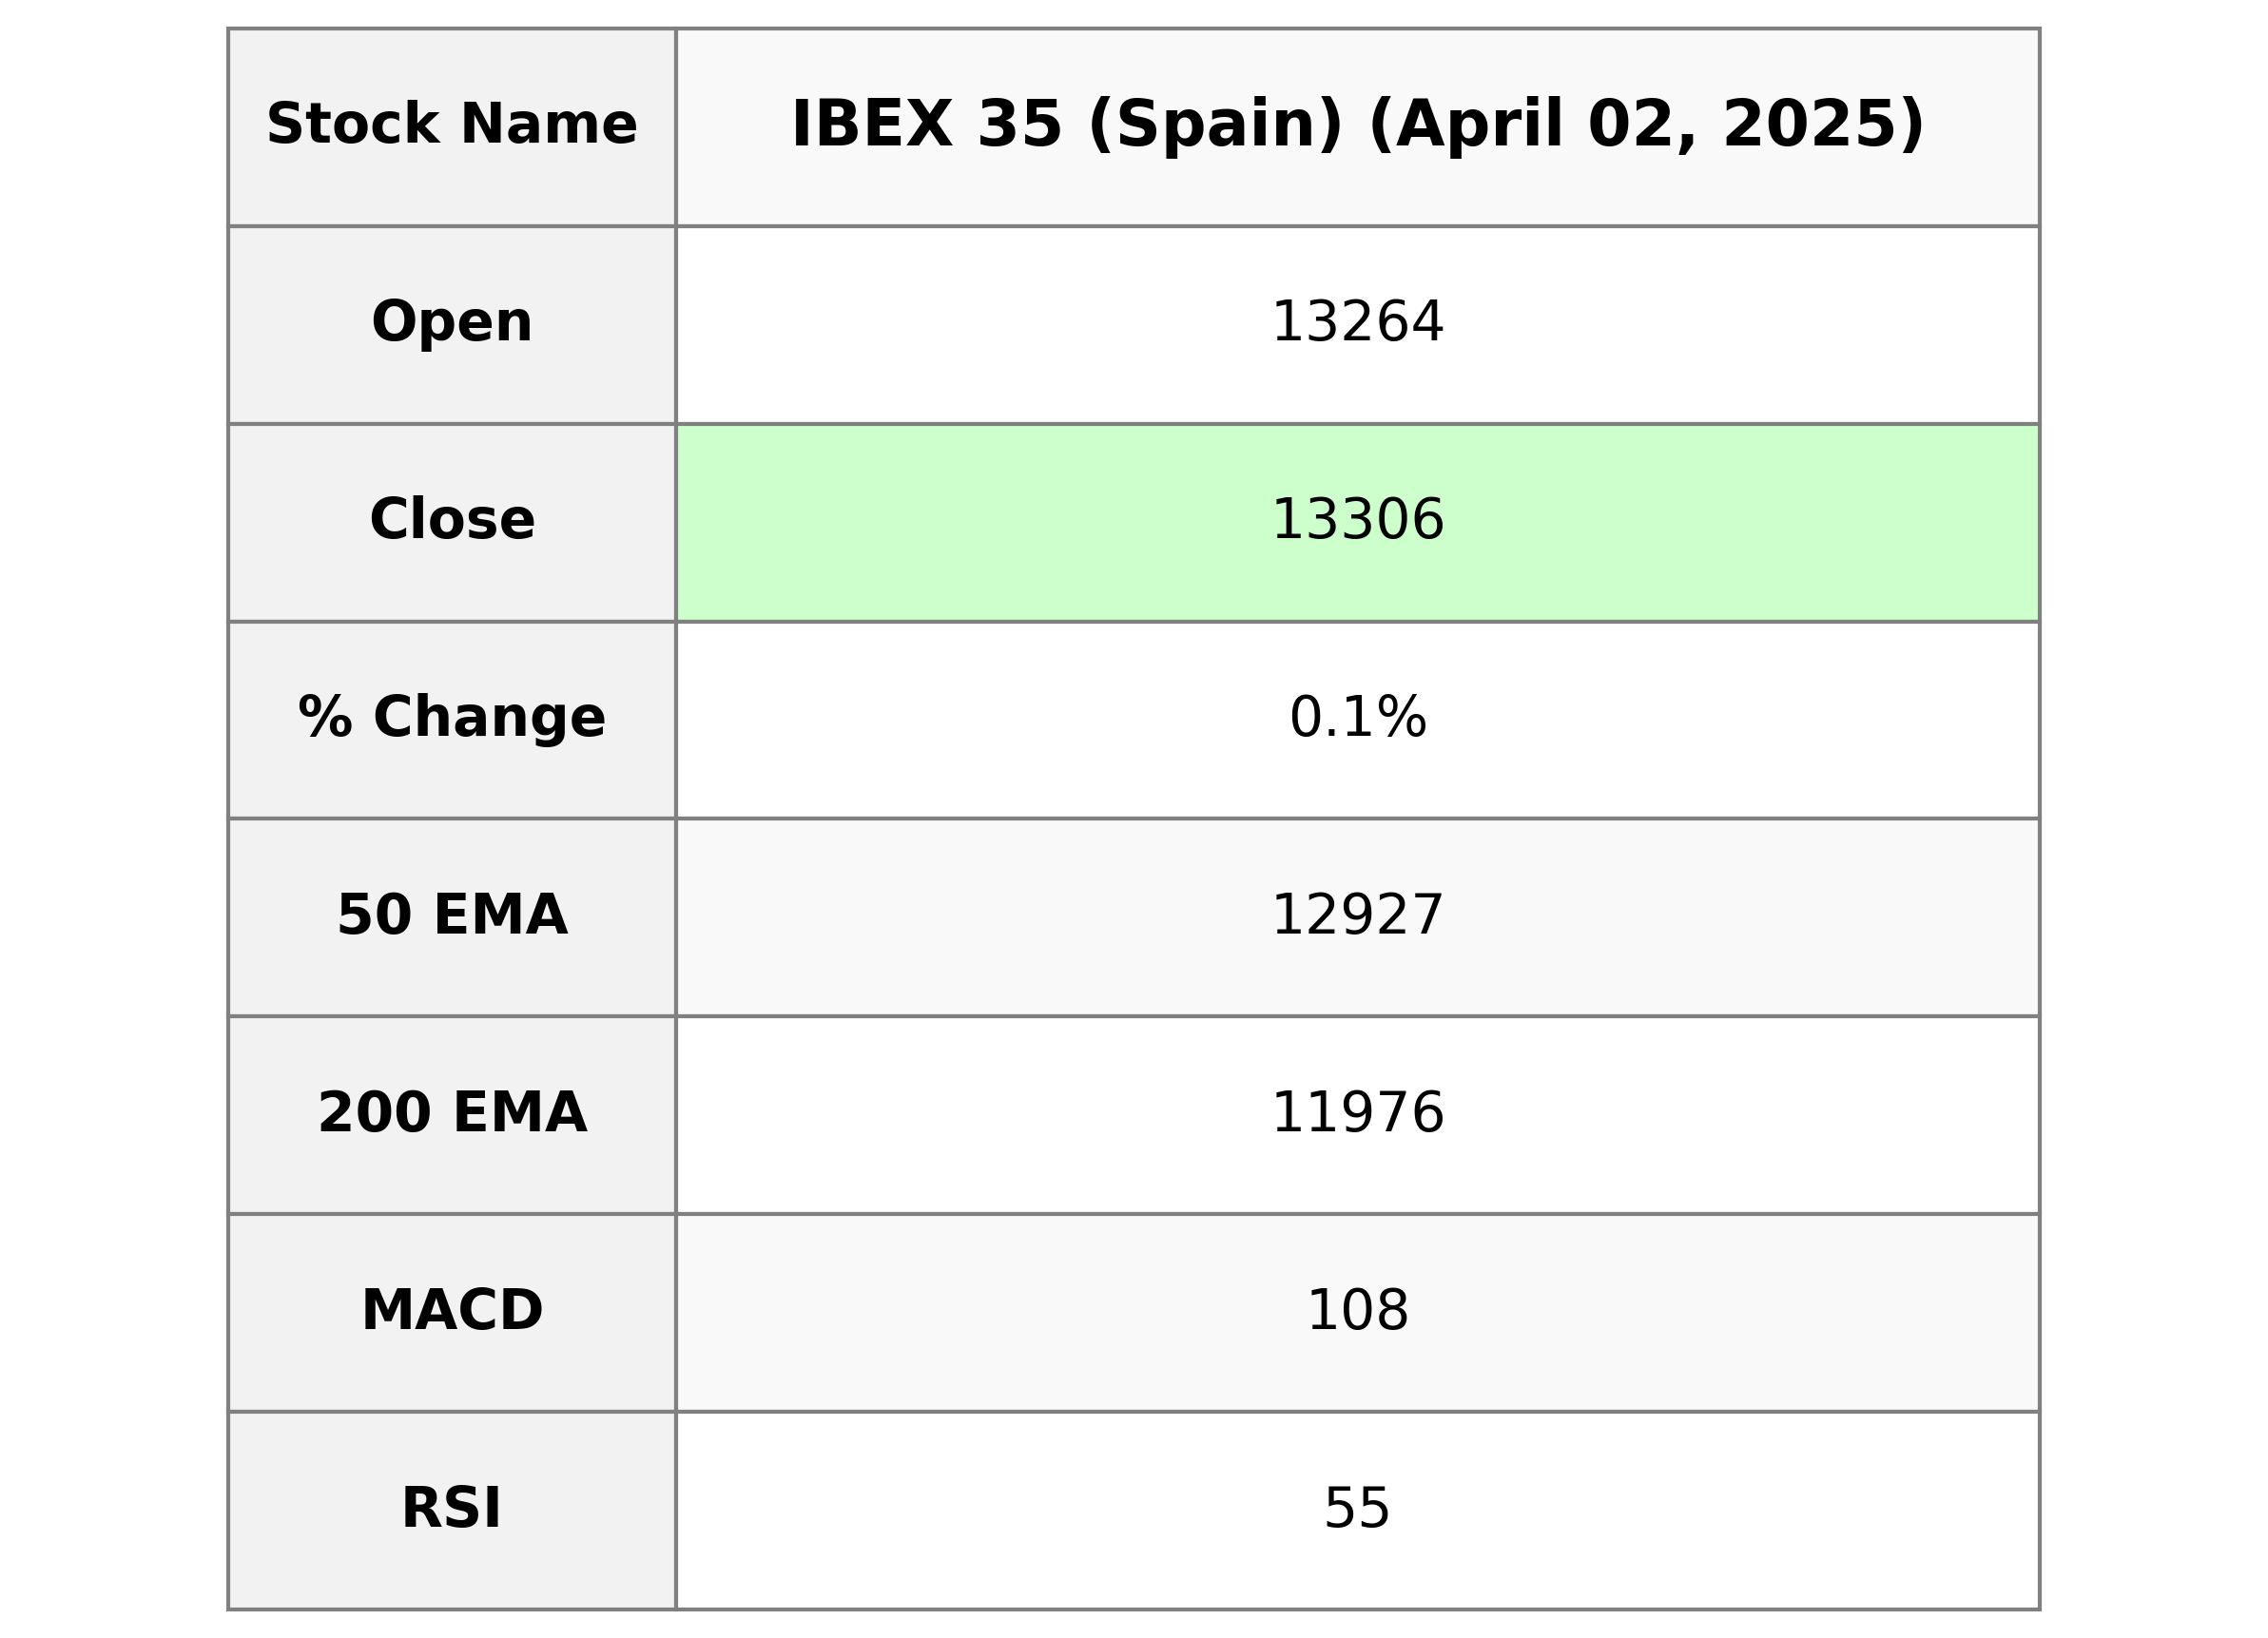
IBEX 35 (Spain) opened at 13263.60, reaching a high of 13347.30 and a low of 13263.60, before closing at 13305.80. It experienced a slight increase from the previous close of 13297.00, with a percentage change of 0.066%. The trading volume was recorded at 30,384,429. Key moving averages indicate that the 50-EMA stands at 12926.59 and the RSI is measured at 55.41, suggesting moderate market momentum.
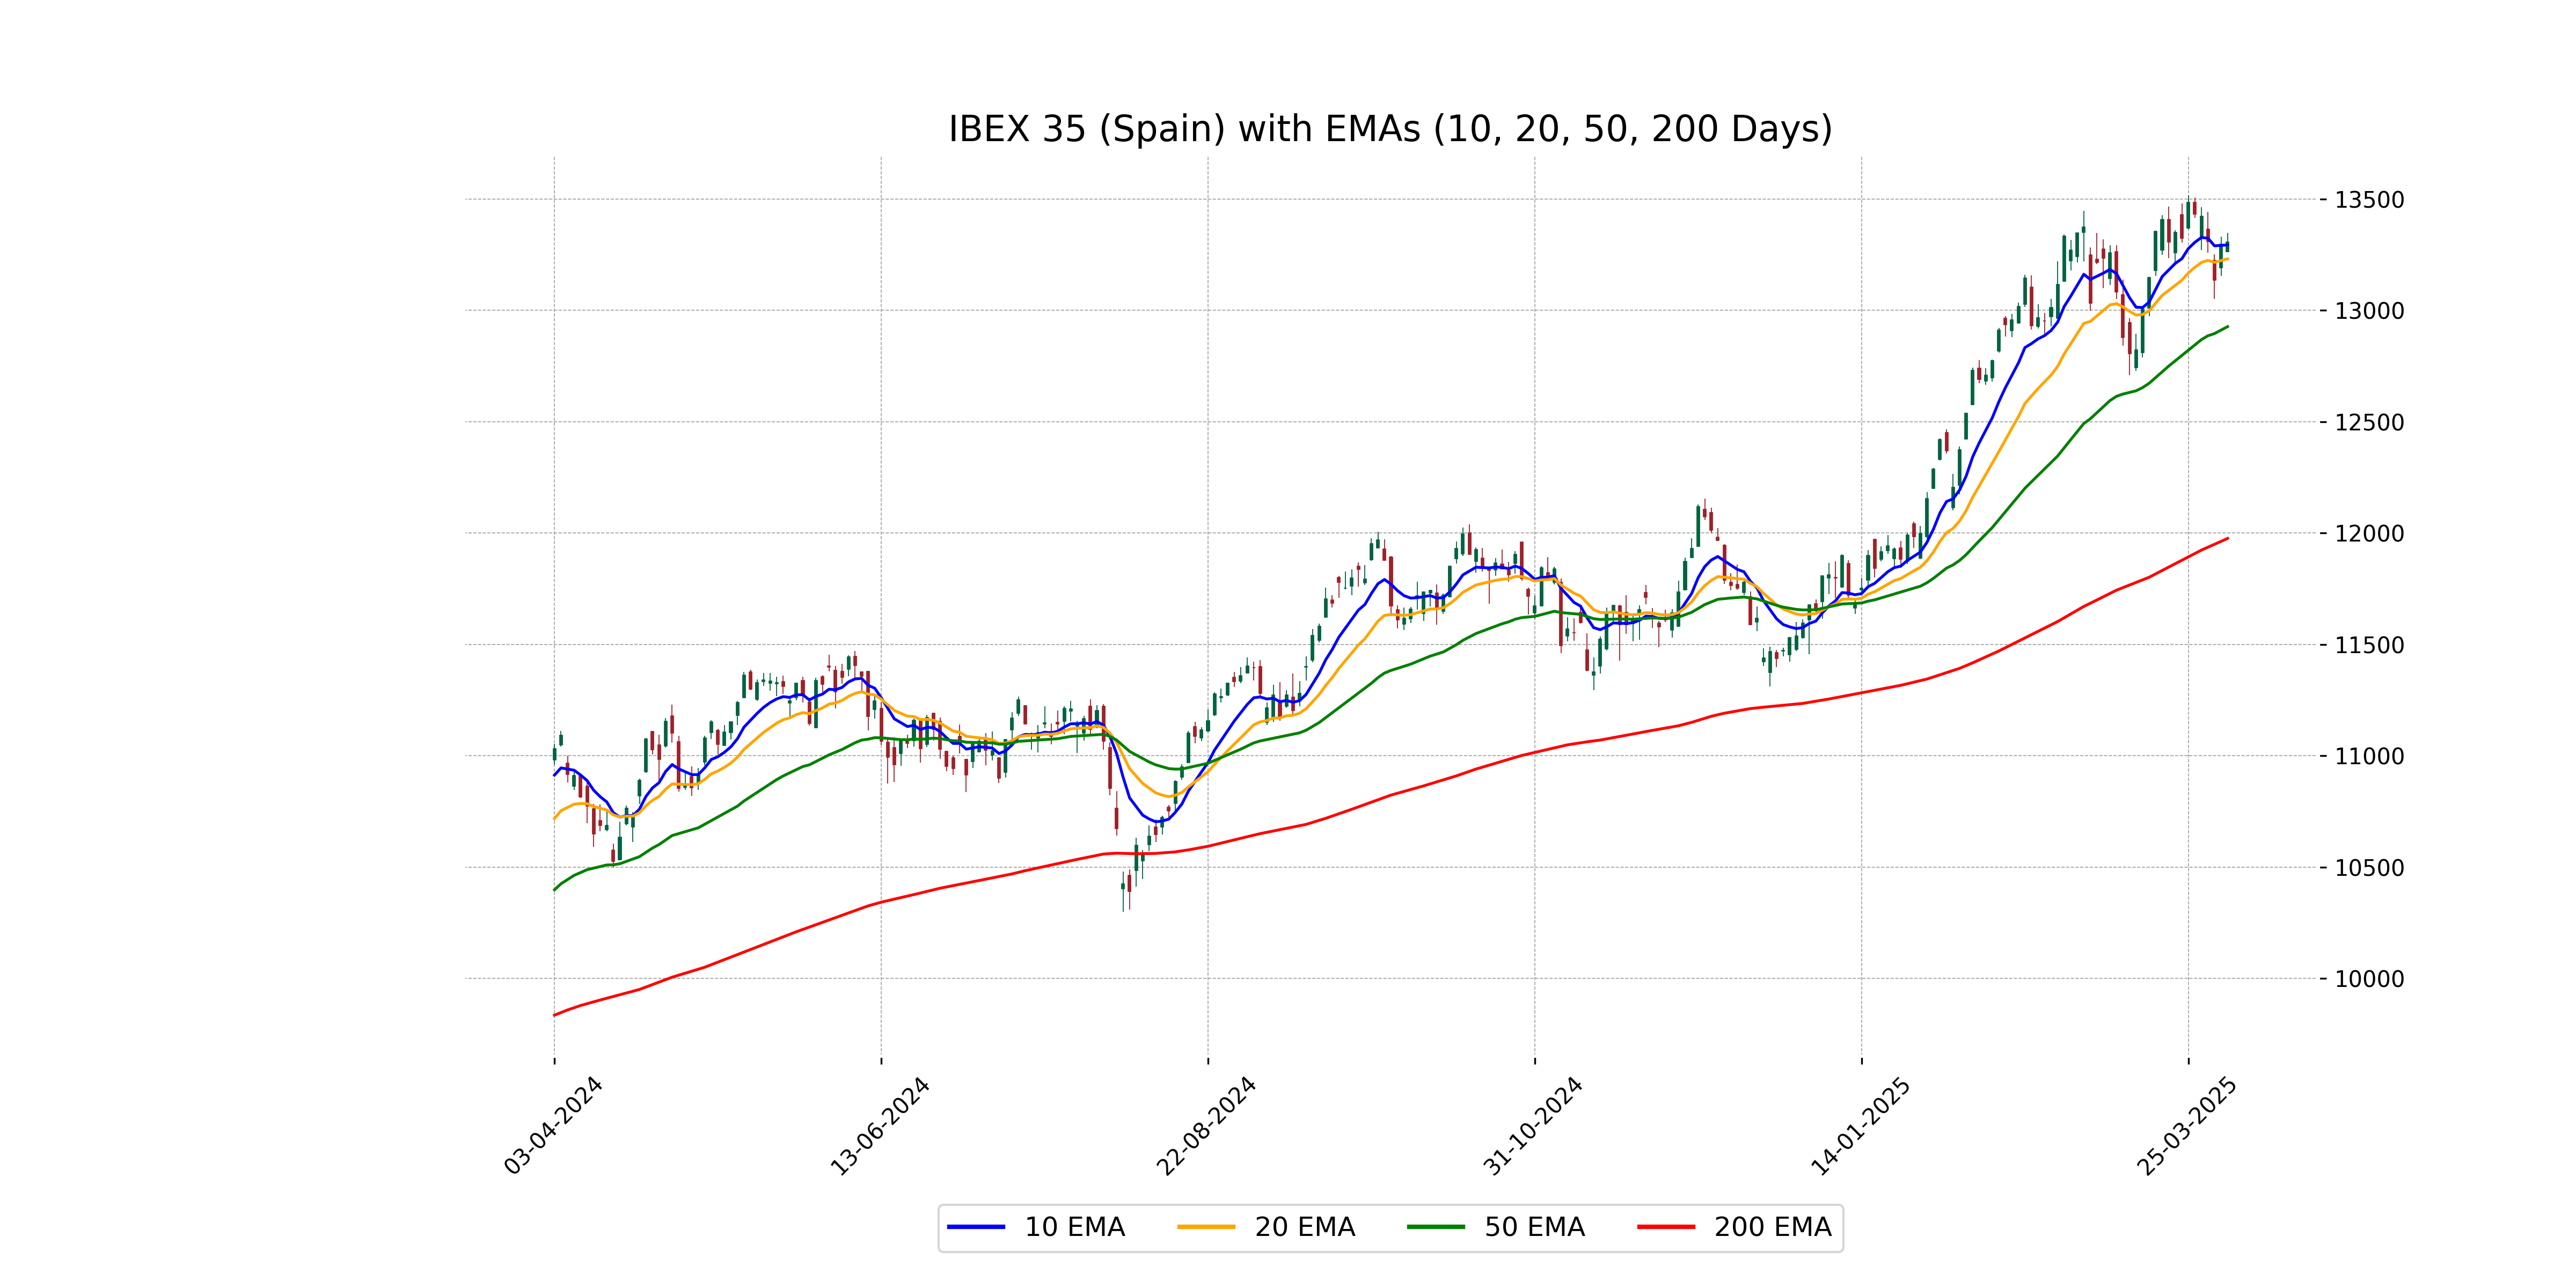
Relationship with Key Moving Averages
The IBEX 35 is trading above its 10 EMA of 13293.46, indicating short-term bullish momentum. It is also above its 50 EMA of 12926.59 and 200 EMA of 11975.74, indicating a strong overall upward trend.
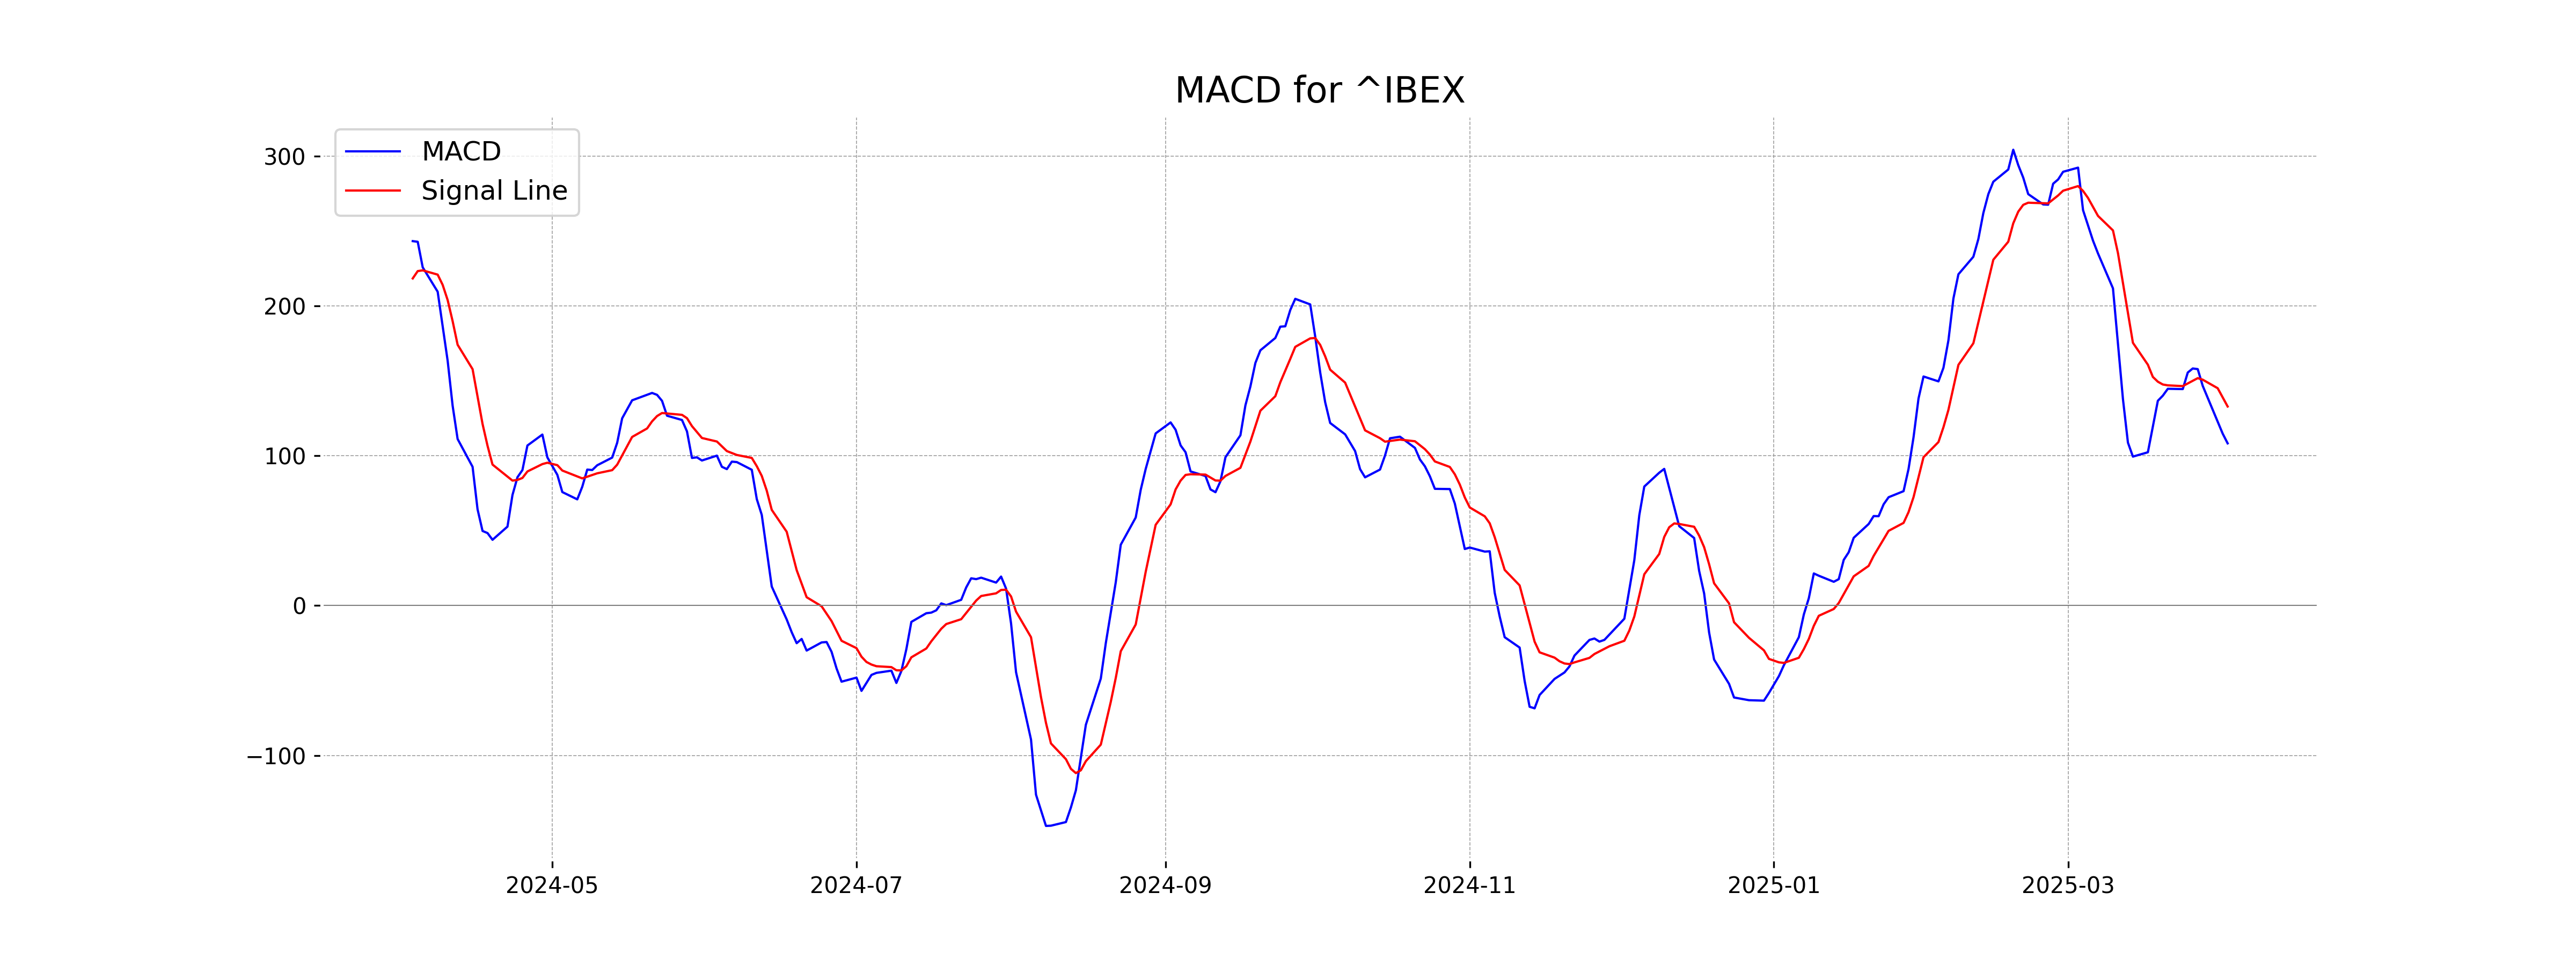
Moving Averages Trend (MACD)
The MACD for IBEX 35 indicates a positive trend with a value of 108.22. However, the MACD line is below the Signal line (132.81), suggesting a possible upcoming bearish crossover if the trend reverses. This situation warrants caution.
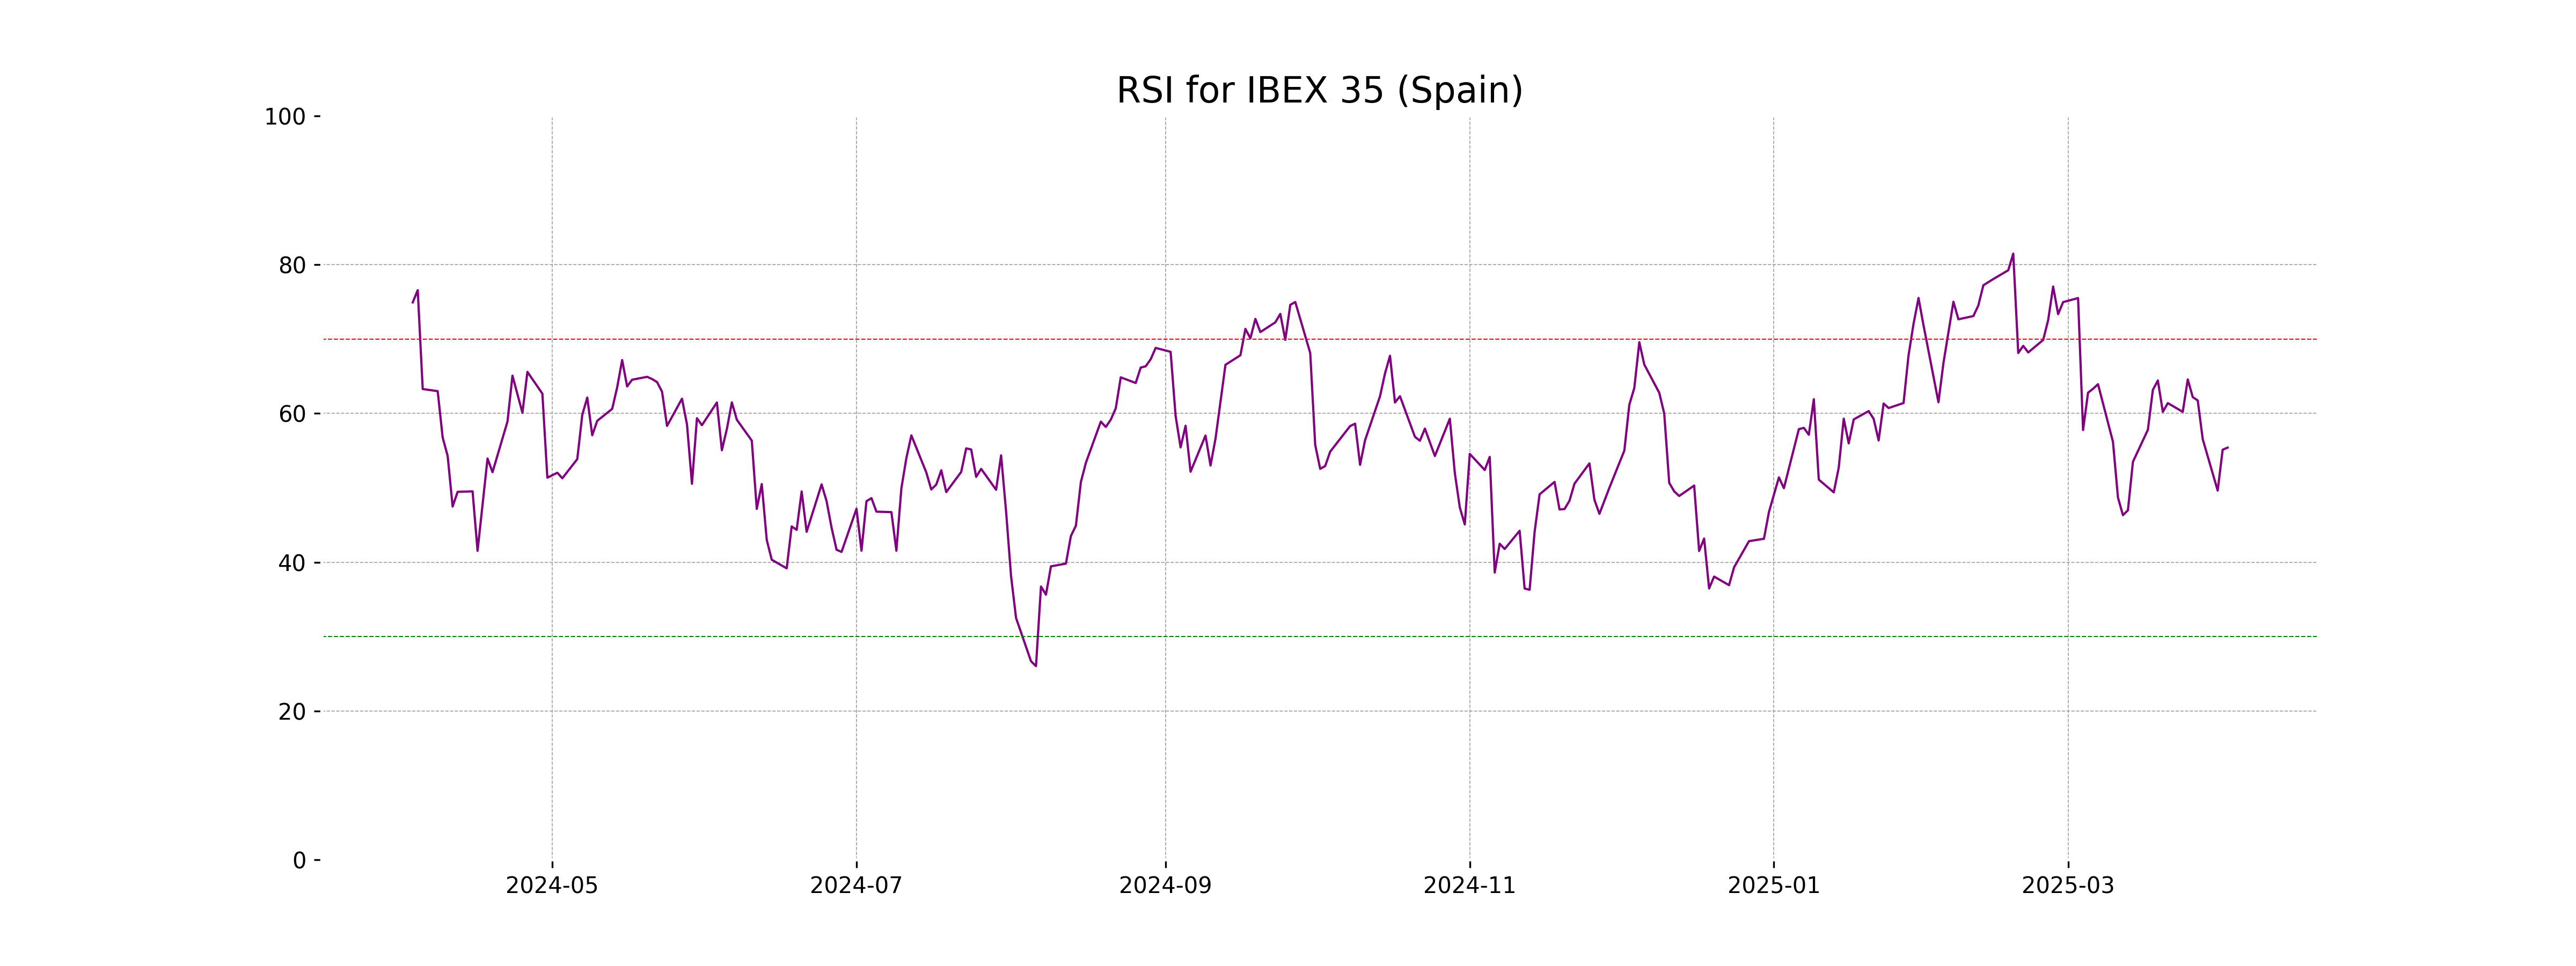
RSI Analysis
The RSI for the IBEX 35 is 55.41, indicating that the index is neither overbought nor oversold. Generally, an RSI above 70 suggests overbought conditions, while below 30 indicates oversold conditions. Therefore, the current RSI suggests a neutral trend with no immediate signs of extreme market movements.
Analysis for NASDAQ Composite (US) - April 02, 2025
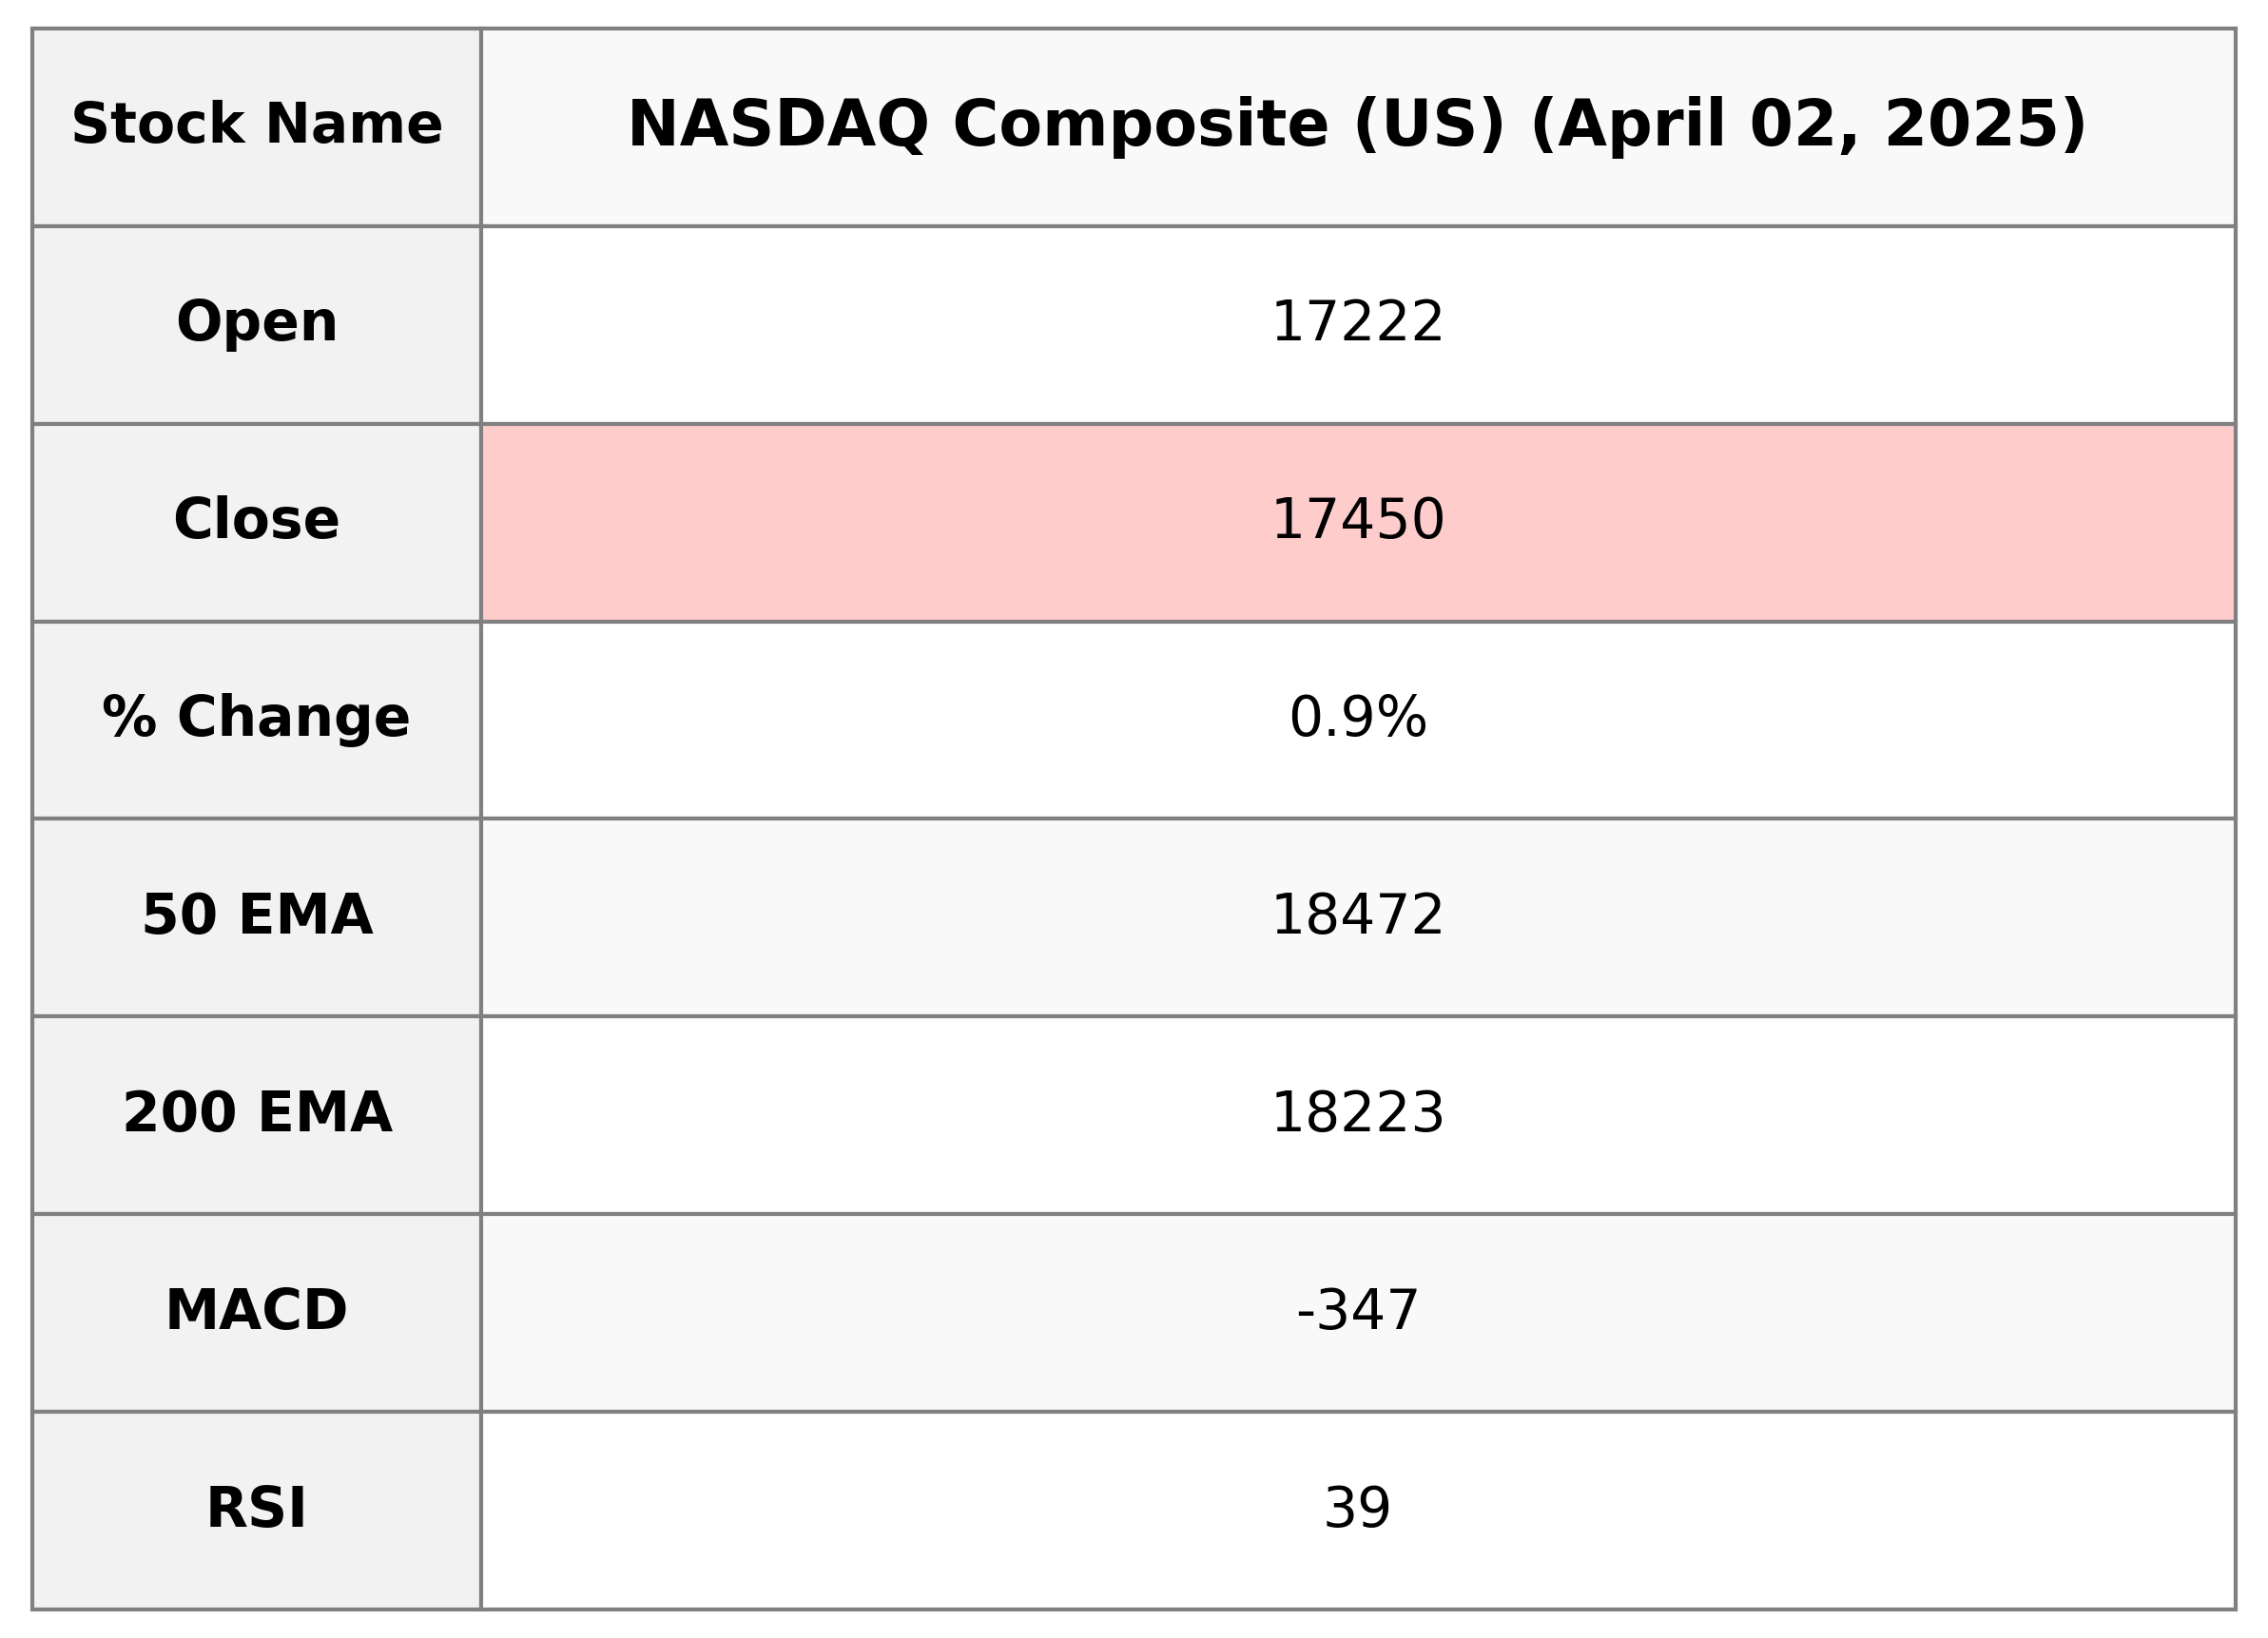
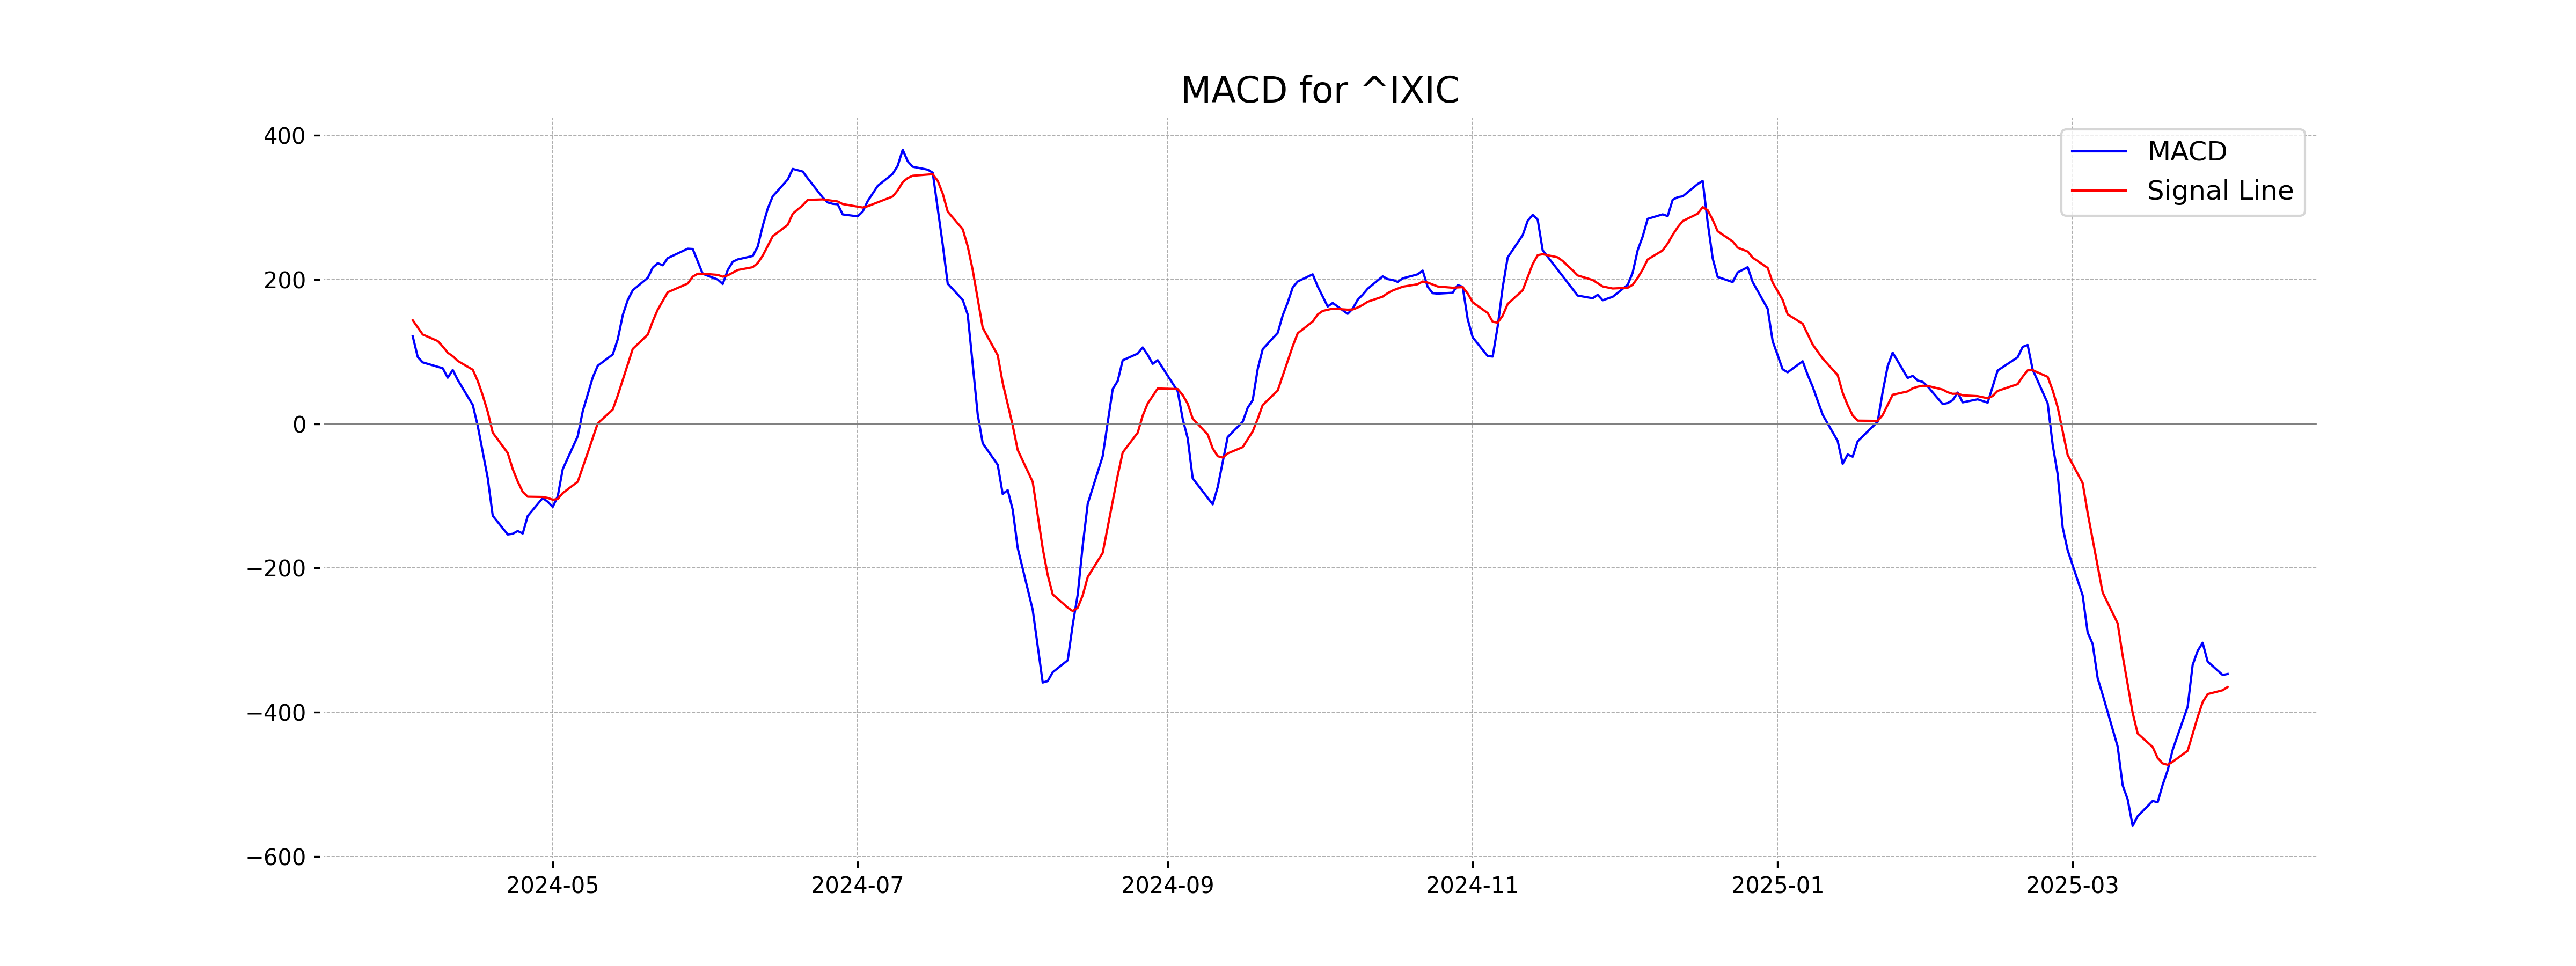
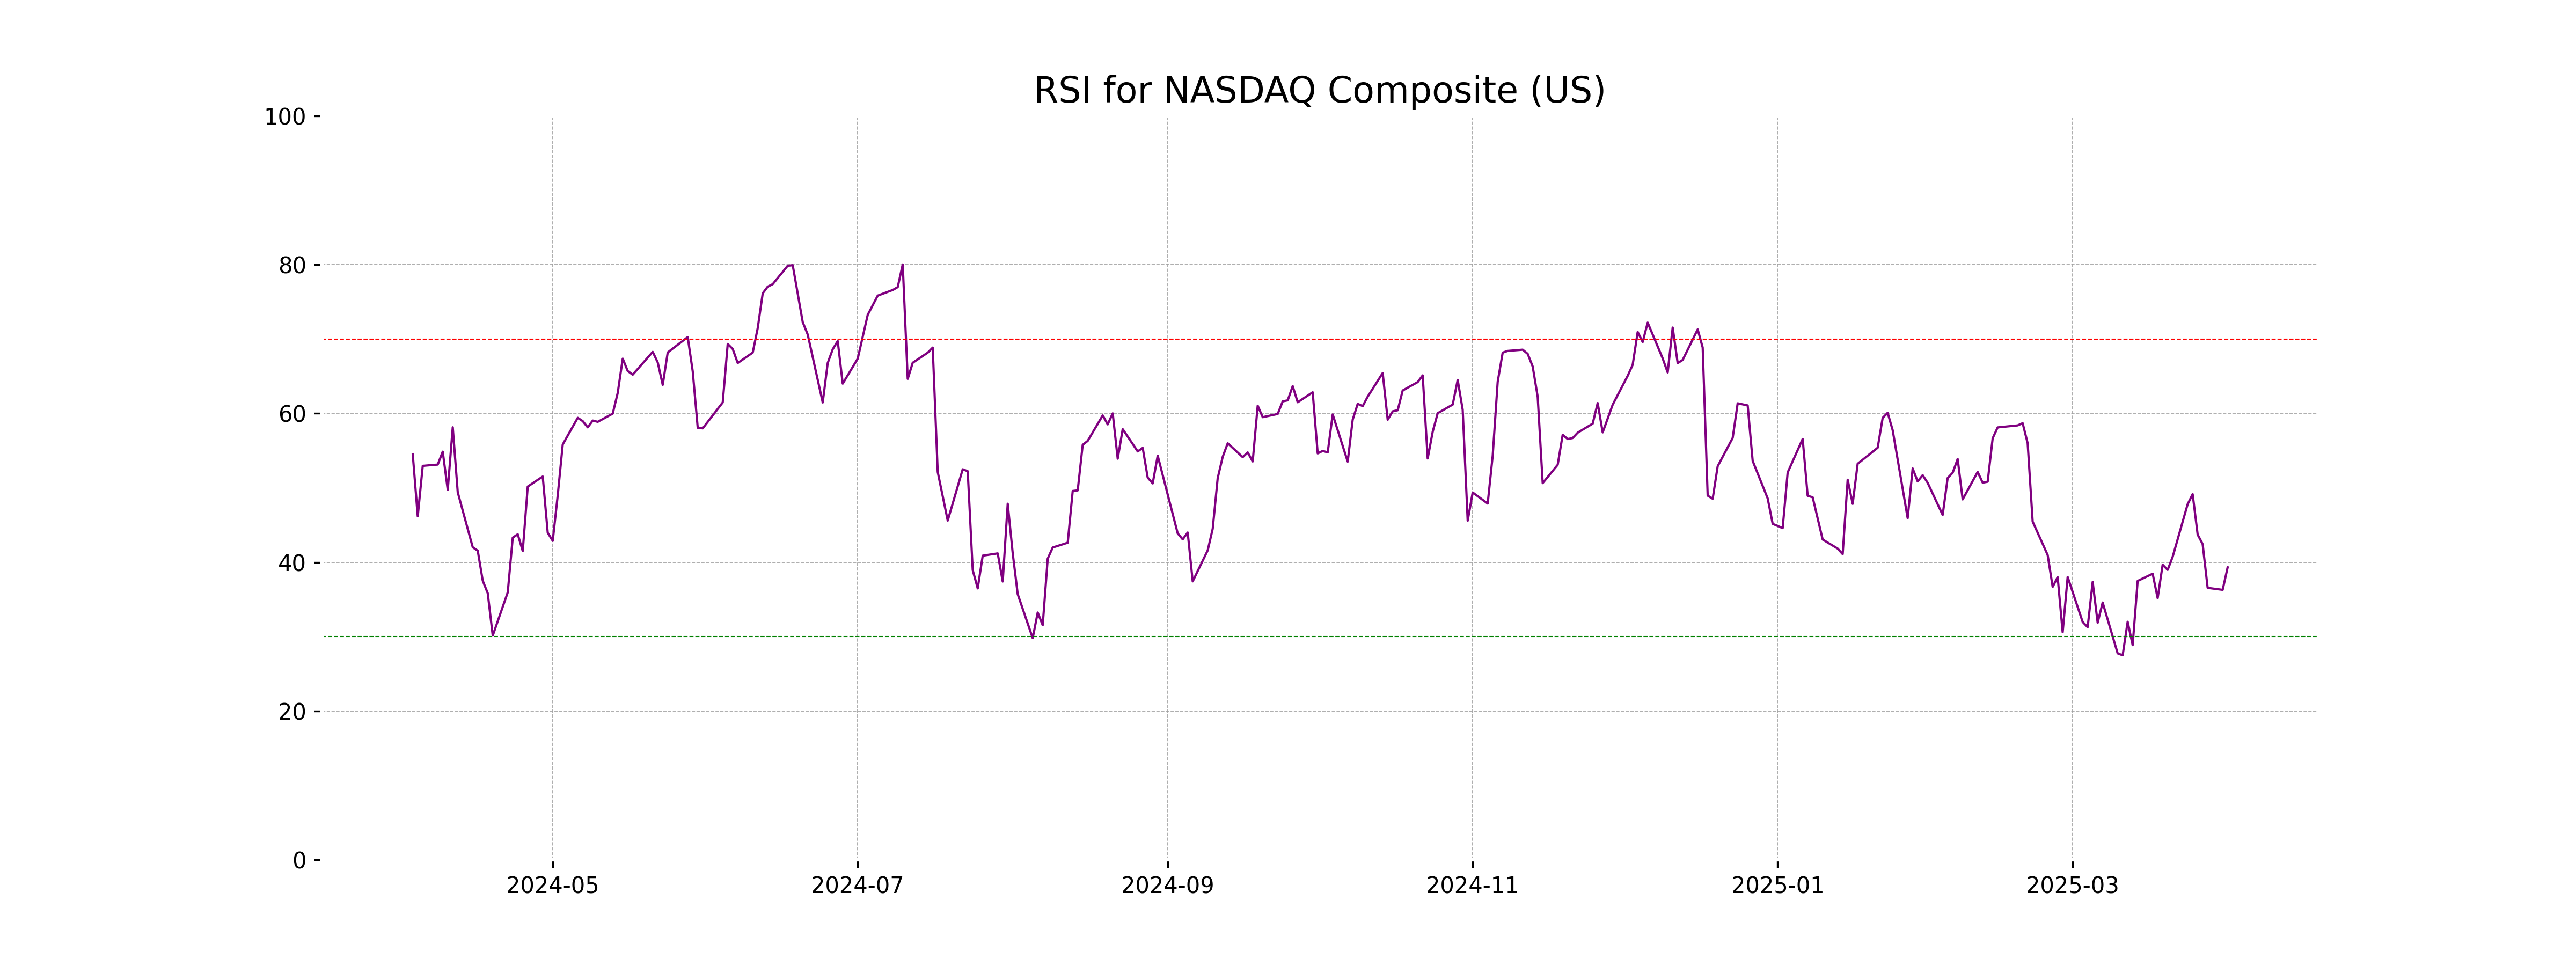
NASDAQ Composite (US) opened at 17,221.55 and closed at 17,449.89, marking a % change of 0.87% with a points change of 150.60. The index experienced a high of 17,506.59 and a low of 17,149.36, with a trading volume of approximately 7.76 billion. The 10, 20, 50, and 200-day EMAs are 17,664.15, 17,906.06, 18,471.72, and 18,223.25 respectively, while the RSI stands at 39.31, indicating a potential oversold condition. The MACD is -346.88 with a signal line of -364.94.
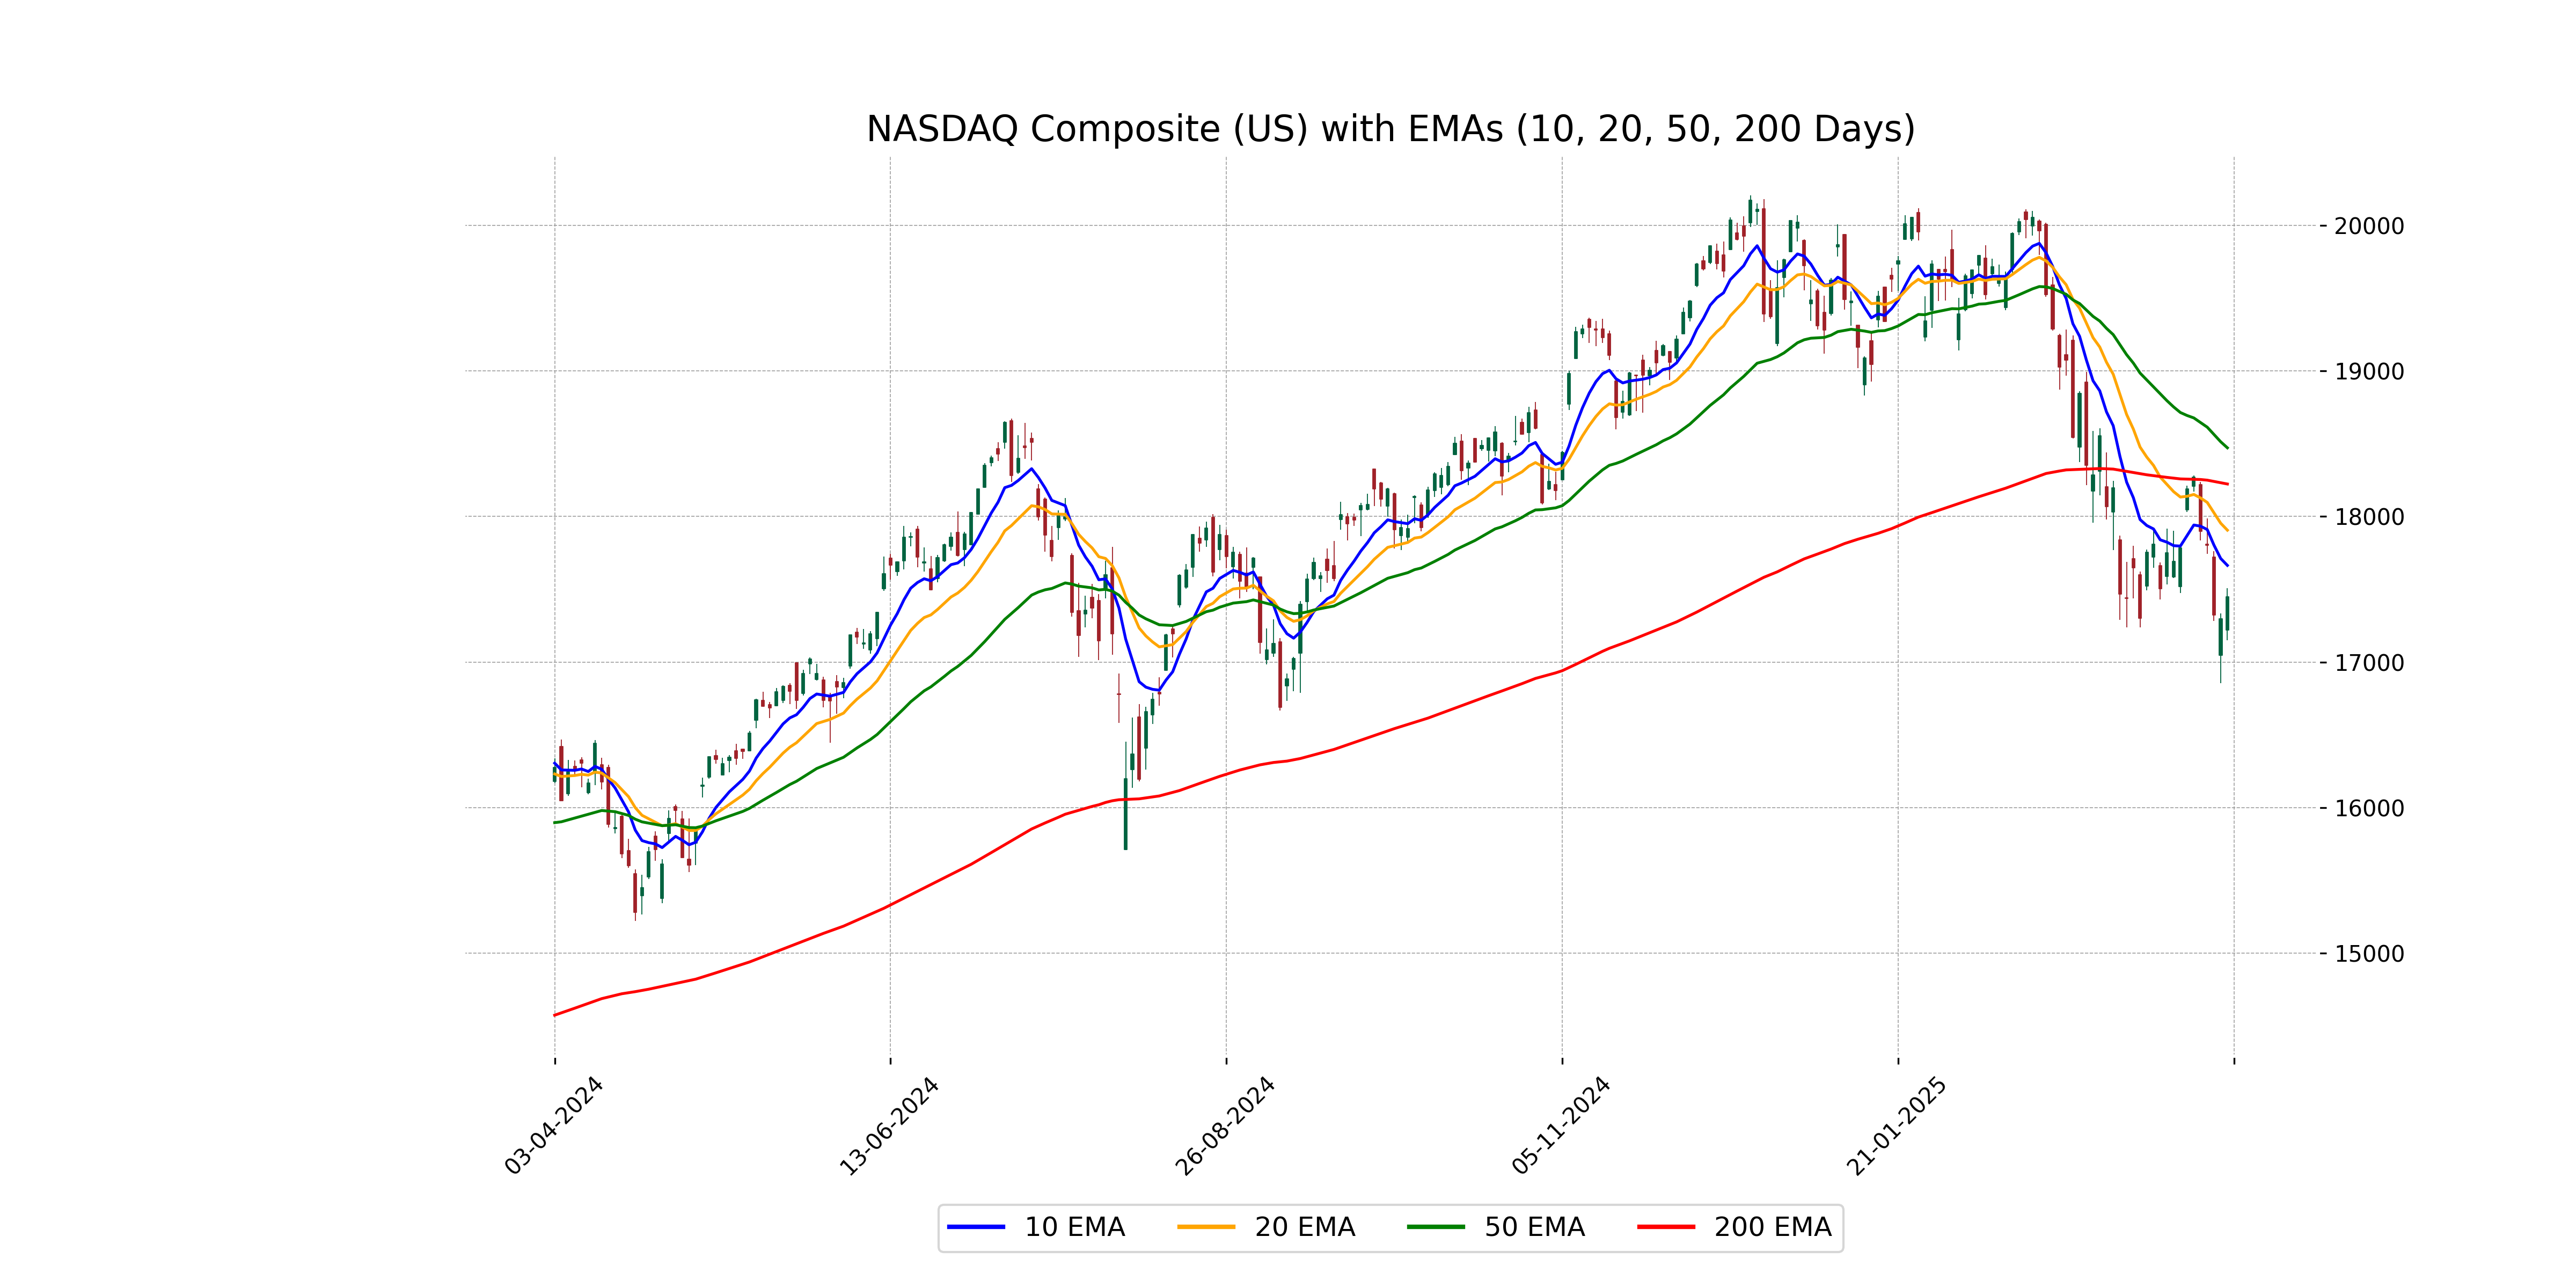
Relationship with Key Moving Averages
NASDAQ Composite opened below all its key moving averages (10, 20, 50, and 200-day EMAs) indicating a short-term bearish sentiment. The close was above the open but still below these moving averages, suggesting resistance at higher levels. The RSI under 40 also reinforces the bearish momentum.
Moving Averages Trend (MACD)
The MACD for NASDAQ Composite shows a value of -346.88, which is below the signal line of -364.94. This indicates a potential bullish crossover, suggesting that the momentum might be shifting towards a positive trend despite the current negative value.
RSI Analysis
The RSI (Relative Strength Index) for NASDAQ Composite is 39.31, indicating a moderately weak momentum as it is below the neutral 50 level. This suggests that the index might be approaching oversold conditions, which could potentially present a buying opportunity if other indicators confirm.
Analysis for Nikkei 225 (Japan) - April 02, 2025
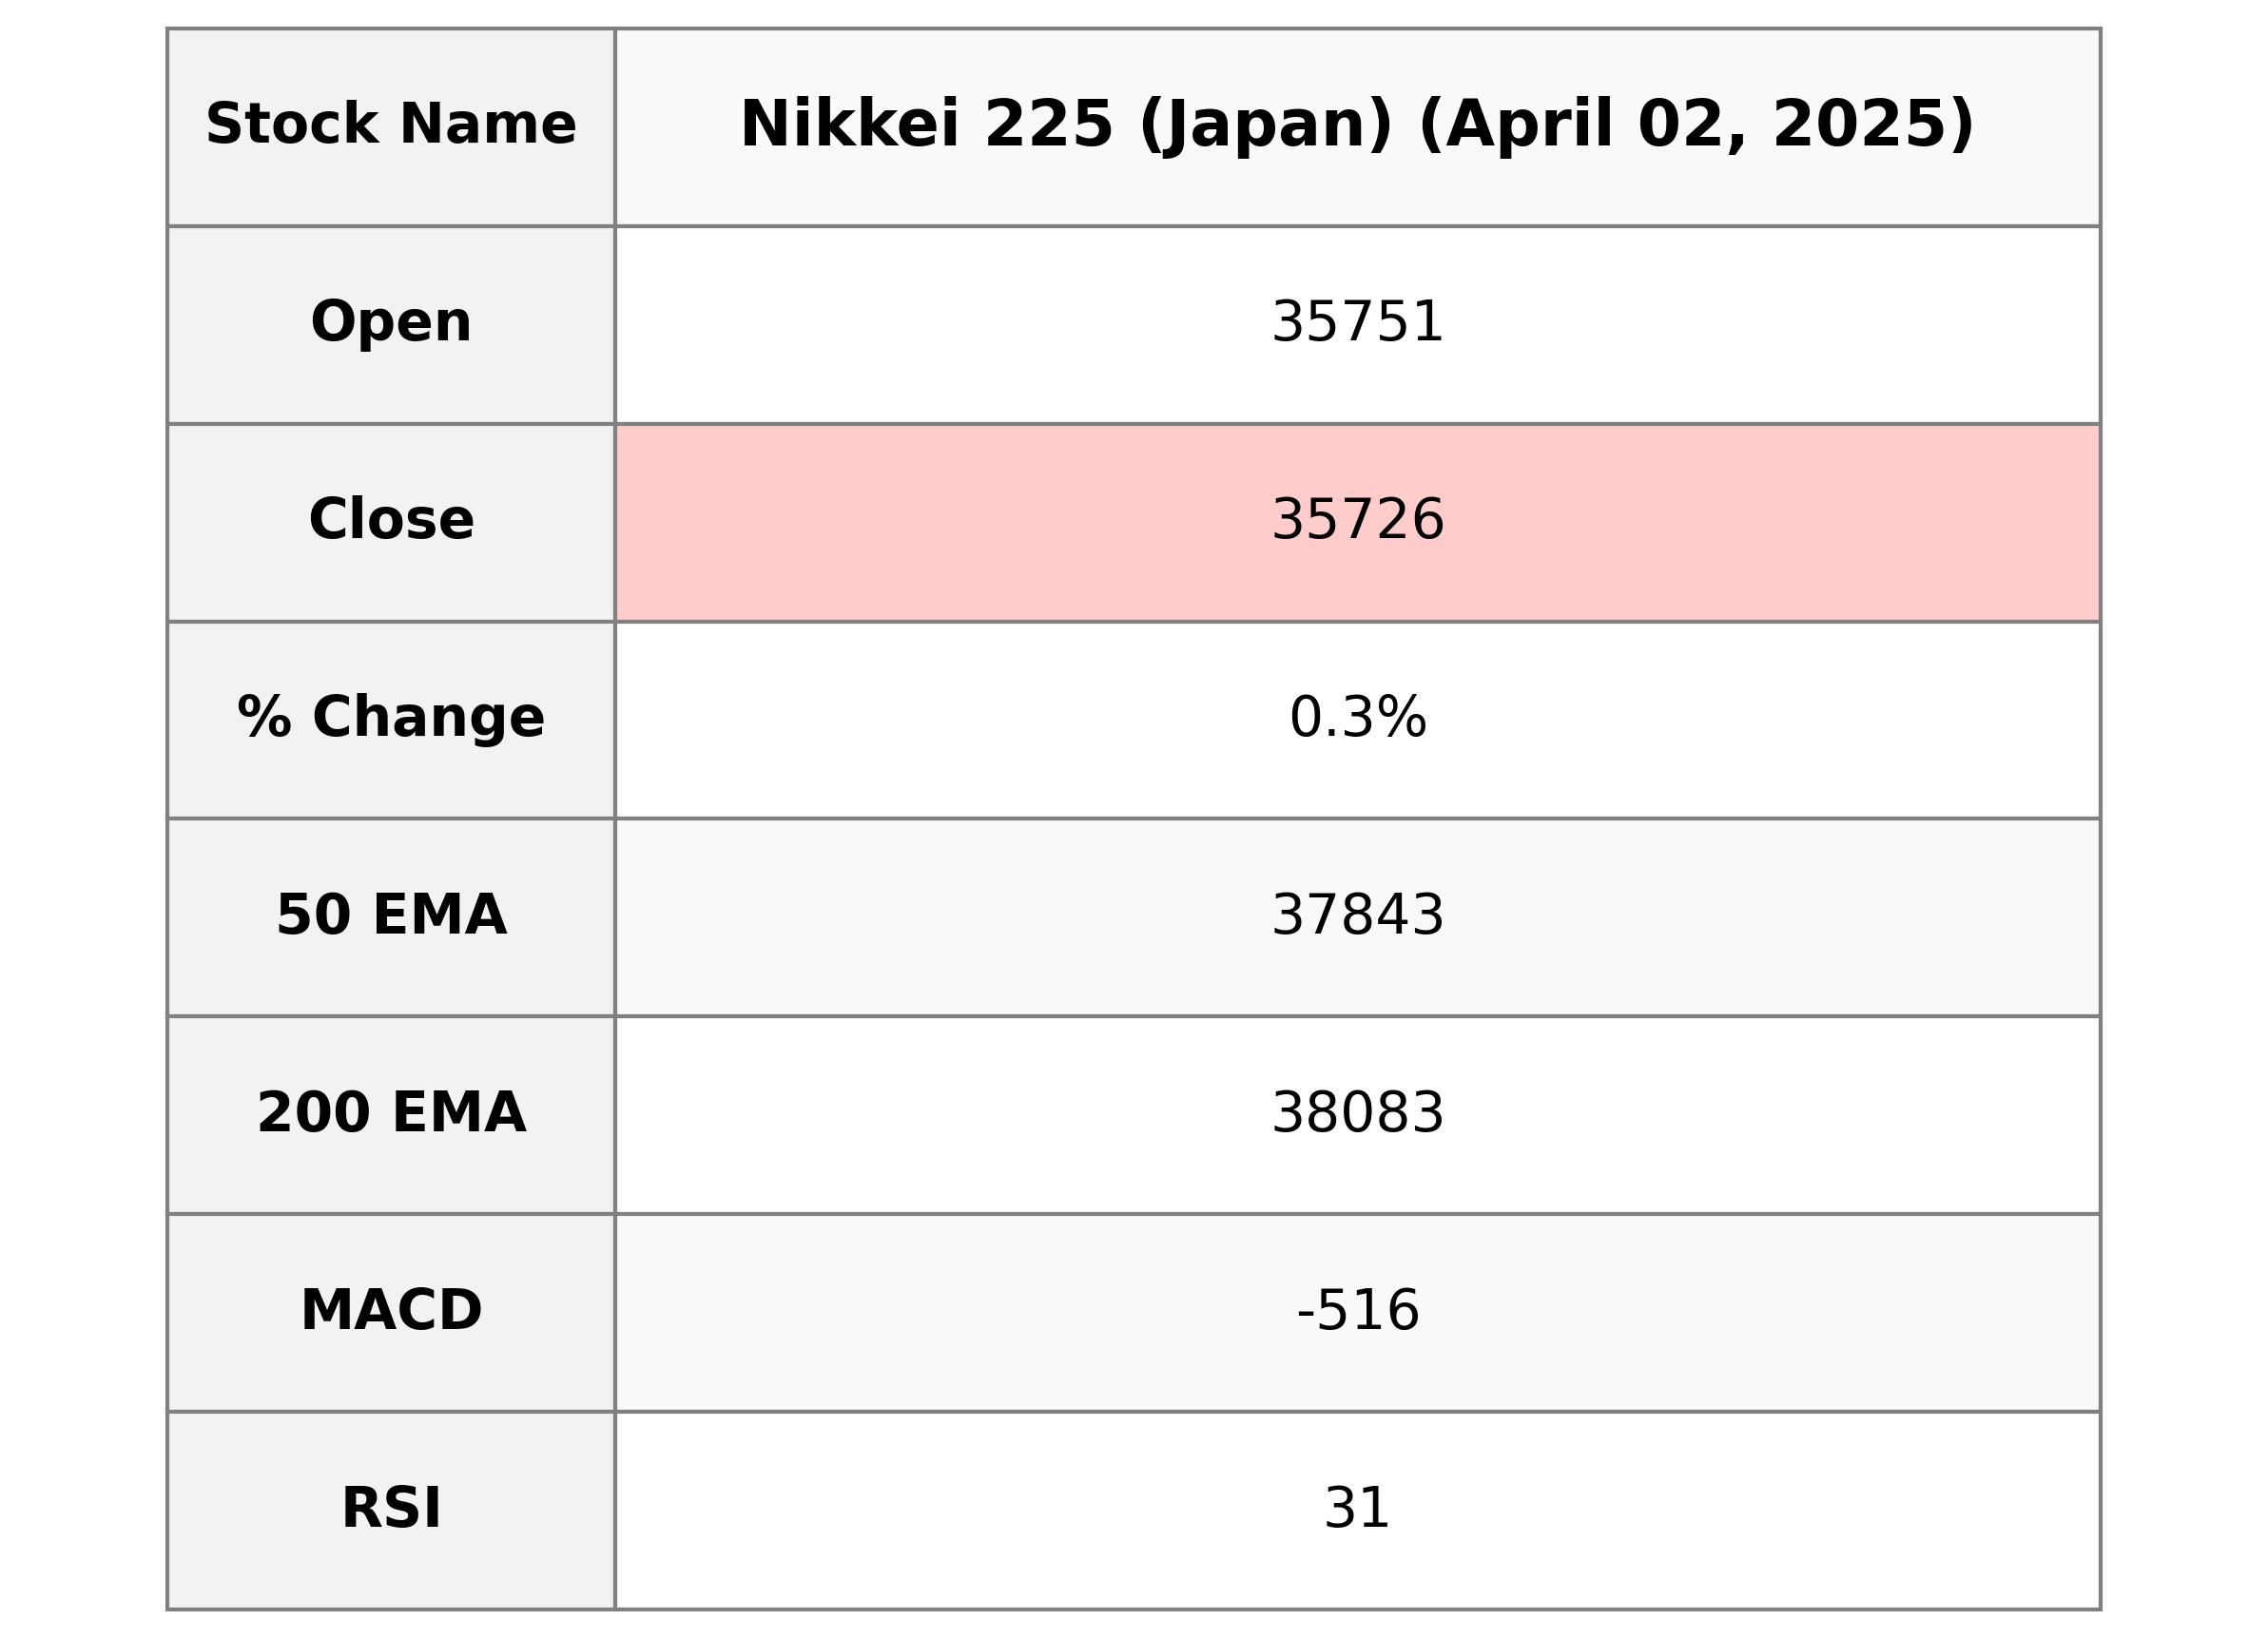
Nikkei 225 (Japan) opened at 35,751.02, closed slightly lower at 35,725.87, with a 0.28% increase from the previous close of 35,624.48. Despite a daily high of 35,778.90, the index experienced fluctuations with a noticeable low of 35,426.33, suggesting moderate volatility. The RSI indicates a relatively oversold condition, while the MACD shows a bearish trend.
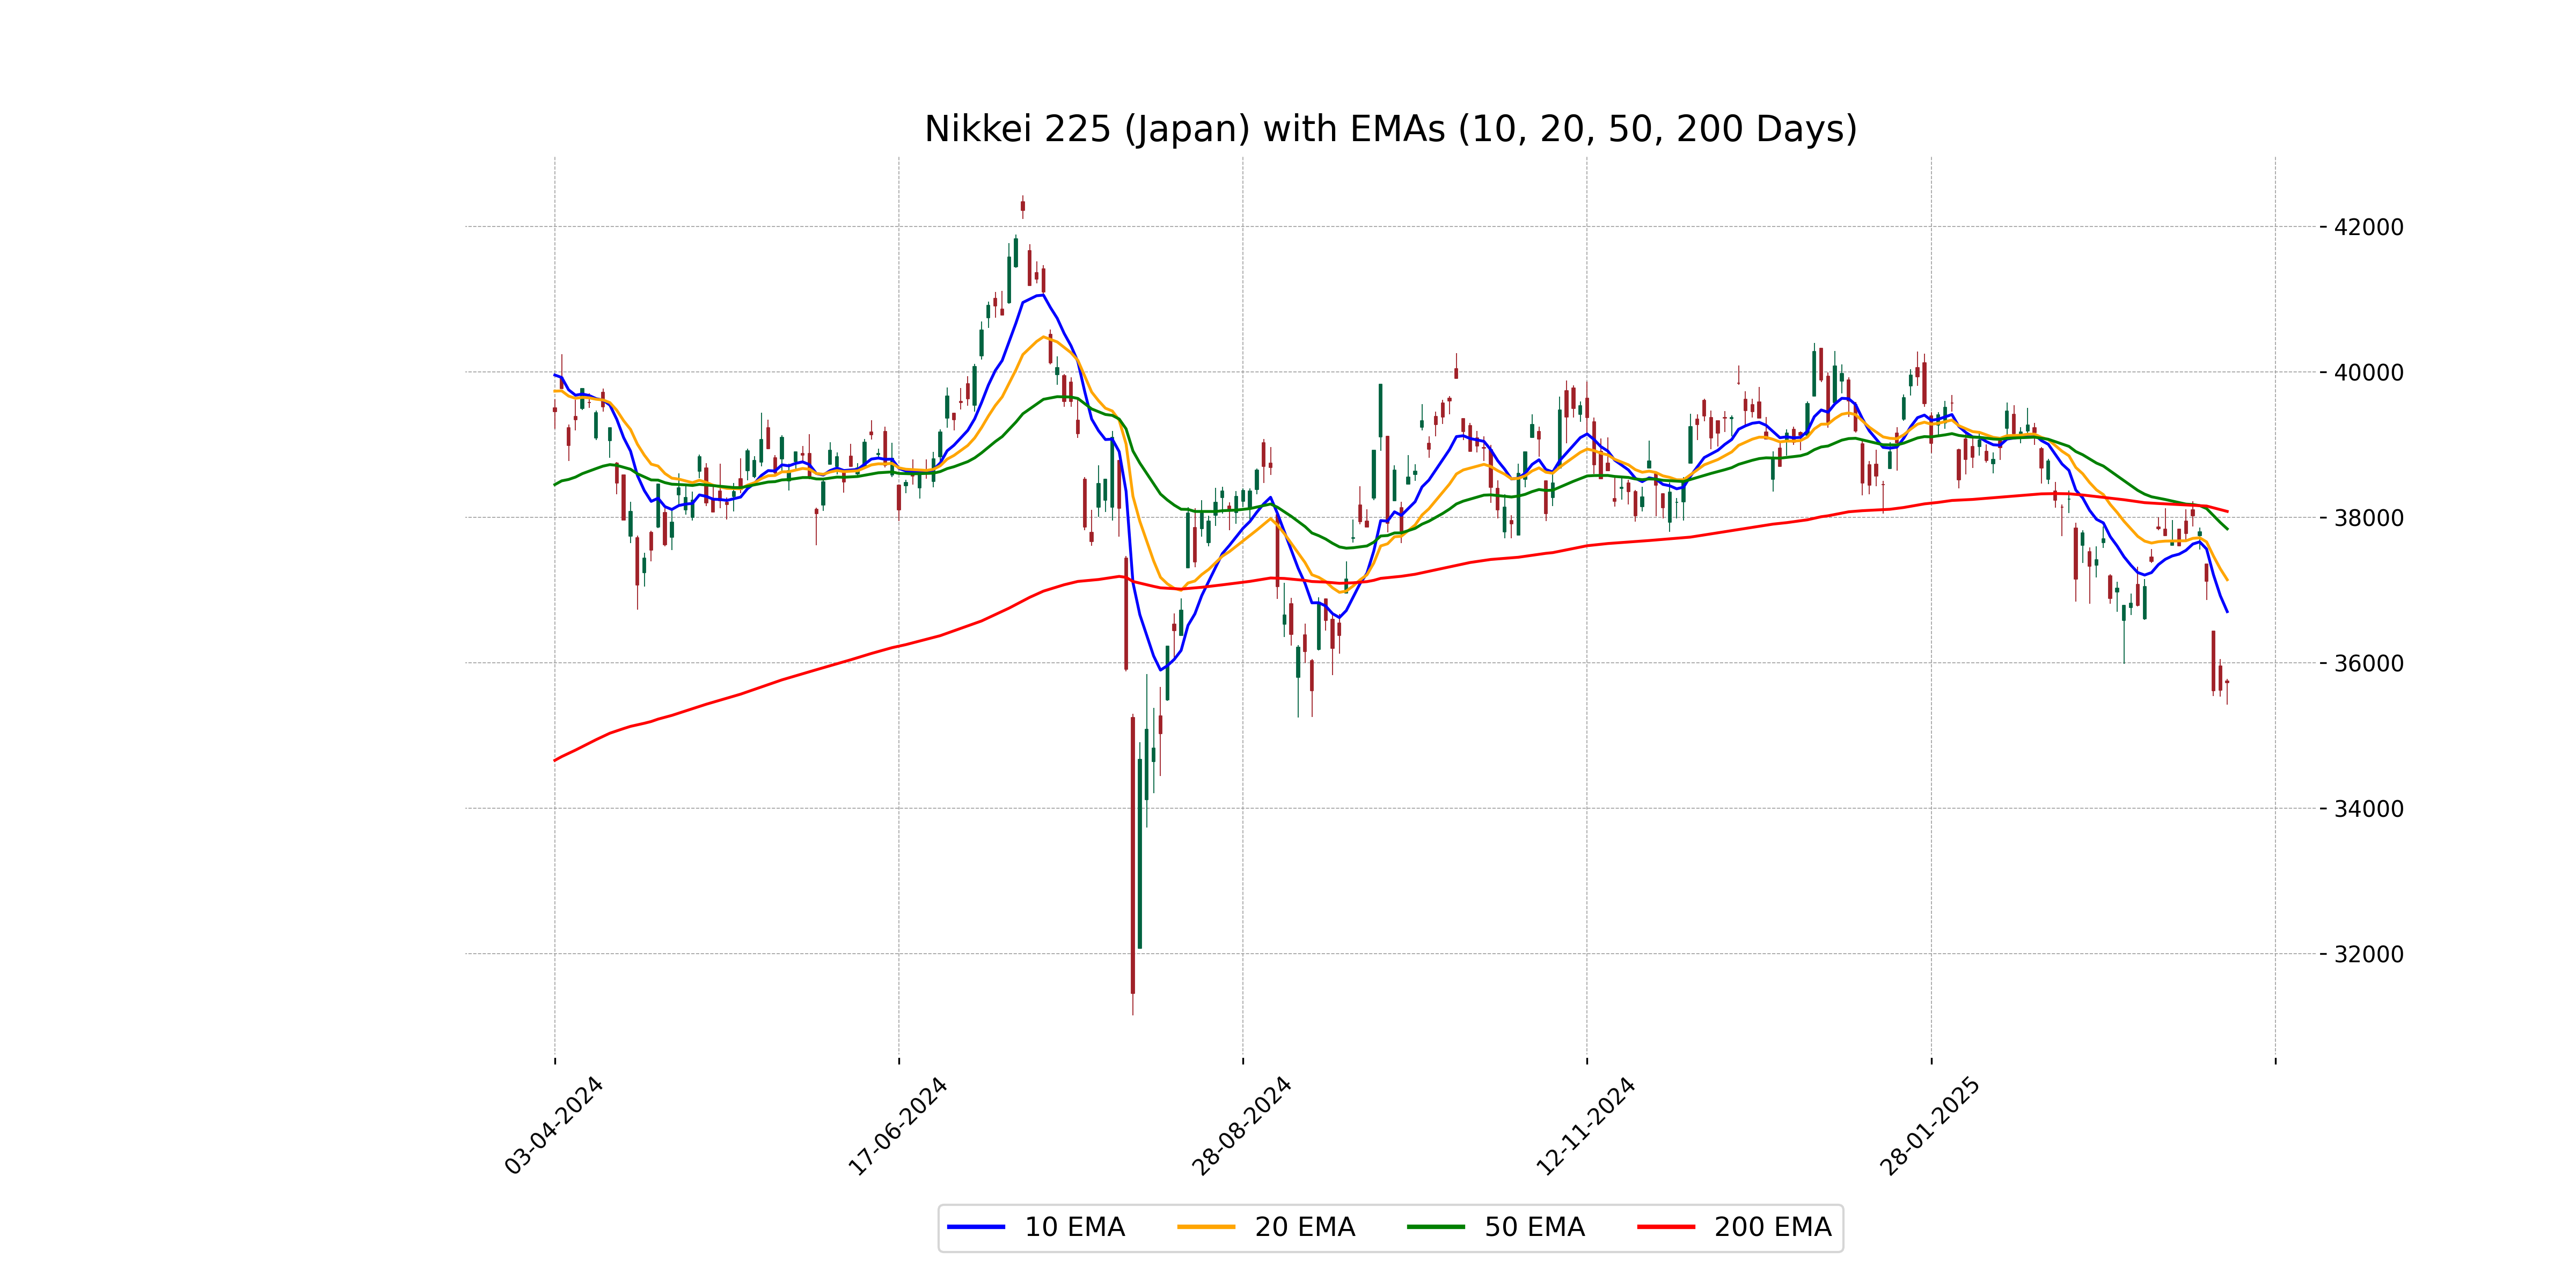
Relationship with Key Moving Averages
The closing price of Nikkei 225 at 35,725.87 is below its key moving averages, specifically the 50-day EMA at 37,843.41 and the 200-day EMA at 38,083.33. This indicates a bearish trend as the price is also lower than the shorter-term 10-day EMA at 36,705.35 and the 20-day EMA at 37,144.00.
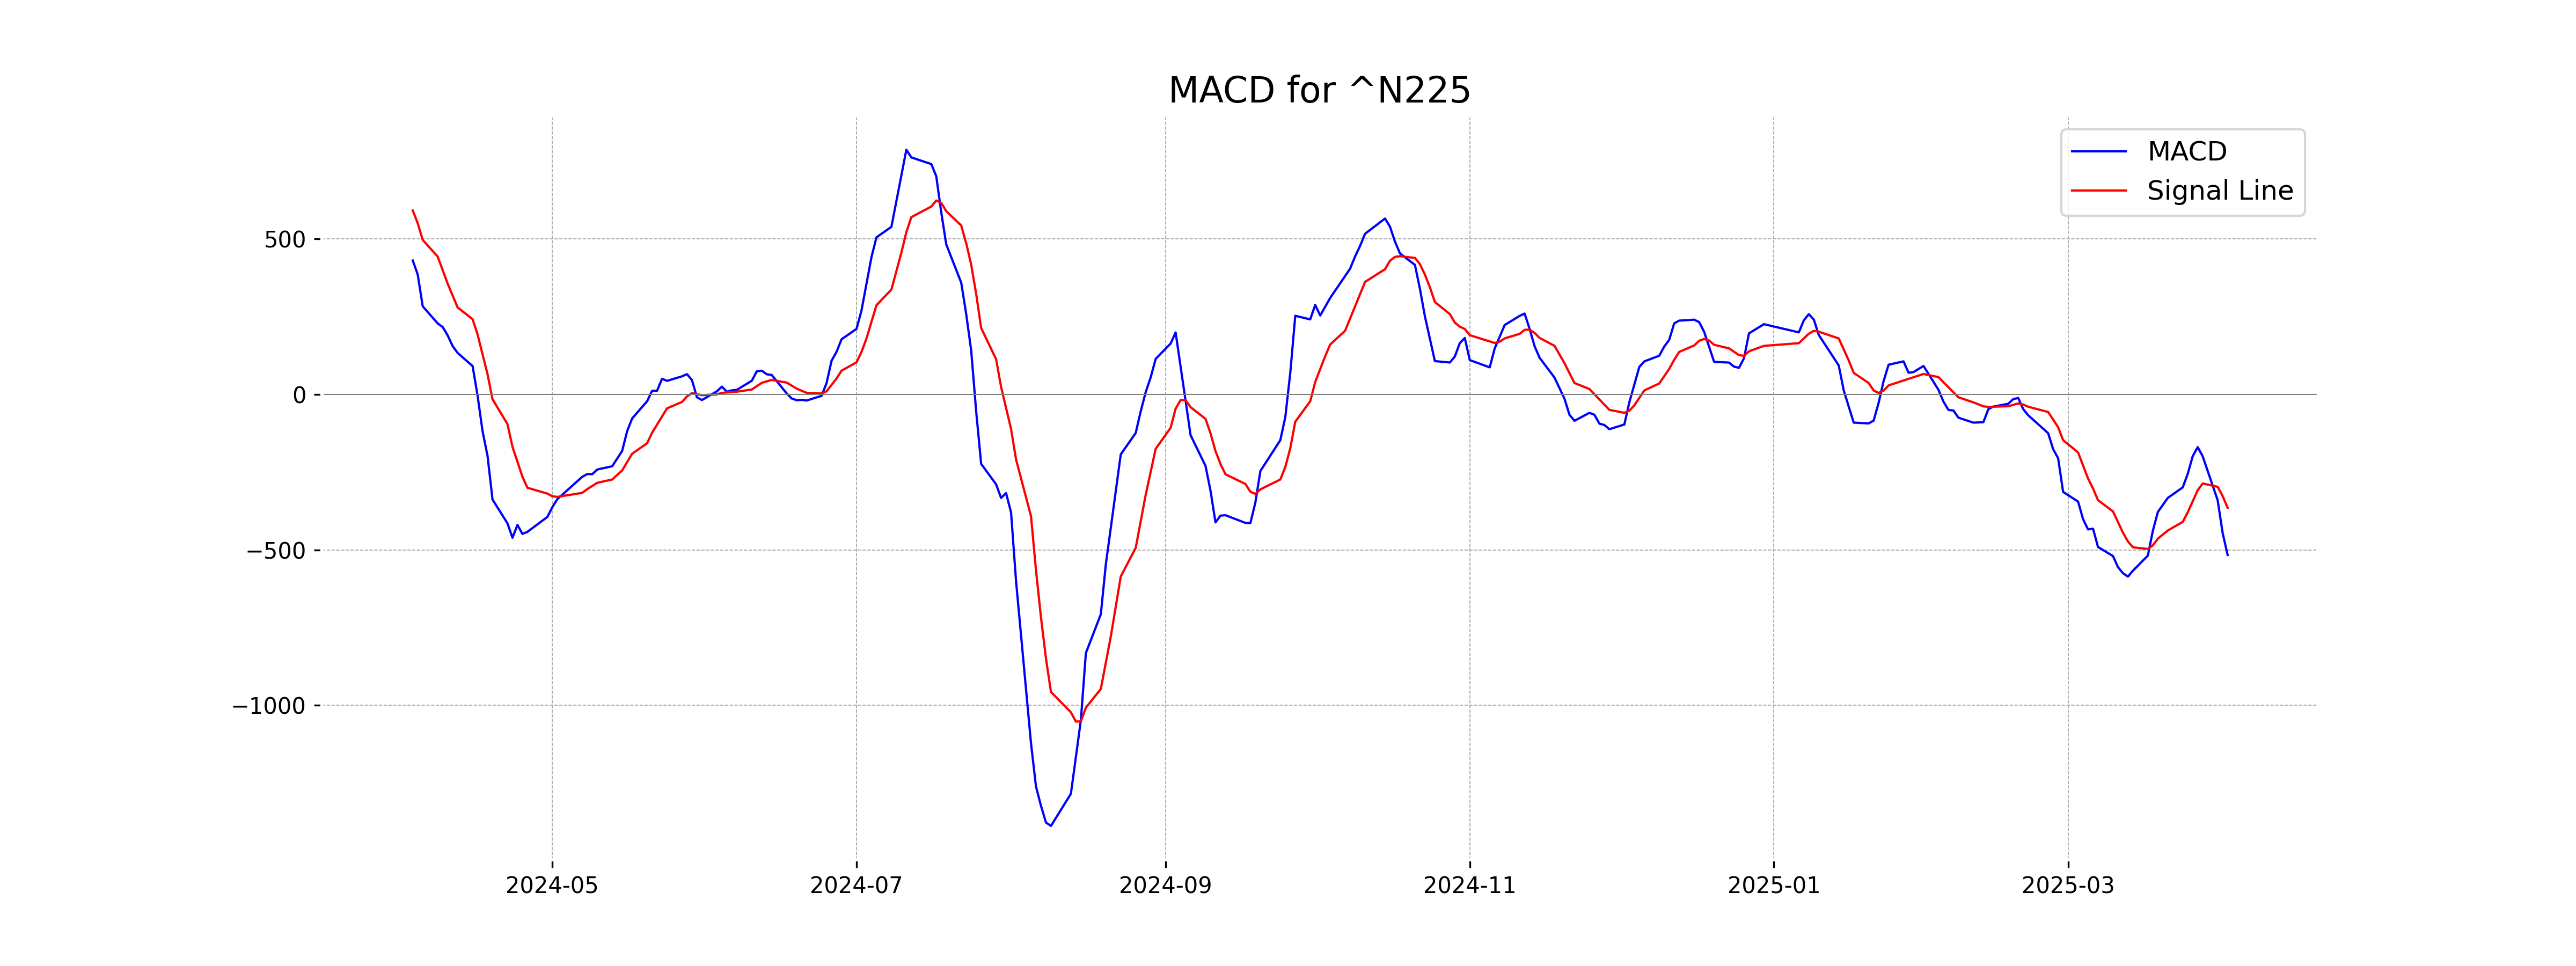
Moving Averages Trend (MACD)
Nikkei 225's MACD value is -516.42, and with the MACD Signal at -365.04, it indicates a bearish trend as it is below the signal line. The current RSI of 30.73 shows that the index might be approaching oversold conditions, suggesting potential momentum for a reversal.
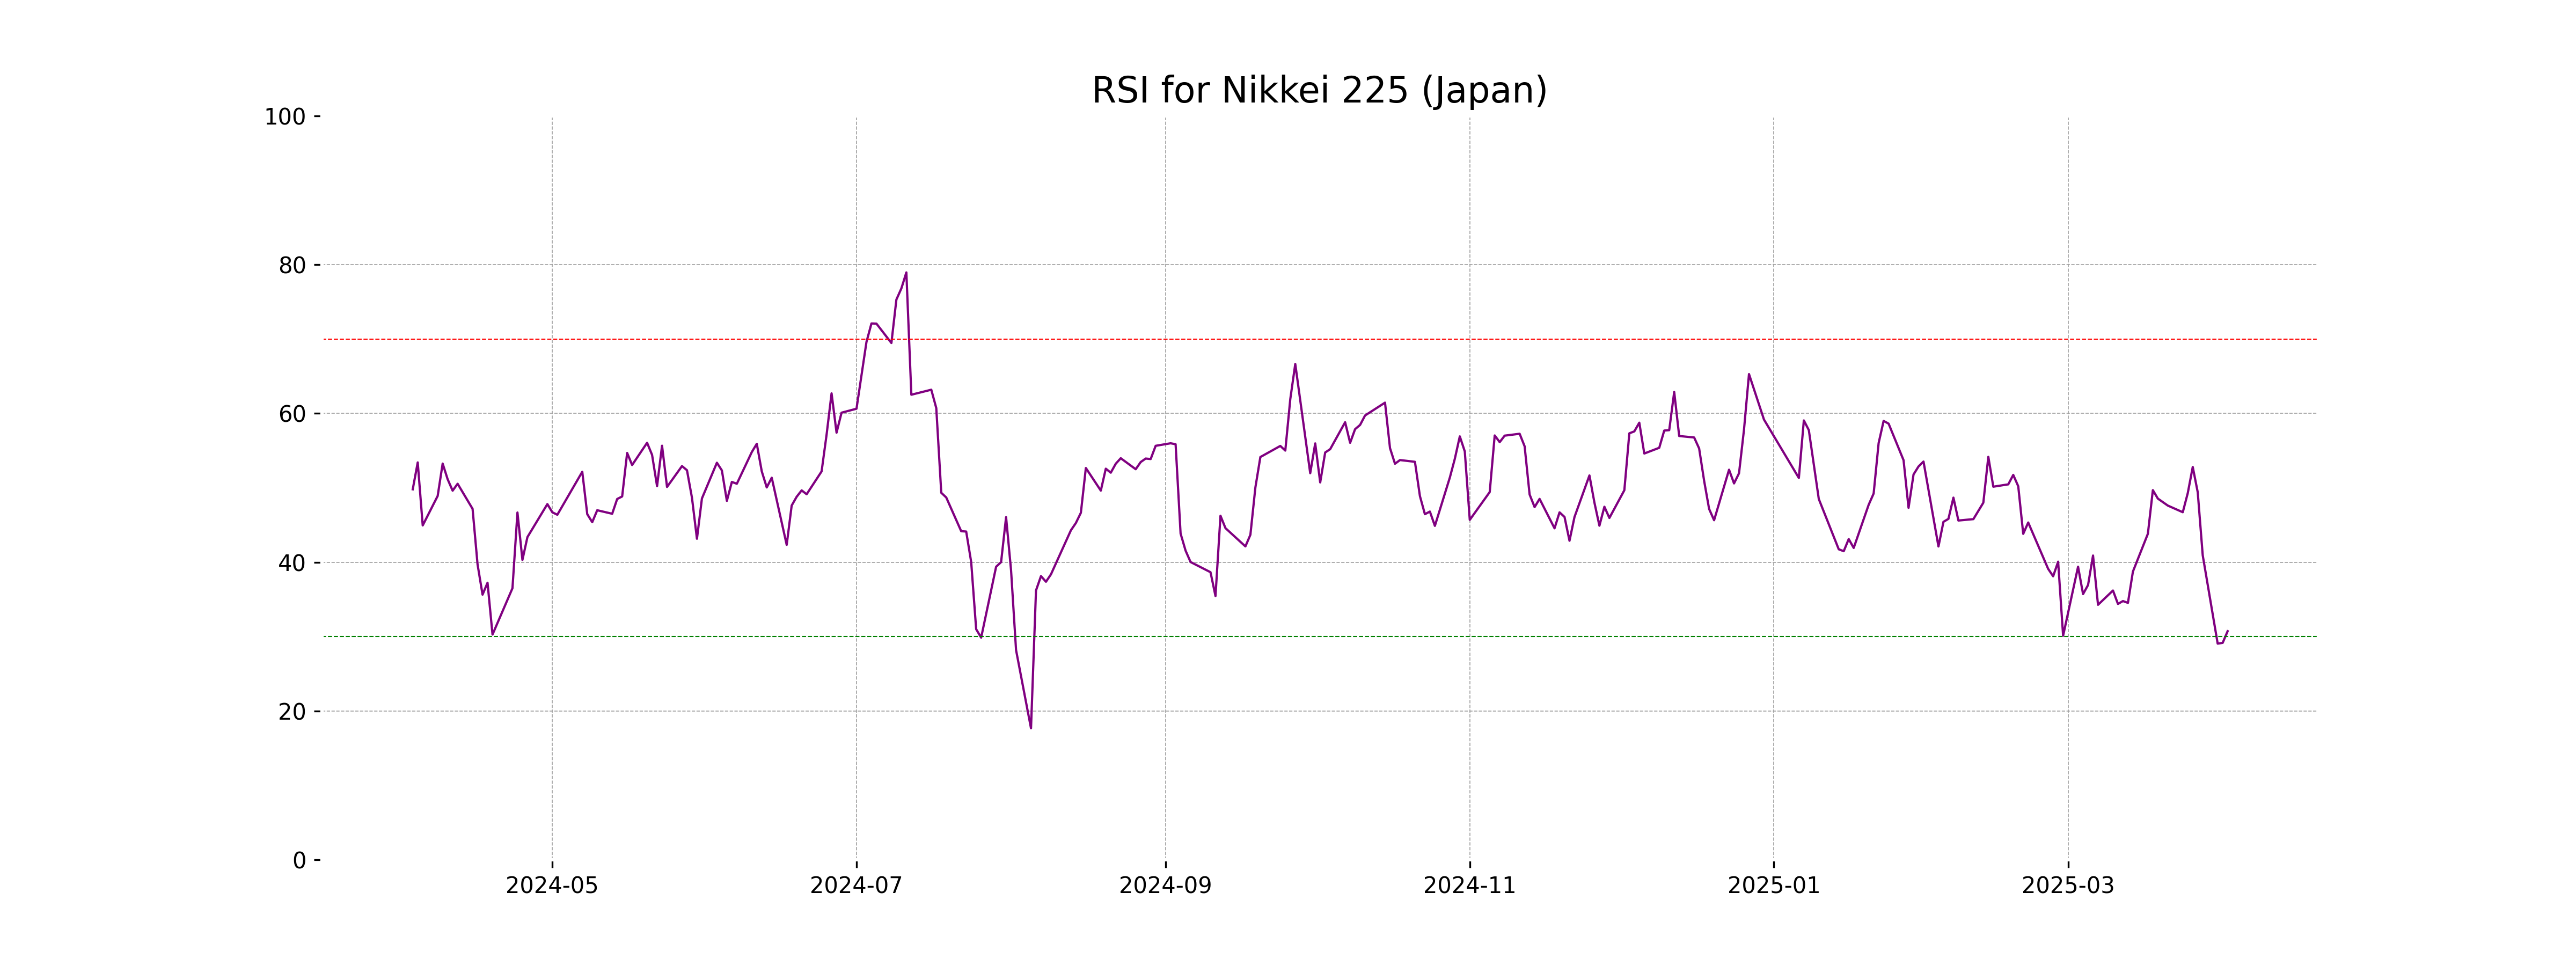
RSI Analysis
Based on the given stock data for Nikkei 225 (Japan), the RSI (Relative Strength Index) is 30.73. An RSI below 30 typically indicates that the stock is in the oversold territory, suggesting that it might be undervalued and could potentially experience a price reversal or upward movement in the near future.
Analysis for Nifty Bank - April 02, 2025
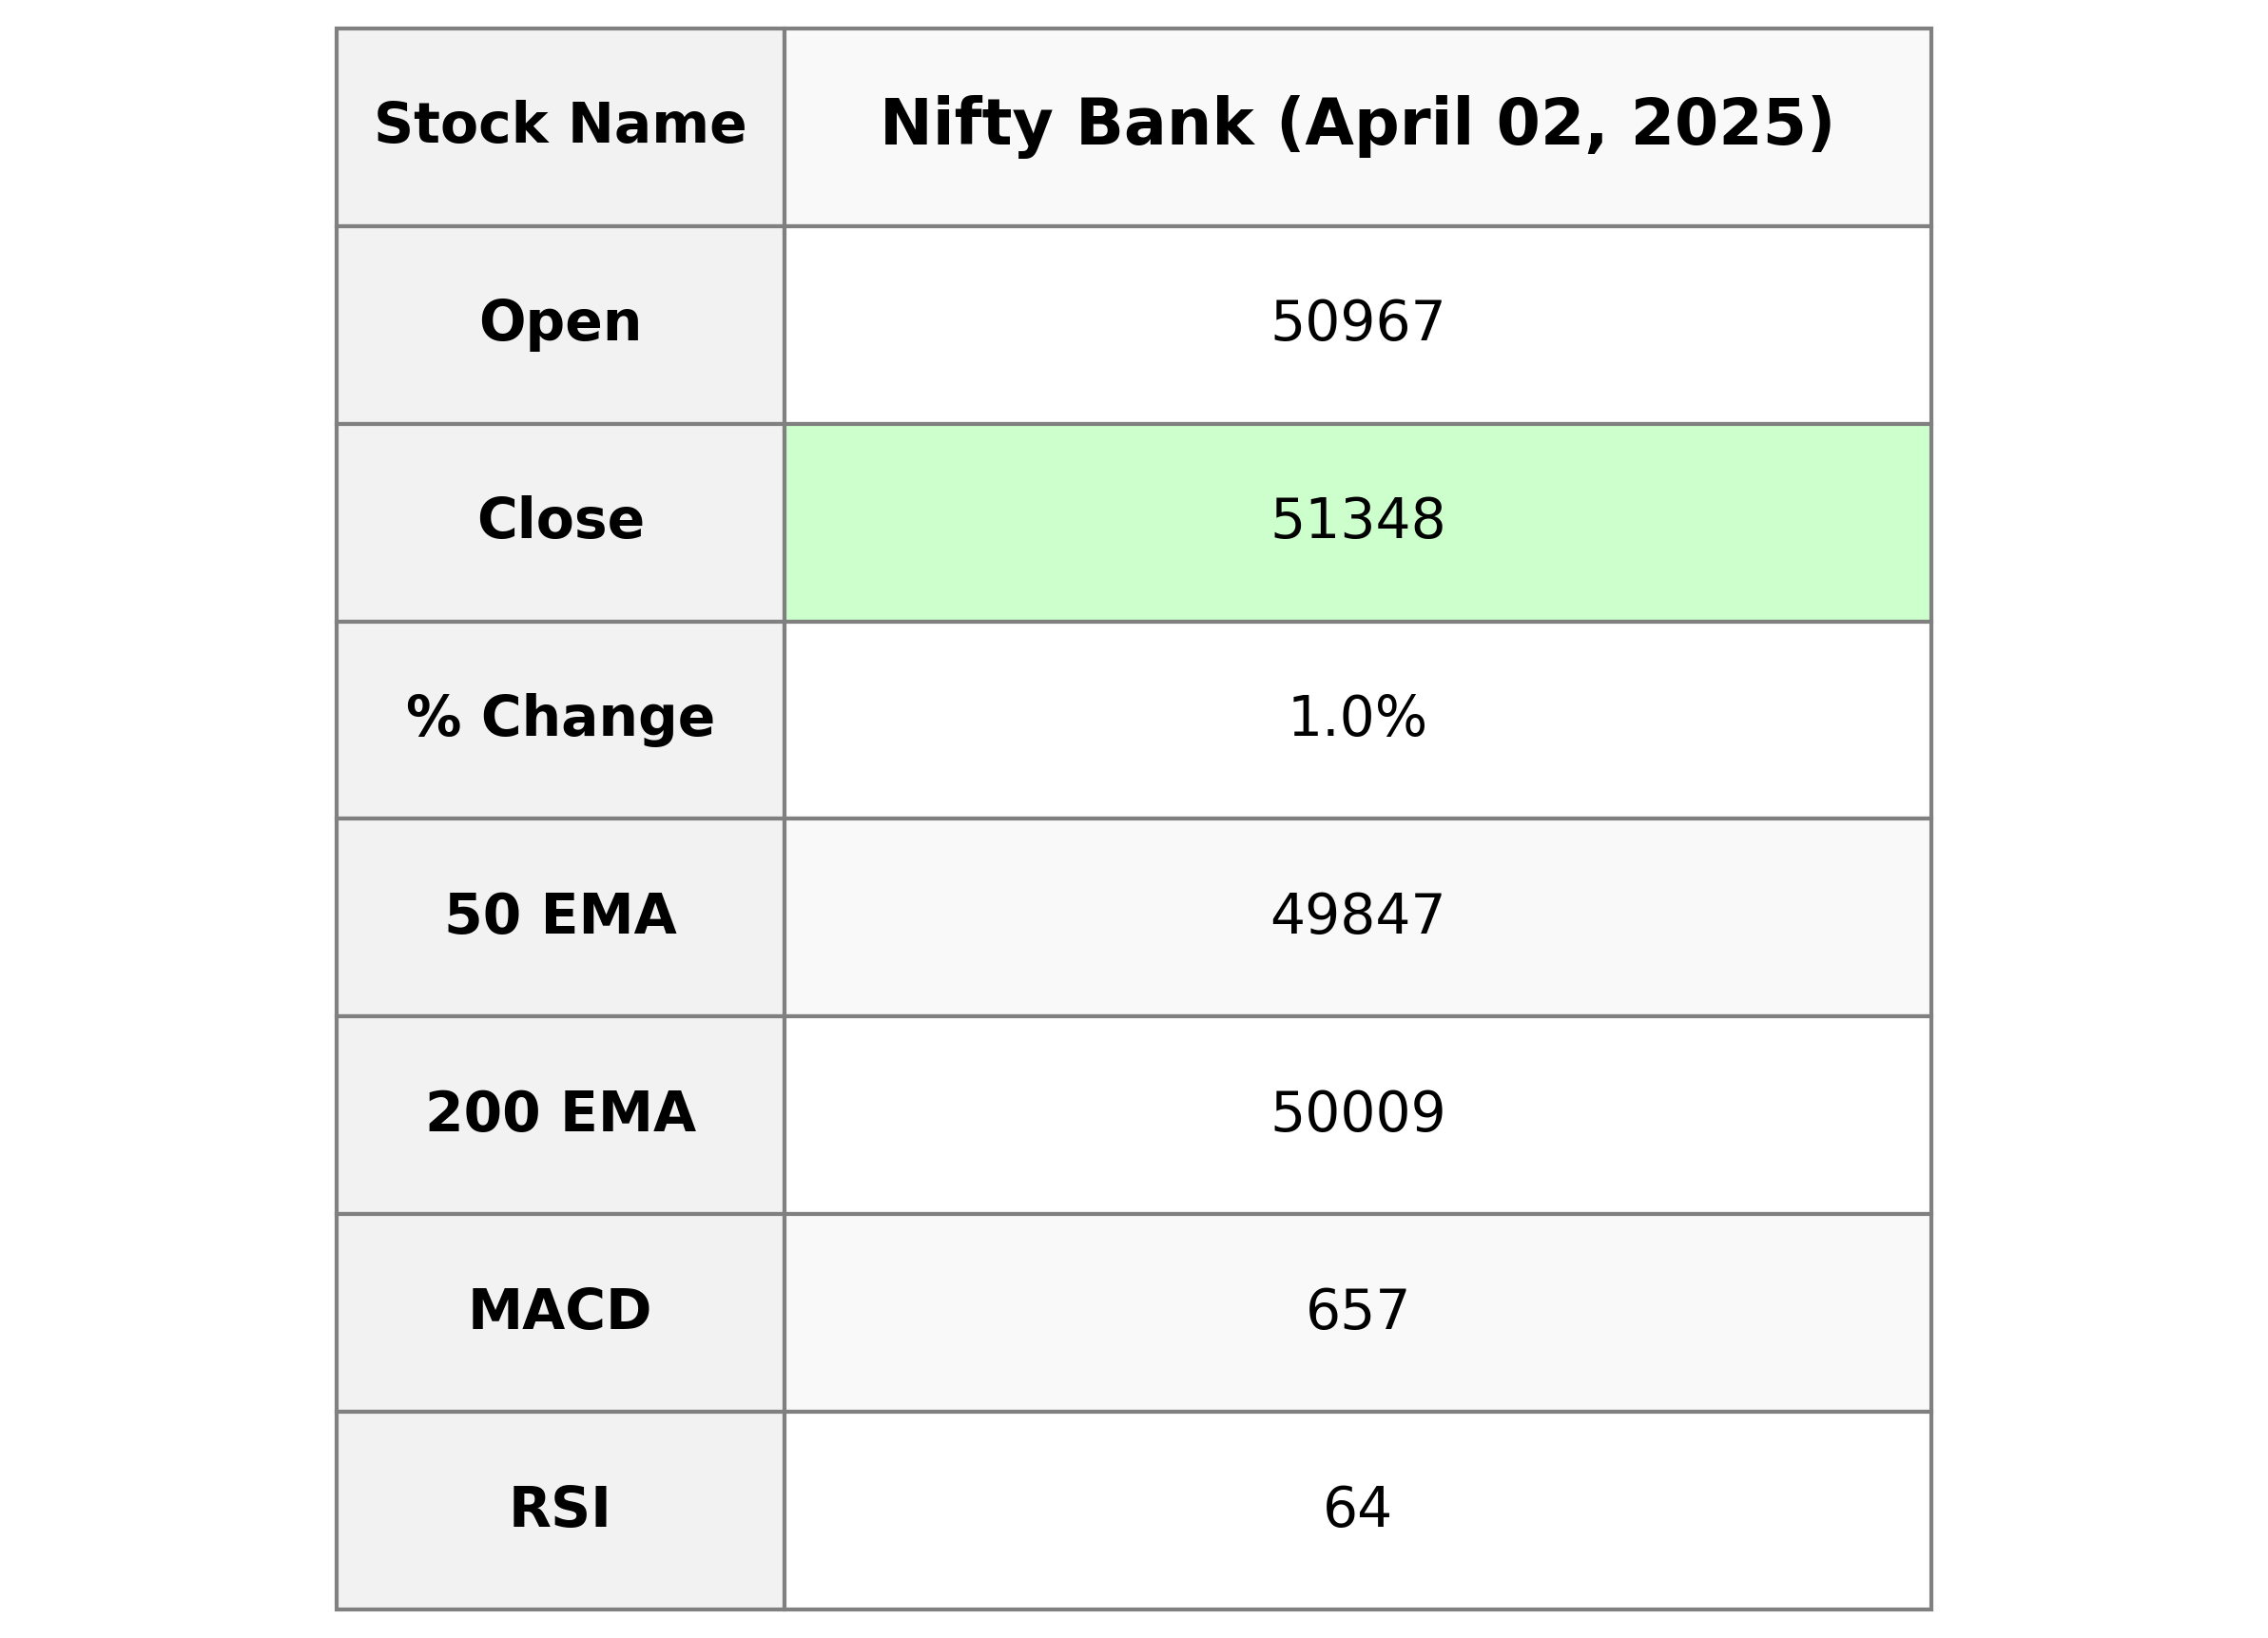
Performance Summary of Nifty Bank: On the trading day, Nifty Bank opened at 50,966.90 and closed at 51,348.05, representing a percentage change of 1.02% and a points gain of 520.55. The key moving averages show the 50 EMA at 49,847.23 and the 200 EMA at 50,009.03, indicating a bullish momentum supported by an RSI of 63.75 and an MACD of 656.79.
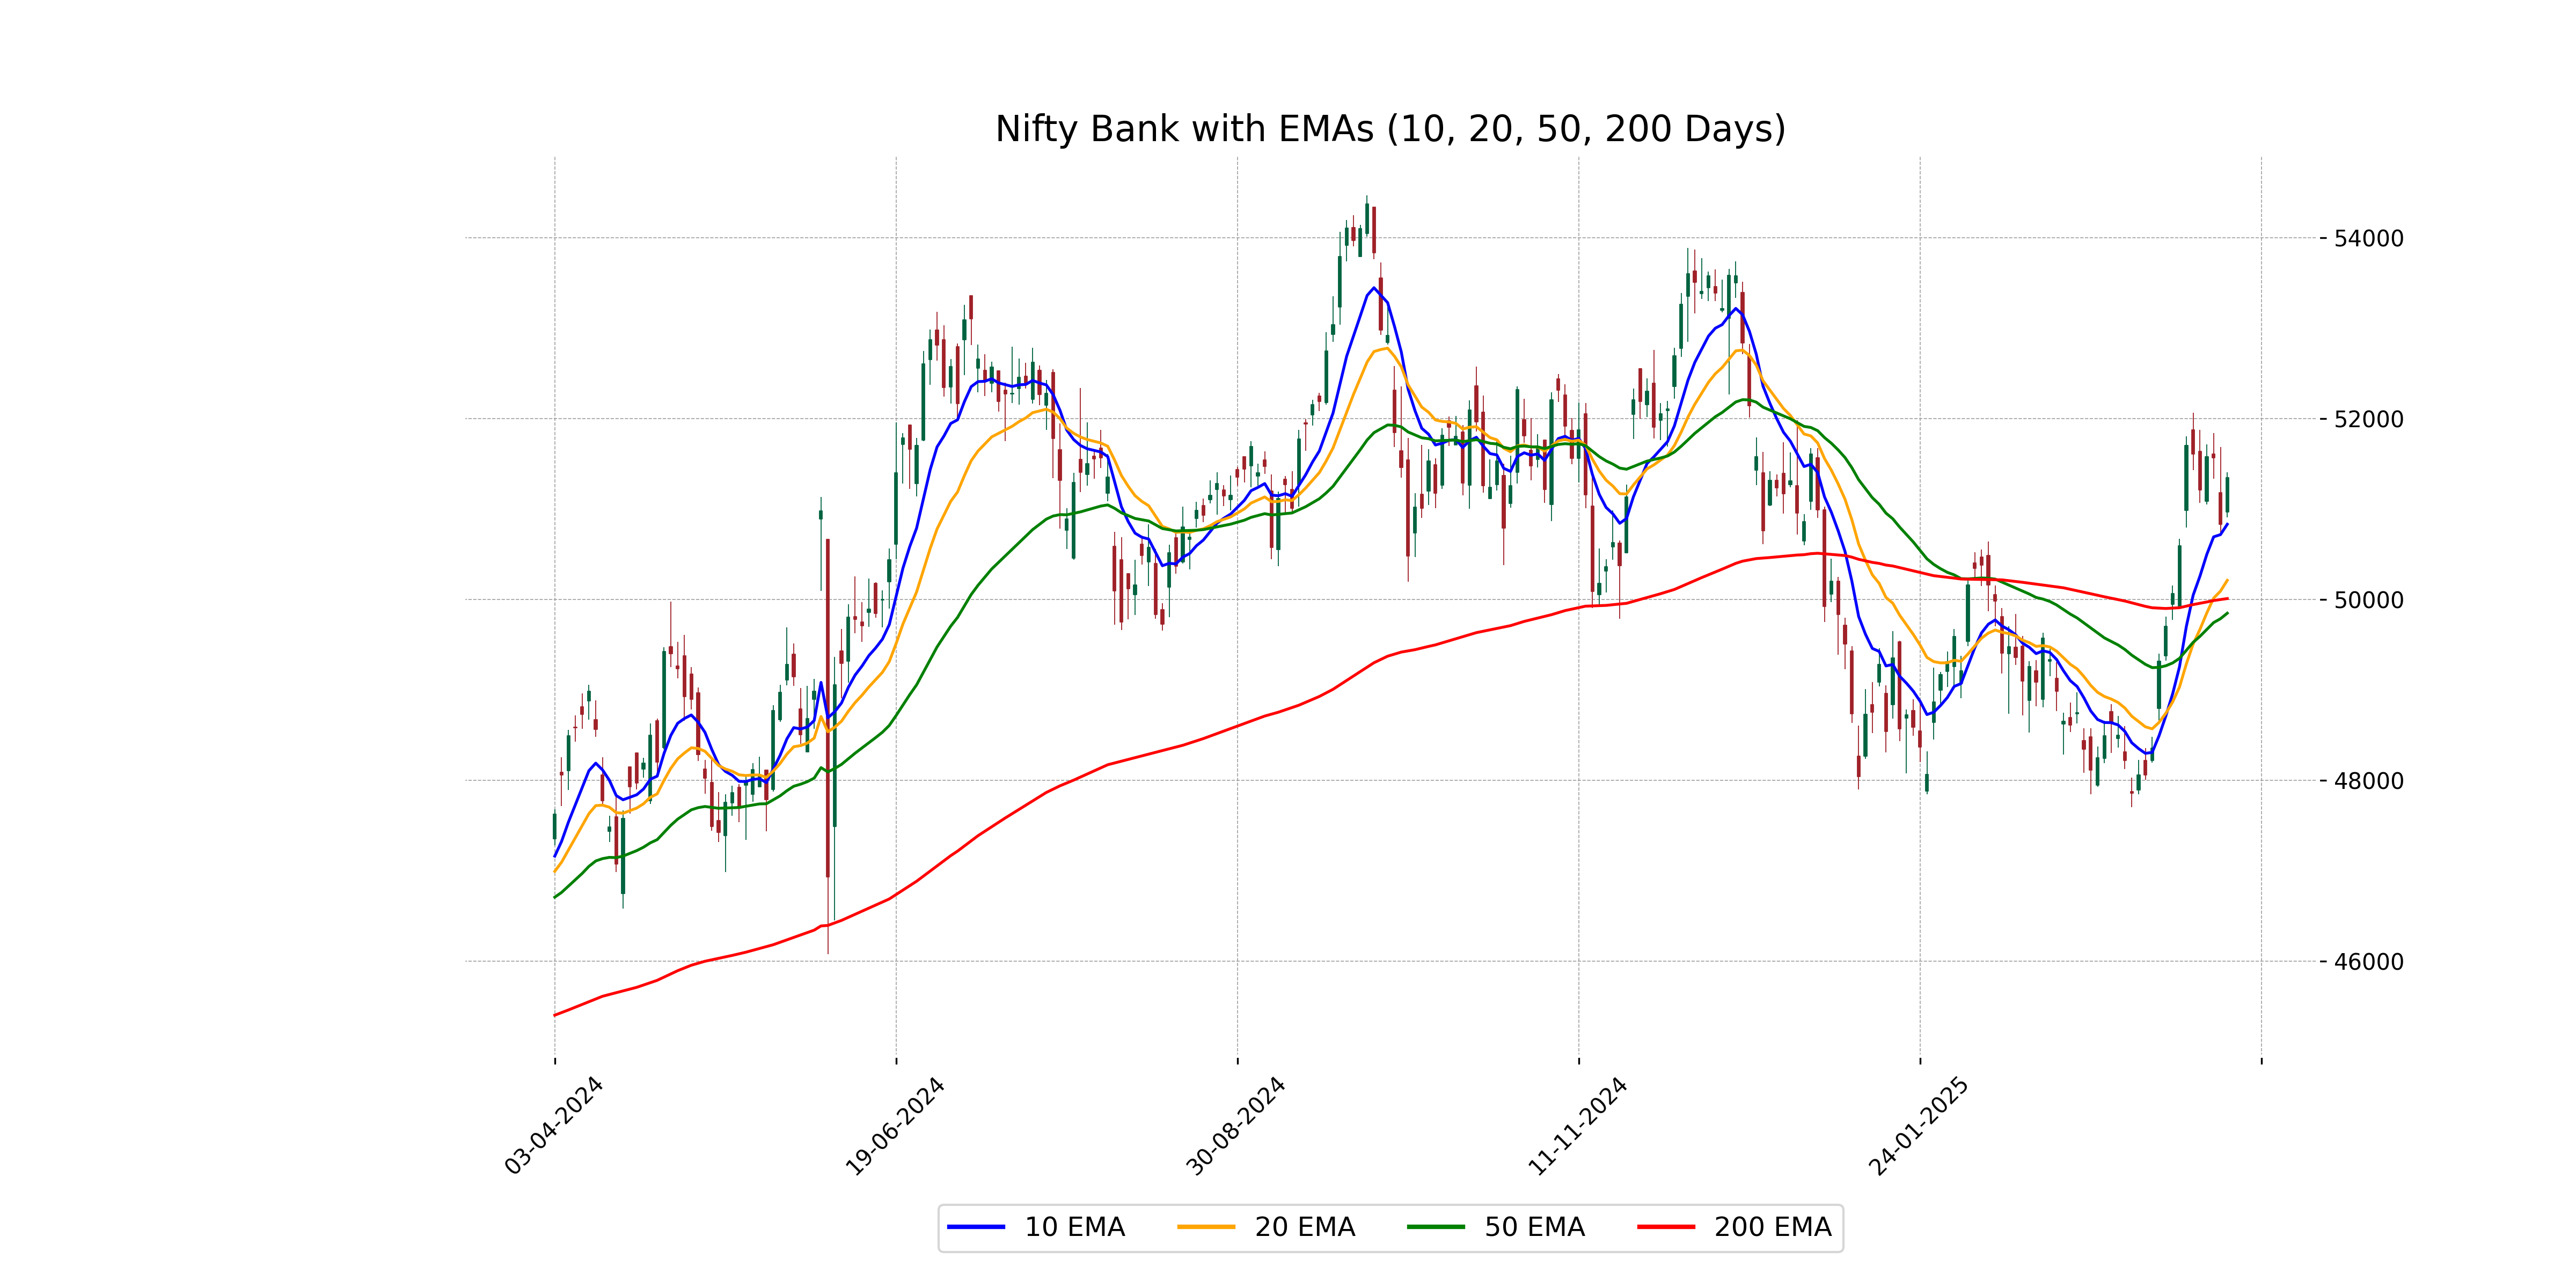
Relationship with Key Moving Averages
The current close of Nifty Bank at 51348.05 is above key moving averages, being higher than the 50 EMA at 49847.23 and the 200 EMA at 50009.03, indicating a potential bullish trend. Additionally, it is above the 10 EMA at 50831.26 and the 20 EMA at 50210.90, which suggests that the short-term uptrend may continue.
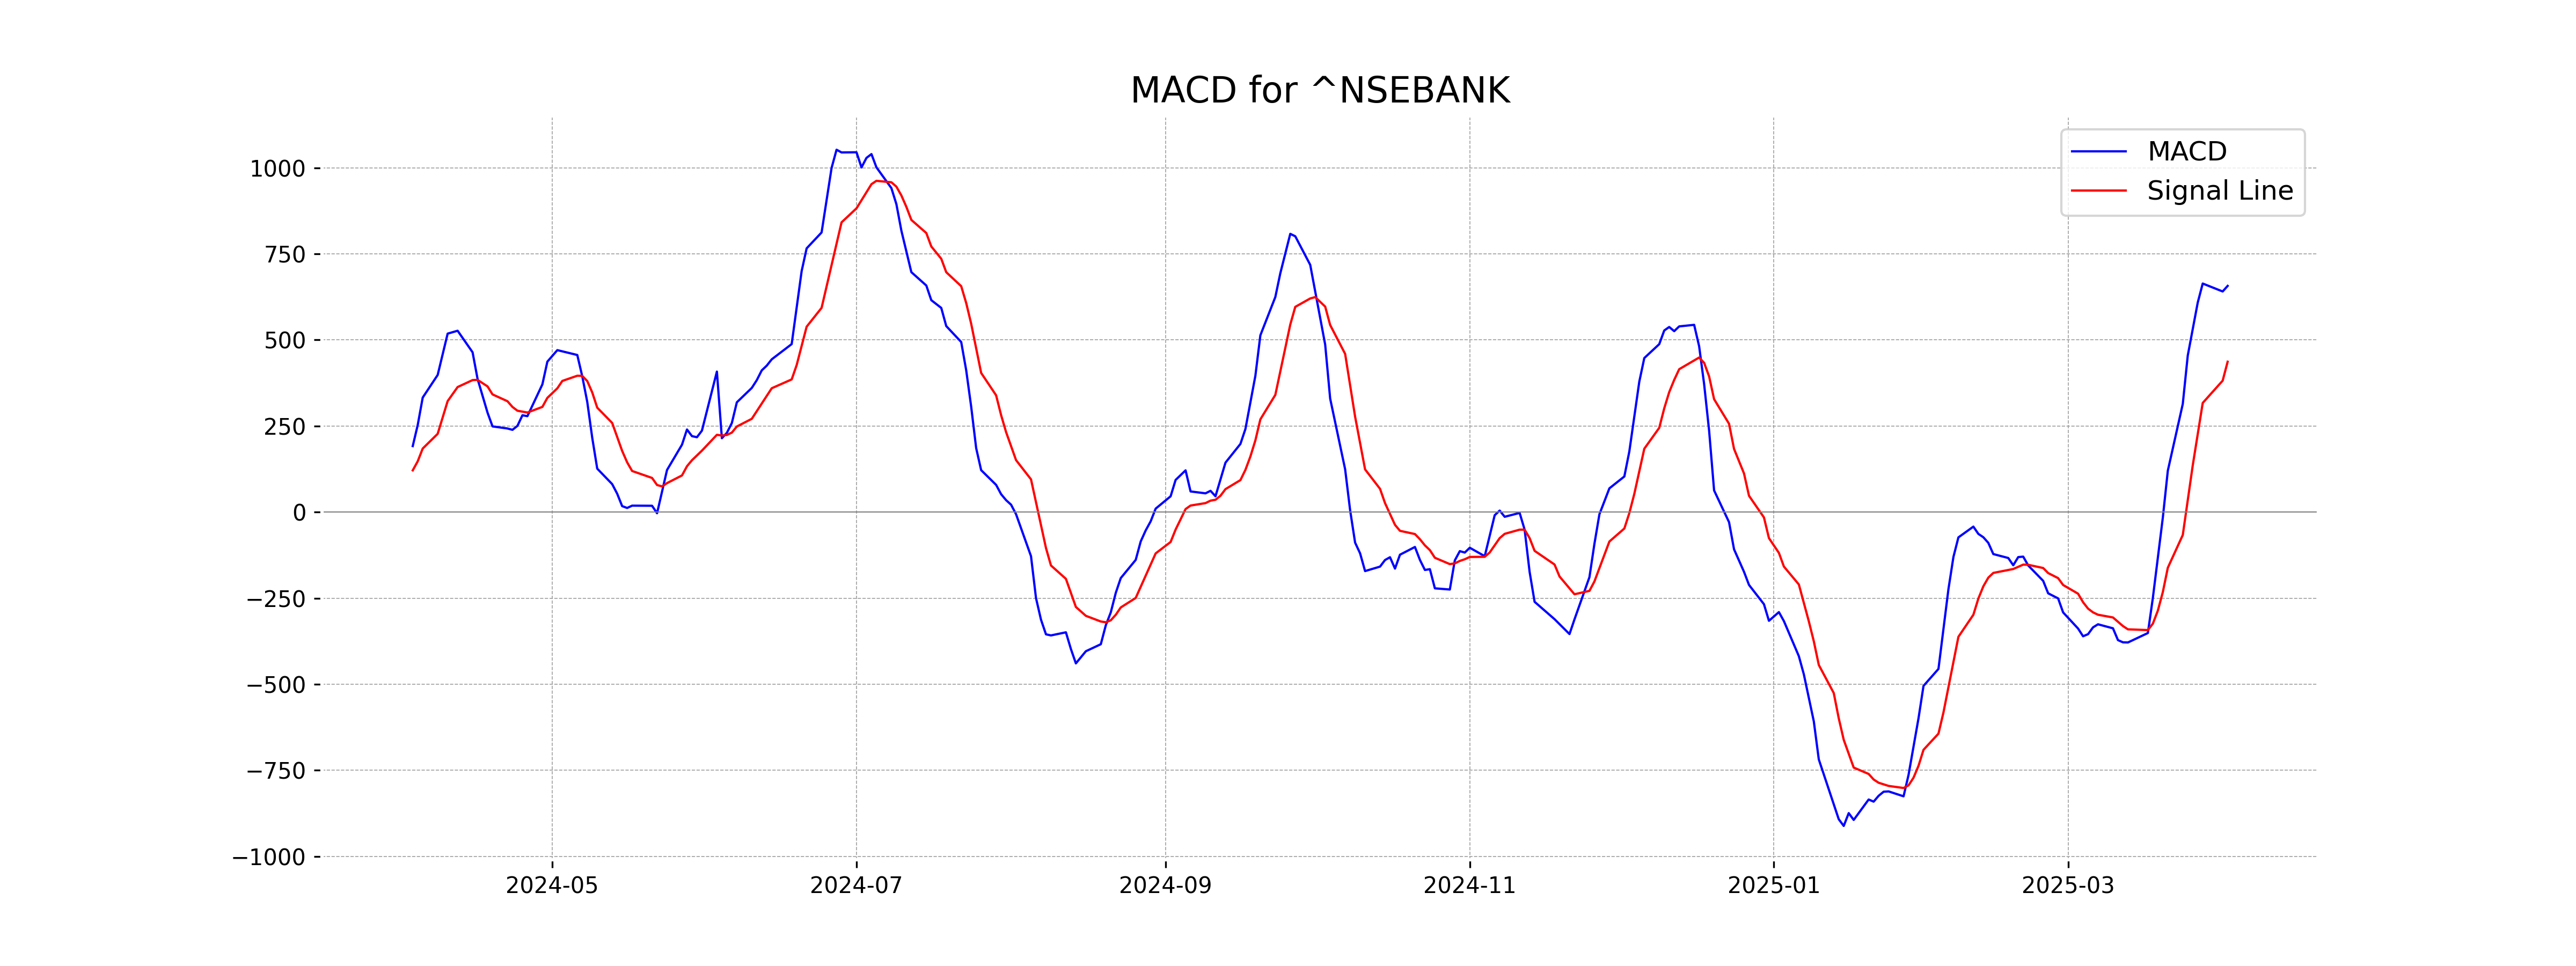
Moving Averages Trend (MACD)
For Nifty Bank, the MACD is currently 656.79, while the MACD Signal is 436.68. The positive difference between the MACD and the MACD Signal suggests a bullish momentum in the stock trend, indicating potential upward movement.
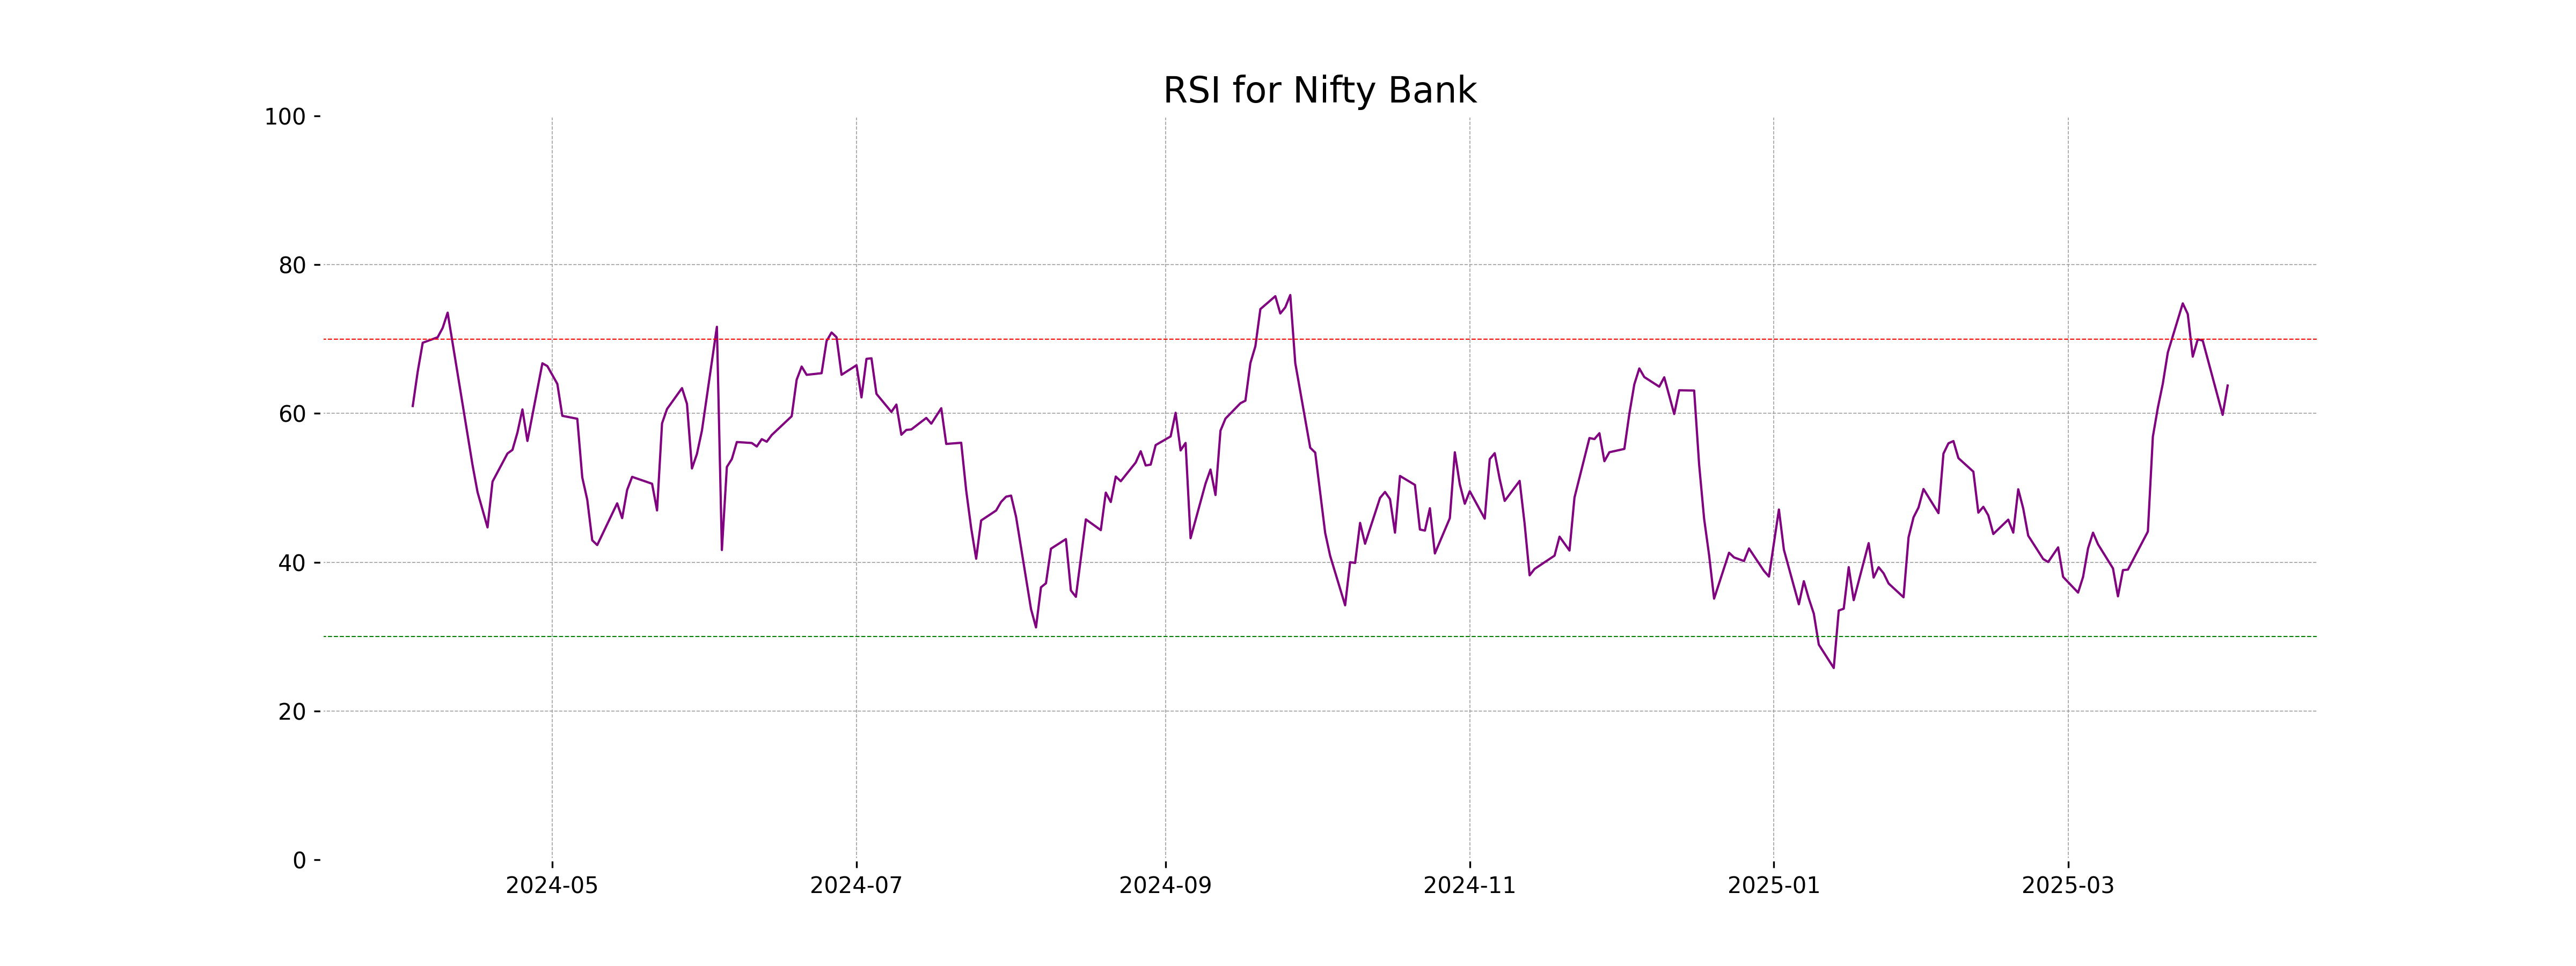
RSI Analysis
The Relative Strength Index (RSI) for Nifty Bank stands at 63.75. This value suggests a neutral to slightly overbought condition, as it is below the typical overbought threshold of 70. Generally, an RSI above 70 indicates an overbought market, while below 30 suggests an oversold market.
Analysis for Nifty 50 - April 02, 2025
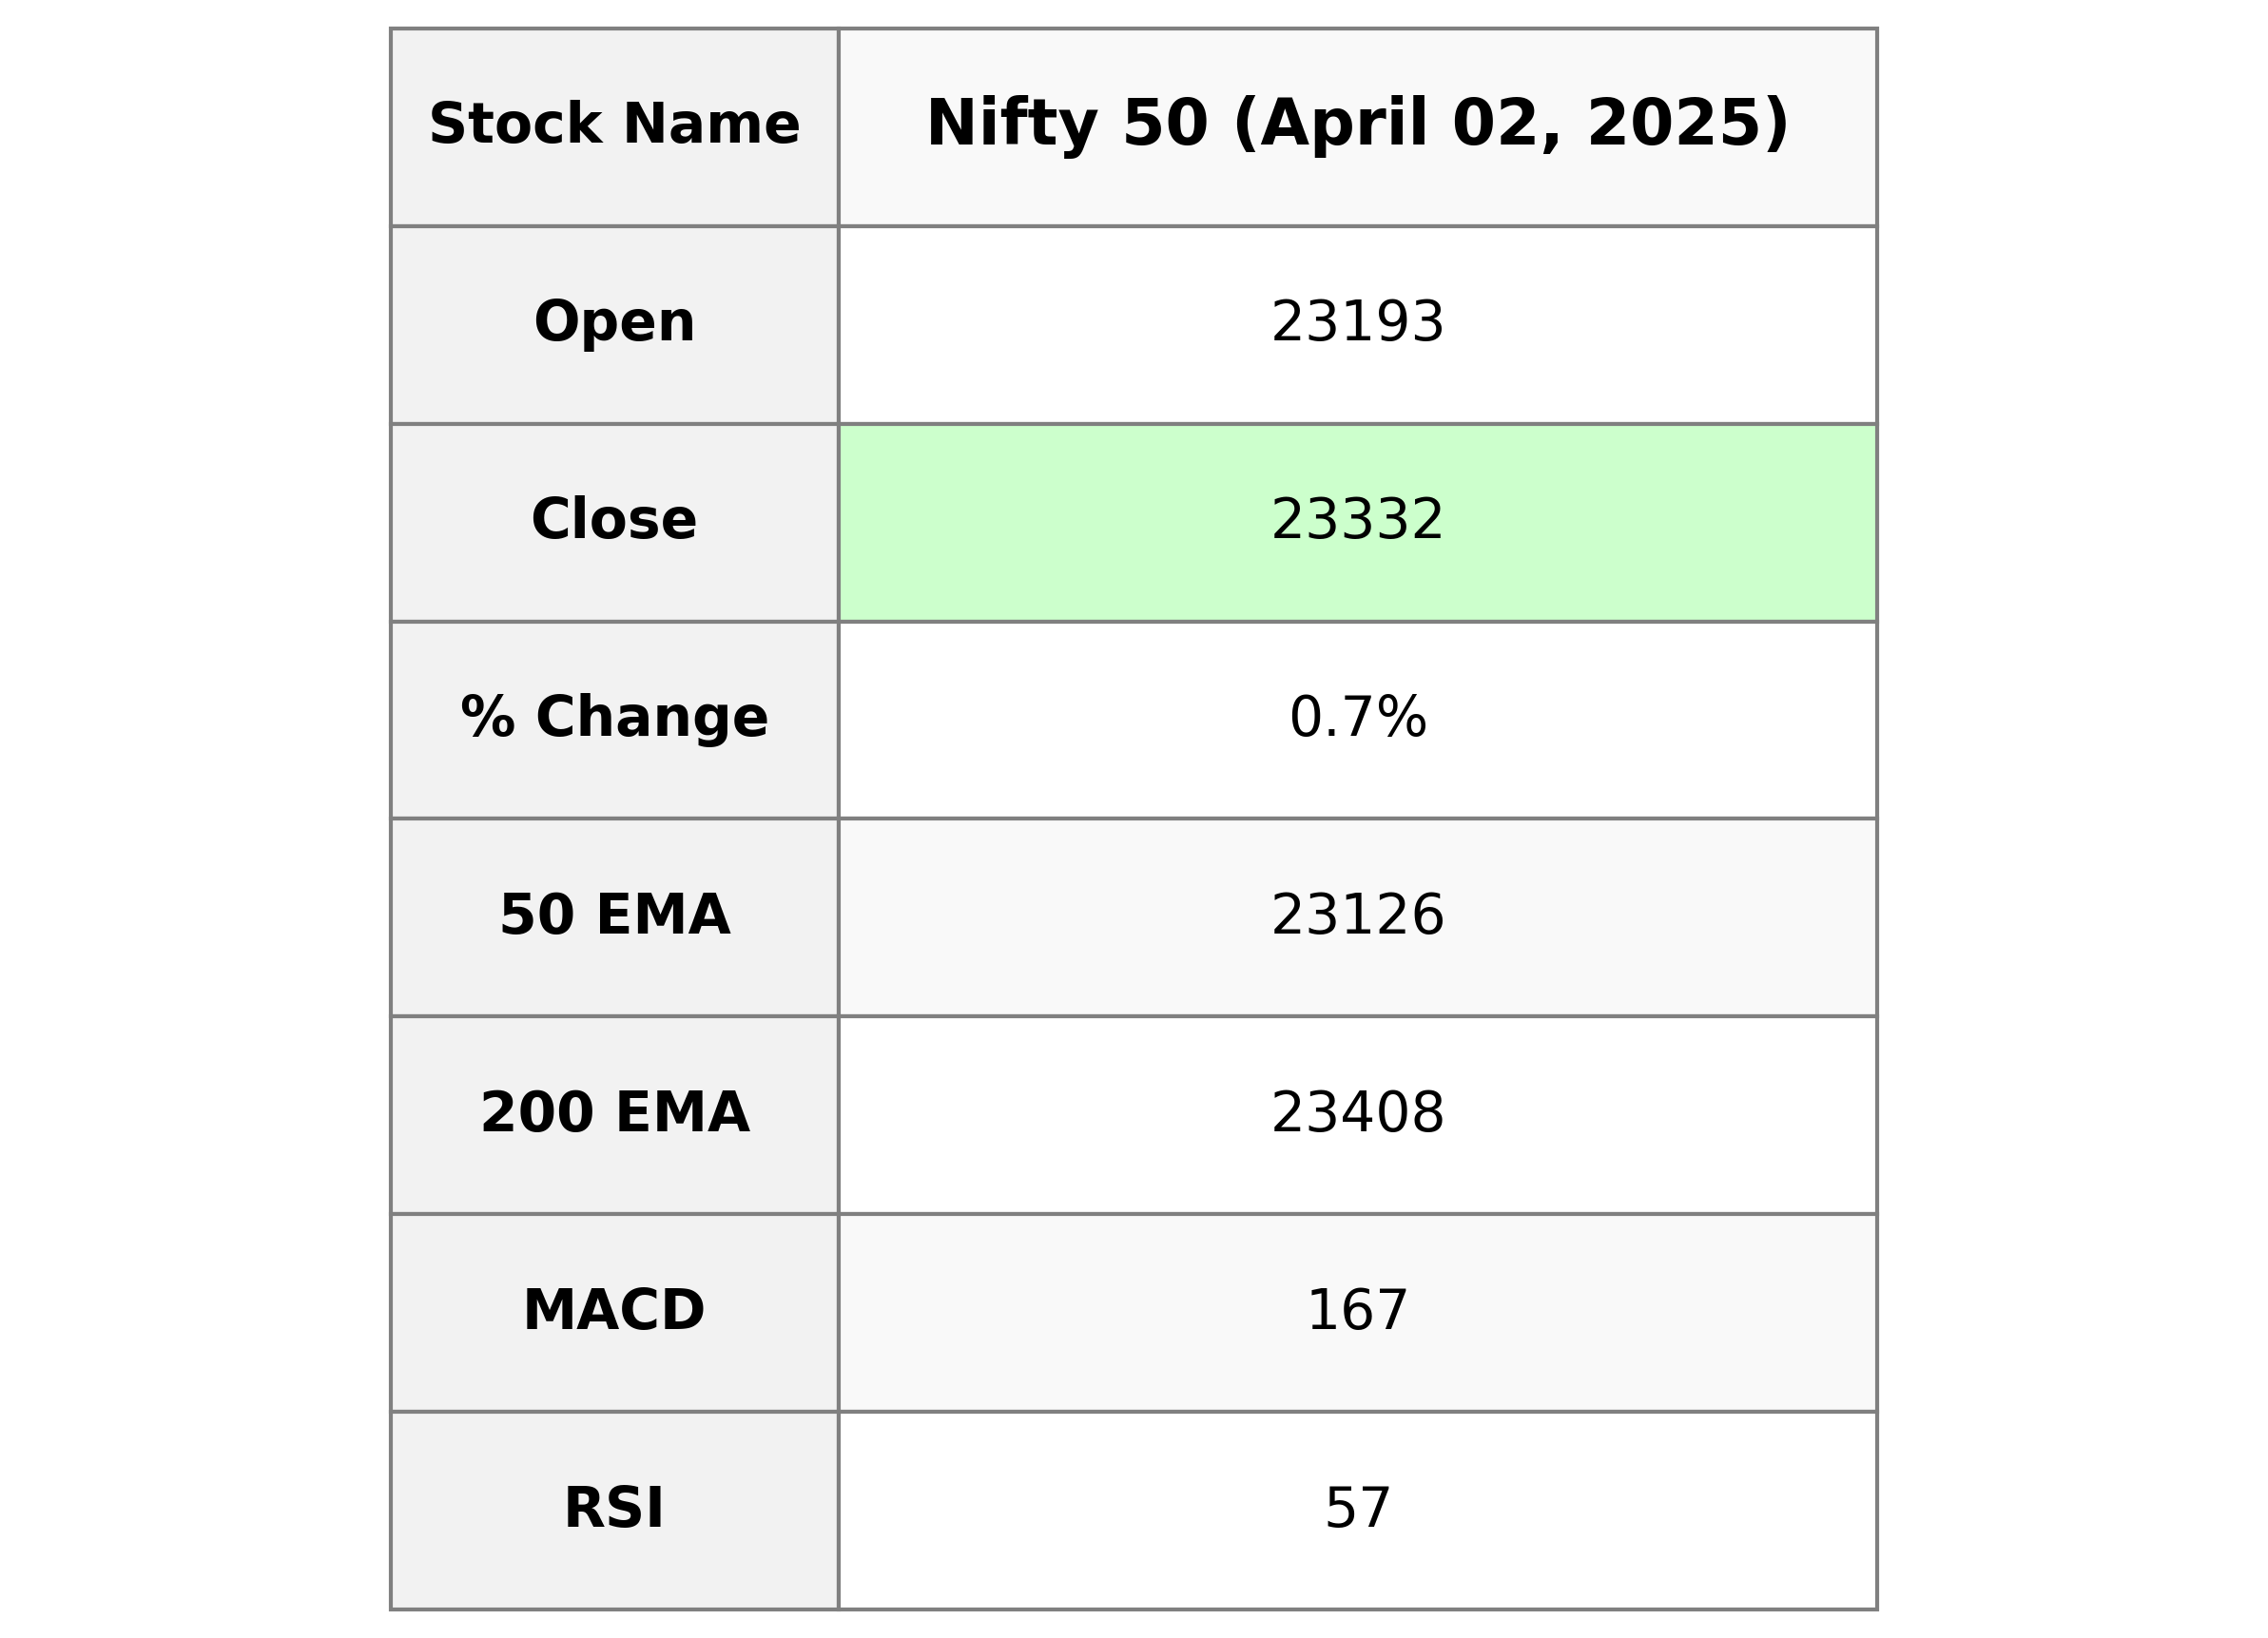
The Nifty 50 showed a positive performance with a closing value of 23,332.35, reflecting an increase of approximately 0.72% from the previous close. The day's trading saw a high of 23,350.00 and a low of 23,158.45, indicating some intra-day volatility. Key indicators like the RSI at 56.80 and a positive MACD suggest a bullish trend in the short term.
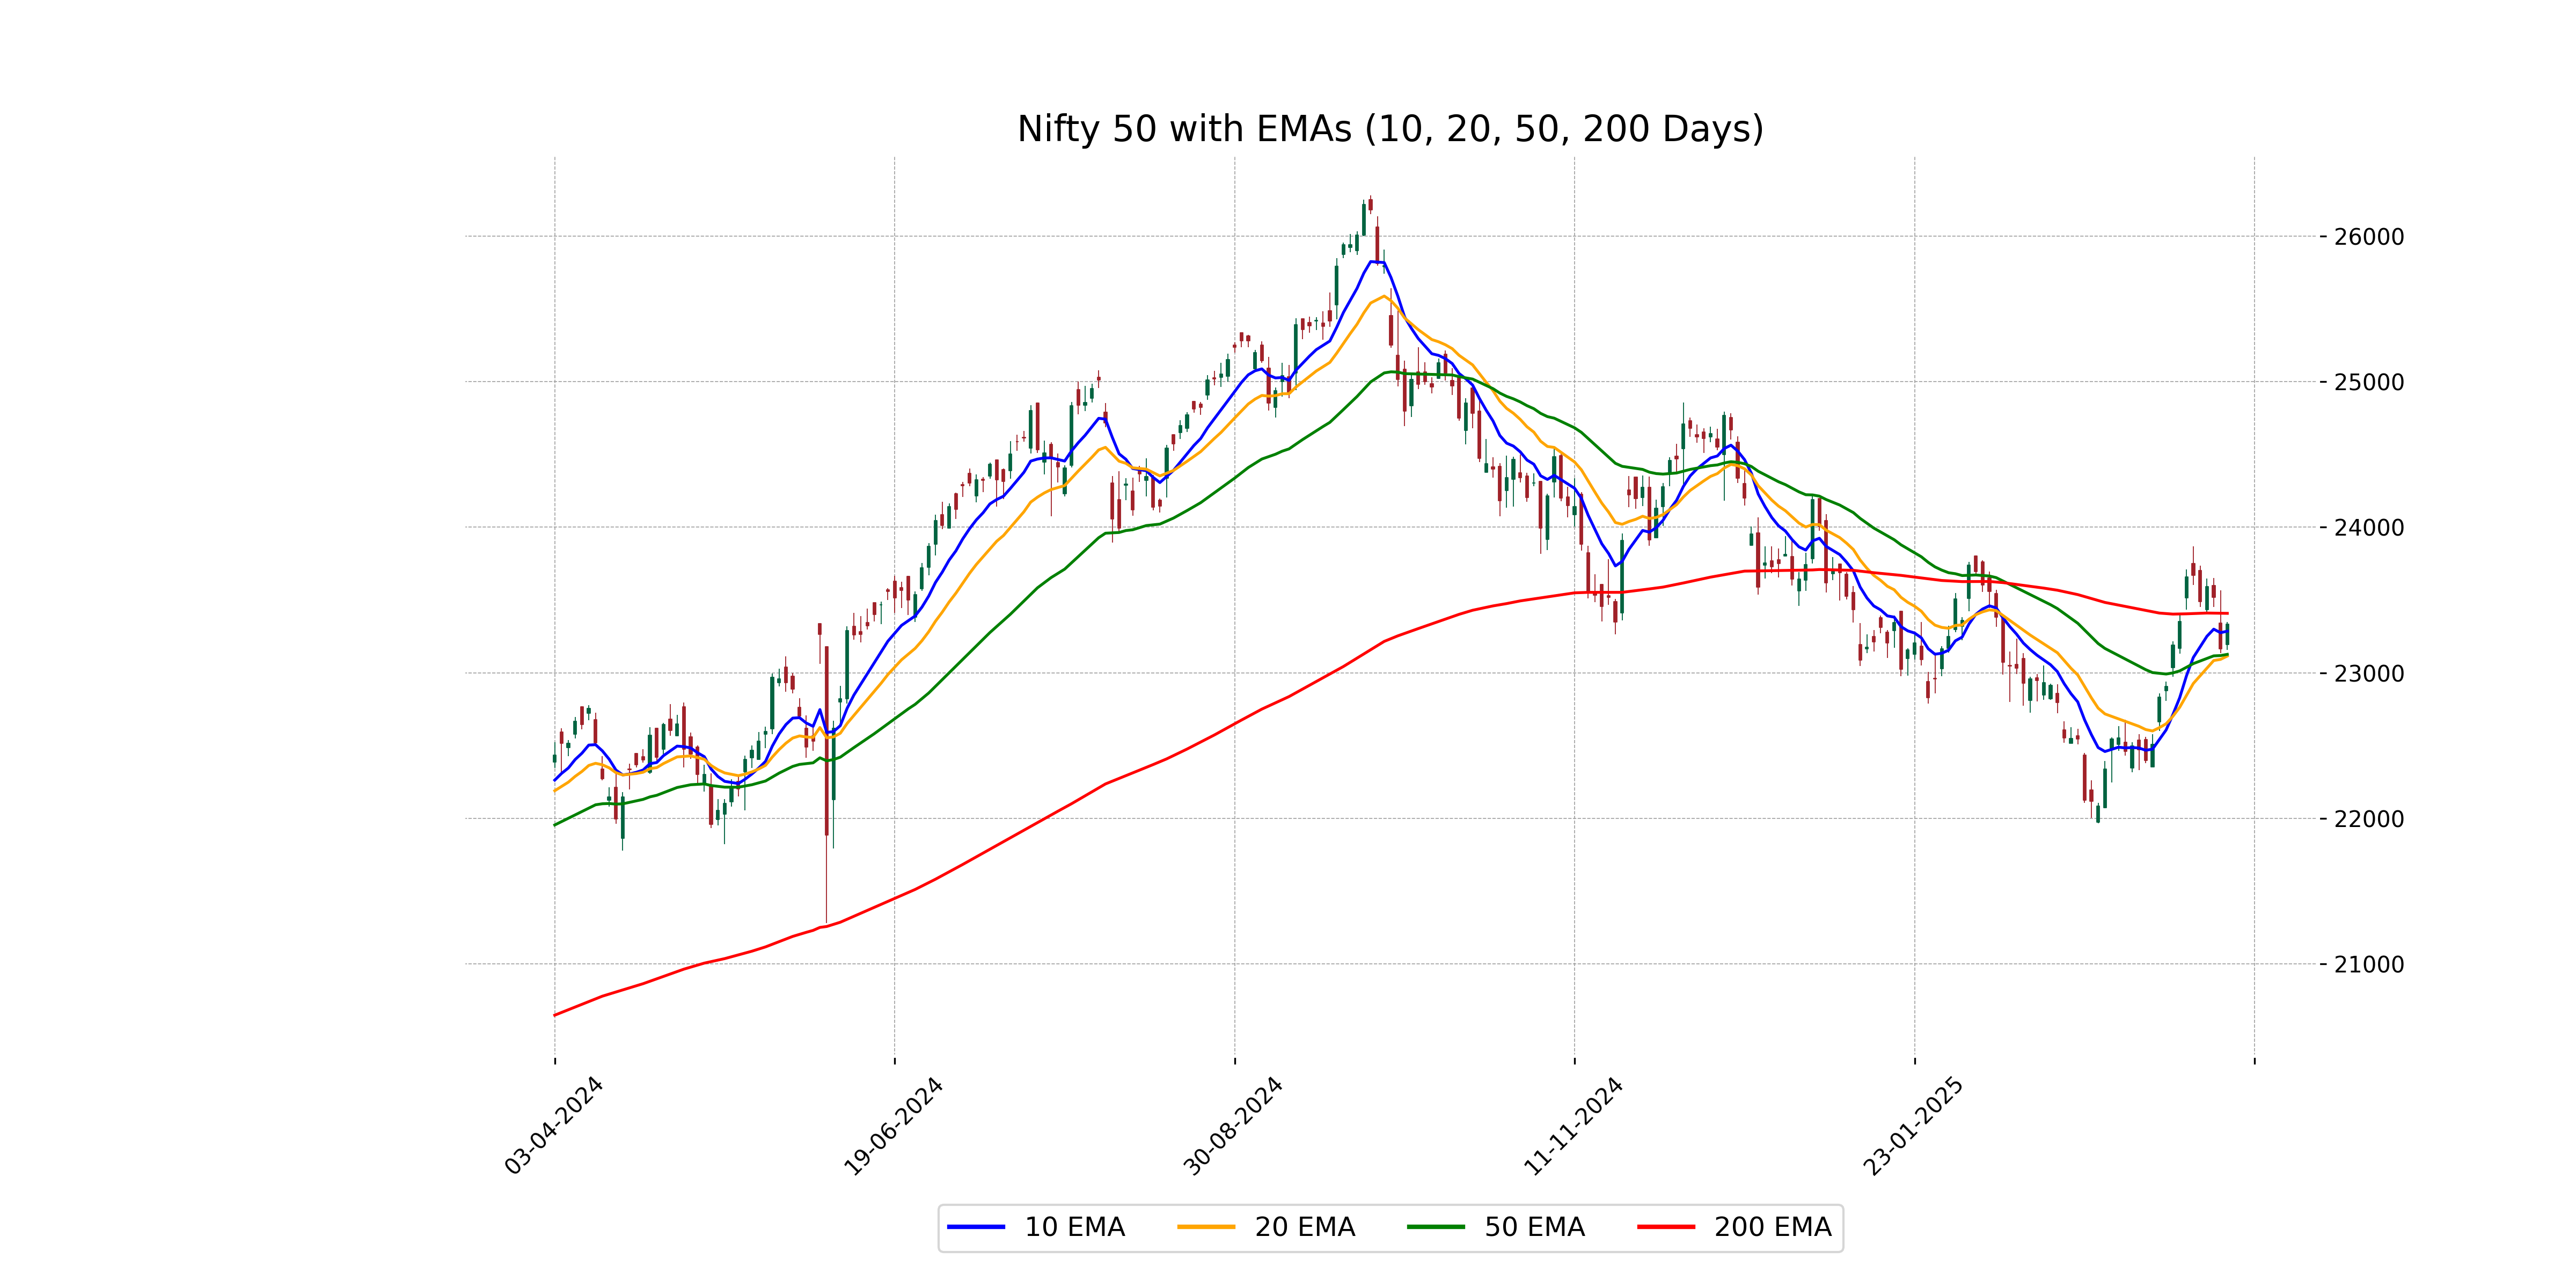
Relationship with Key Moving Averages
The Nifty 50 closed at 23,332.35, above the 50 EMA of 23,126.31 and below the 200 EMA of 23,407.92, indicating a short-term bullish trend but still under long-term resistance. It is also positioned above the 10 EMA of 23,285.45, and the 20 EMA of 23,114.62, showing positive momentum on a shorter time frame.
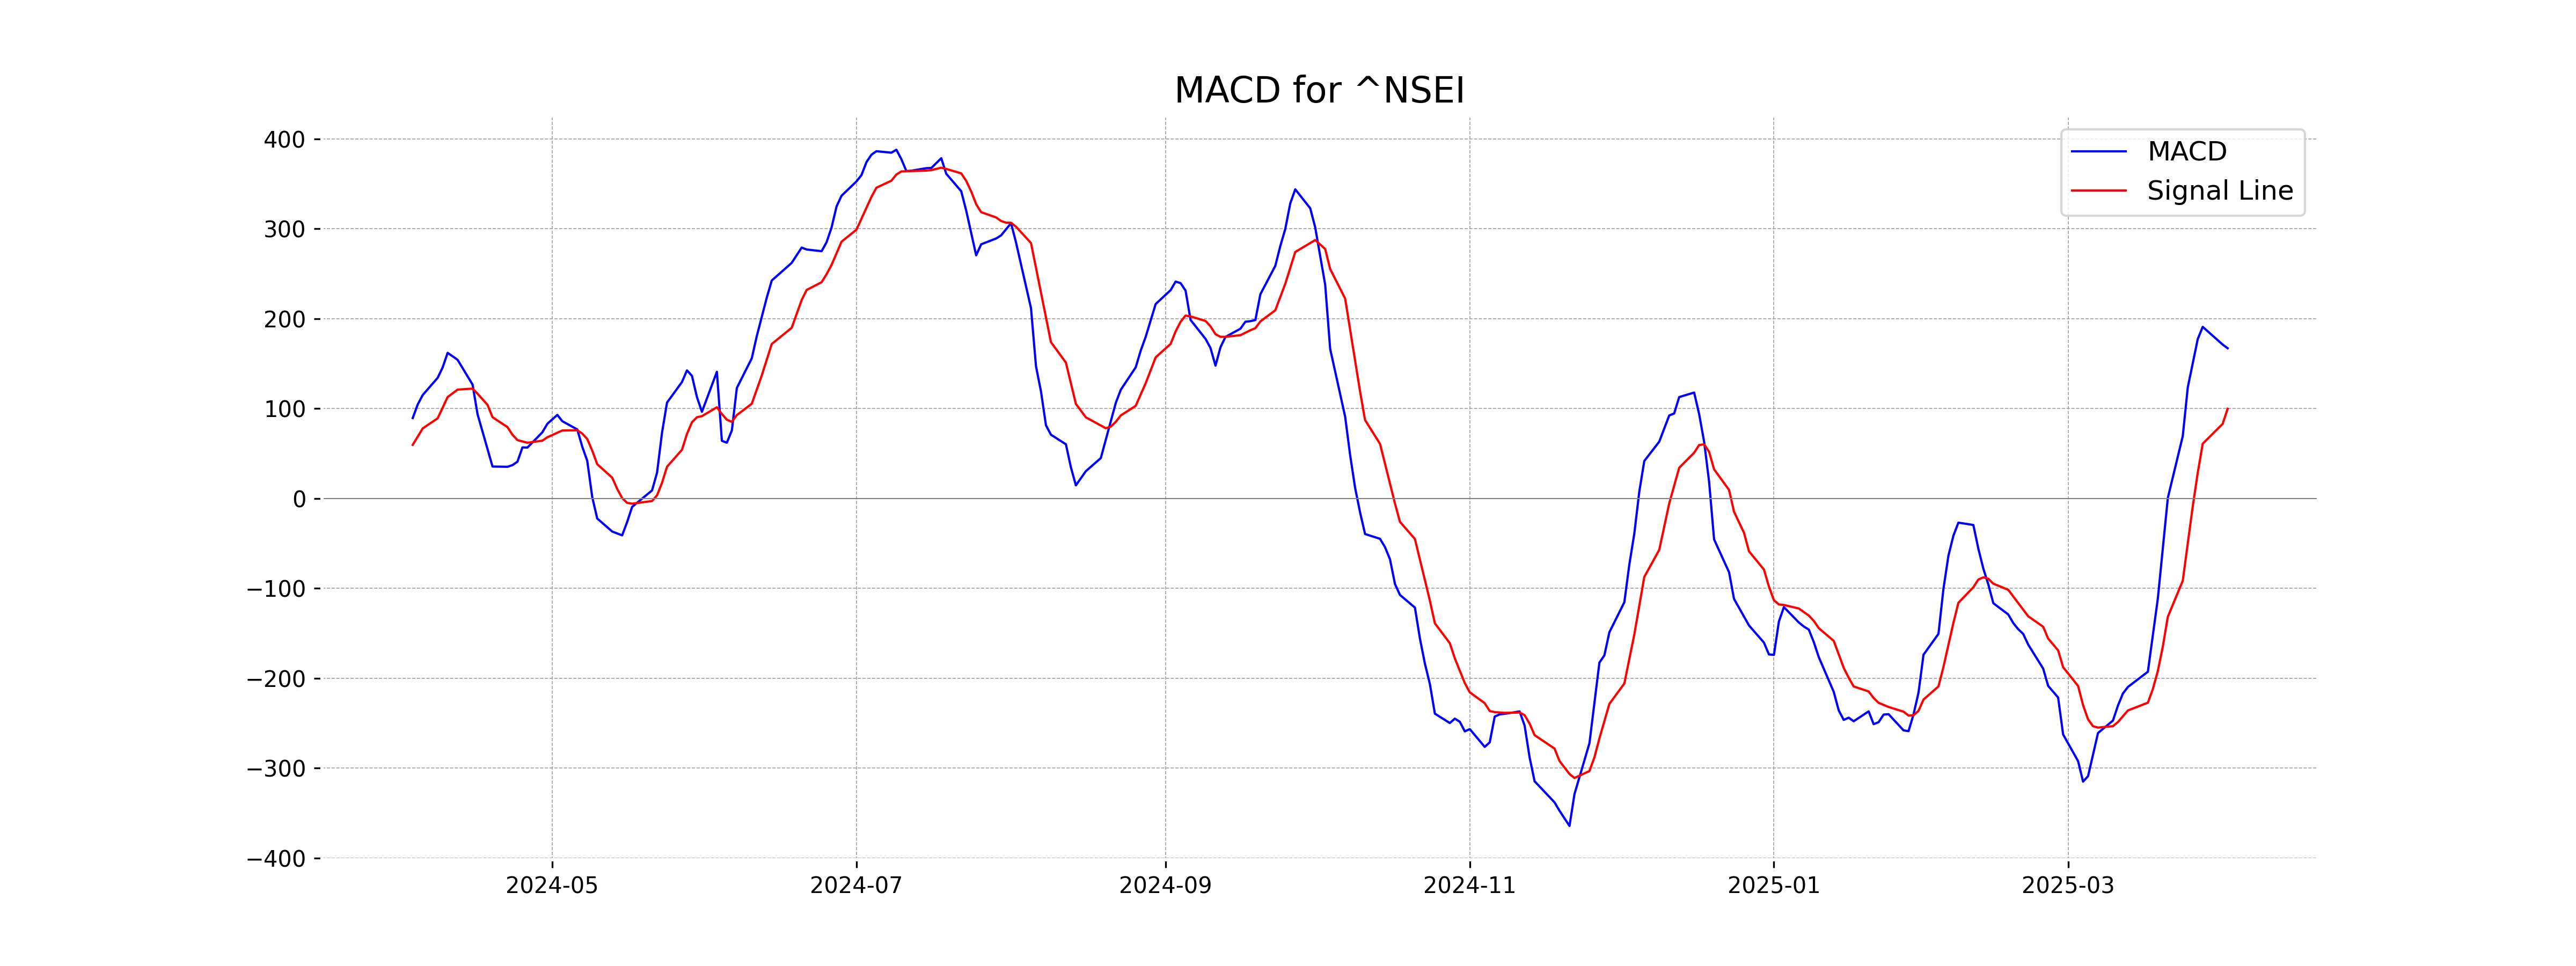
Moving Averages Trend (MACD)
The MACD for Nifty 50 is 167.16 with a signal line at 99.83. This indicates a bullish momentum as the MACD line is above the signal line, suggesting potential upward movement.
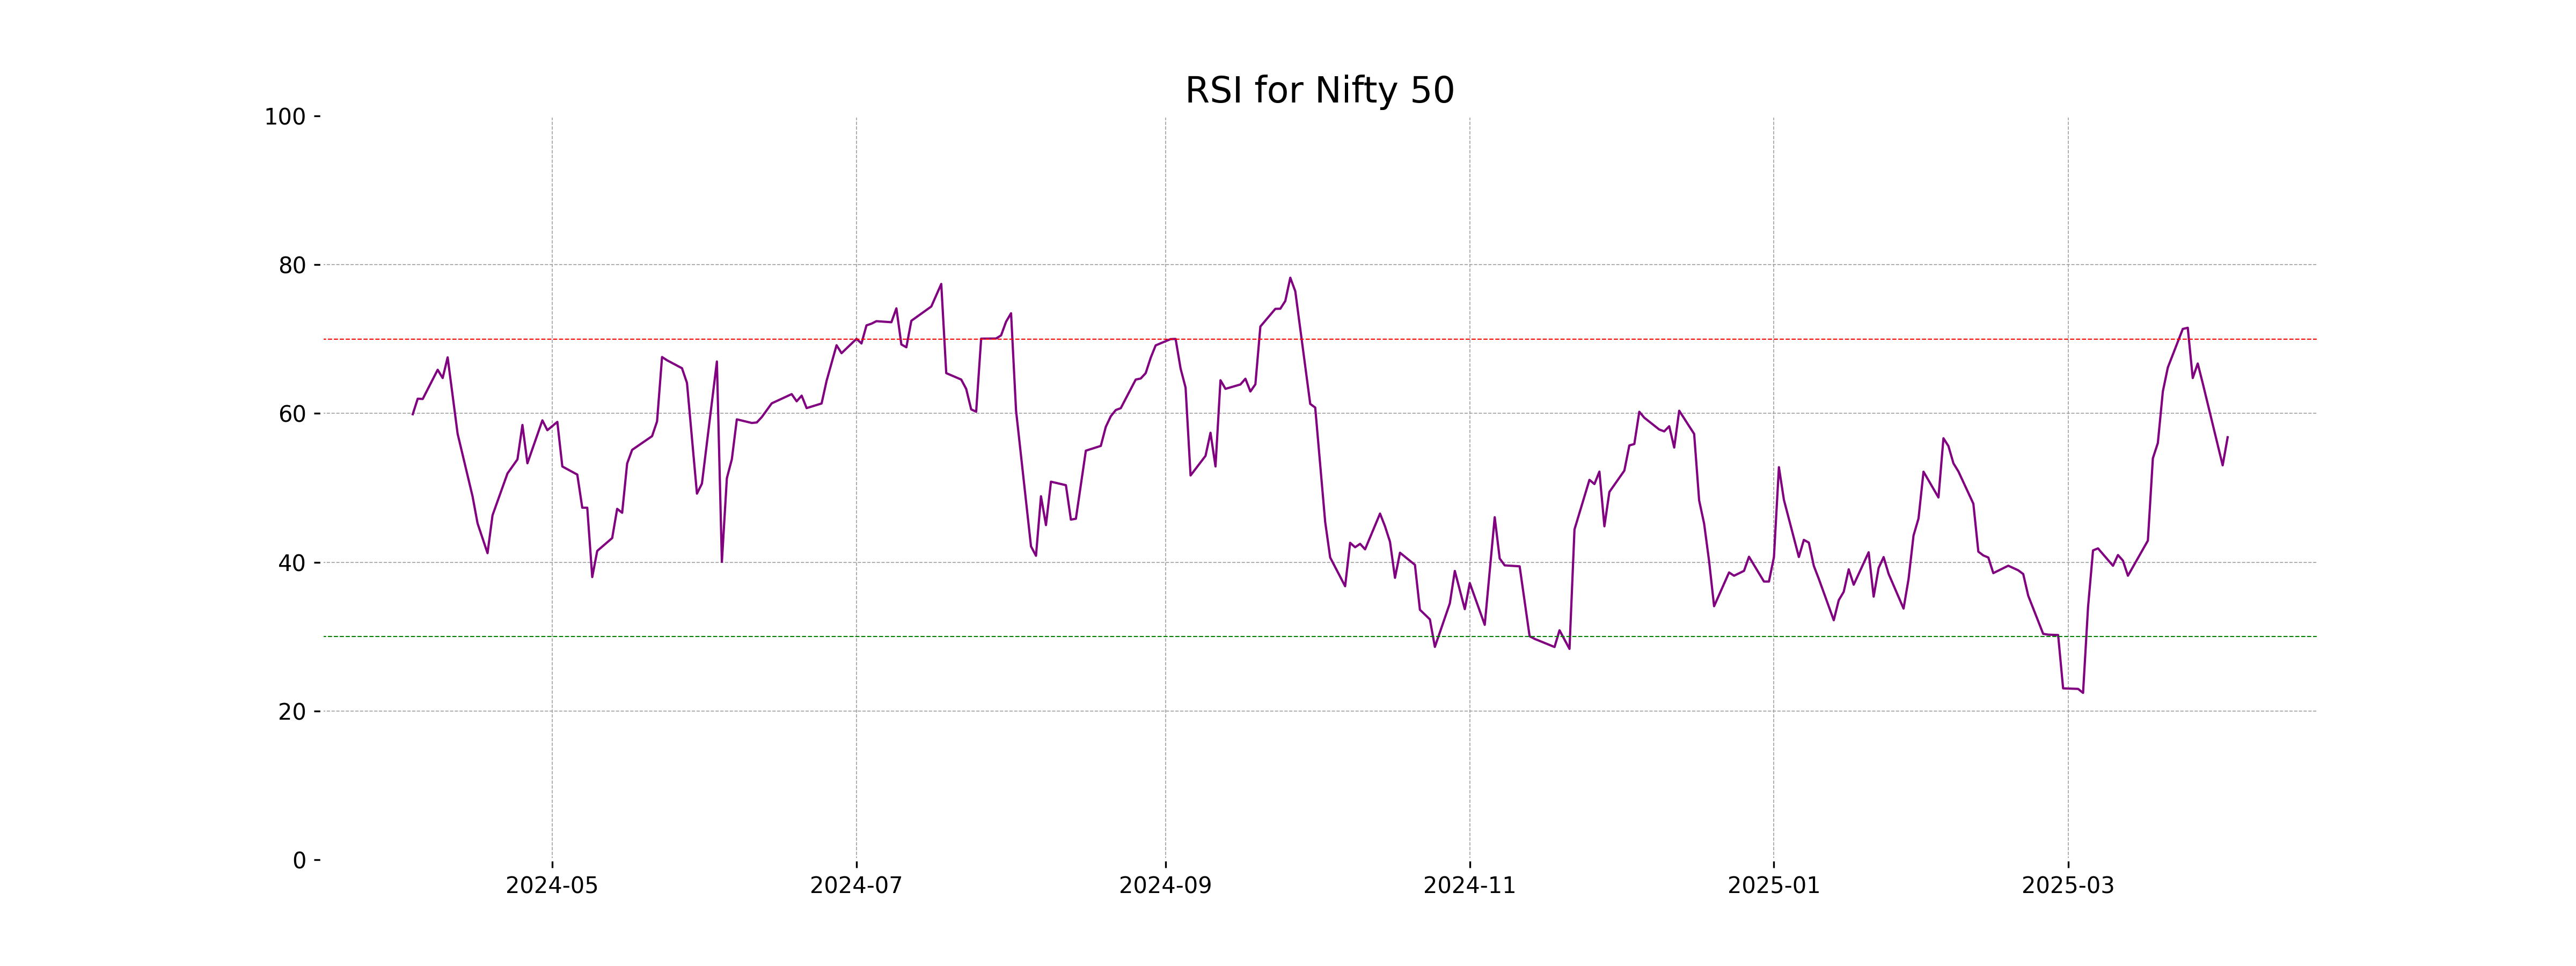
RSI Analysis
The RSI for Nifty 50 is 56.80, indicating a moderate level which suggests neither overbought nor oversold conditions. This positions it in a neutral zone, where there might not be any immediate trend reversal signals based just on RSI.
Up Next
Global stock market indices: How the world markets performed today - 2 April 2025

Honda Activa 6G: Everything You Need to Know Before Buying

How much does a ULIP plan really cost? A break-down of all charges

Centre plans to borrow Rs 8.20 lakh cr from market in first half of FY27

Reliance denies buying Iranian oil amid US sanctions waiver

Premium petrol price up Rs 2, industrial diesel up Rs 22; no change in normal petrol, diesel rates

More videos

India's GDP expected to register over 8 pc growth in Sep-Dec: Report

Govt announces seven measures to help boost exports

RBI keeps interest rates on hold after US trade deal boosts outlook

RBI proposes to compensate customers up to Rs 25,000 loss due to fraud

RBI raises GDP growth projection of Q1, Q2 of FY27

RBI pauses rate cuts, retains interest rate at 5.25 pc

Rupee jumps 122 paise to close at 90.27 against US dollar on India-US trade deal

Stock markets cheer India-US trade deal: Sensex, Nifty surge 2.5 pc

UPI transactions hit record high of Rs 230 lakh crore in 2025-26 till Dec: Govt

Explained: India-US trade deal, tariffs and trade benefits