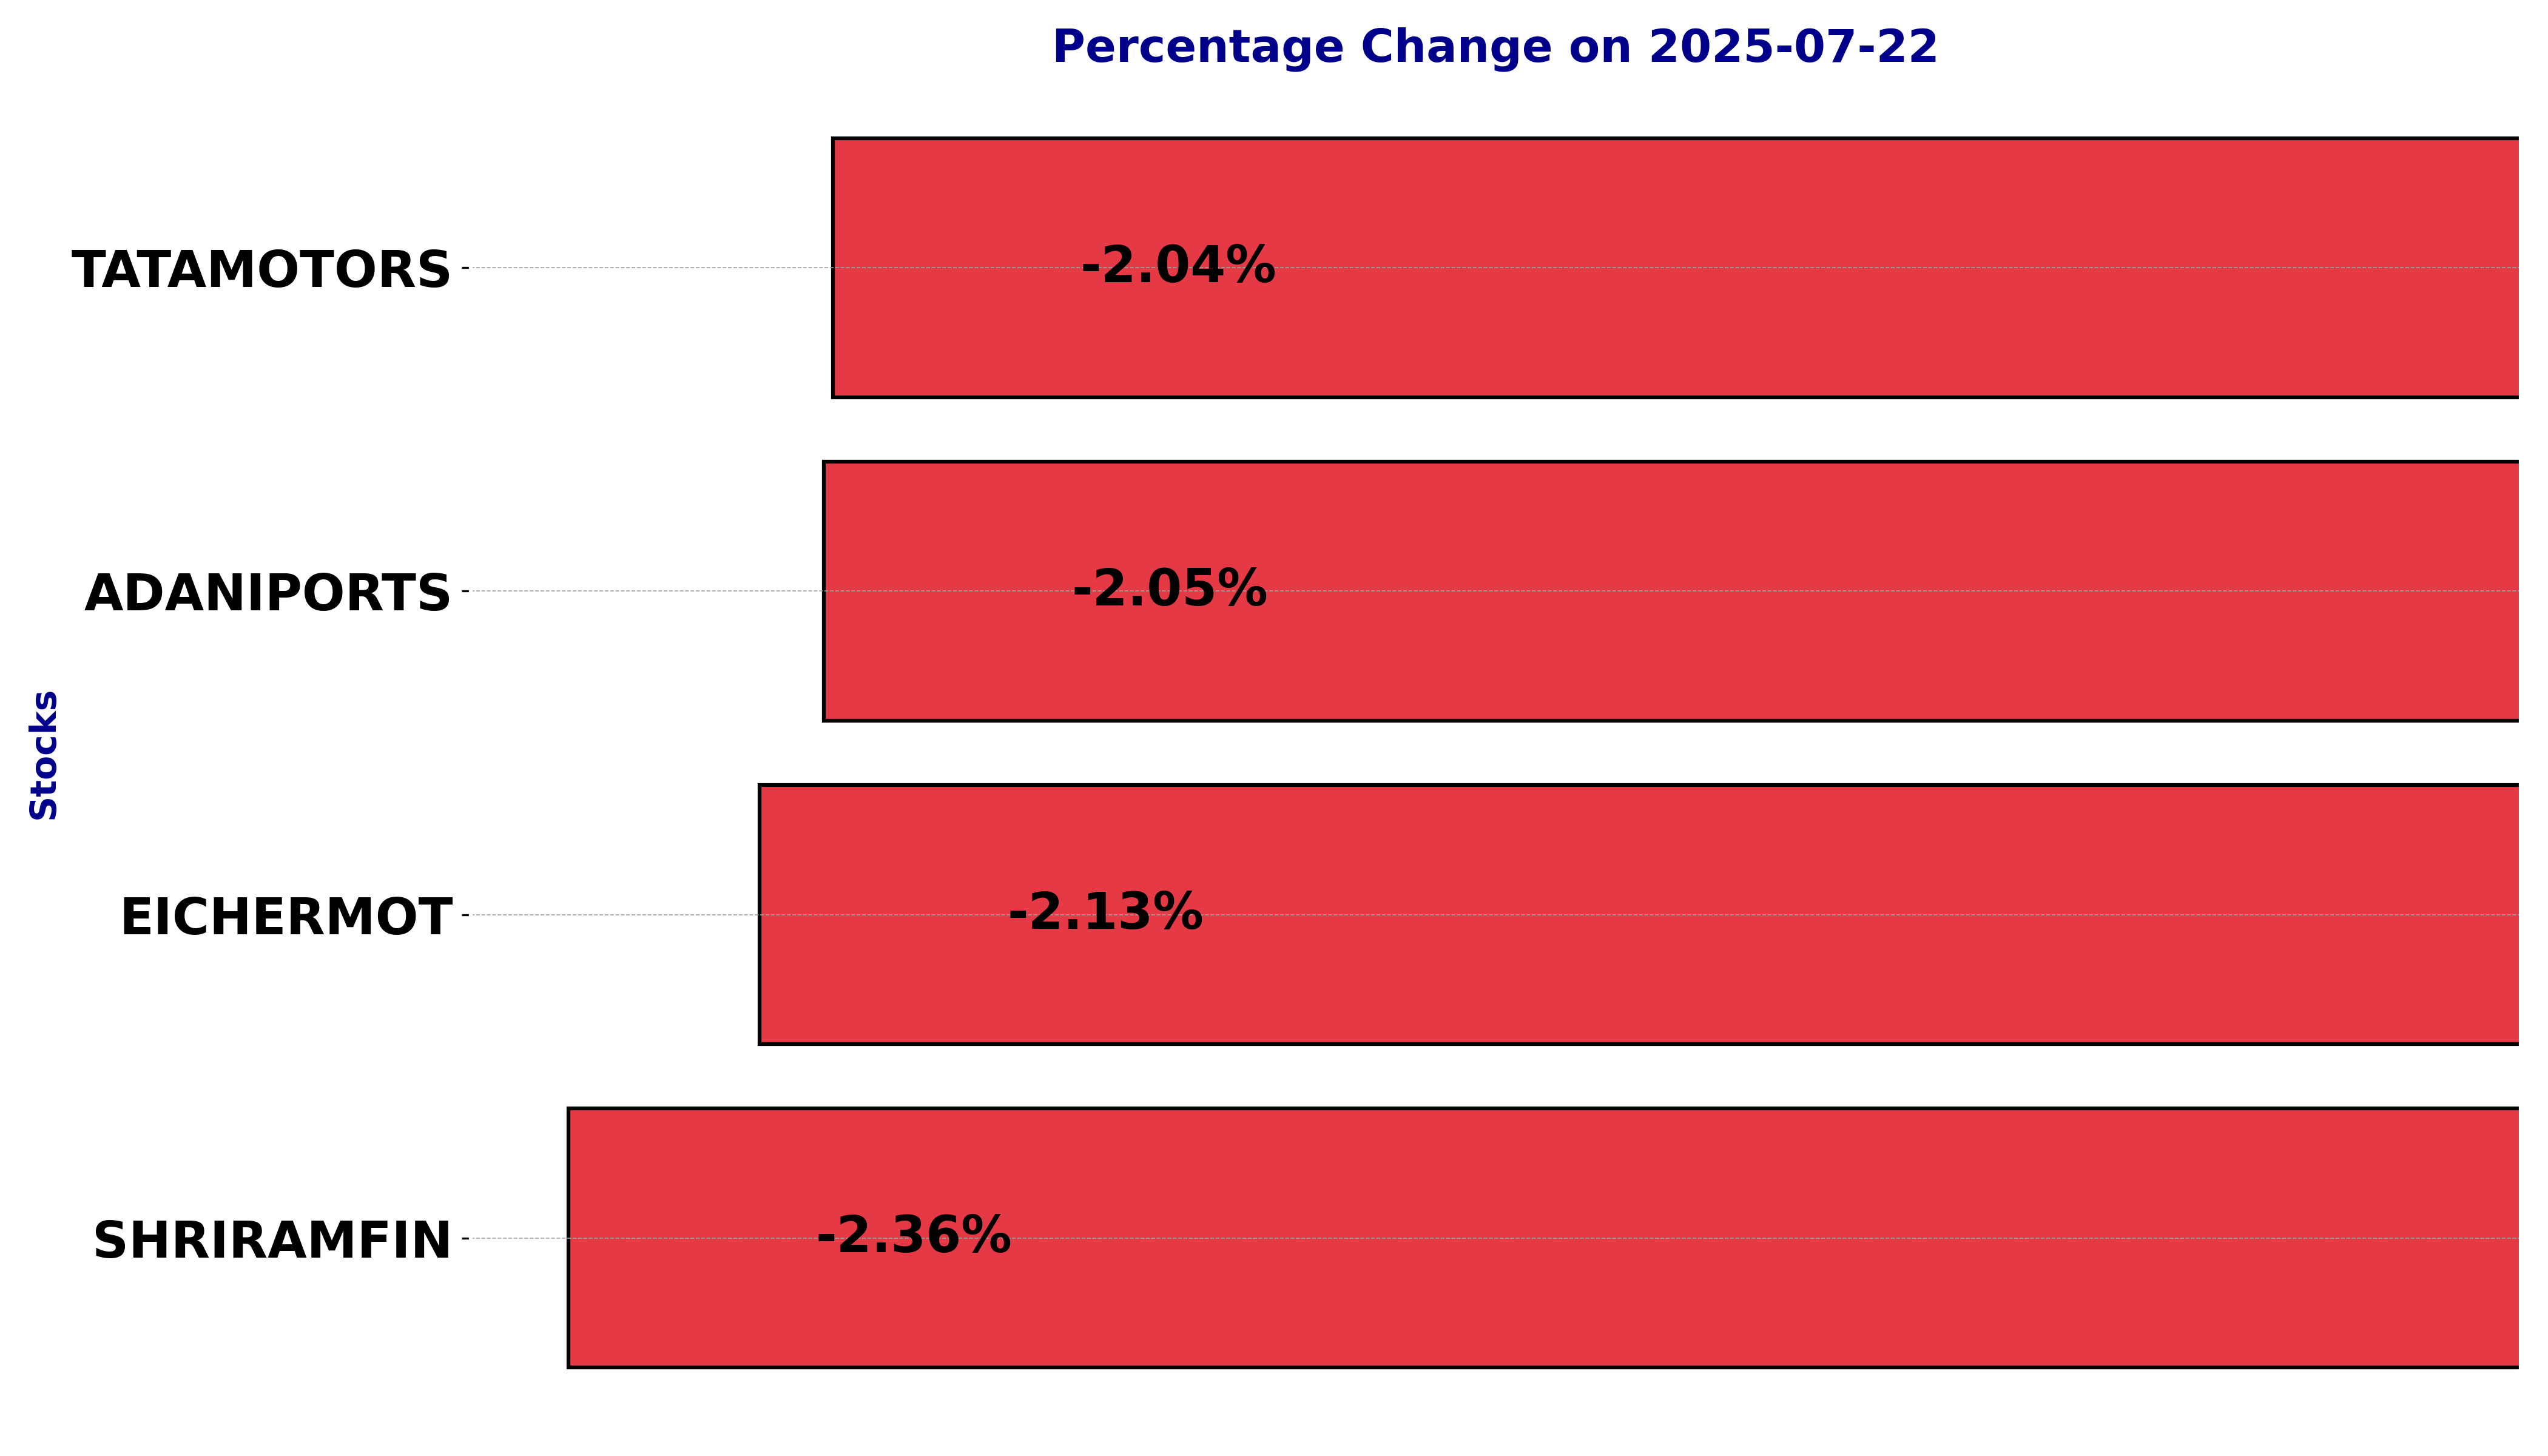
NSE Nifty 50: Top 5 stock losers of July 22, 2025
In this article, we will explore the technical indicators of some of the low-performing stocks on the Indian stock market, including ADANIPORTS, EICHERMOT, SHRIRAMFIN, and TATAMOTORS.
By looking at these stocks through the lens of key technical factors, we aim to better understand their price movements, trends, and potential future performance.
Analysis for Adani Ports - July 22, 2025
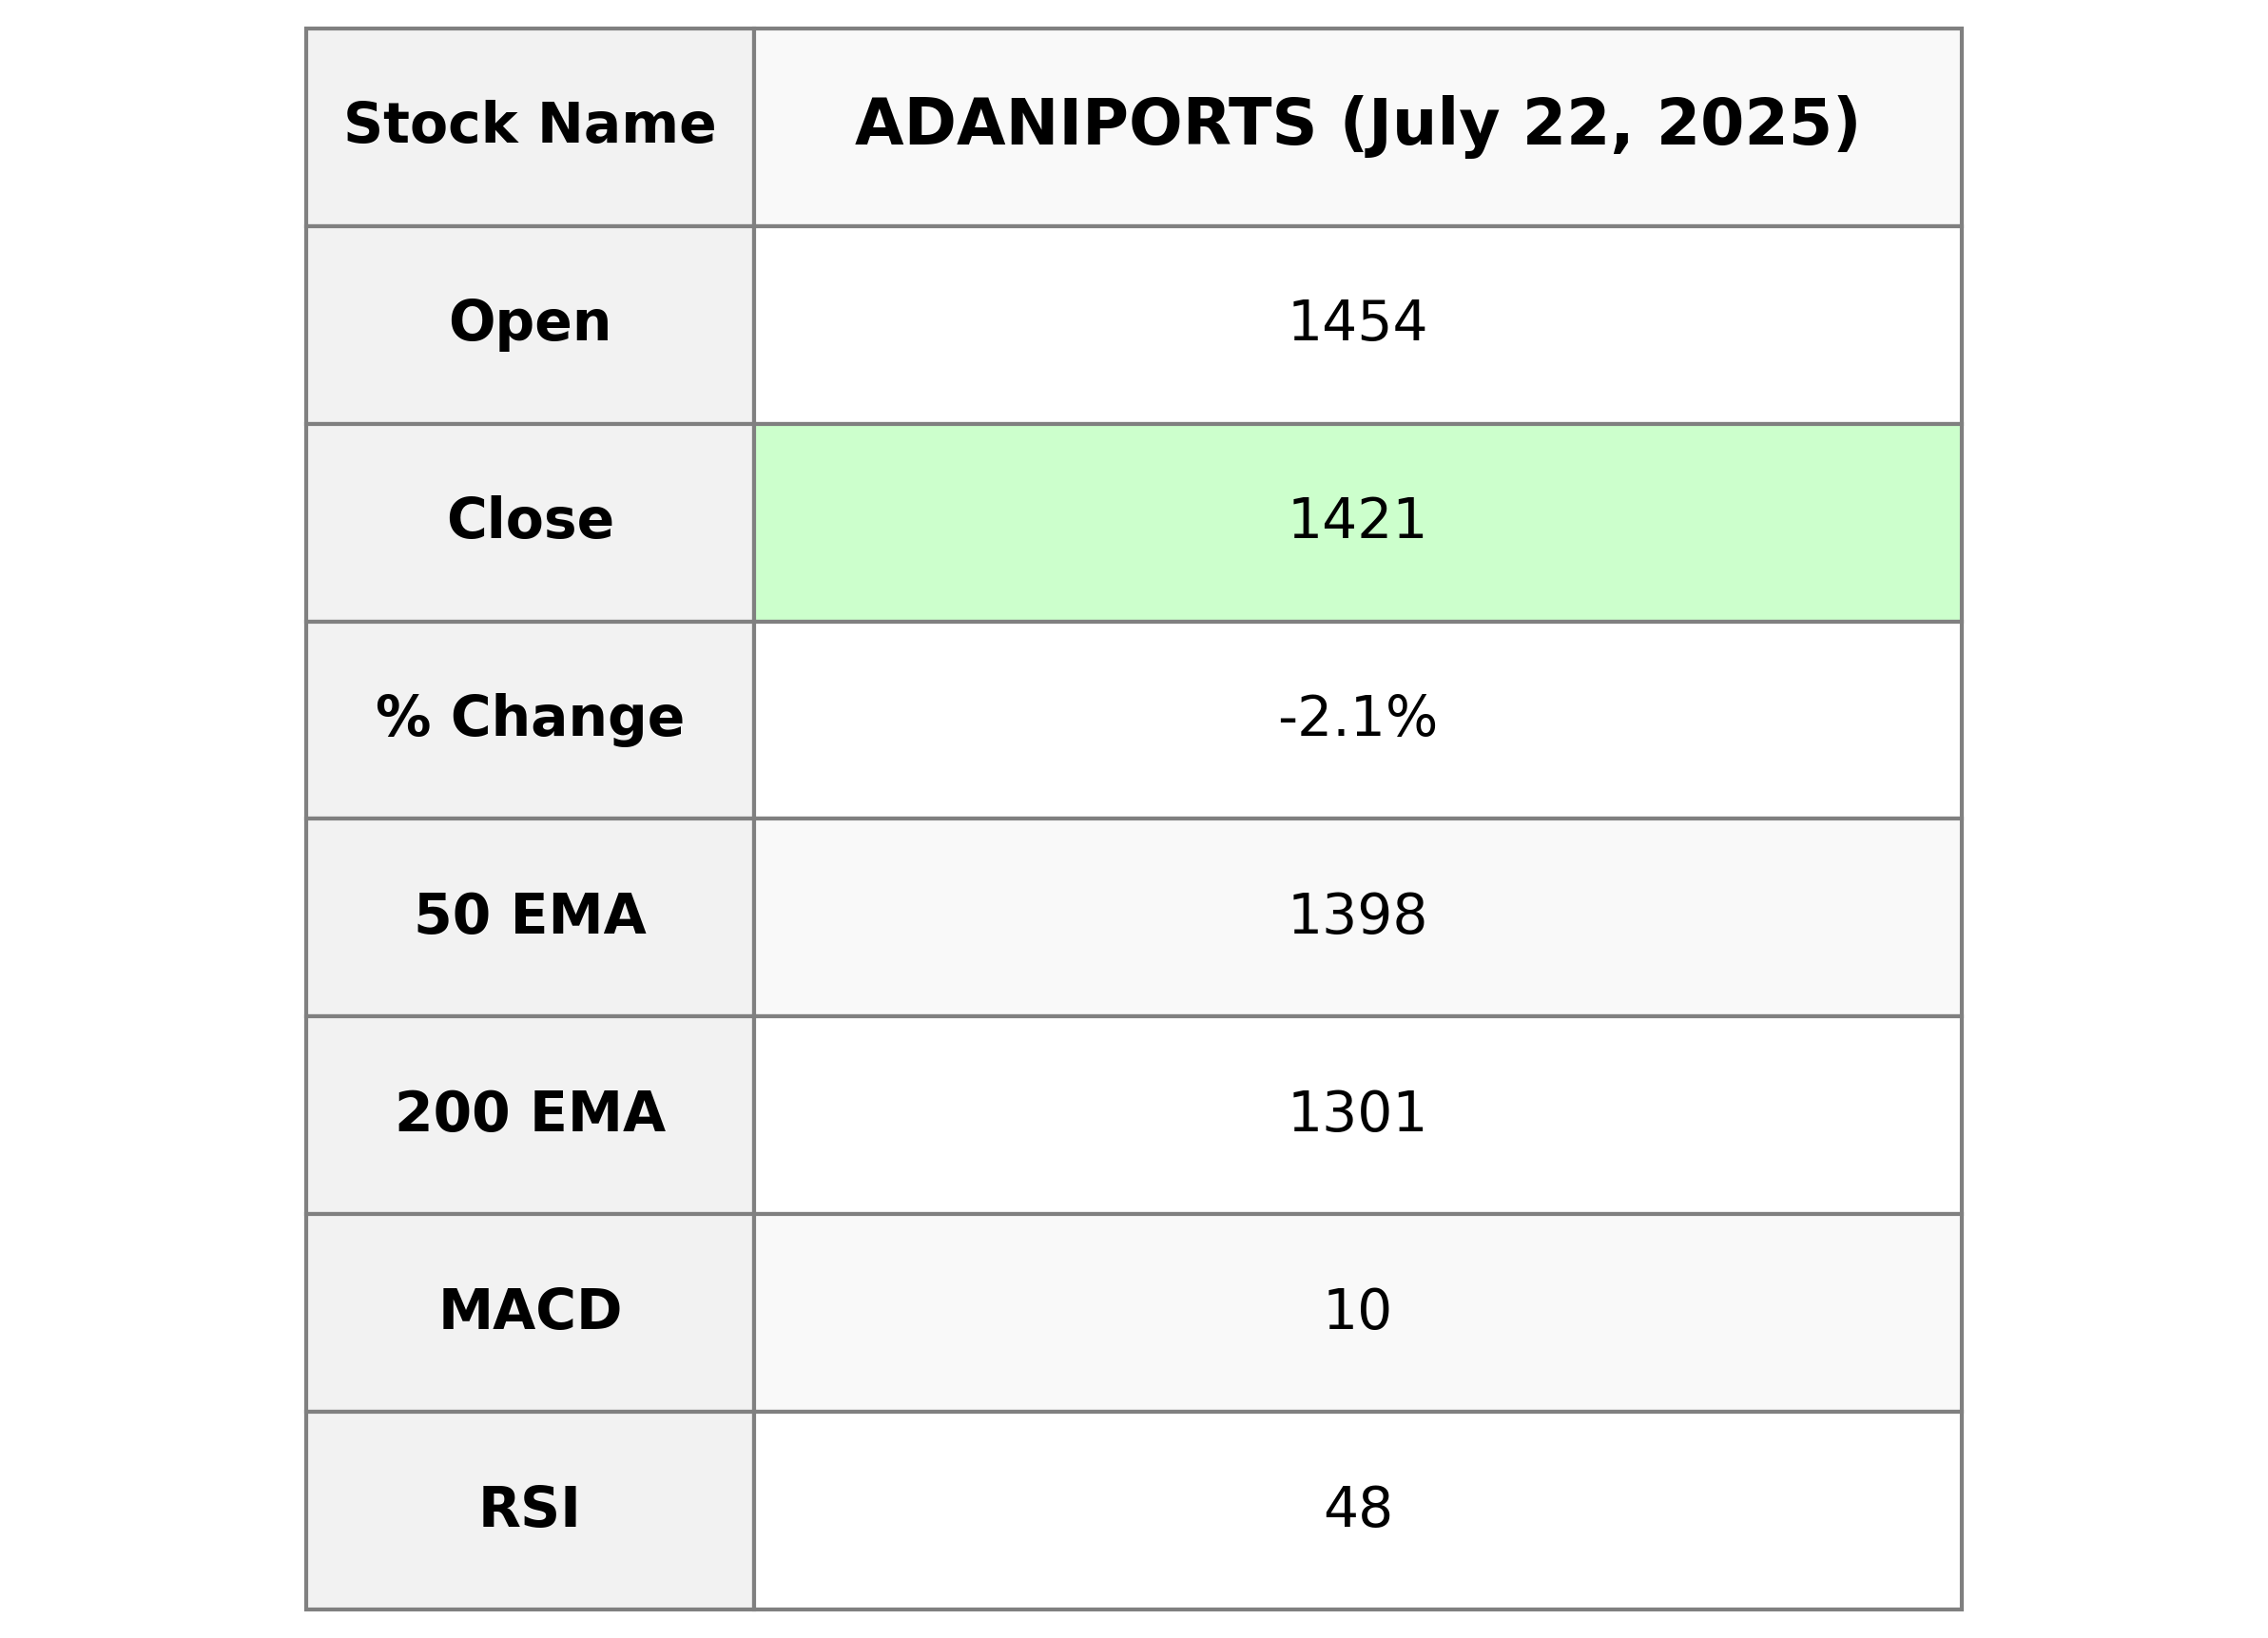
Adani Ports experienced a slight decline, closing at 1420.70, a decrease of 2.05% from the previous close of 1450.50. With a Relative Strength Index (RSI) at 47.90, it indicates a balanced momentum in the stock's performance. The company's market cap stands at approximately 3068 billion INR, highlighting its significant presence in the Industrials sector, specifically within Marine Shipping in India.
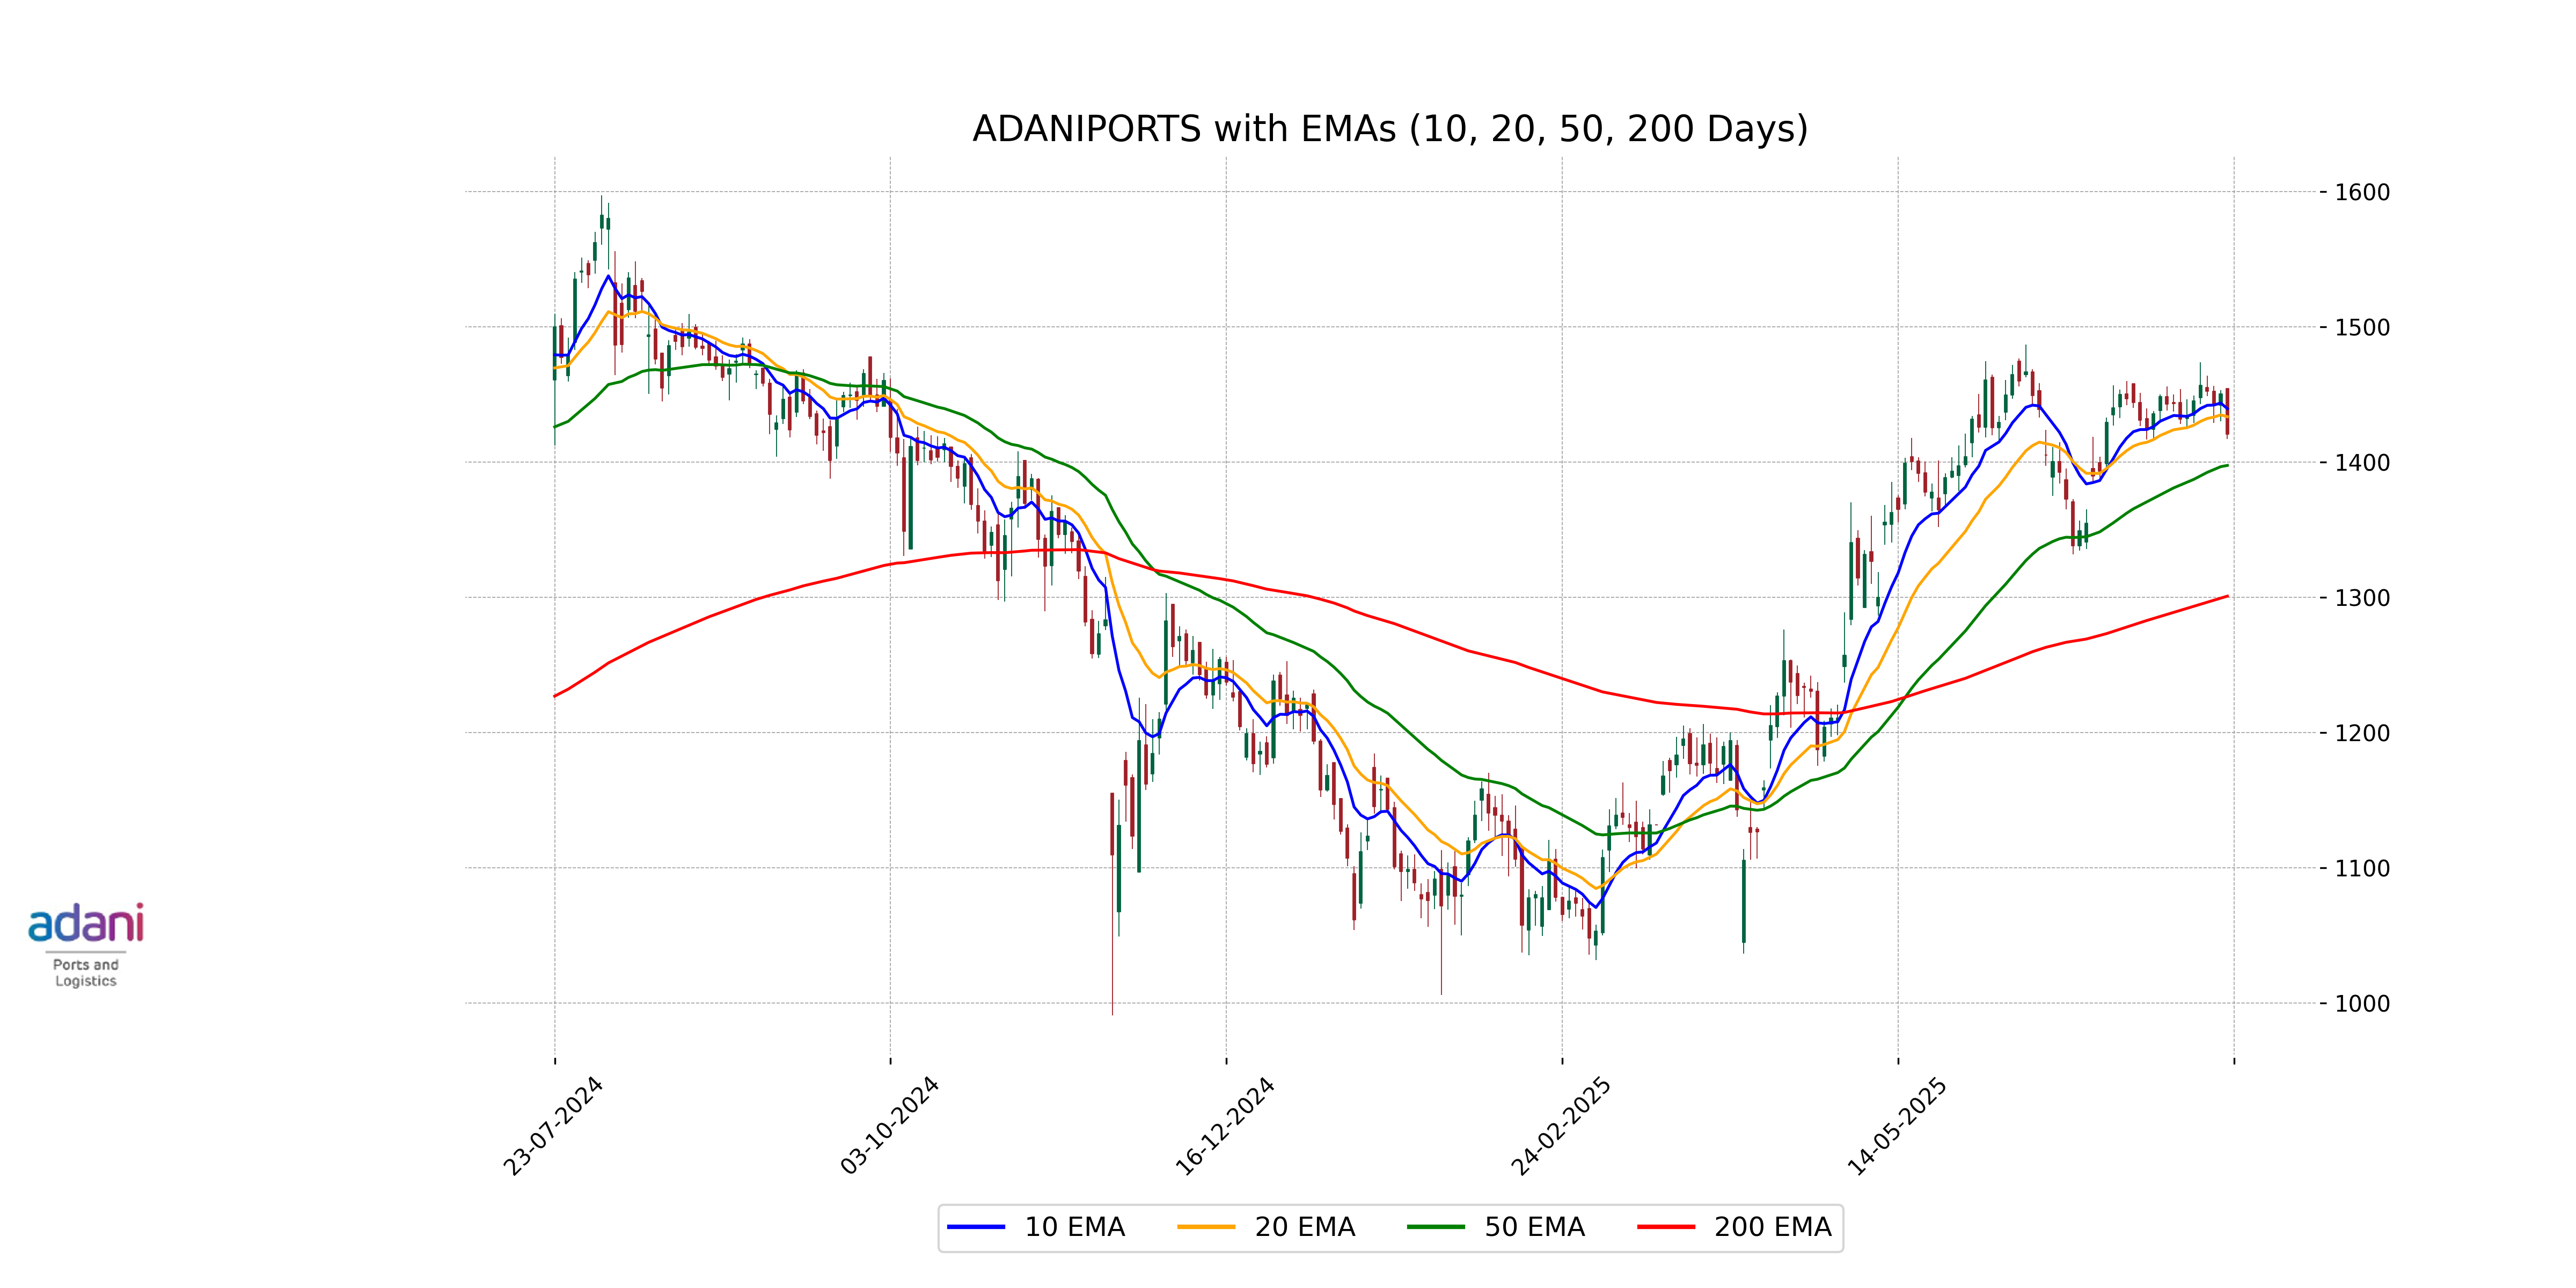
Relationship with Key Moving Averages
Adani Ports' current closing price is slightly above its 50-day EMA (1397.54) and well above the 200-day EMA (1300.84), suggesting a medium-term upward trend despite being below the 10-day (1439.52) and 20-day (1433.57) EMAs. This indicates short-term bearishness while maintaining long-term strength.
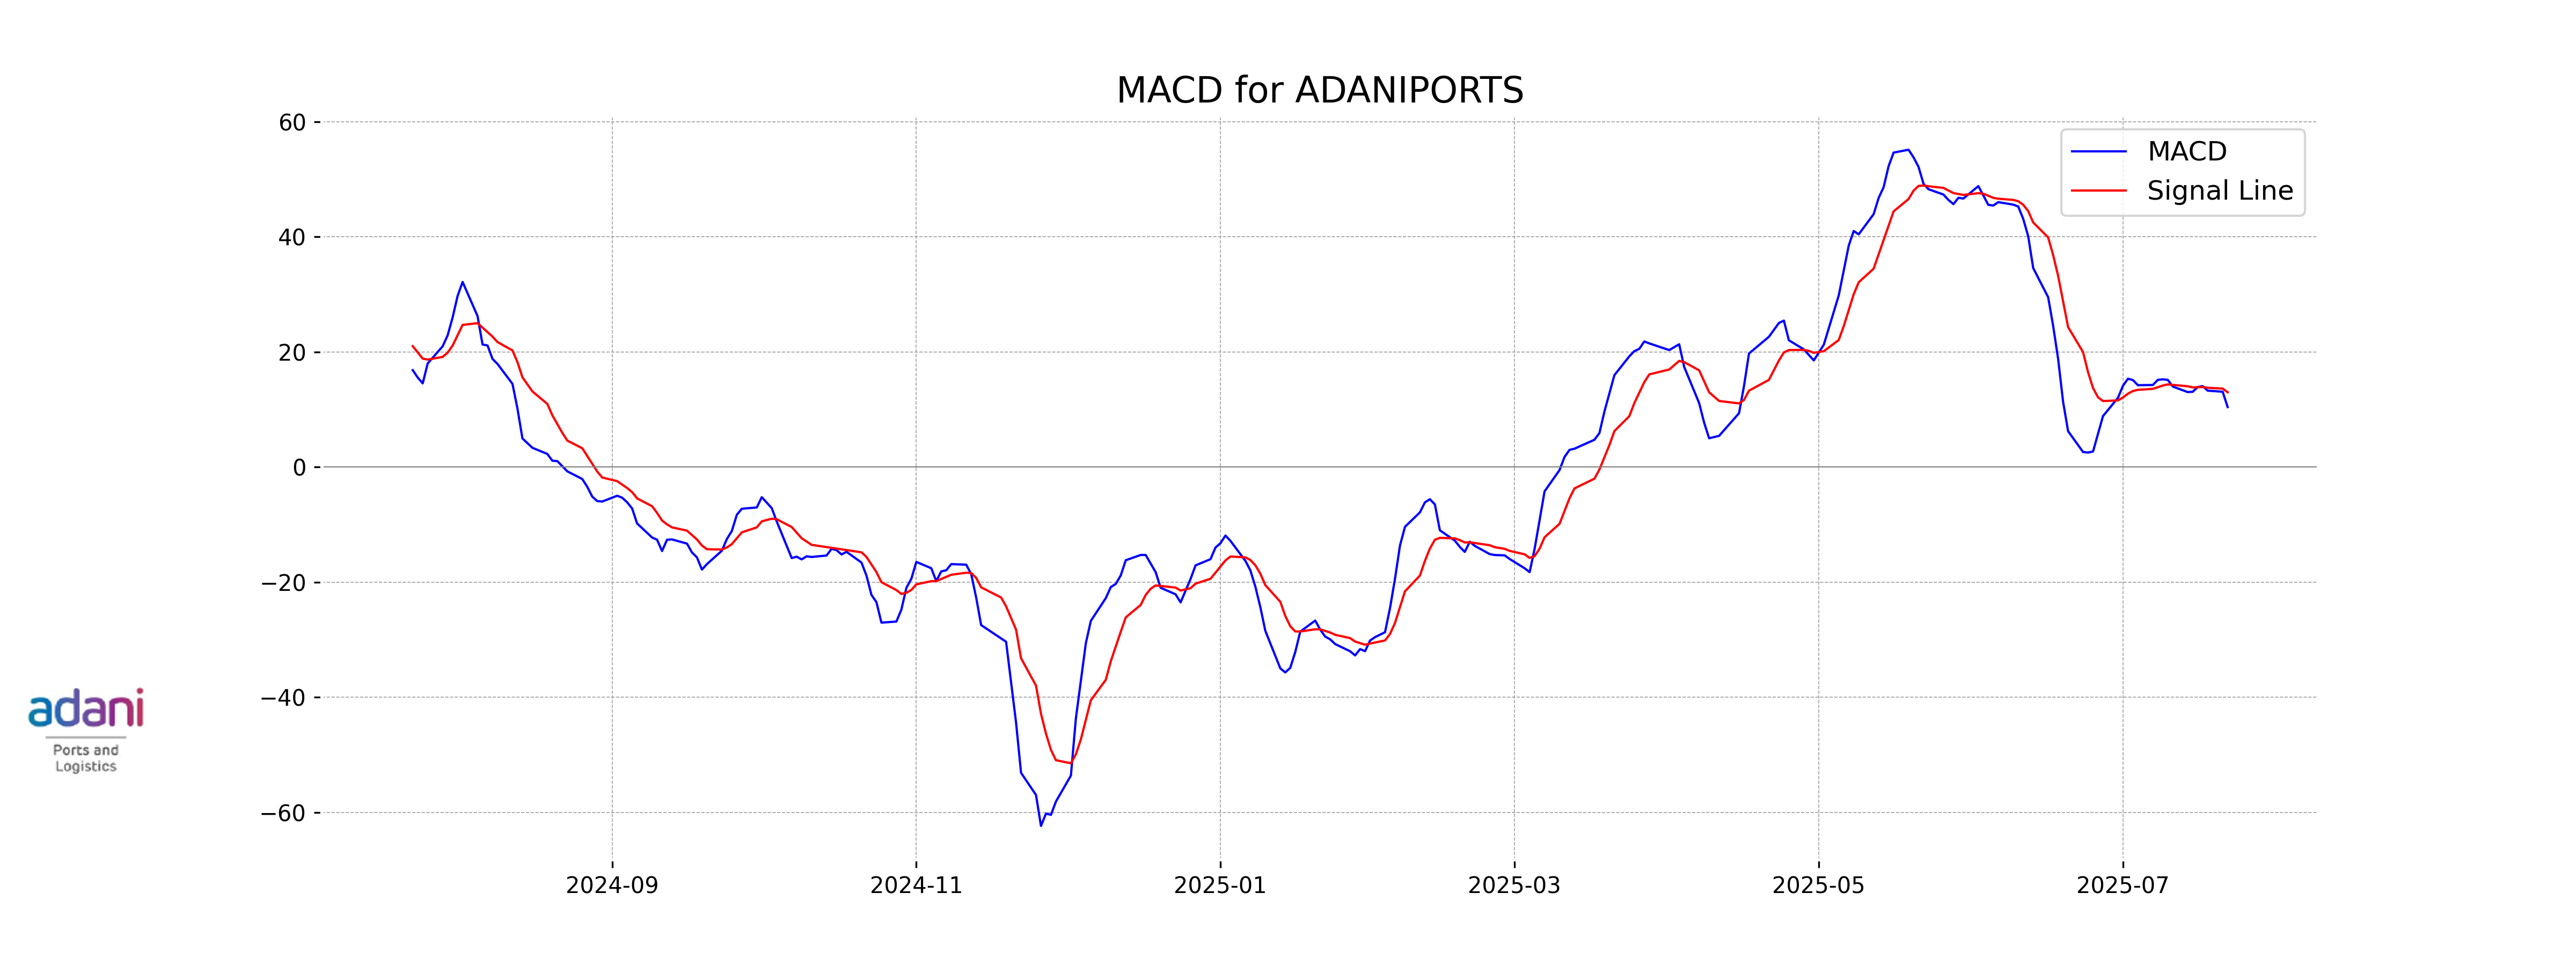
Moving Averages Trend (MACD)
The MACD (Moving Average Convergence Divergence) for Adani Ports indicates a bearish trend, as the MACD line at 10.44 is below the signal line at 13.01. This suggests a potential continuation of downward momentum in the stock price.
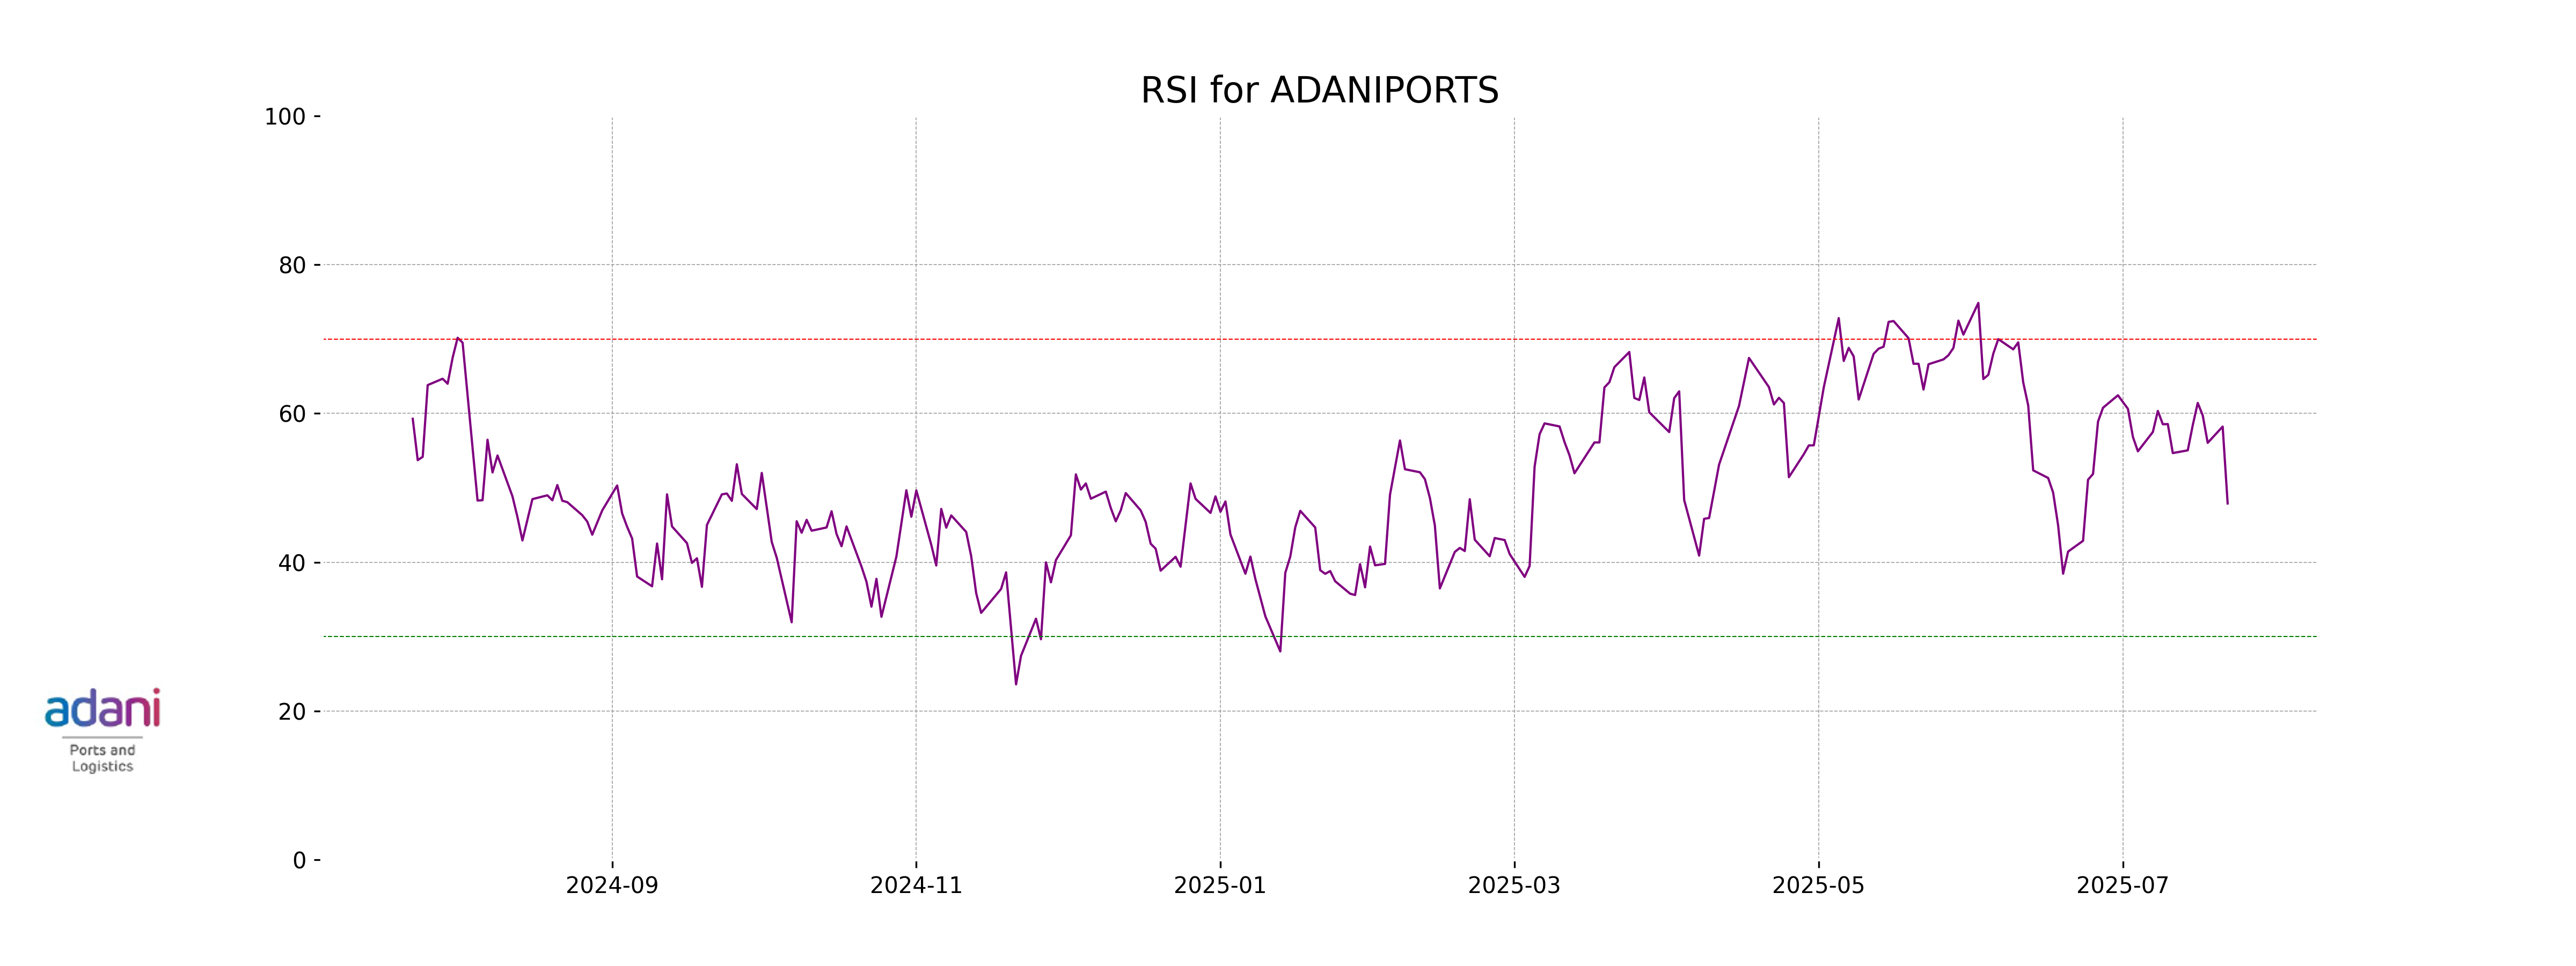
RSI Analysis
RSI Analysis for Adani Ports: With an RSI of 47.90, Adani Ports is currently in the neutral zone, indicating that neither overbought nor oversold conditions are prevailing. Investors may consider it as a potential watch for trend development or look for other indicators for a clearer signal.
Analysis for Eicher Motors - July 22, 2025
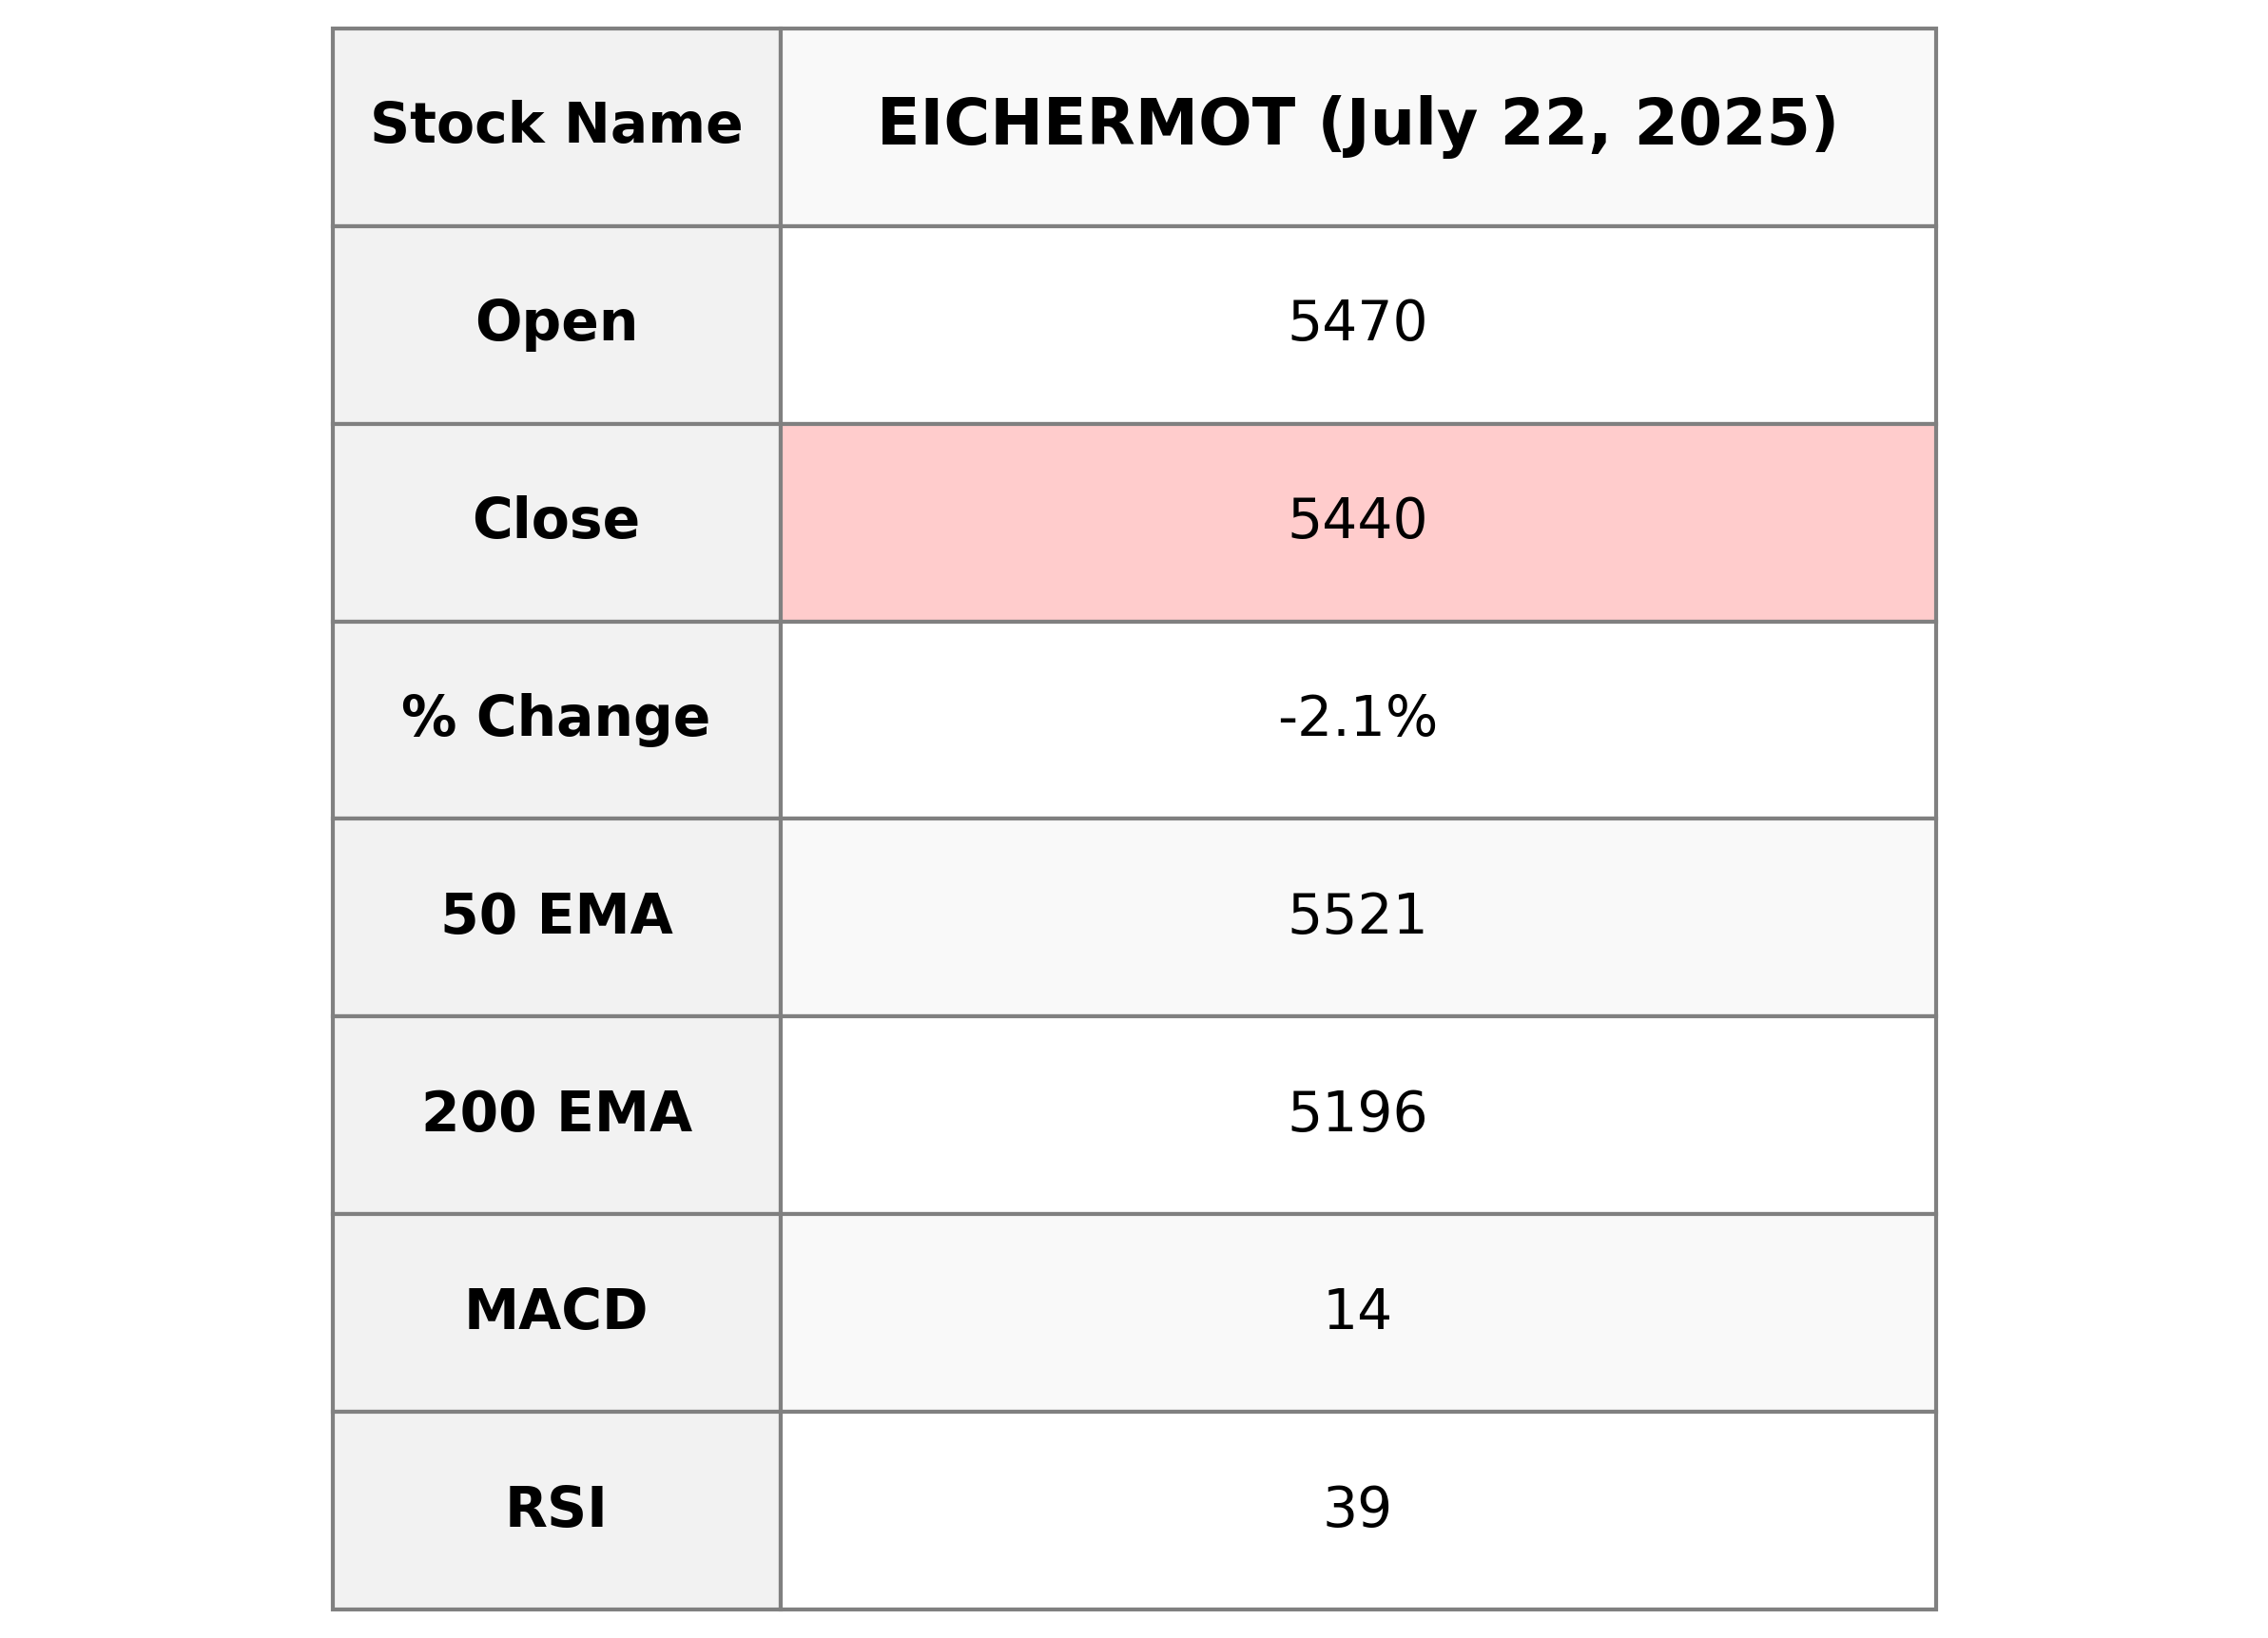
Eicher Motors Performance Eicher Motors' stock showed a downward trend, closing at 5439.5 compared to its previous close of 5558. This decline is reflected in the percentage change of -2.13% and a points change of -118.5. The relative strength index (RSI) of 38.99 indicates that the stock might be approaching an oversold condition. Furthermore, both the 10 EMA and 20 EMA are above the closing price, suggesting the stock is currently below its recent averages. The company operates within the Consumer Cyclical sector, specifically in the Auto Manufacturers industry in India.
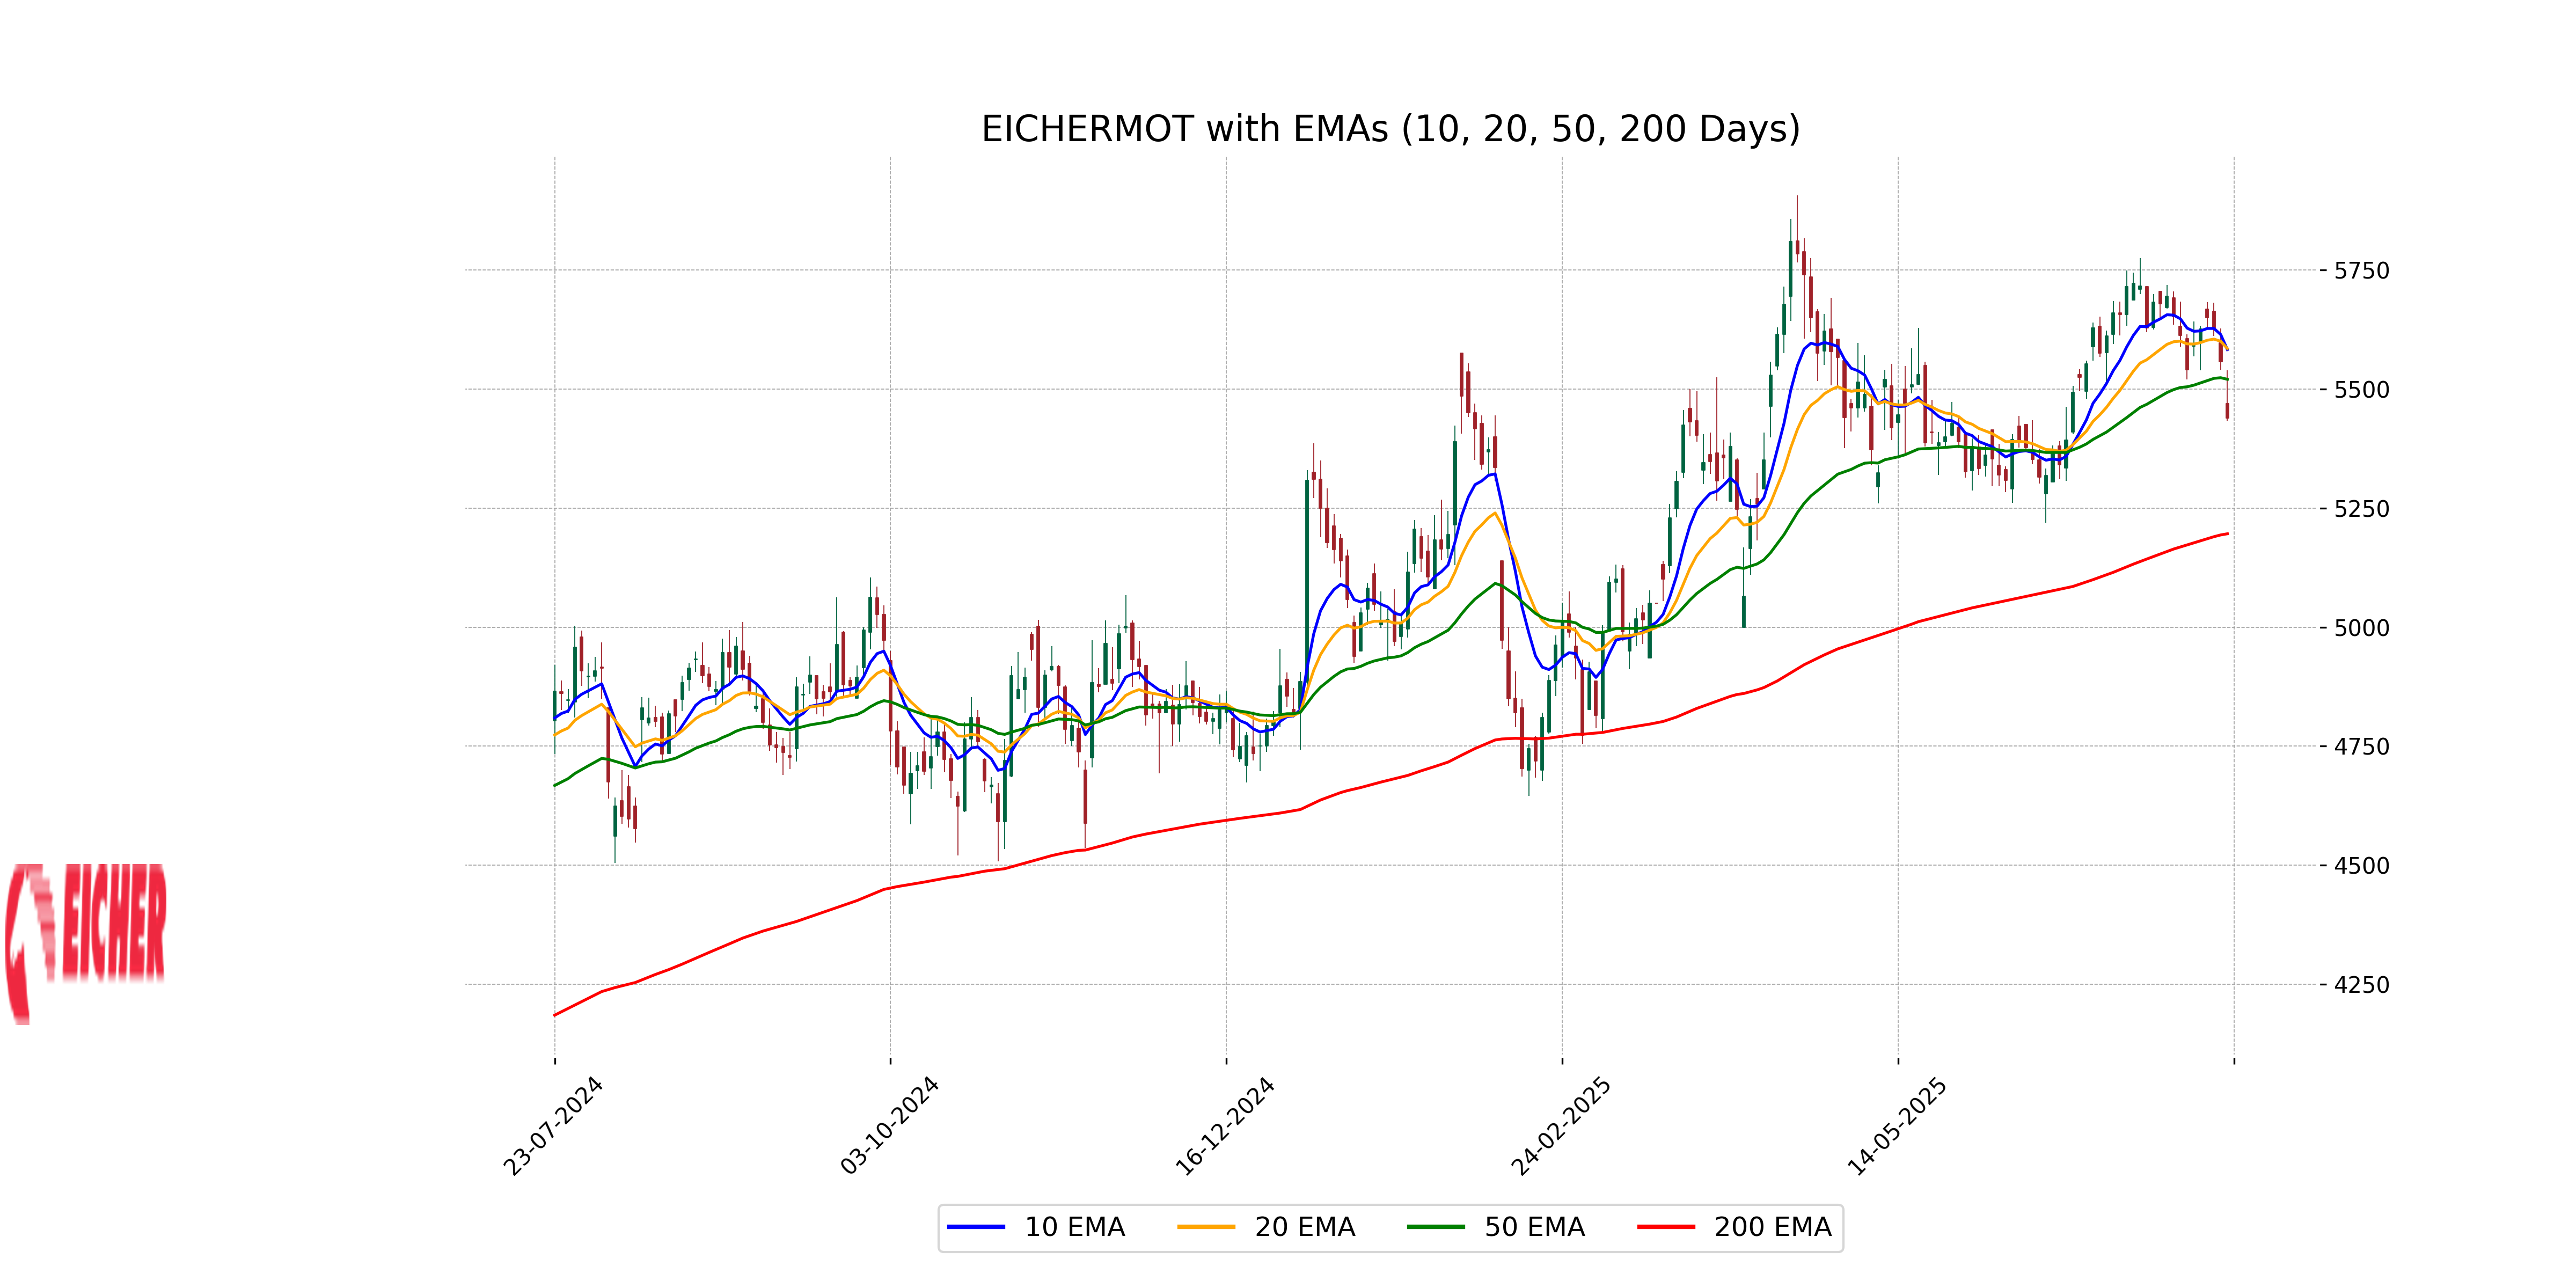
Relationship with Key Moving Averages
Eicher Motors is currently trading below its key moving averages, with the stock price at 5439.5 against the 50-day EMA of 5520.61 and the 10-day EMA of 5582.89. This indicates a short-term bearish trend, as the price has also fallen below the 20-day EMA of 5585.18.
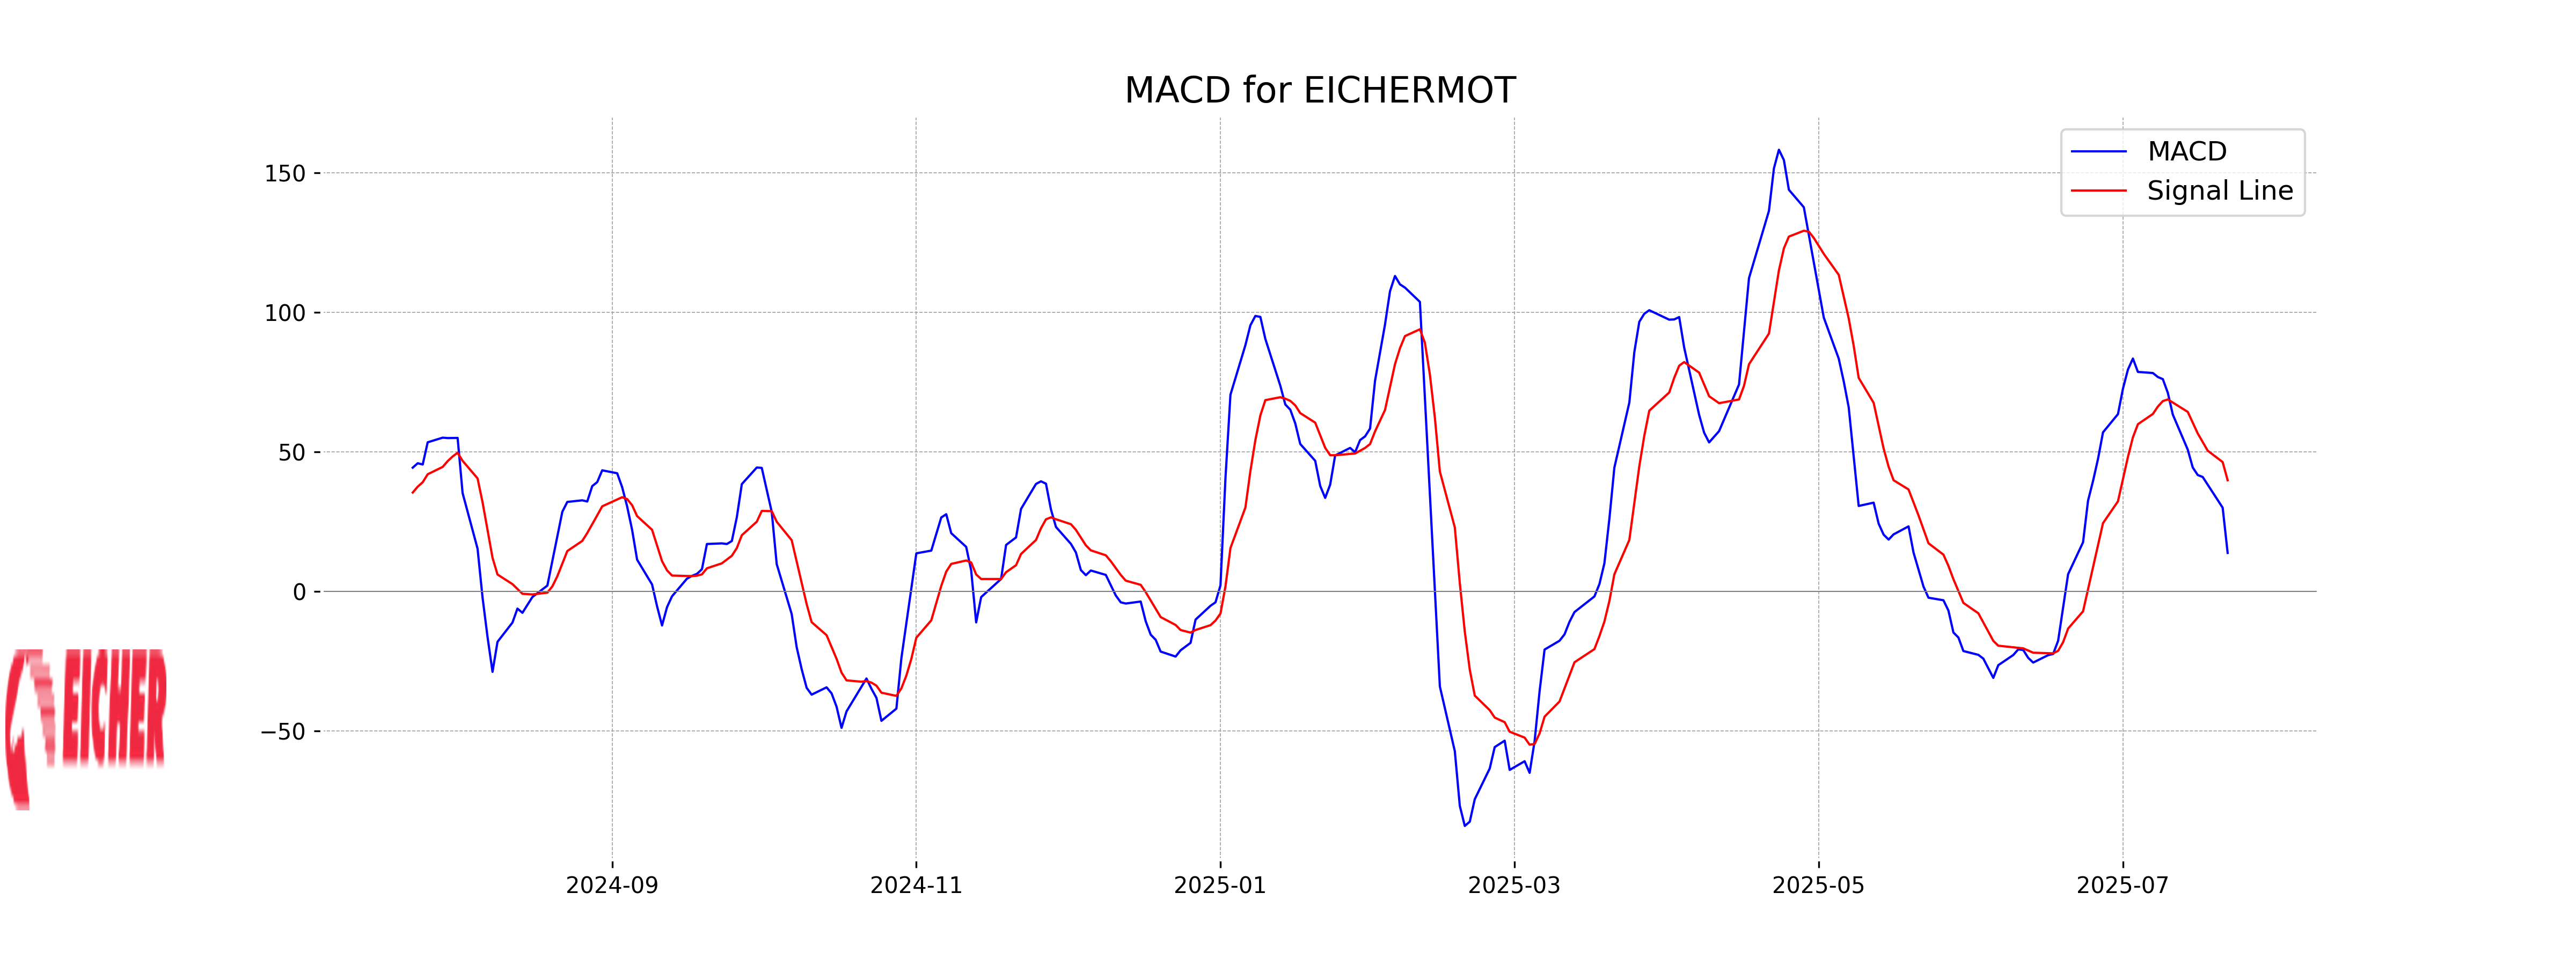
Moving Averages Trend (MACD)
Eicher Motors' MACD is 13.81, which is currently below the MACD Signal of 39.86. This indicates a bearish momentum as the MACD line is below the signal line, suggesting that the stock might experience further downward pressure.
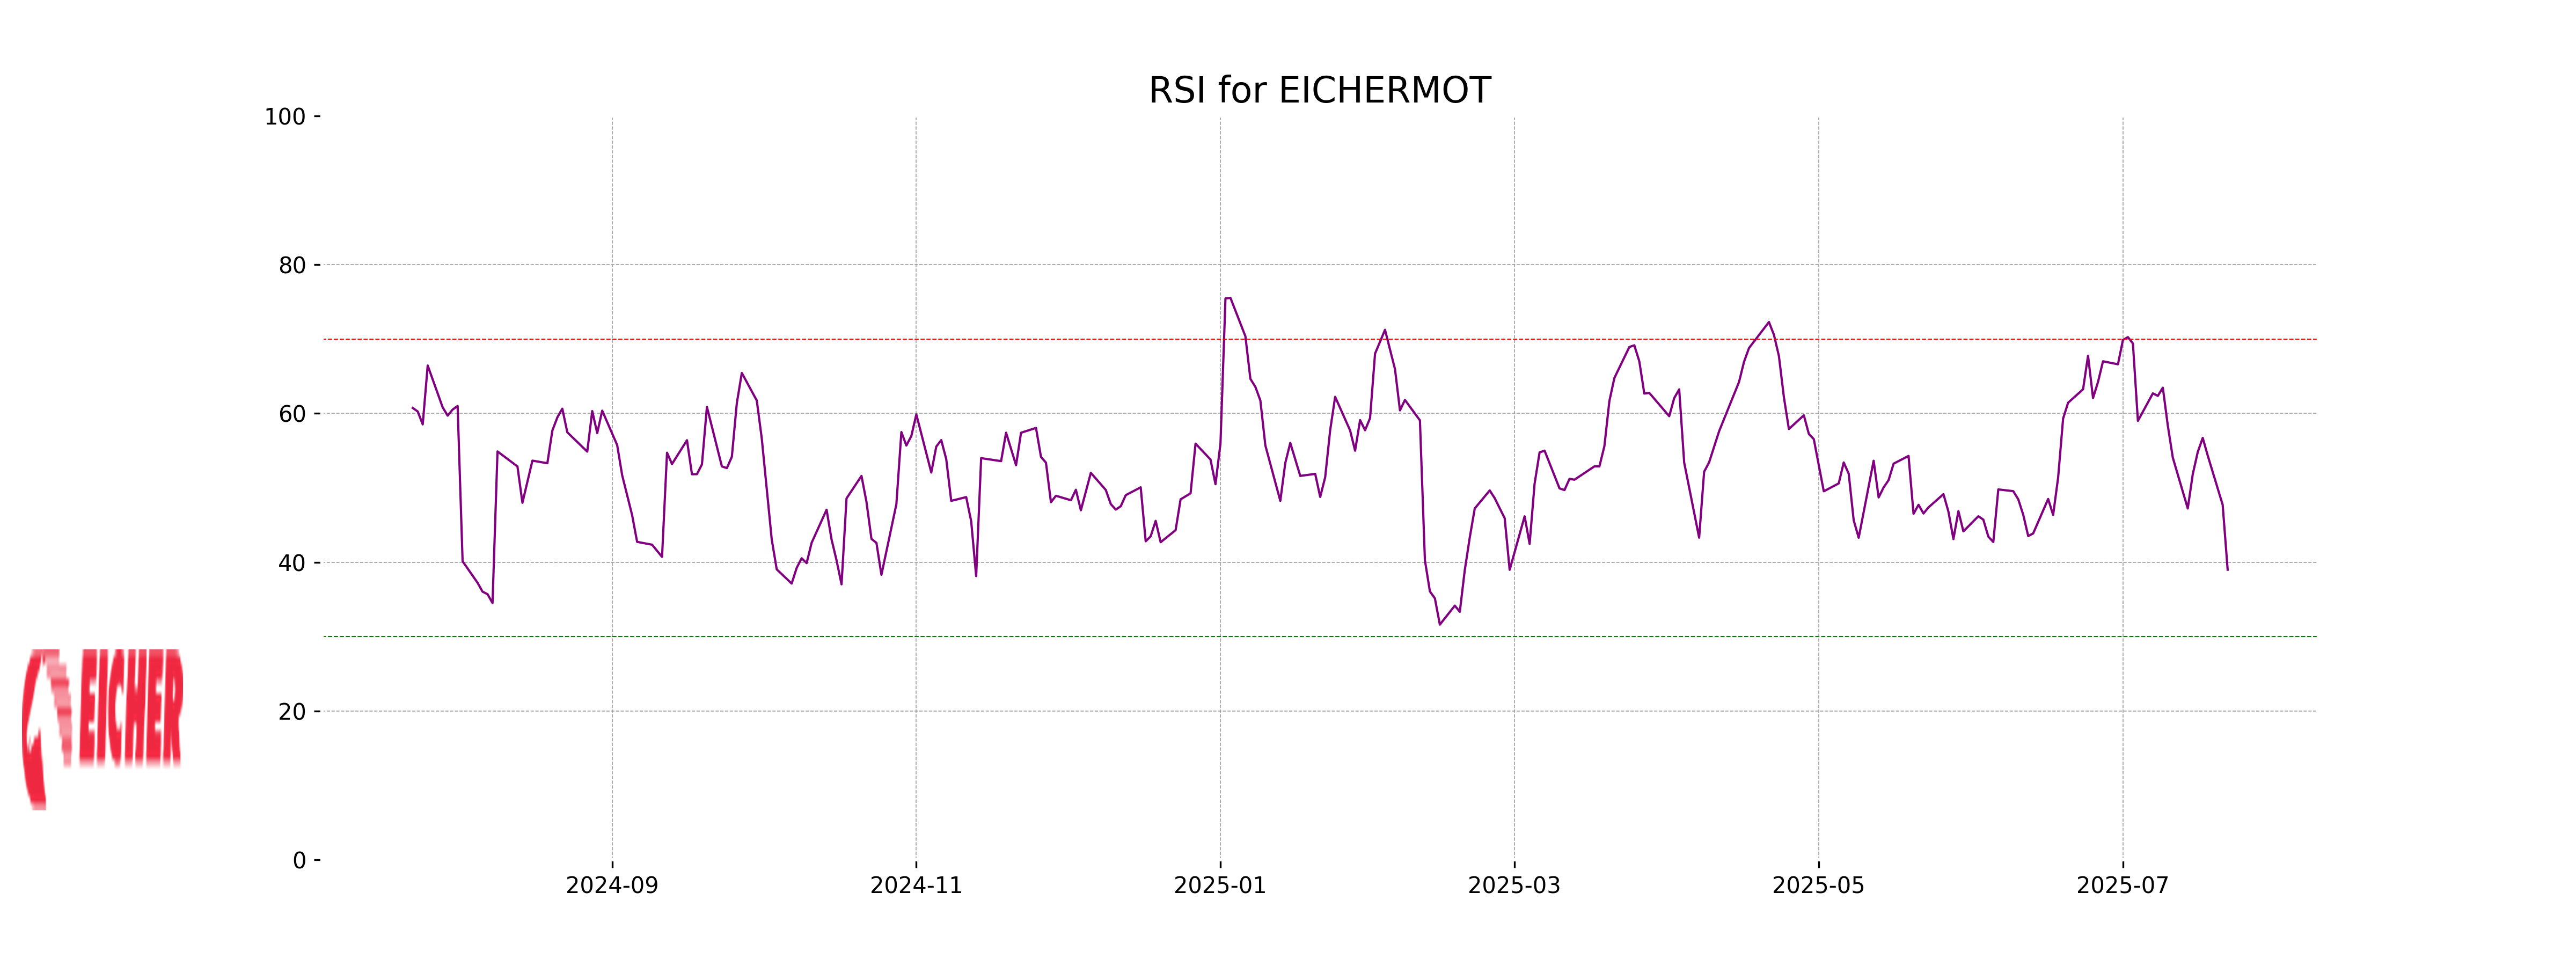
RSI Analysis
The RSI (Relative Strength Index) for Eicher Motors is 38.99, indicating that the stock is approaching an oversold territory. An RSI below 30 typically suggests that a stock is oversold, while an RSI above 70 suggests it is overbought. As Eicher Motors is close to the oversold threshold, it may be considered undervalued by some investors.
Analysis for Shriram Finance - July 22, 2025

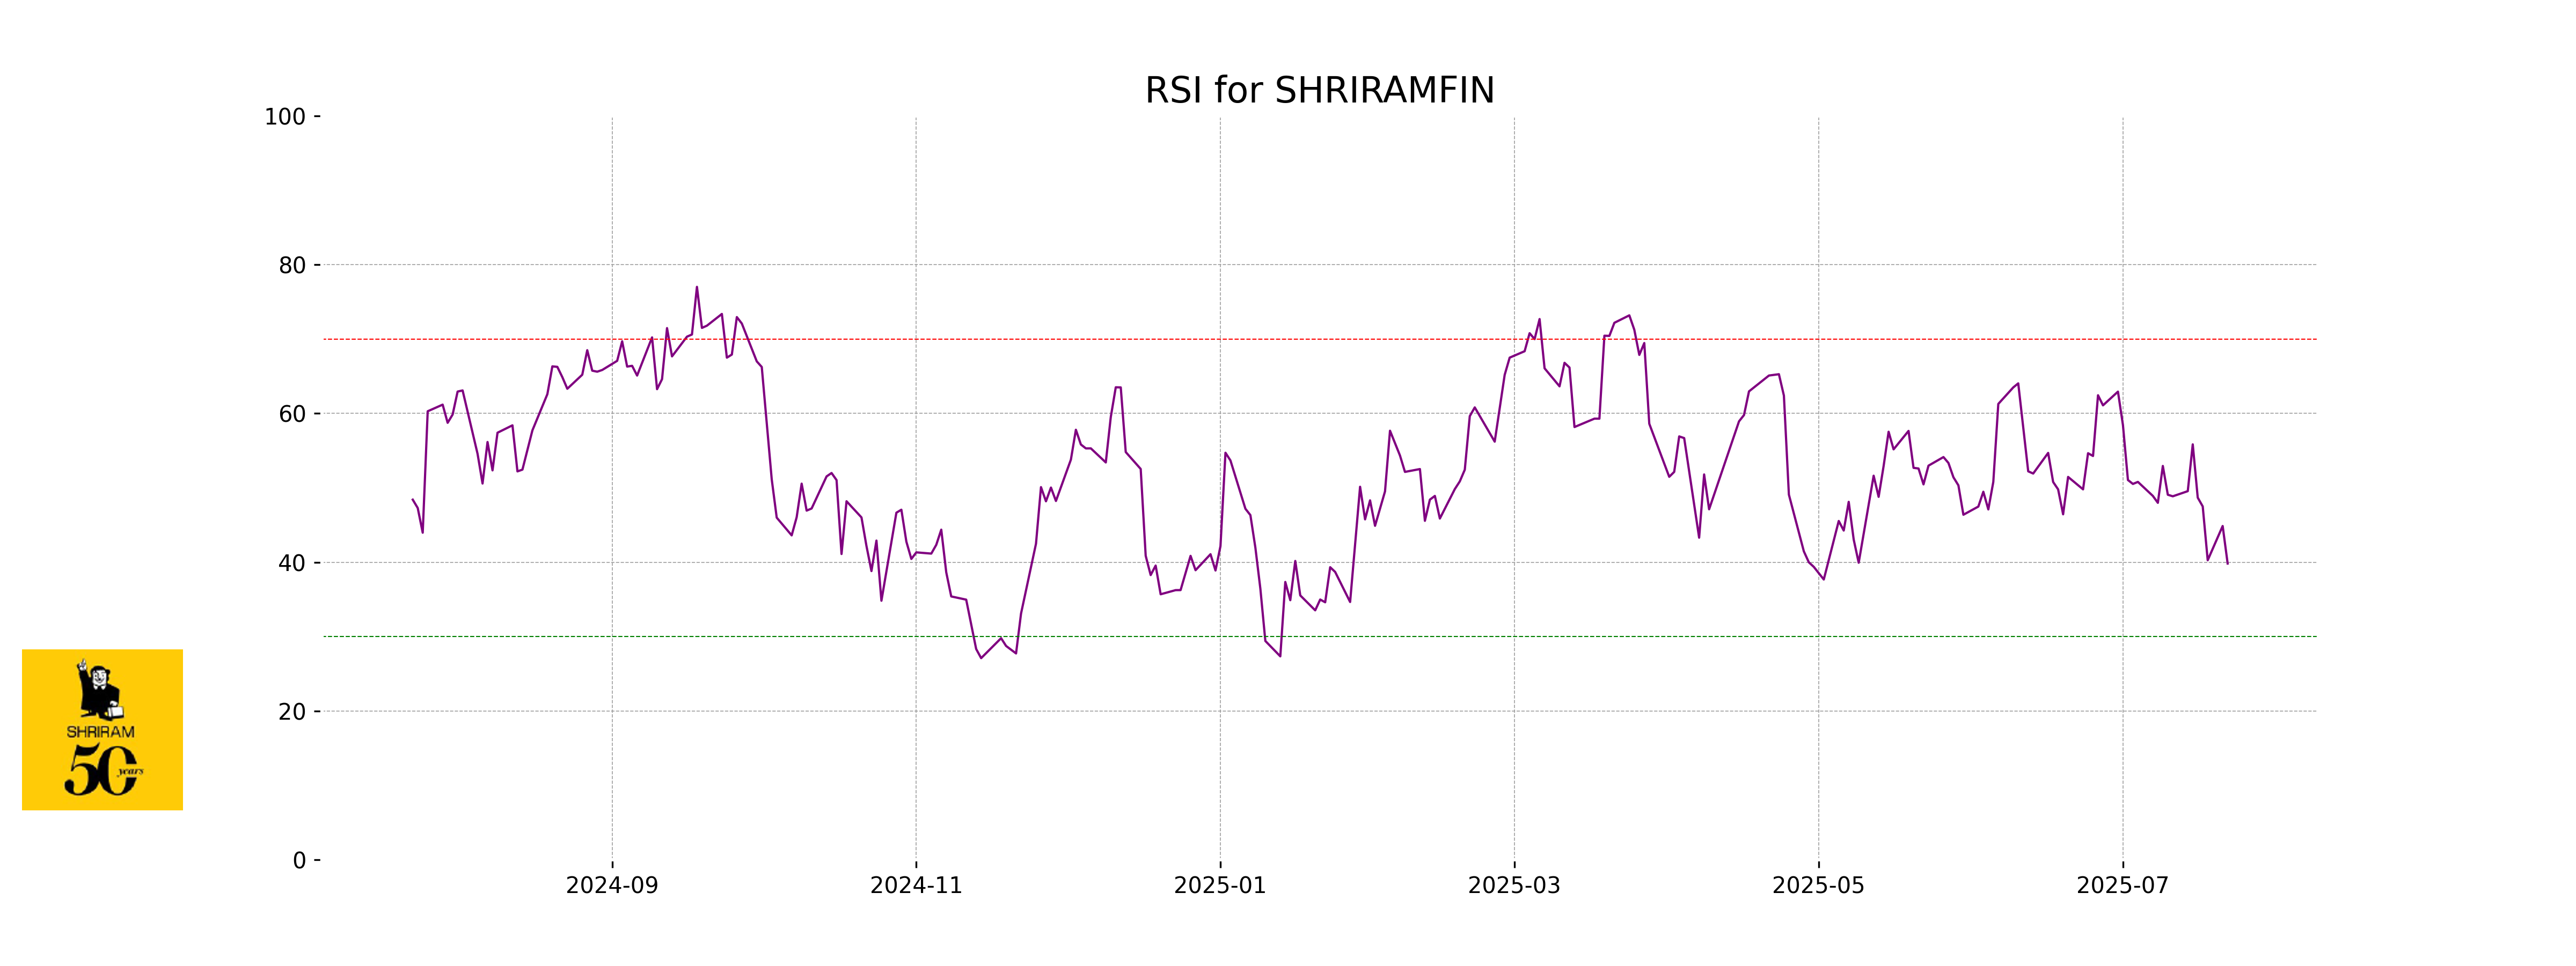
Shriram Finance: Shriram Finance experienced a decline in its stock price, closing at 640.15 INR, down from the previous 655.65 INR—a drop of 2.36%. Despite a significant trading volume of 4,670,322 shares, the technical indicators such as RSI (39.82) and MACD suggest bearish momentum. Positioned within the financial services sector, specifically credit services, the company has a market cap of 1,232.63 billion INR and a PE ratio of 12.78.
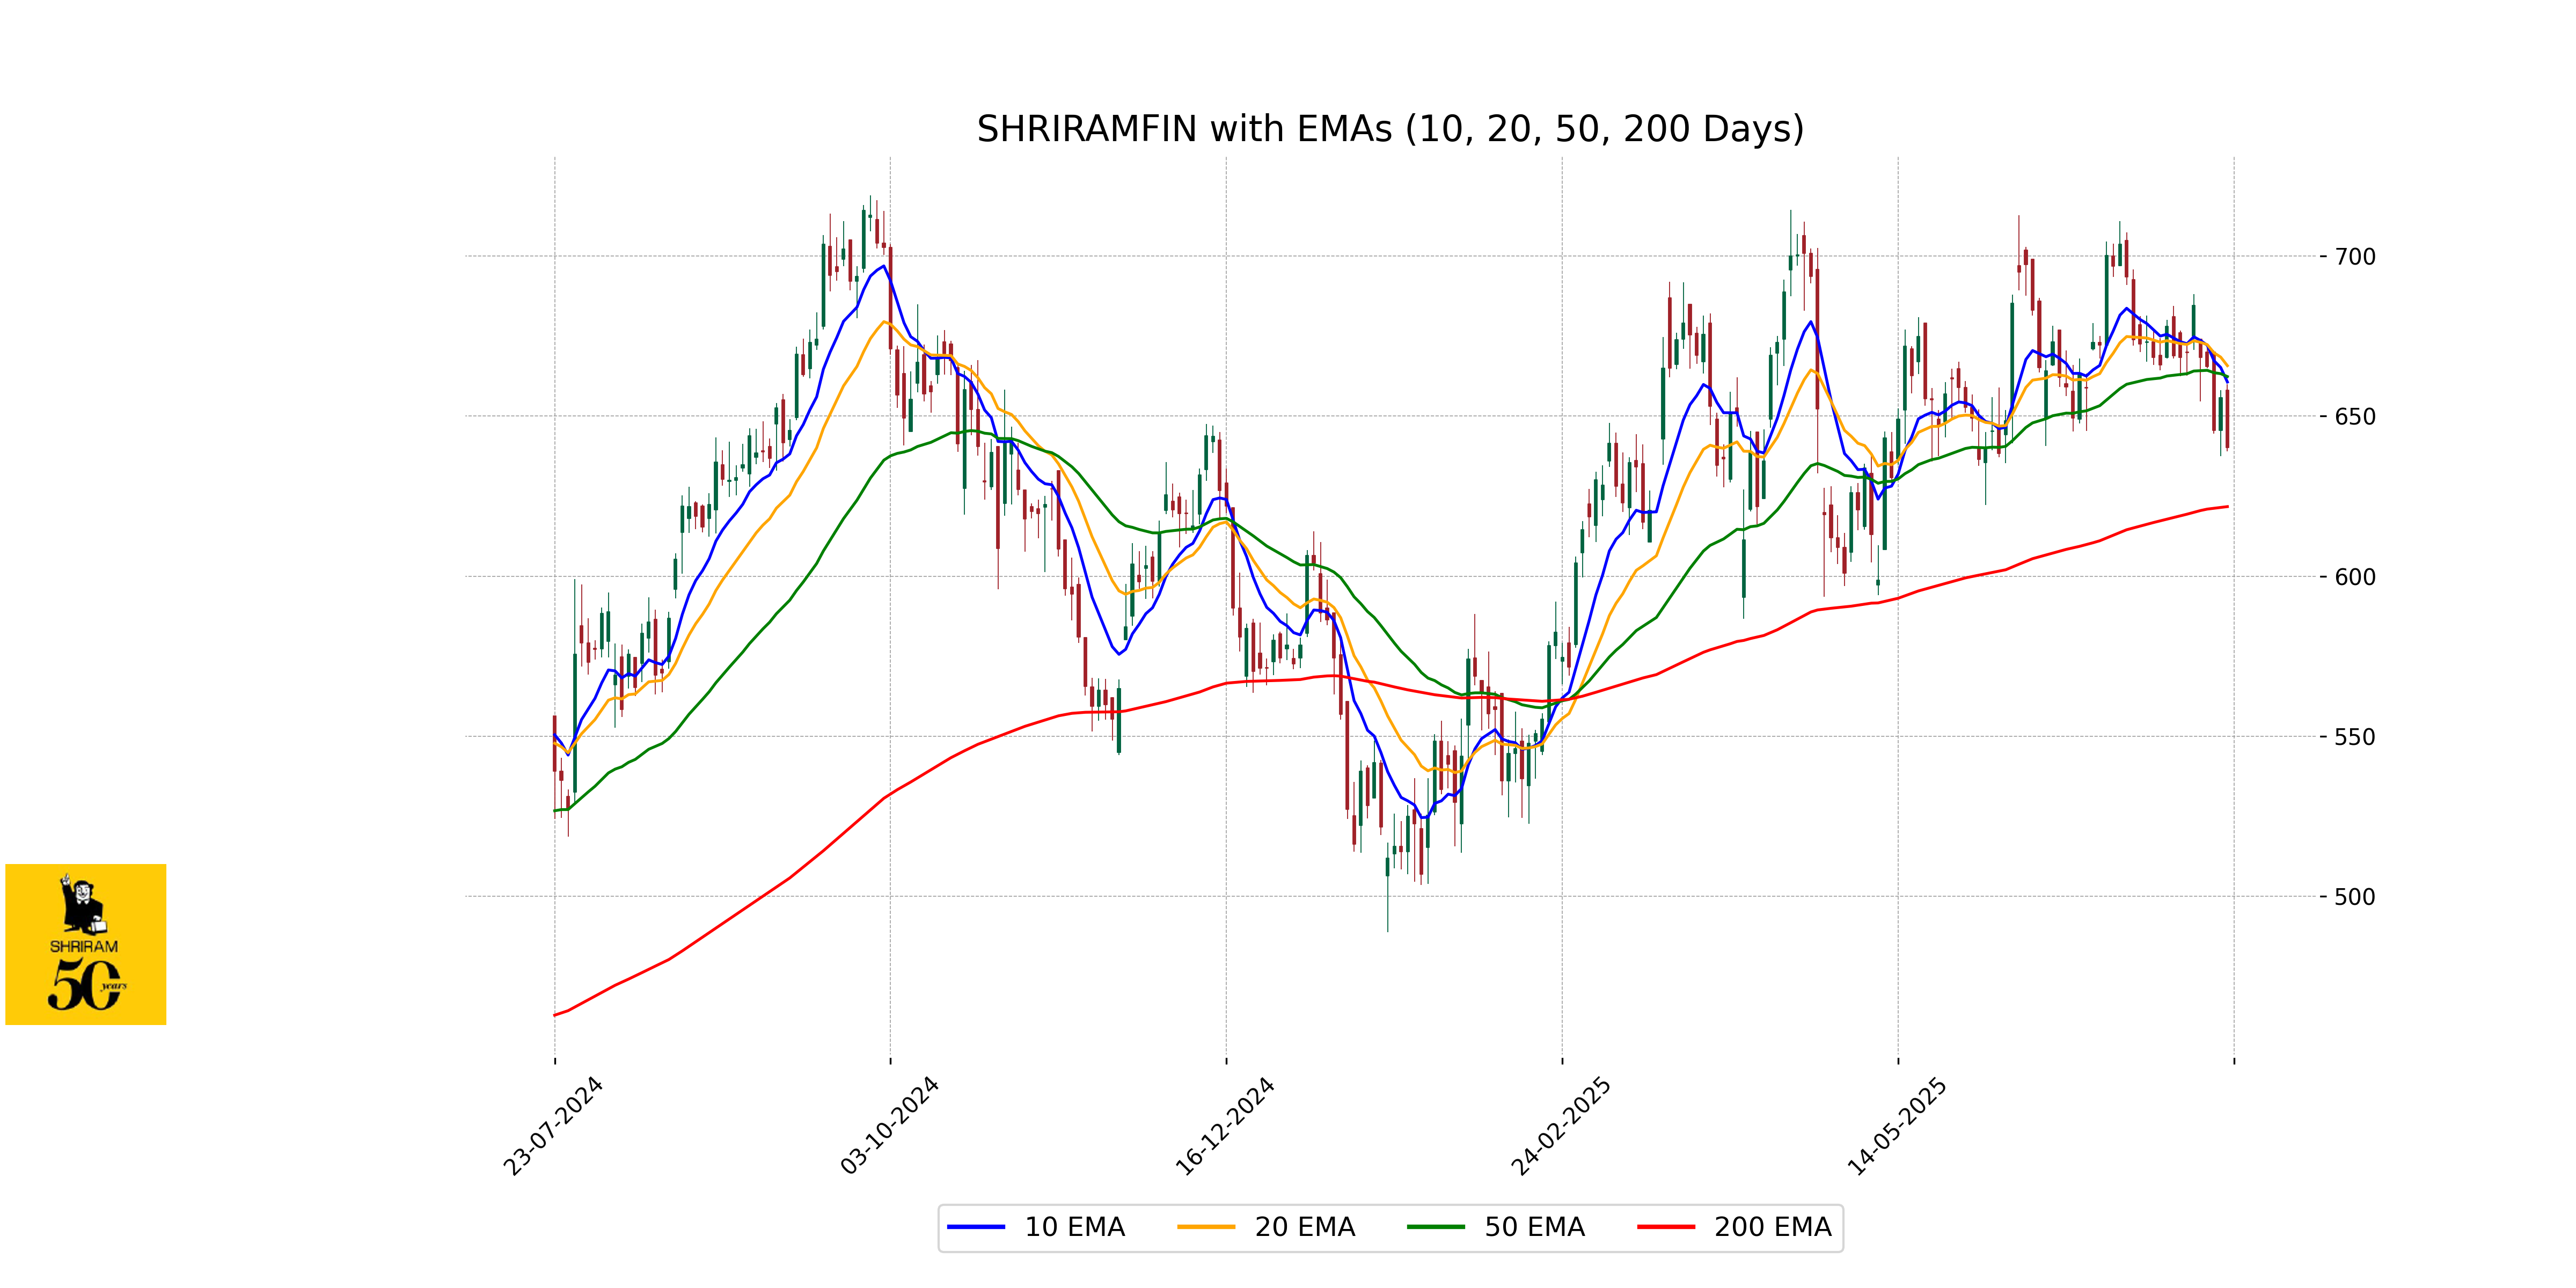
Relationship with Key Moving Averages
Shriram Finance's current close price of 640.15 is below its 10-day EMA (660.60), 20-day EMA (665.69), and 50-day EMA (662.30), indicating a bearish trend in the short to medium term. Compared to its 200-day EMA of 621.70, the stock is trading above, suggesting a long-term bullish trend relative to its broader time frame.
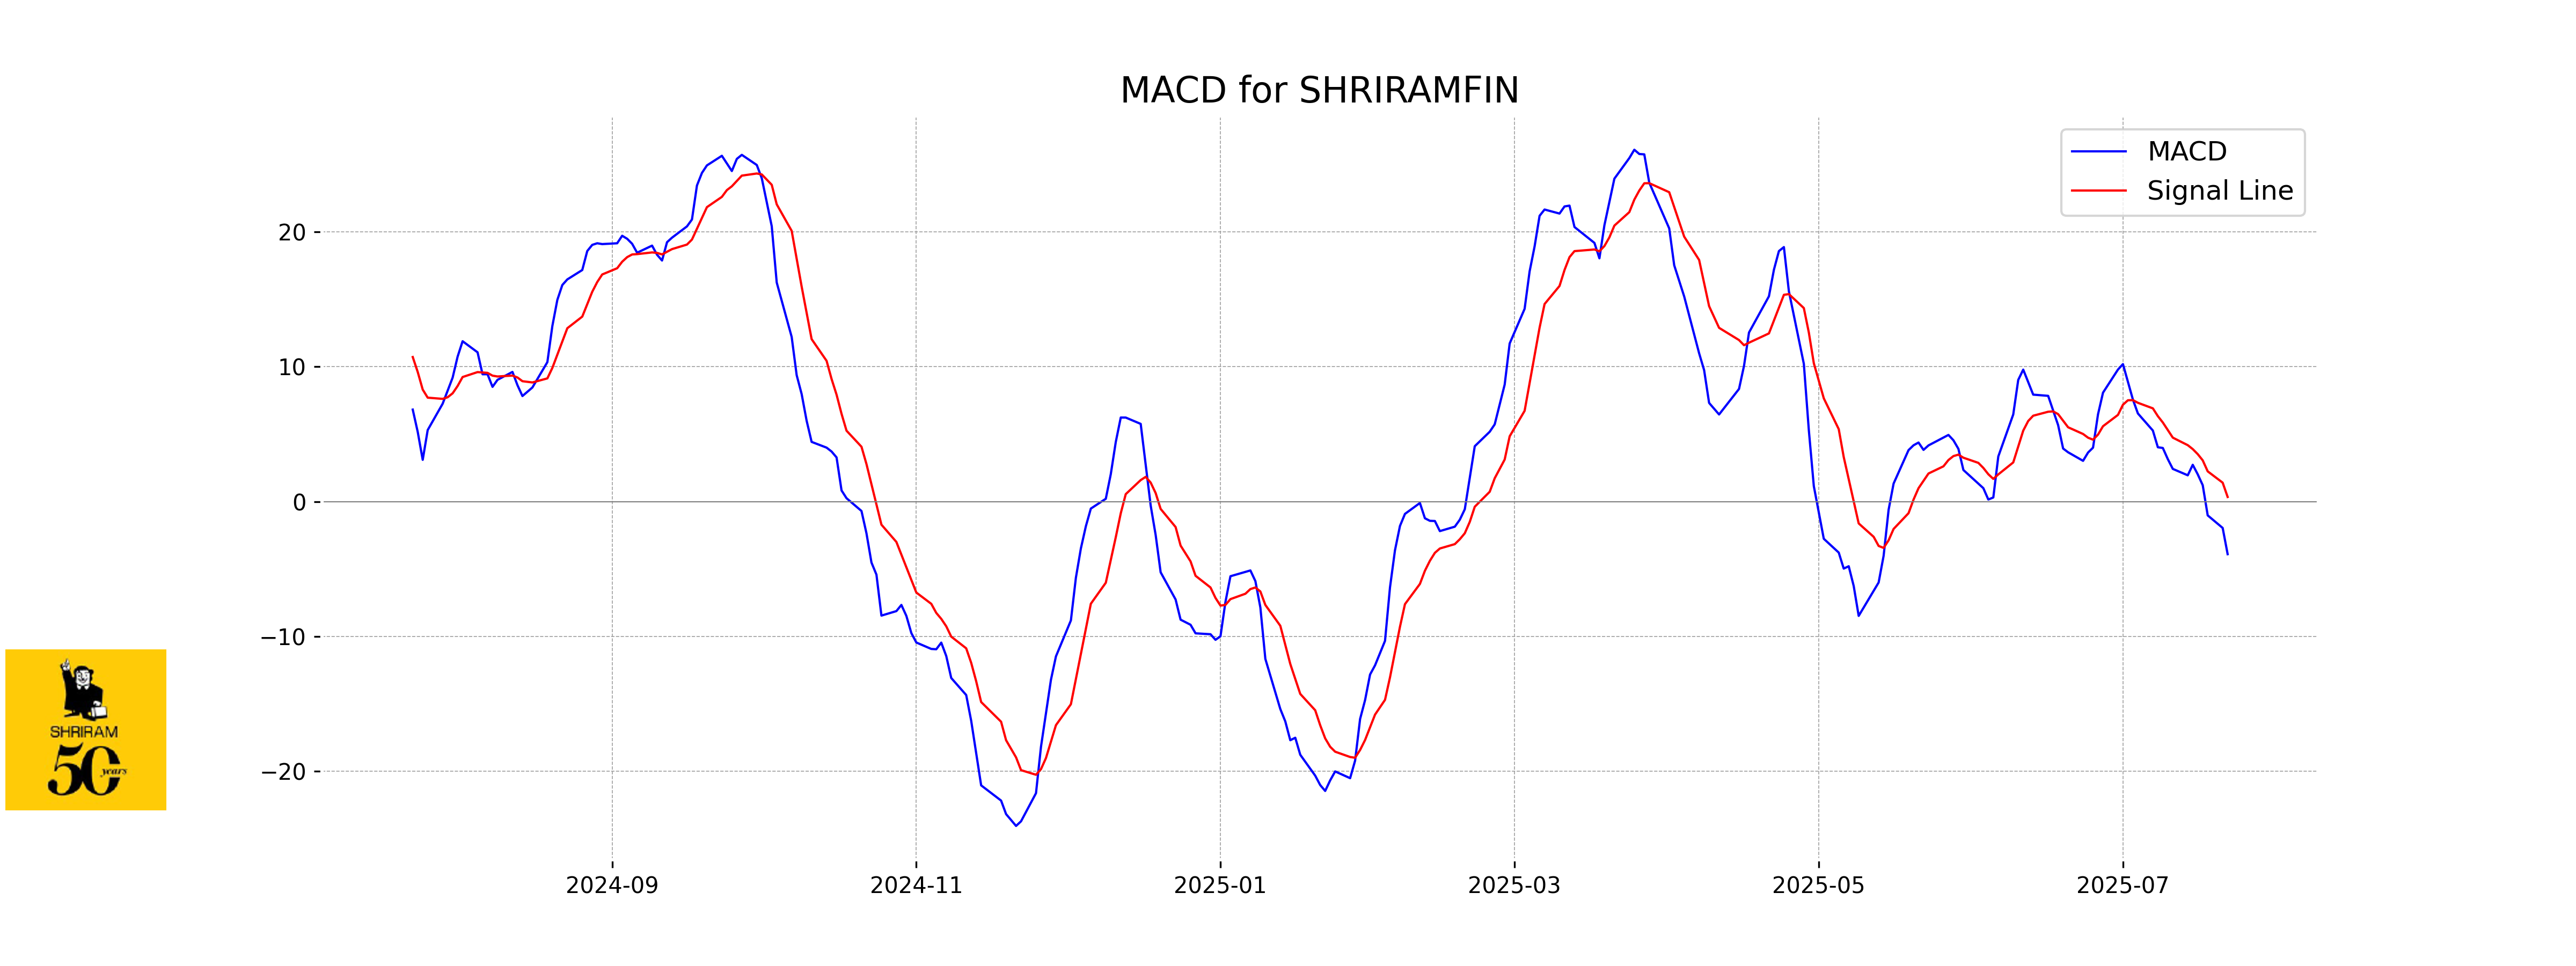
Moving Averages Trend (MACD)
MACD Analysis for Shriram Finance: The MACD line is currently at -3.90, which is below the MACD Signal line at 0.34. This suggests that the stock is experiencing bearish momentum, indicating potential short-term downward pressure. Monitoring the MACD trend for possible reversals or further declines would be prudent for traders.
RSI Analysis
Certainly, here's the RSI analysis for Shriram Finance: The Relative Strength Index (RSI) for Shriram Finance is at 39.82, which indicates that the stock is nearing the oversold territory. Typically, an RSI below 30 suggests that the stock is oversold, and while Shriram Finance is not quite there, it may suggest a potential buying opportunity if this trend continues.
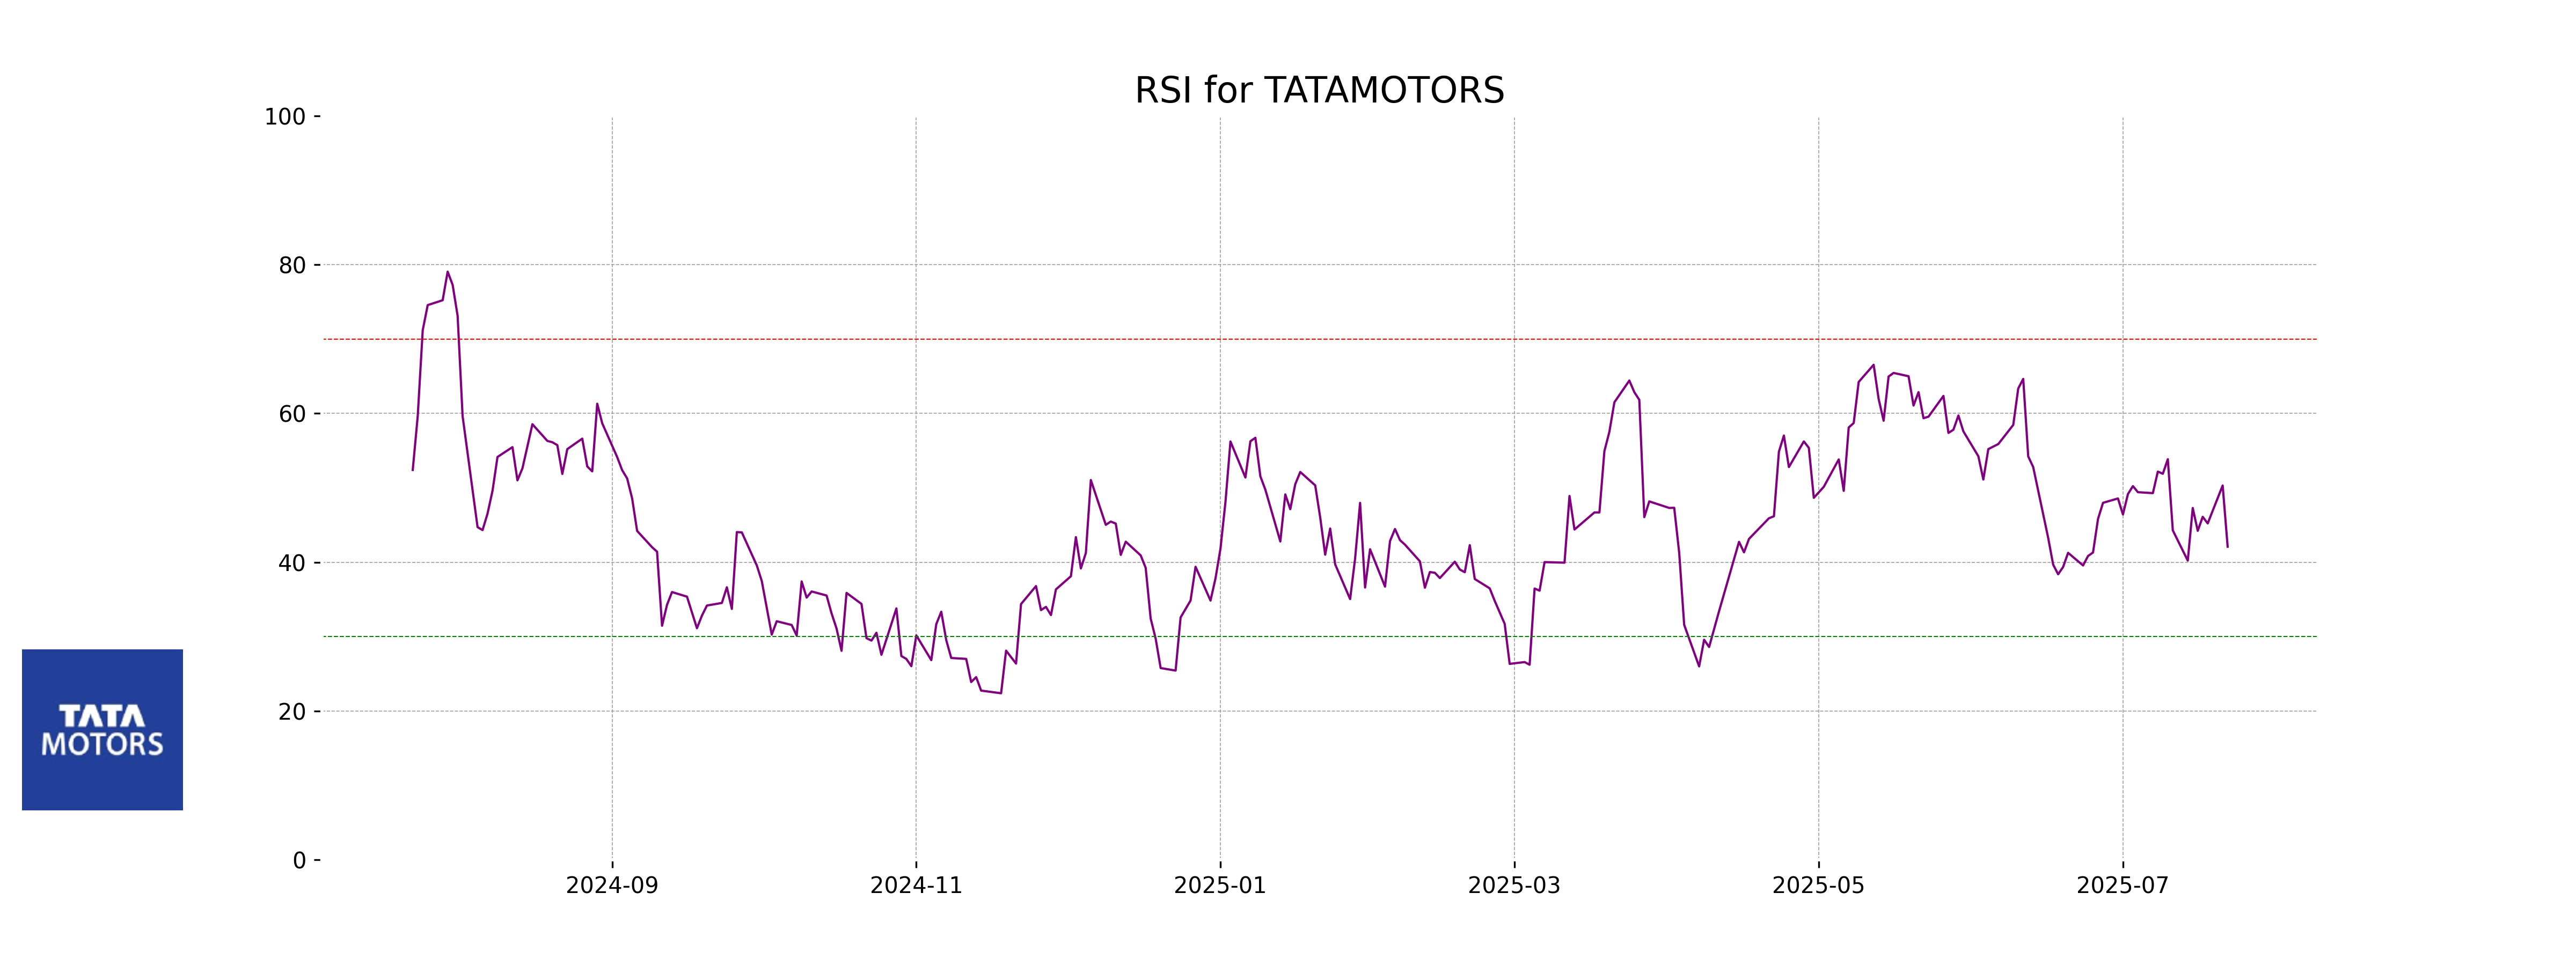
Analysis for Tata Motors - July 22, 2025
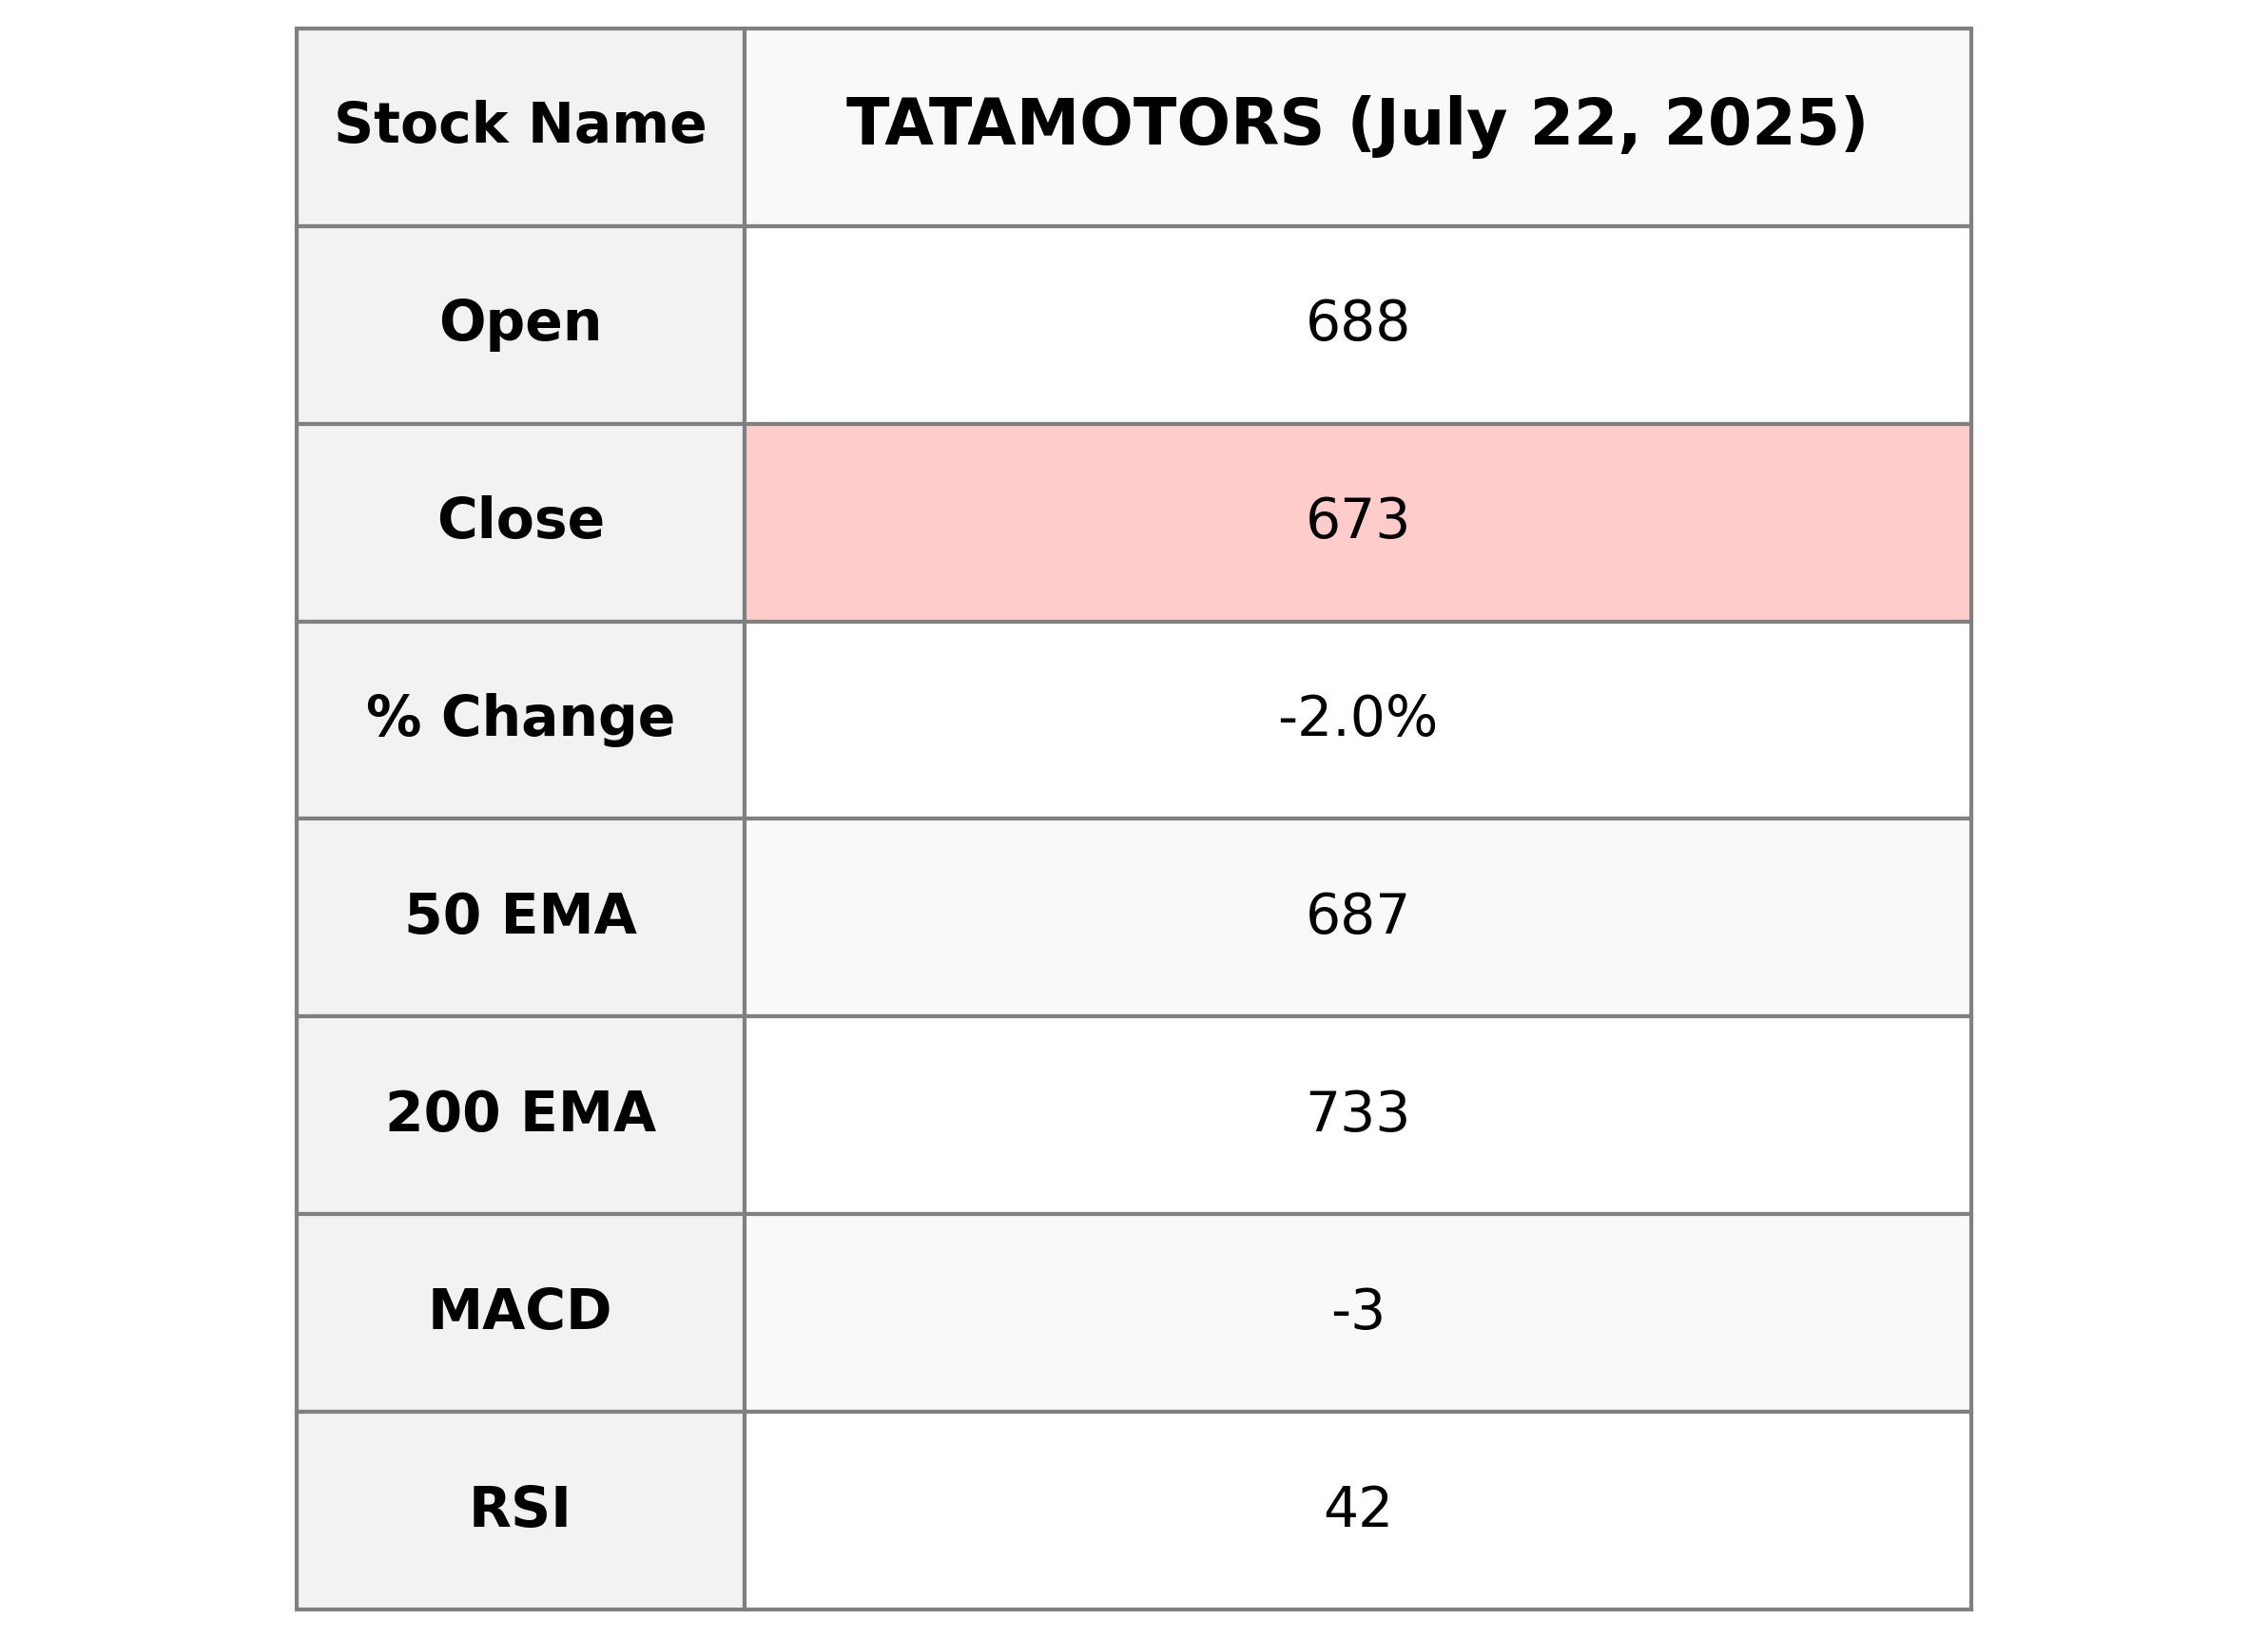
Tata Motors showed a significant decrease in its stock price with a close at 673.40, down by 2.04% compared to the previous close of 687.45. The stock's technical indicators, such as RSI at 42.09 and a negative MACD, signal a bearish sentiment. Additionally, its current market cap is 2,484,145,750,016 INR and operates within the Consumer Cyclical sector in the Auto Manufacturers industry in India.
Relationship with Key Moving Averages
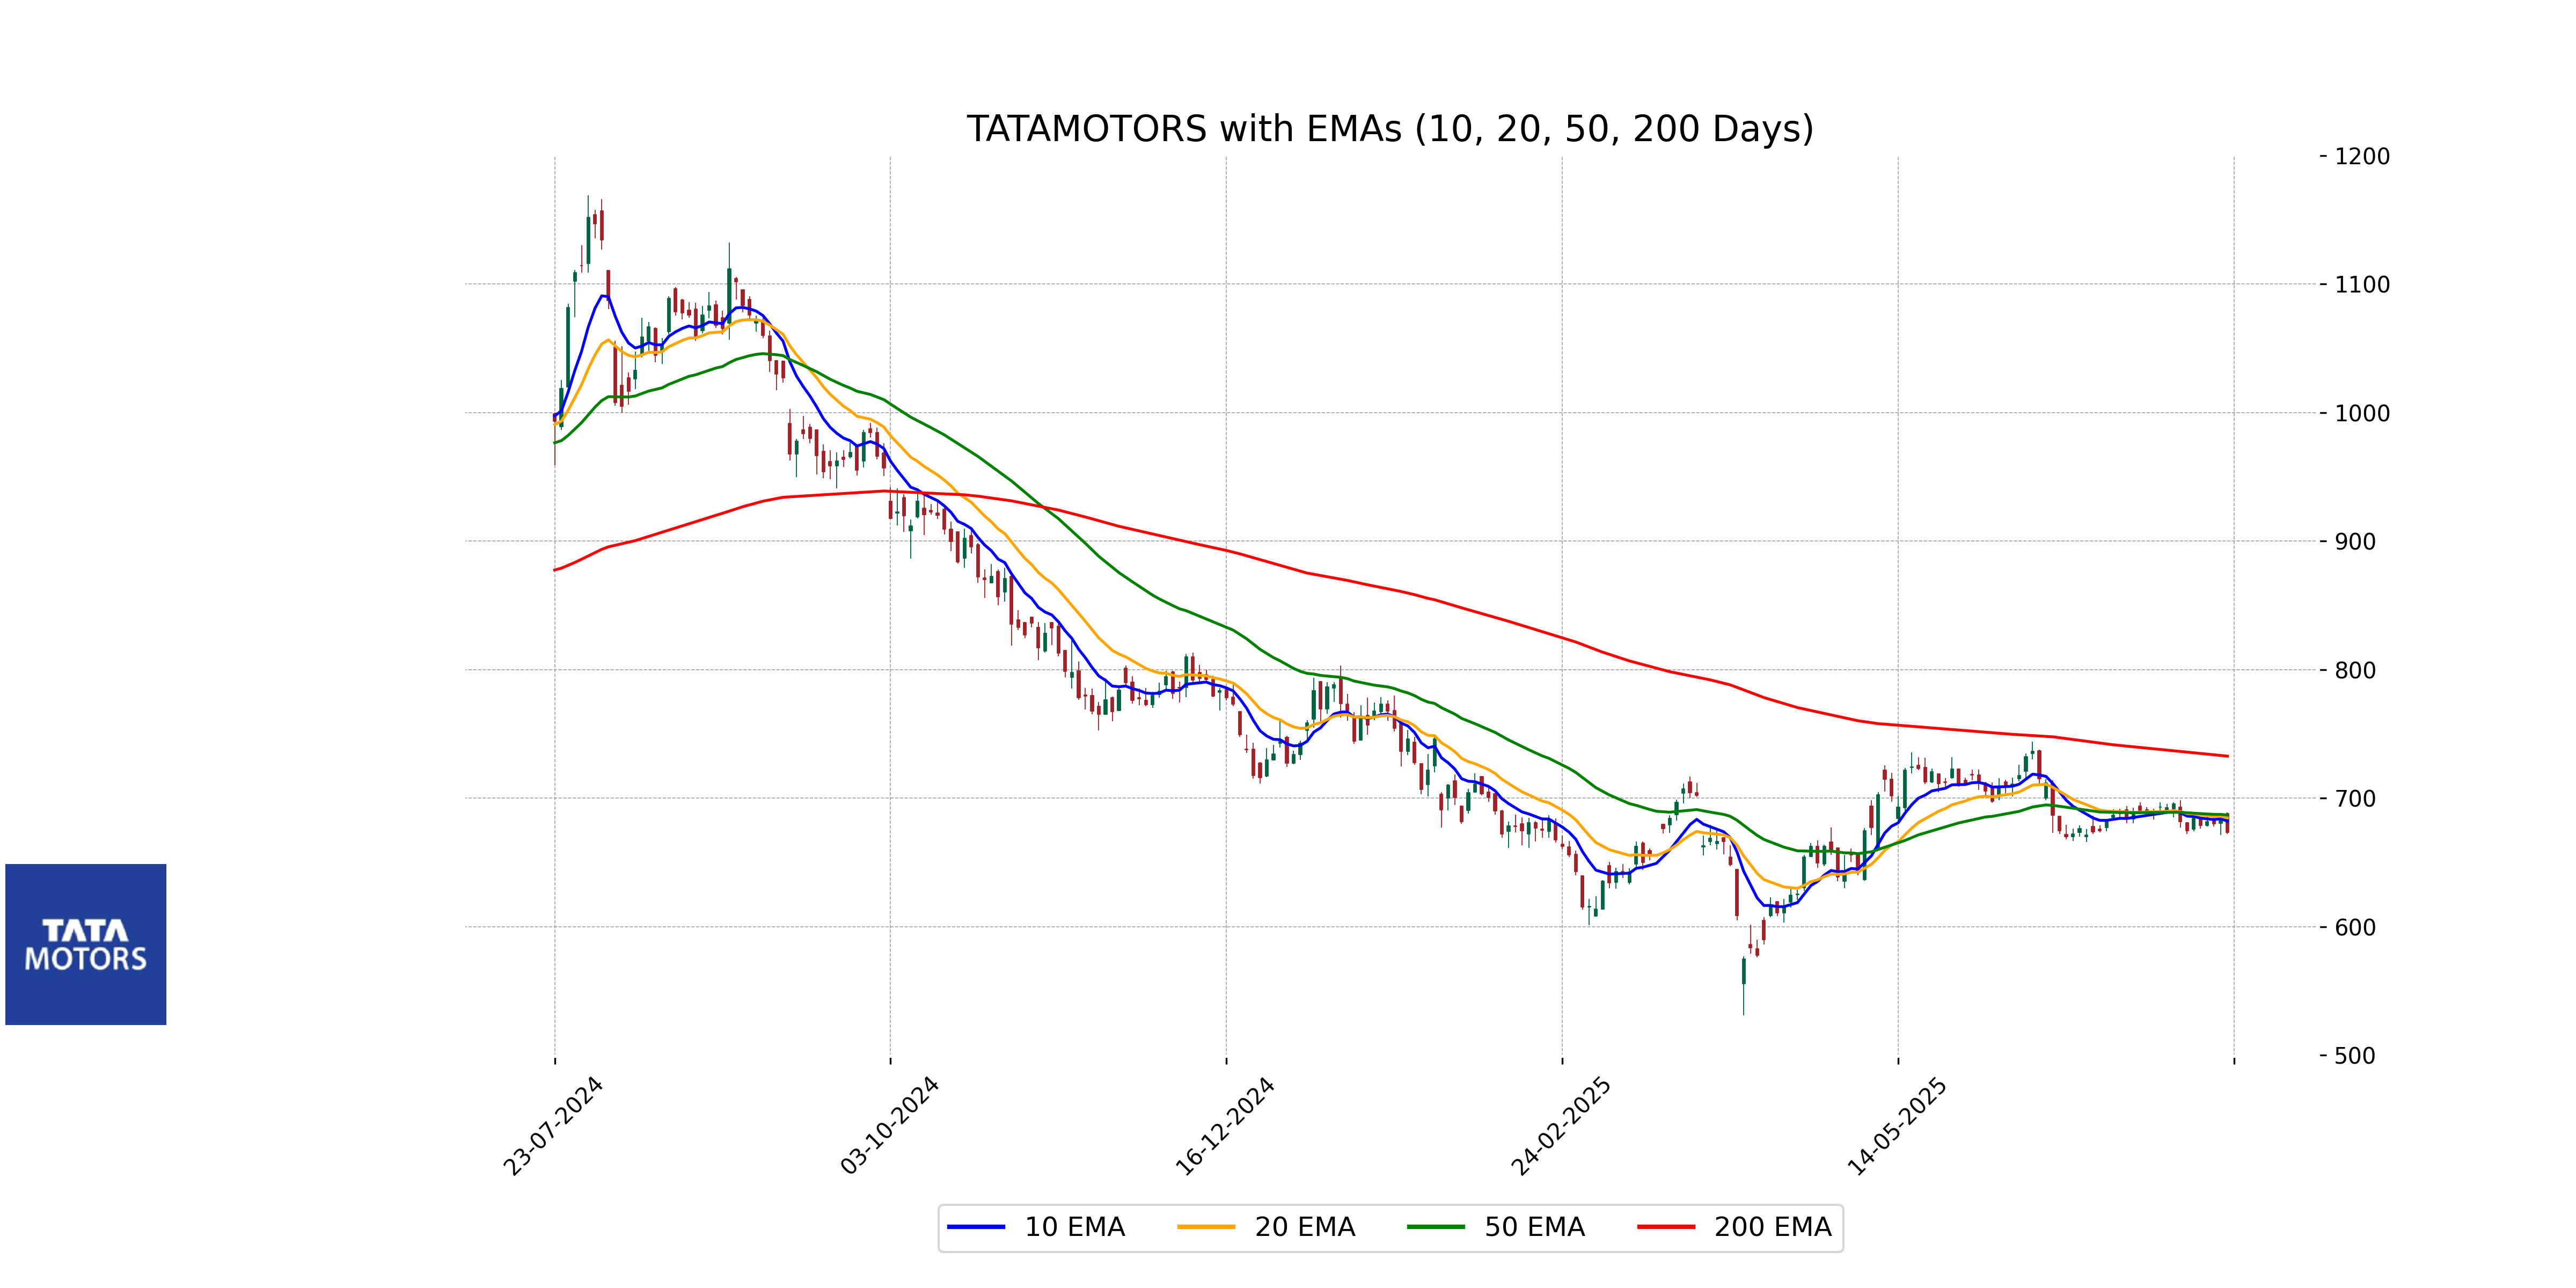
For Tata Motors, the current closing price of 673.40 is below its 50-day EMA of 686.88, indicating short-term bearish sentiment. Additionally, the price is also below the 10-day and 20-day EMAs (682.14 and 684.79, respectively), suggesting a downtrend. The MACD is negative, reinforcing the bearish momentum.
Moving Averages Trend (MACD)
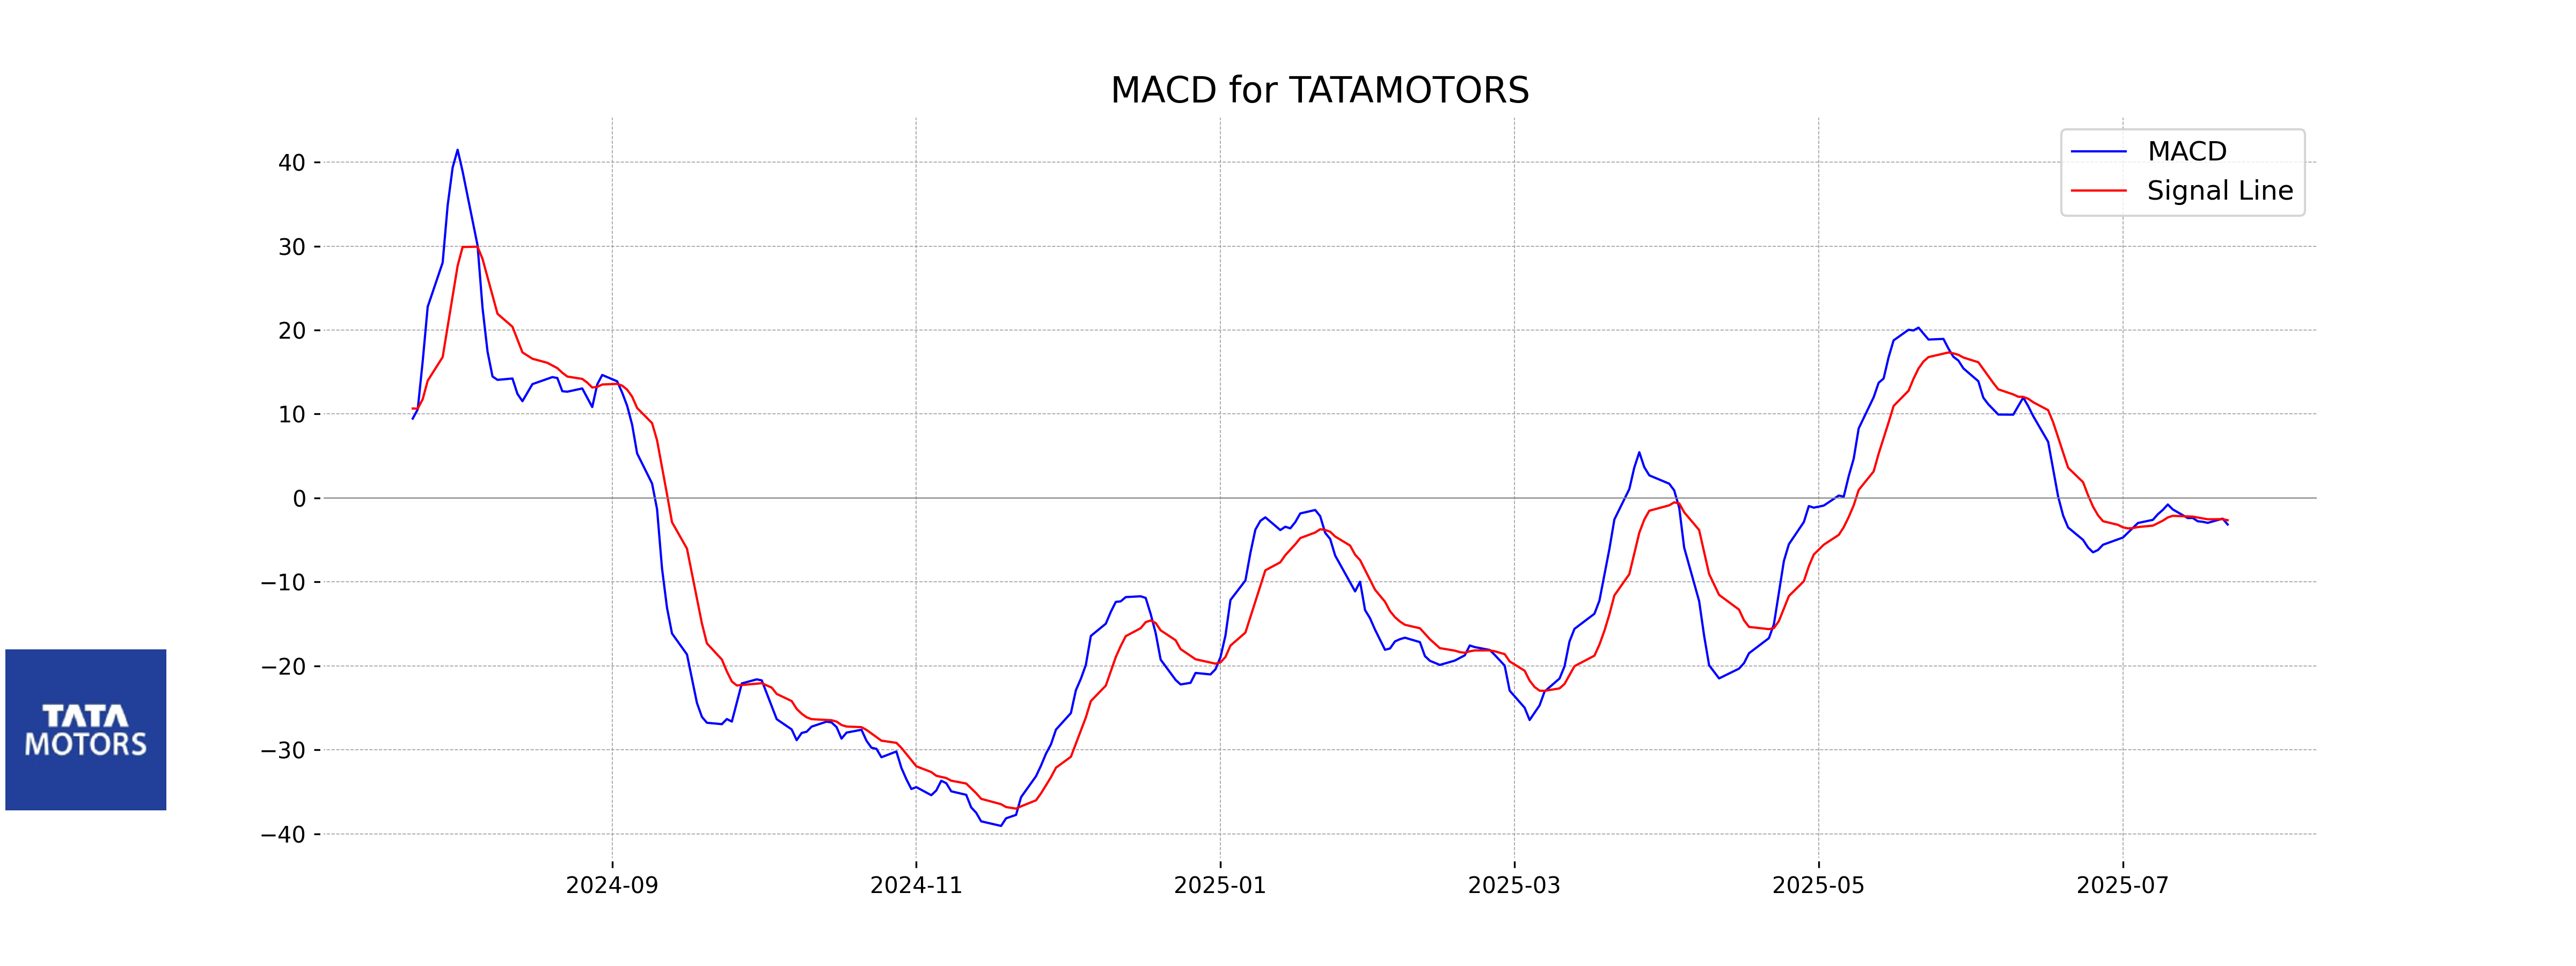
MACD Analysis for Tata Motors: The MACD value for Tata Motors is -3.16, with a signal line of -2.65. This negative MACD and its position below the signal line suggest a bearish trend, indicating potential further downward momentum in the stock price.
RSI Analysis
The RSI for Tata Motors is 42.09, which suggests that the stock is approaching oversold territory but is not there yet. Typically, an RSI below 30 indicates an oversold condition, while an RSI above 70 suggests overbought conditions. Current levels might indicate potential buying interest if the RSI continues to decline.