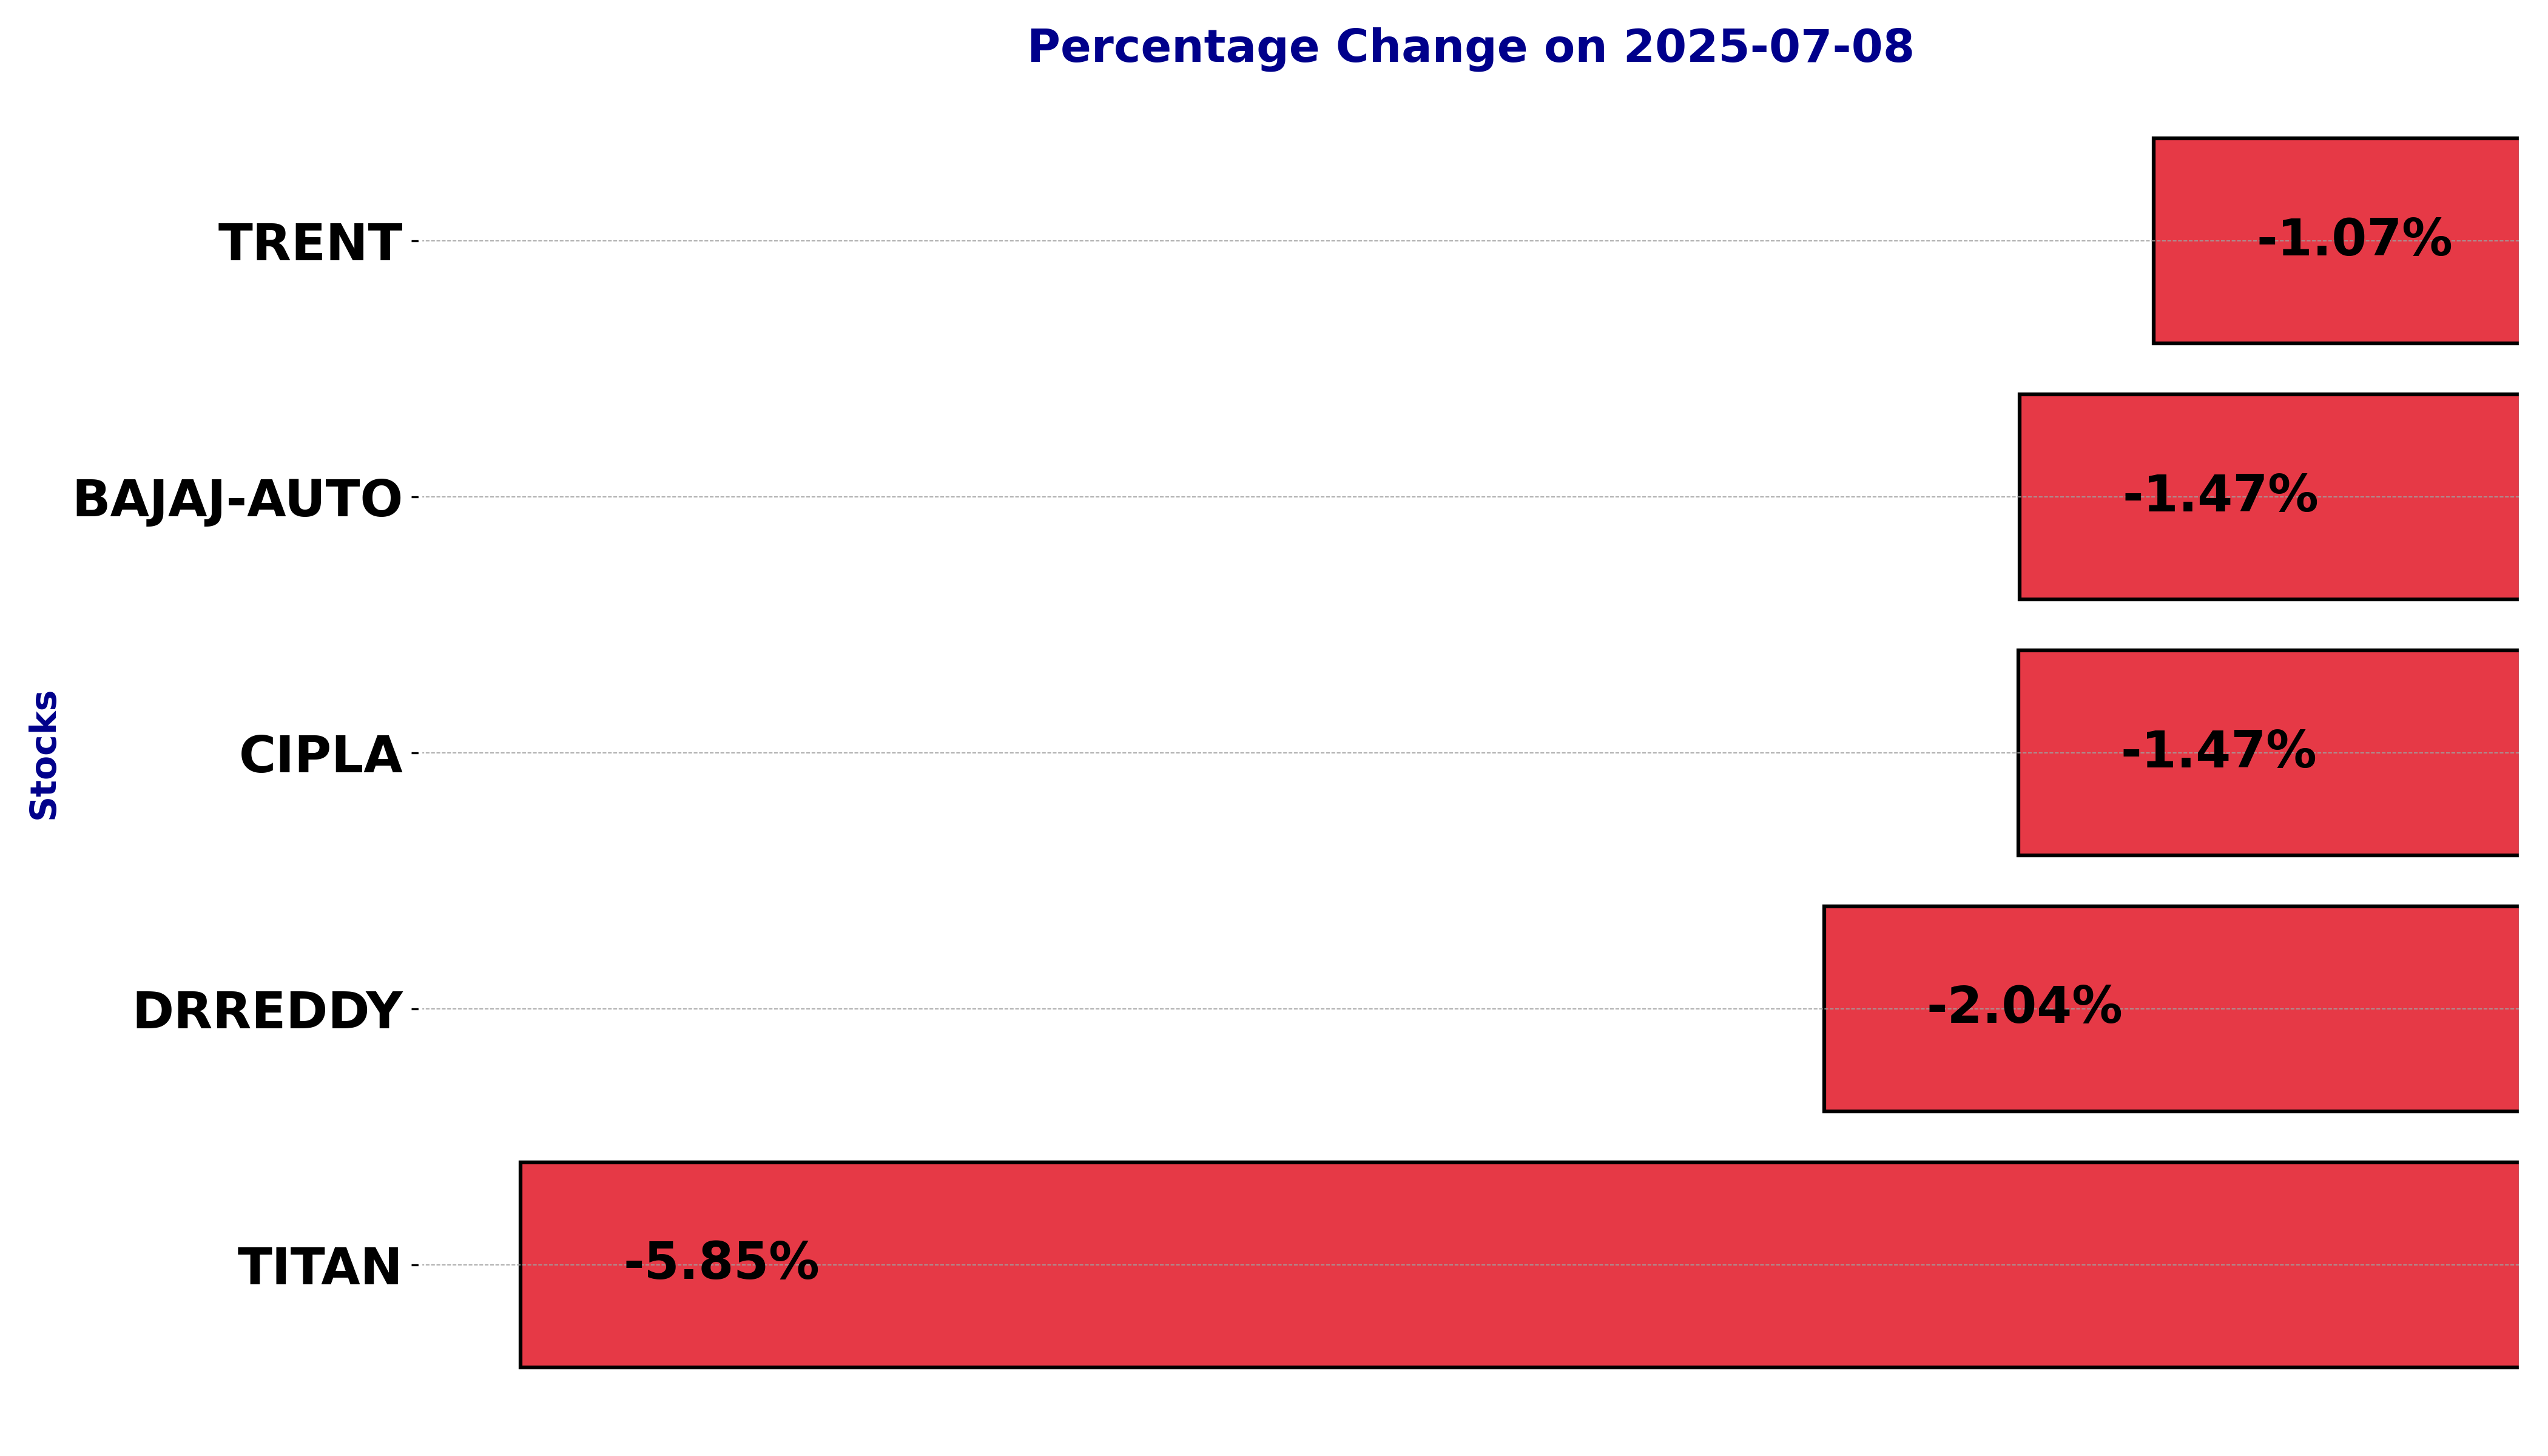
NSE Nifty 50: Top 5 stock losers of July 8, 2025
In this article, we will explore the technical indicators of some of the low-performing stocks on the Indian stock market, including BAJAJ-AUTO, CIPLA, DRREDDY, TITAN, and TRENT.
By looking at these stocks through the lens of key technical factors, we aim to better understand their price movements, trends, and potential future performance.
Analysis for Bajaj Auto - July 08, 2025
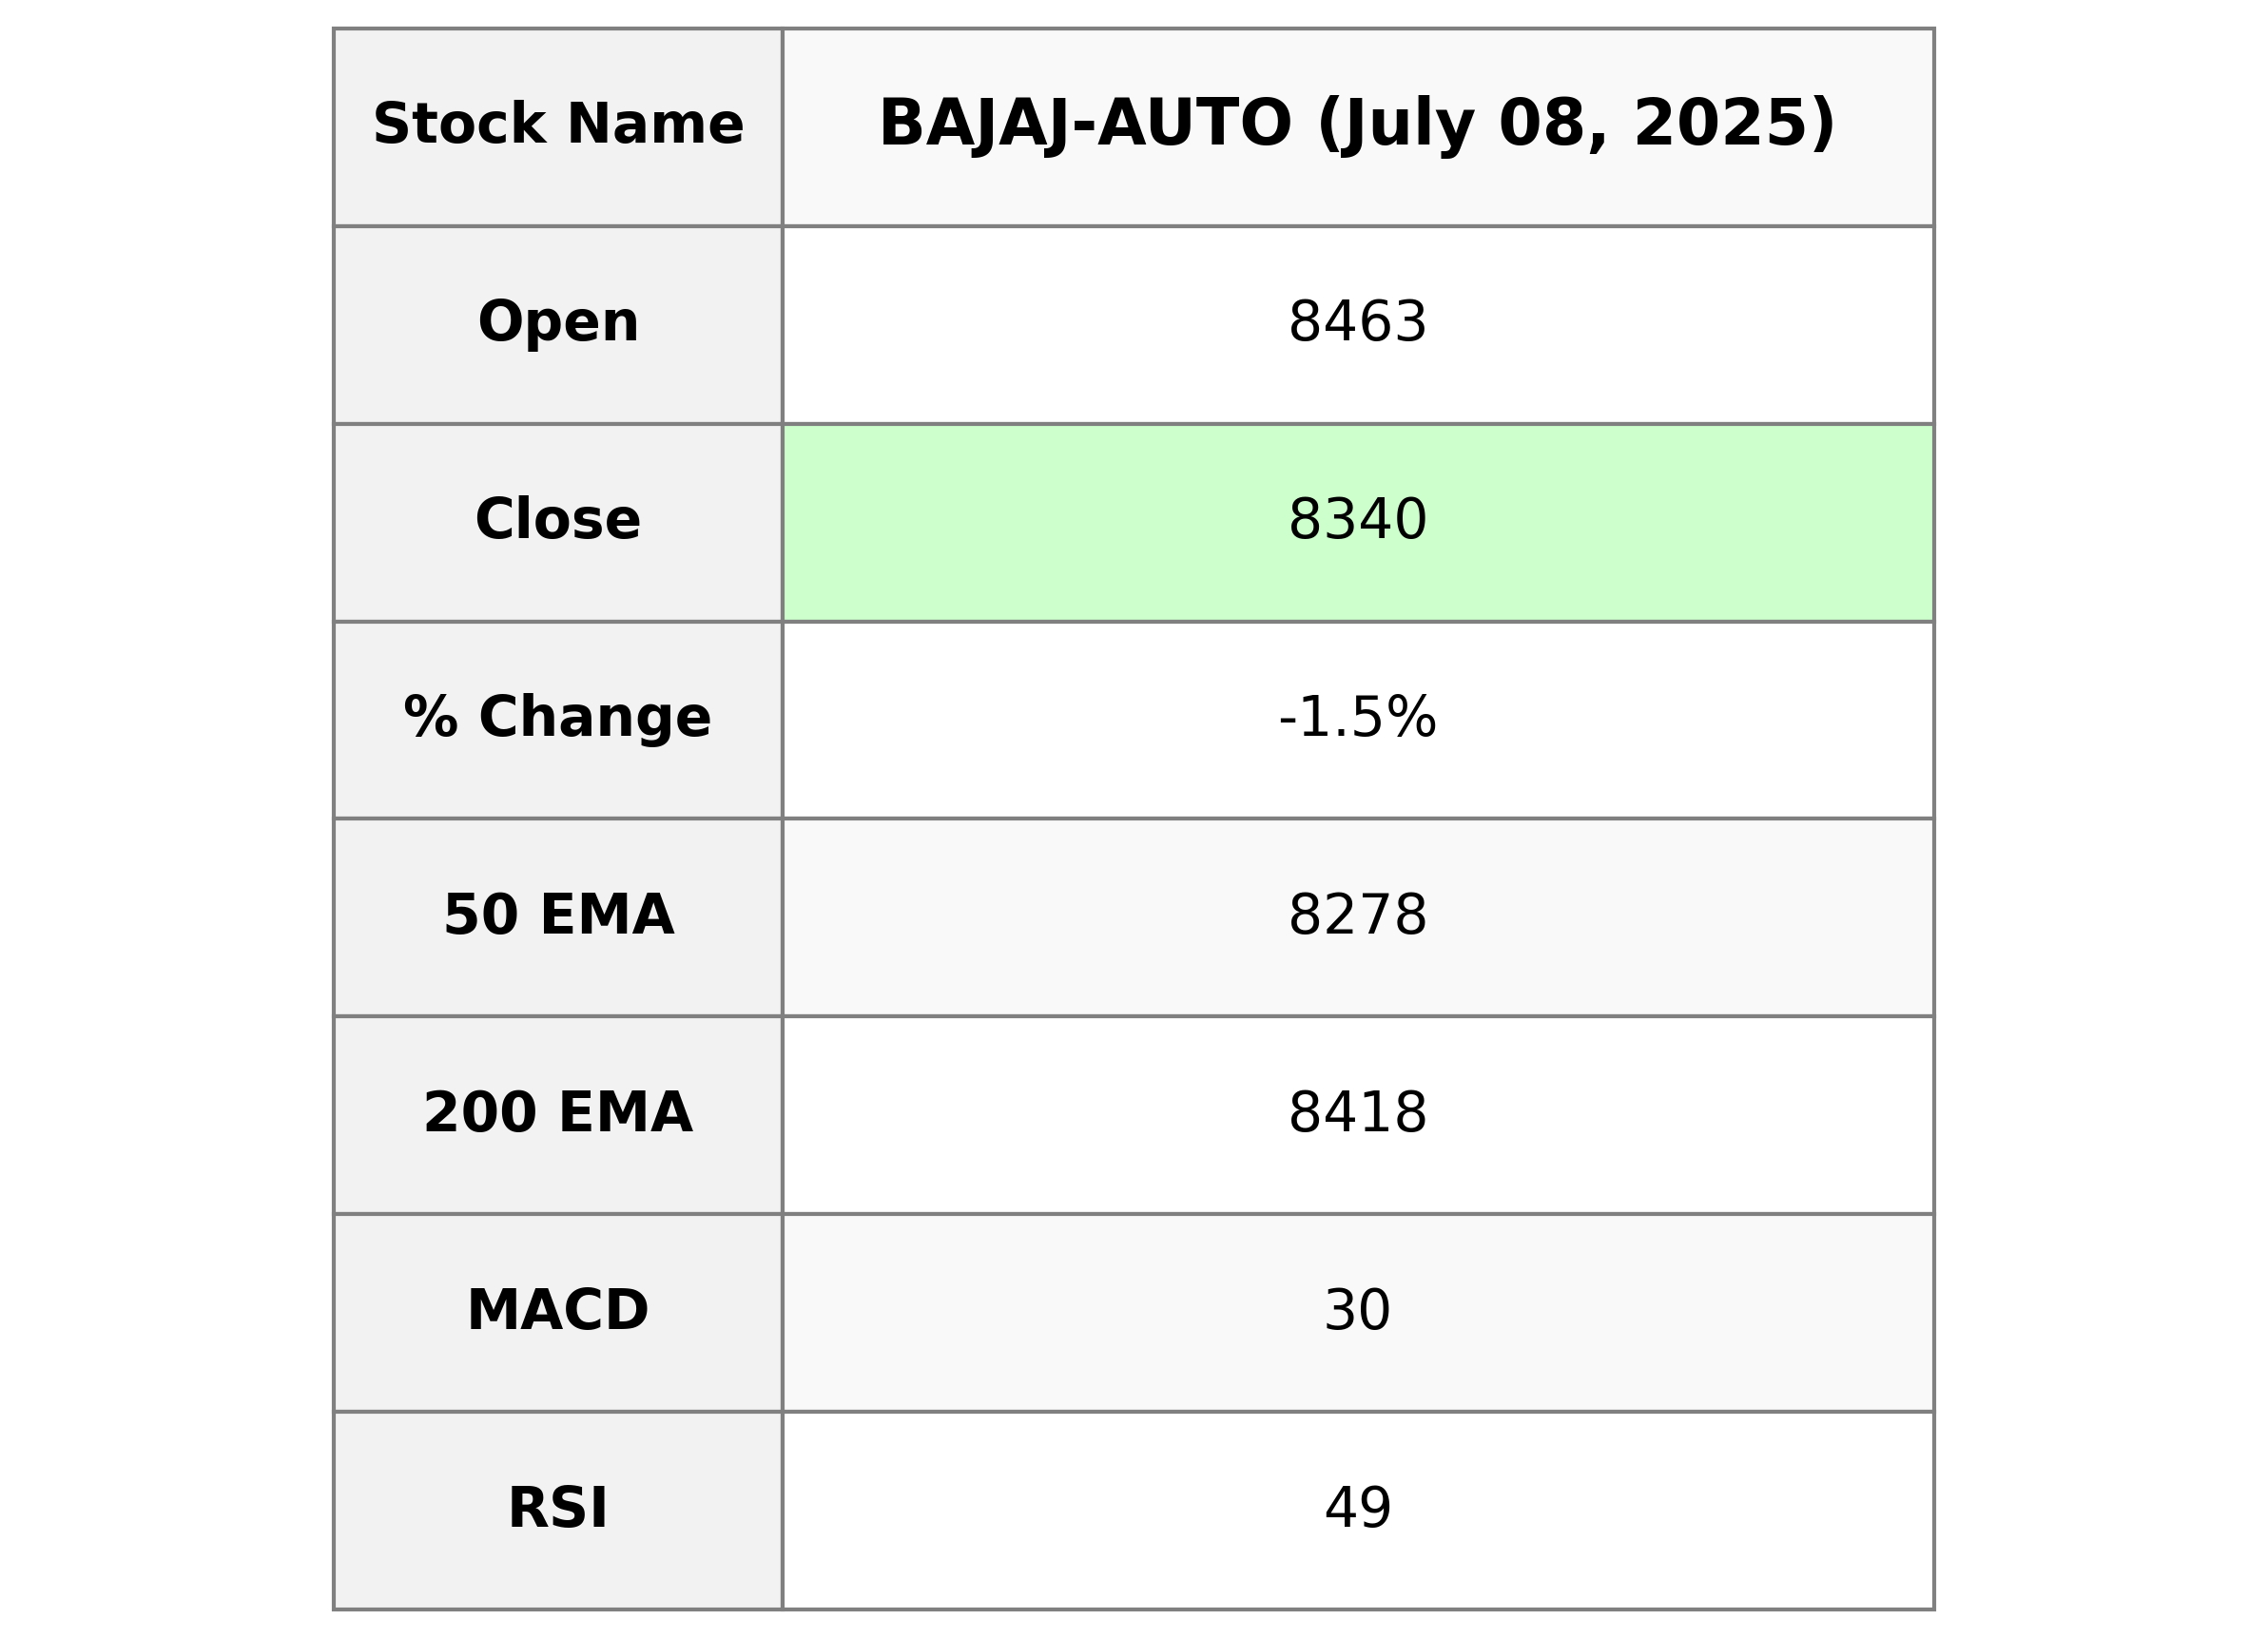
Bajaj Auto, a key player in the Consumer Cyclical sector under the Auto Manufacturers industry in India, showcased a decrease in its stock performance with a closing price of 8339.5, down by 1.47%, which equates to a 124.0-point drop from the previous close. The stock's RSI is at 49.09, indicating a neutral position, while its P/E ratio stands at 31.79 with an EPS of 262.37, reflecting reasonable valuation metrics for its market cap of approximately 2.33 trillion INR.
Relationship with Key Moving Averages
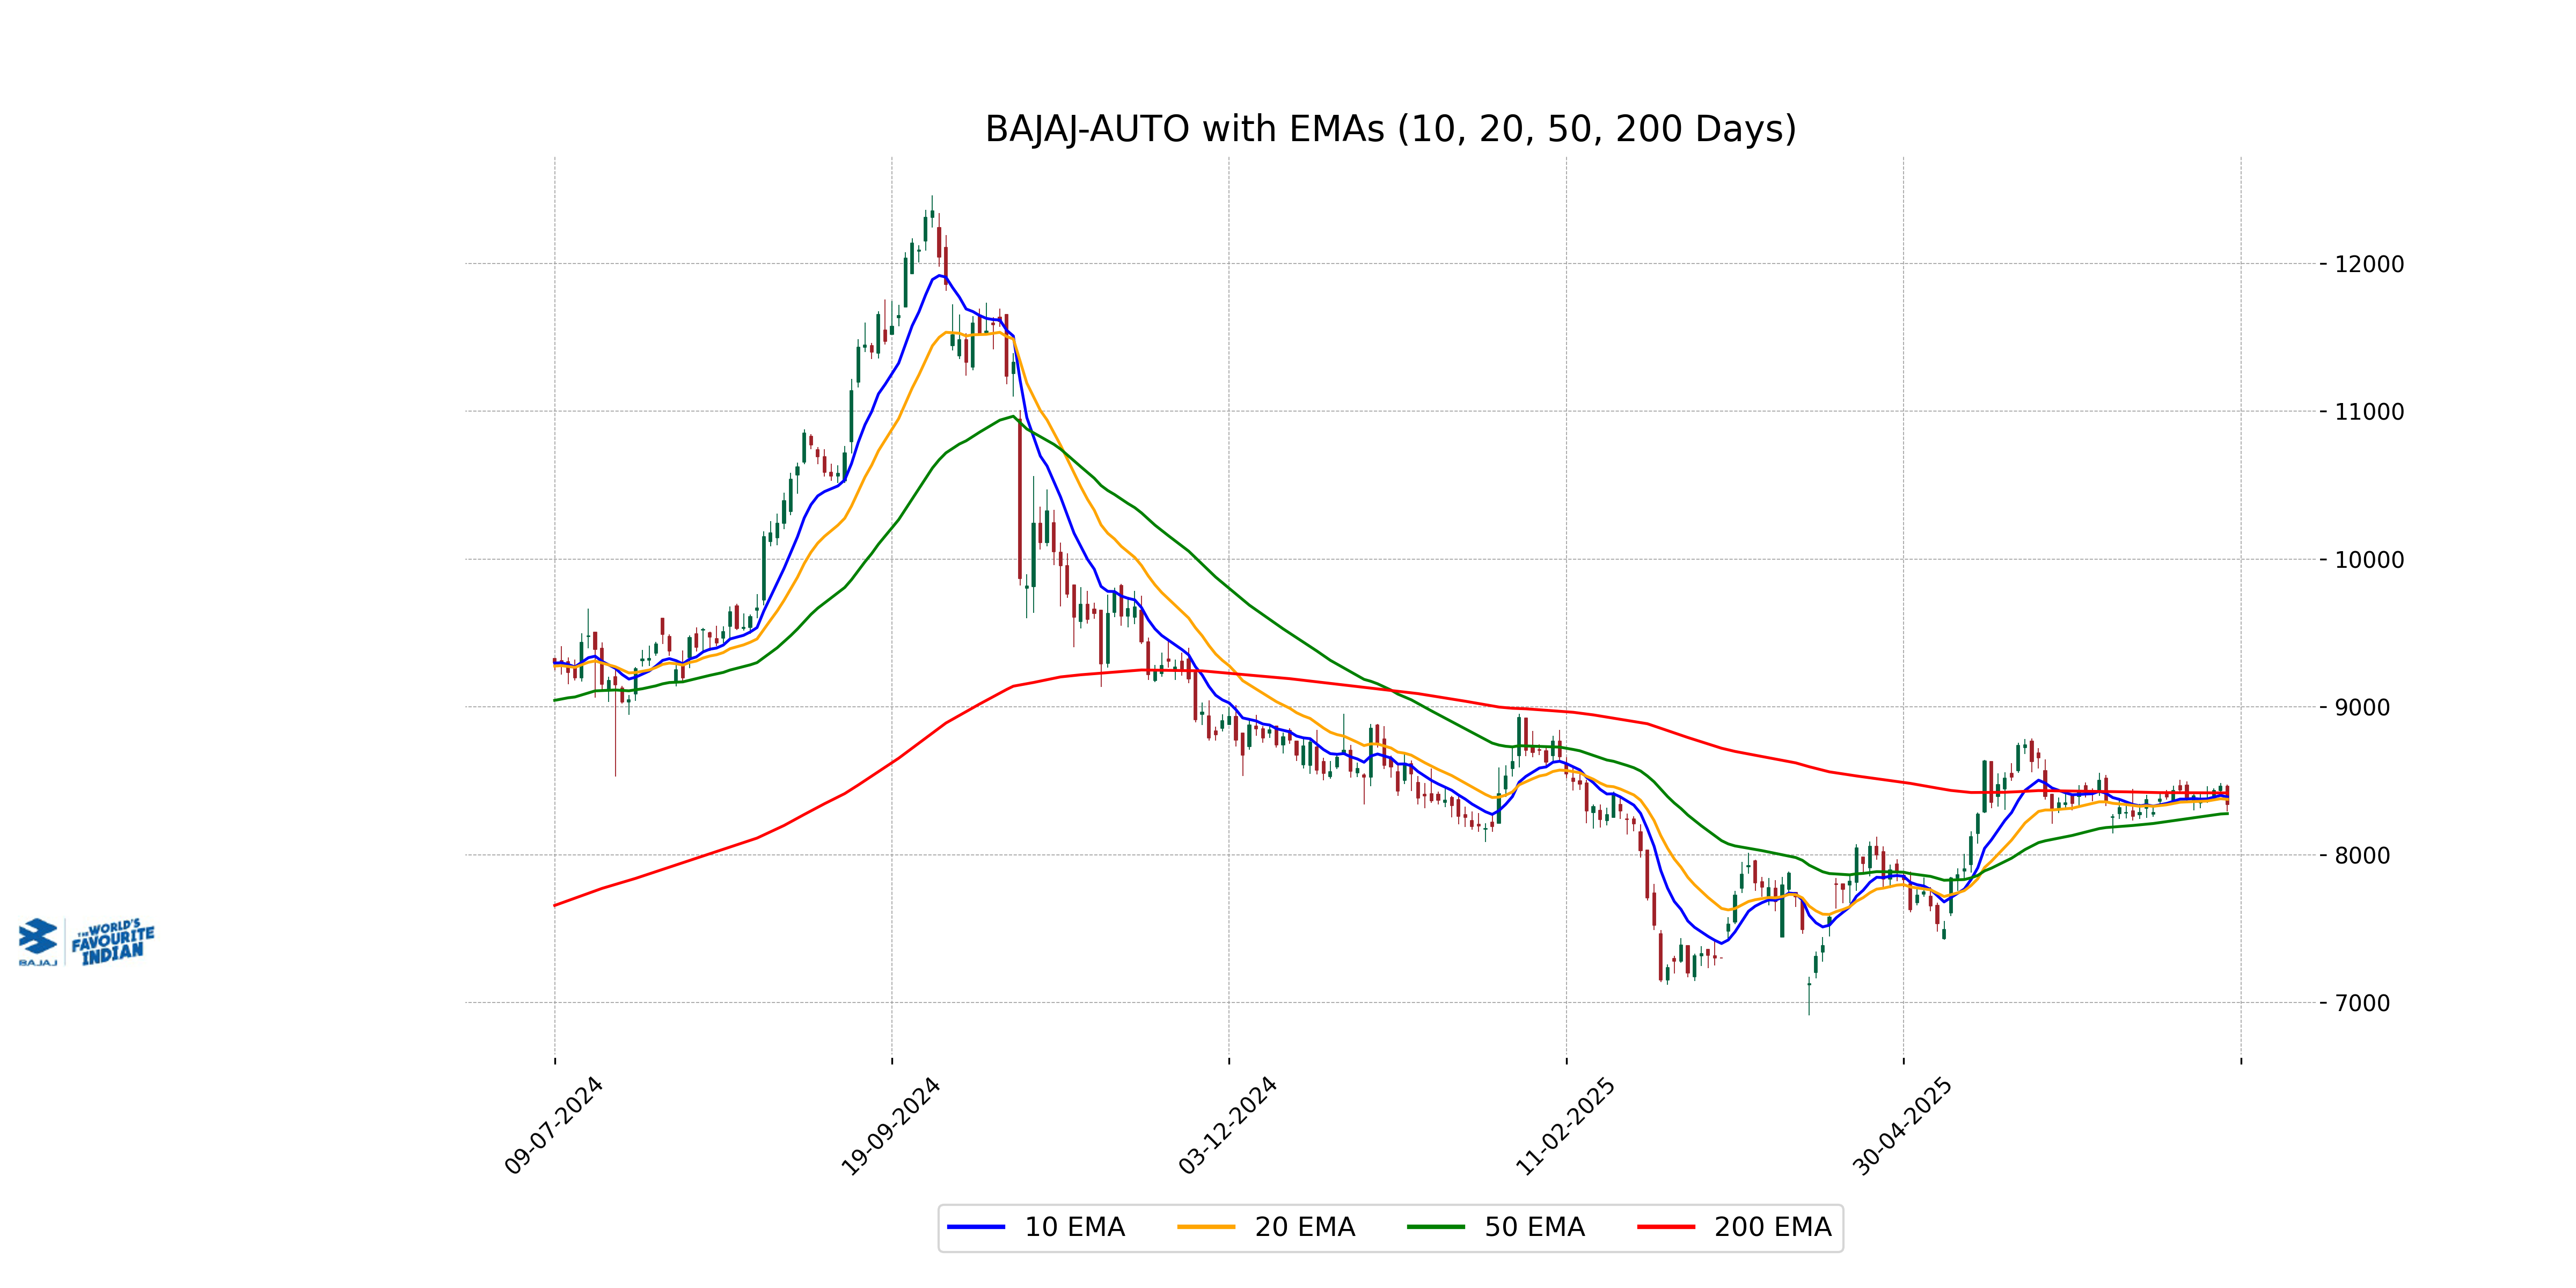
For Bajaj Auto, the current closing price of 8339.5 is above the 50-day EMA of 8277.51, indicating a short-term positive trend but below the 200-day EMA of 8417.69, suggesting longer-term resistance. Additionally, it is slightly under the 10-day and 20-day EMAs, which are 8389.83 and 8374.55, respectively, highlighting potential short-term bearishness.
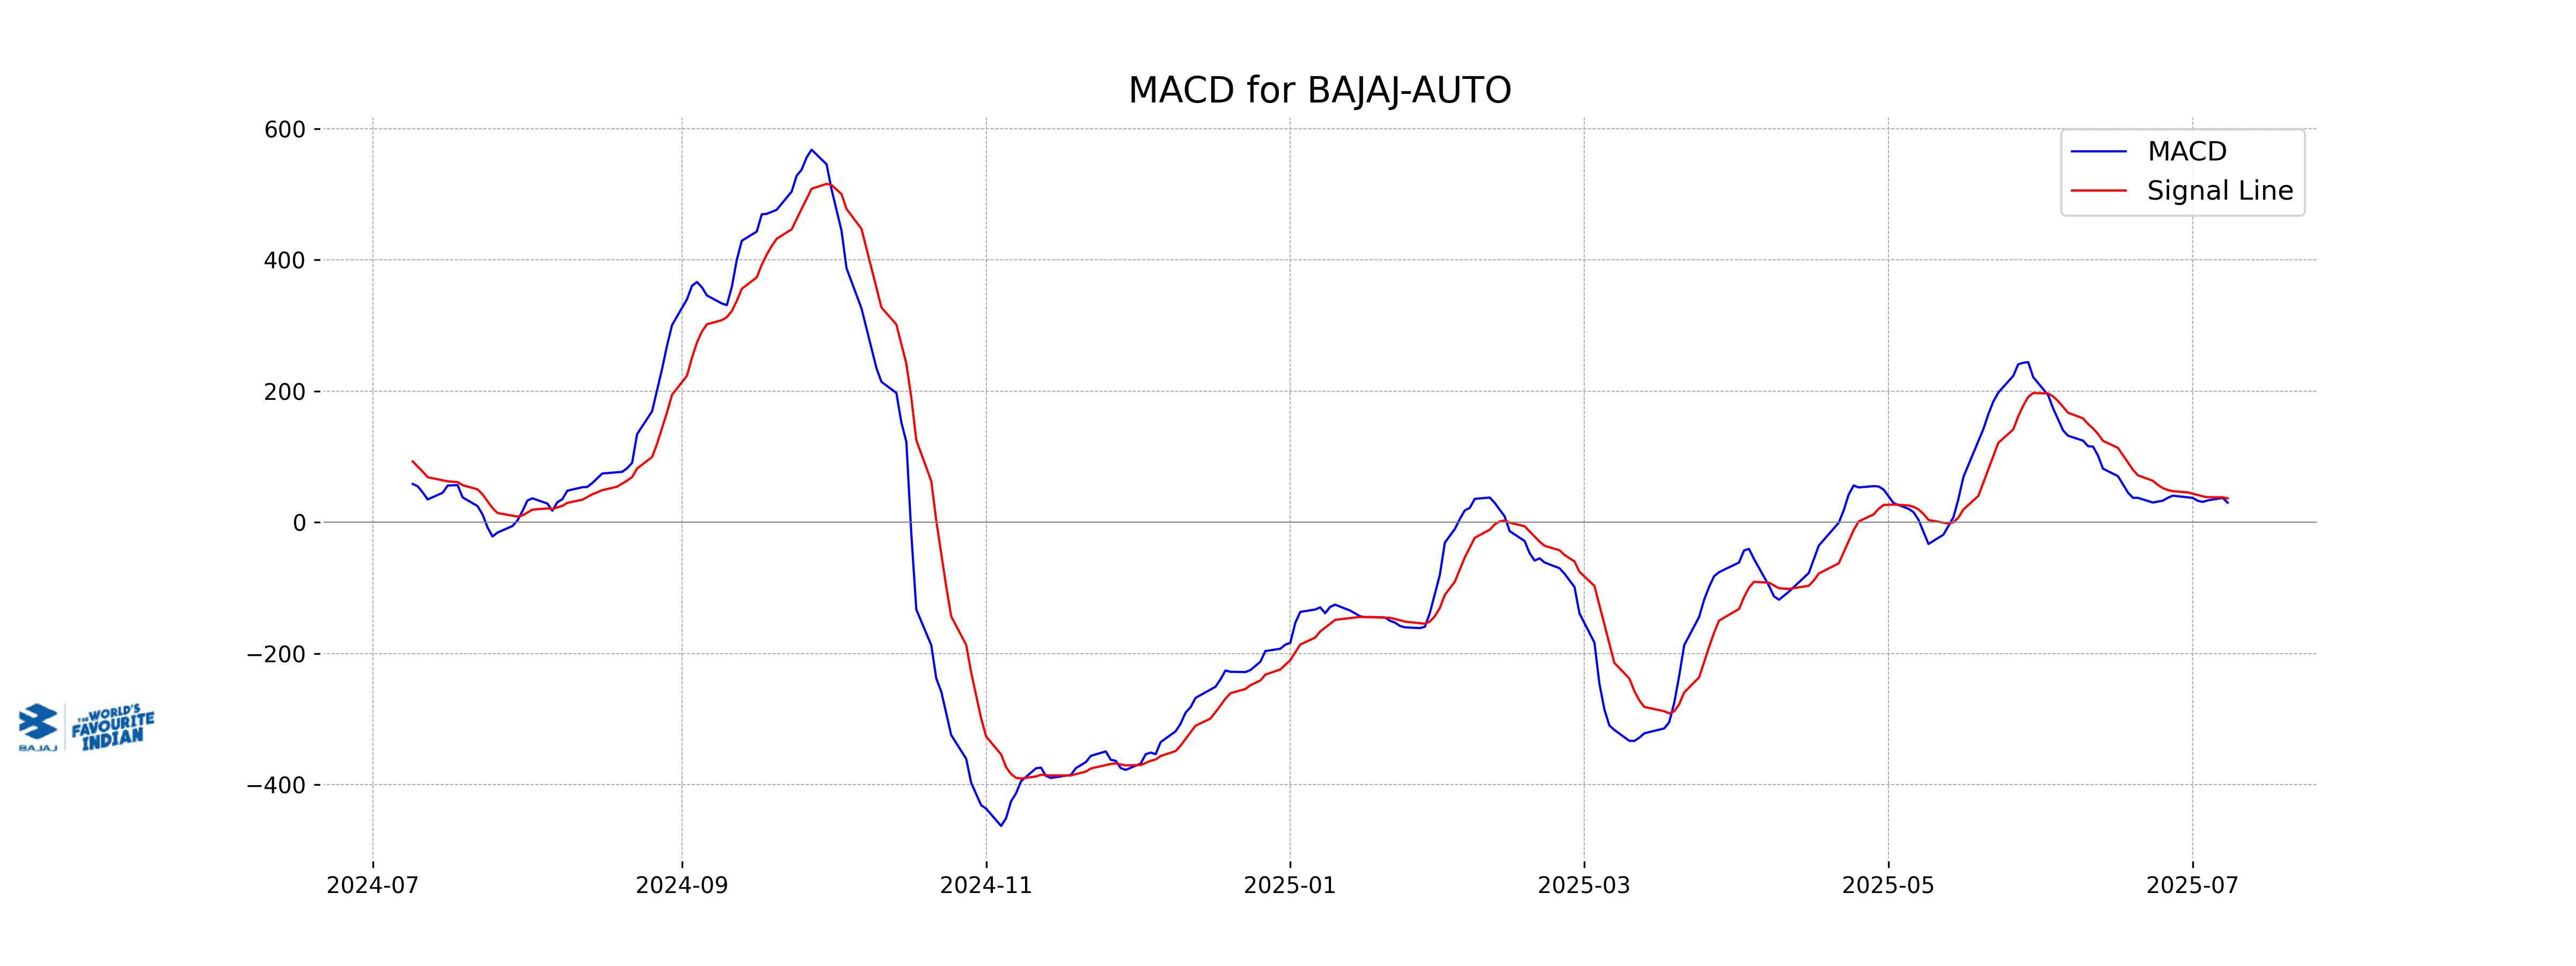
Moving Averages Trend (MACD)
Bajaj Auto's MACD line is currently below the MACD signal line, indicating a bearish trend. The disparity suggests potential downward momentum in the stock price. Investors may want to monitor for a crossover that could signal a trend reversal.
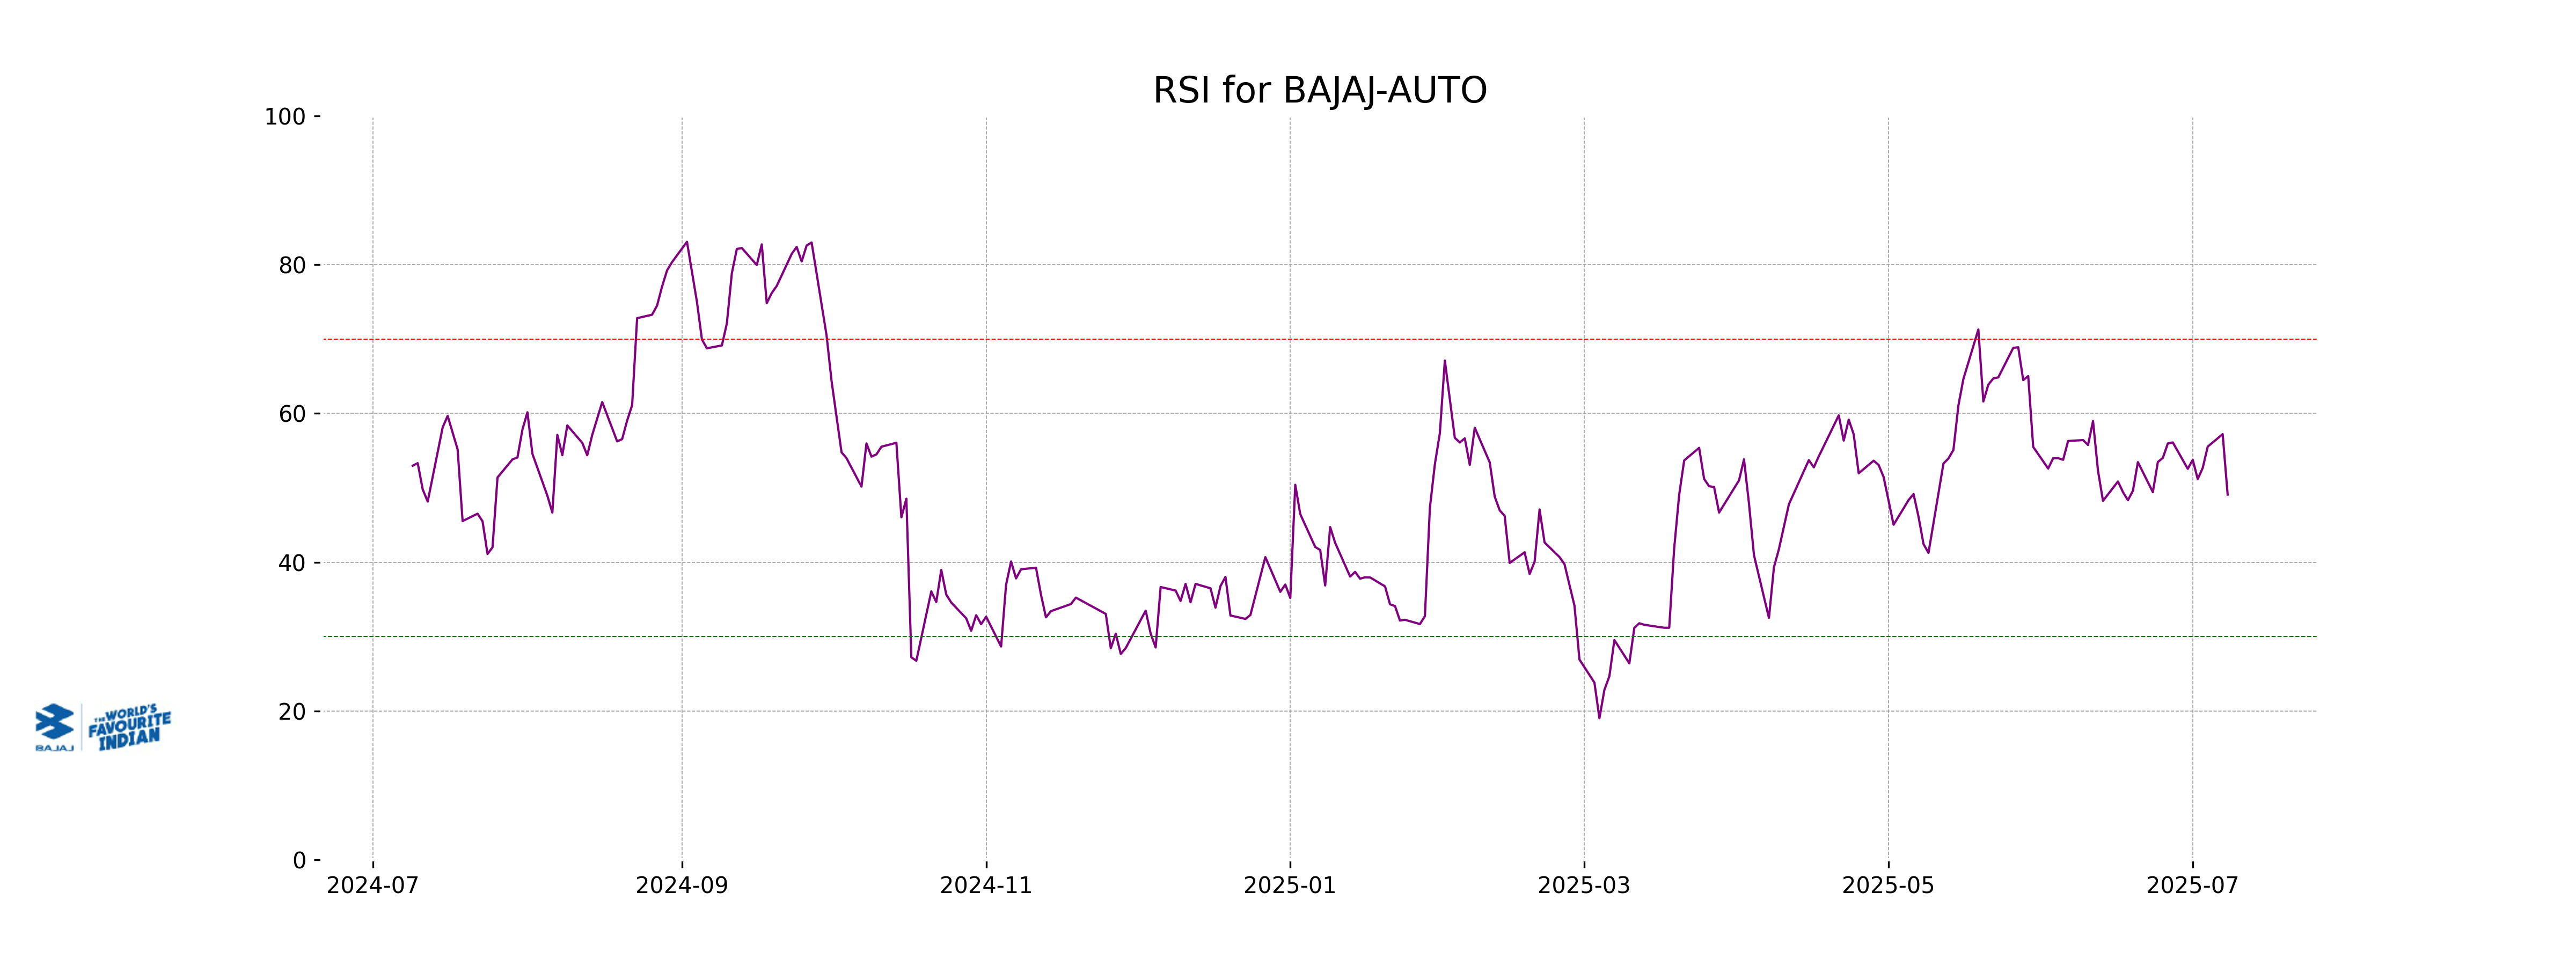
RSI Analysis
The Relative Strength Index (RSI) for Bajaj Auto is 49.09, which suggests that the stock is in a neutral zone. An RSI close to 50 indicates a balance between buying and selling pressures. This typically suggests no immediate overbought or oversold conditions.
Analysis for Cipla - July 08, 2025
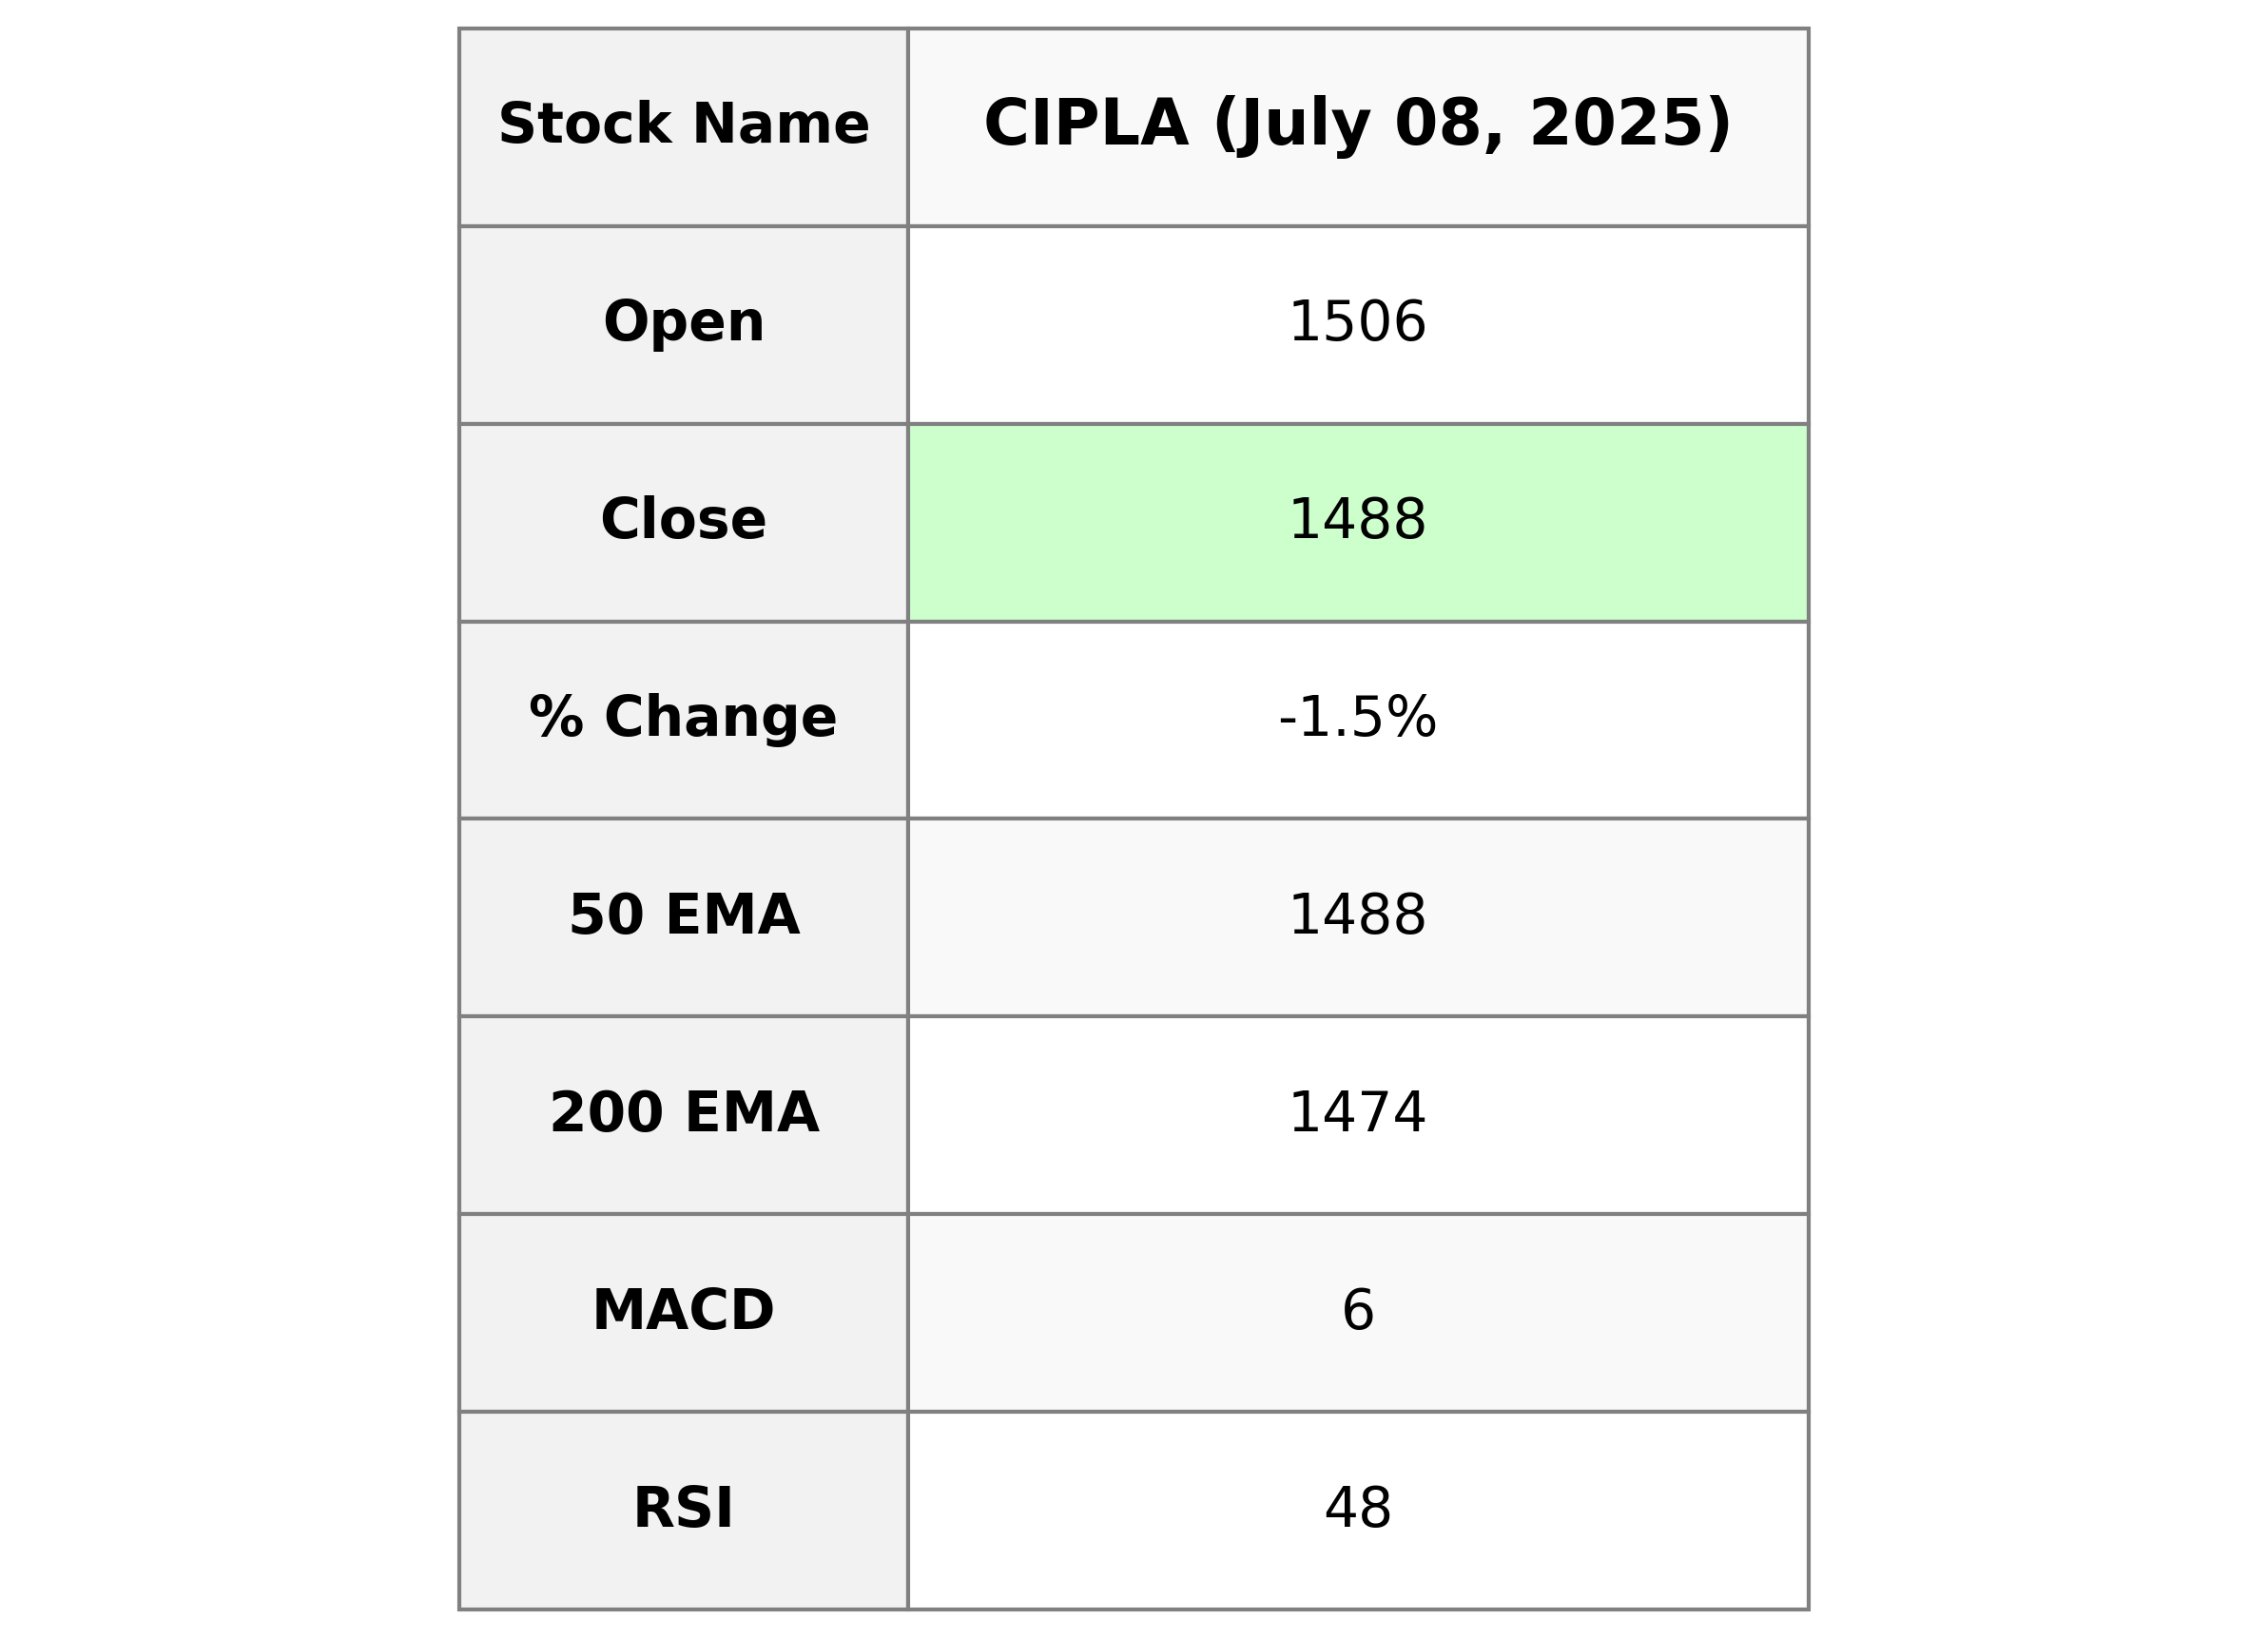
### Cipla Performance Cipla experienced a decline with the close price at 1488.30, marking a -1.47% change from the previous close of 1510.50. The stock's trading volume was 2,197,556 shares. Its RSI value indicates a neutral position, close to the midpoint of 50, while the MACD is slightly below its signal line, suggesting potentially weakening momentum.
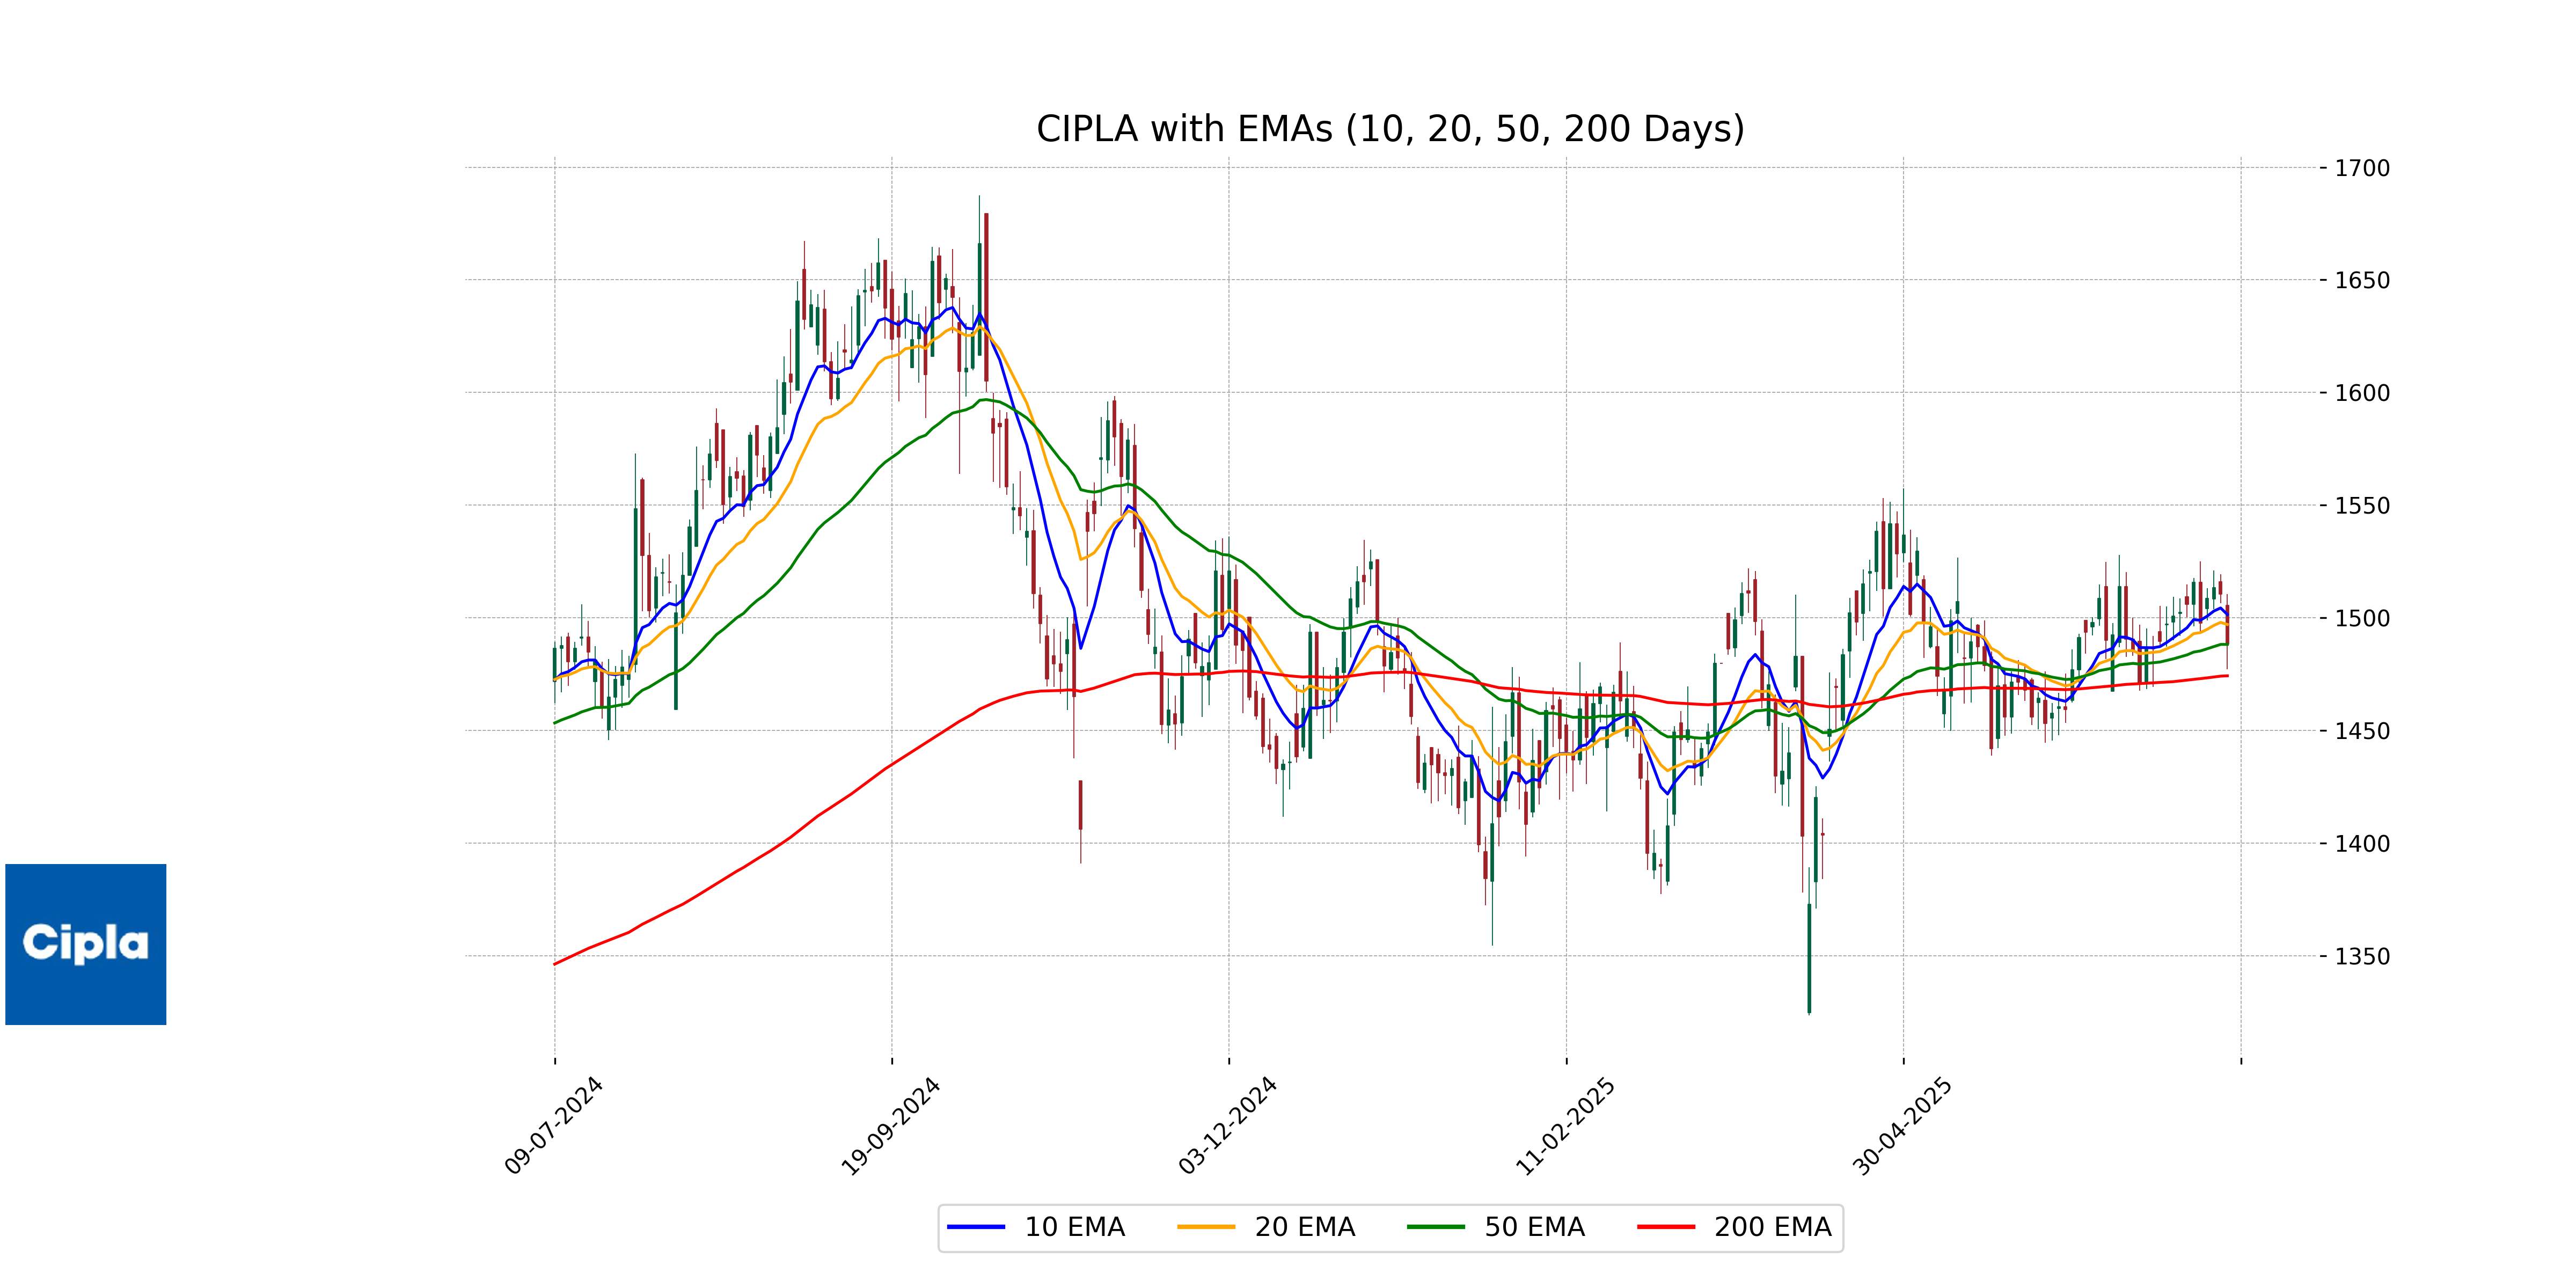
Relationship with Key Moving Averages
Cipla’s closing price of 1488.3 is marginally above its 50-day EMA of 1488.14, indicating a short-term bullish trend, but below the 10-day and 20-day EMAs, suggesting recent bearish pressure. The 200-day EMA is at 1474.20, showing that the longer-term trend remains bullish.
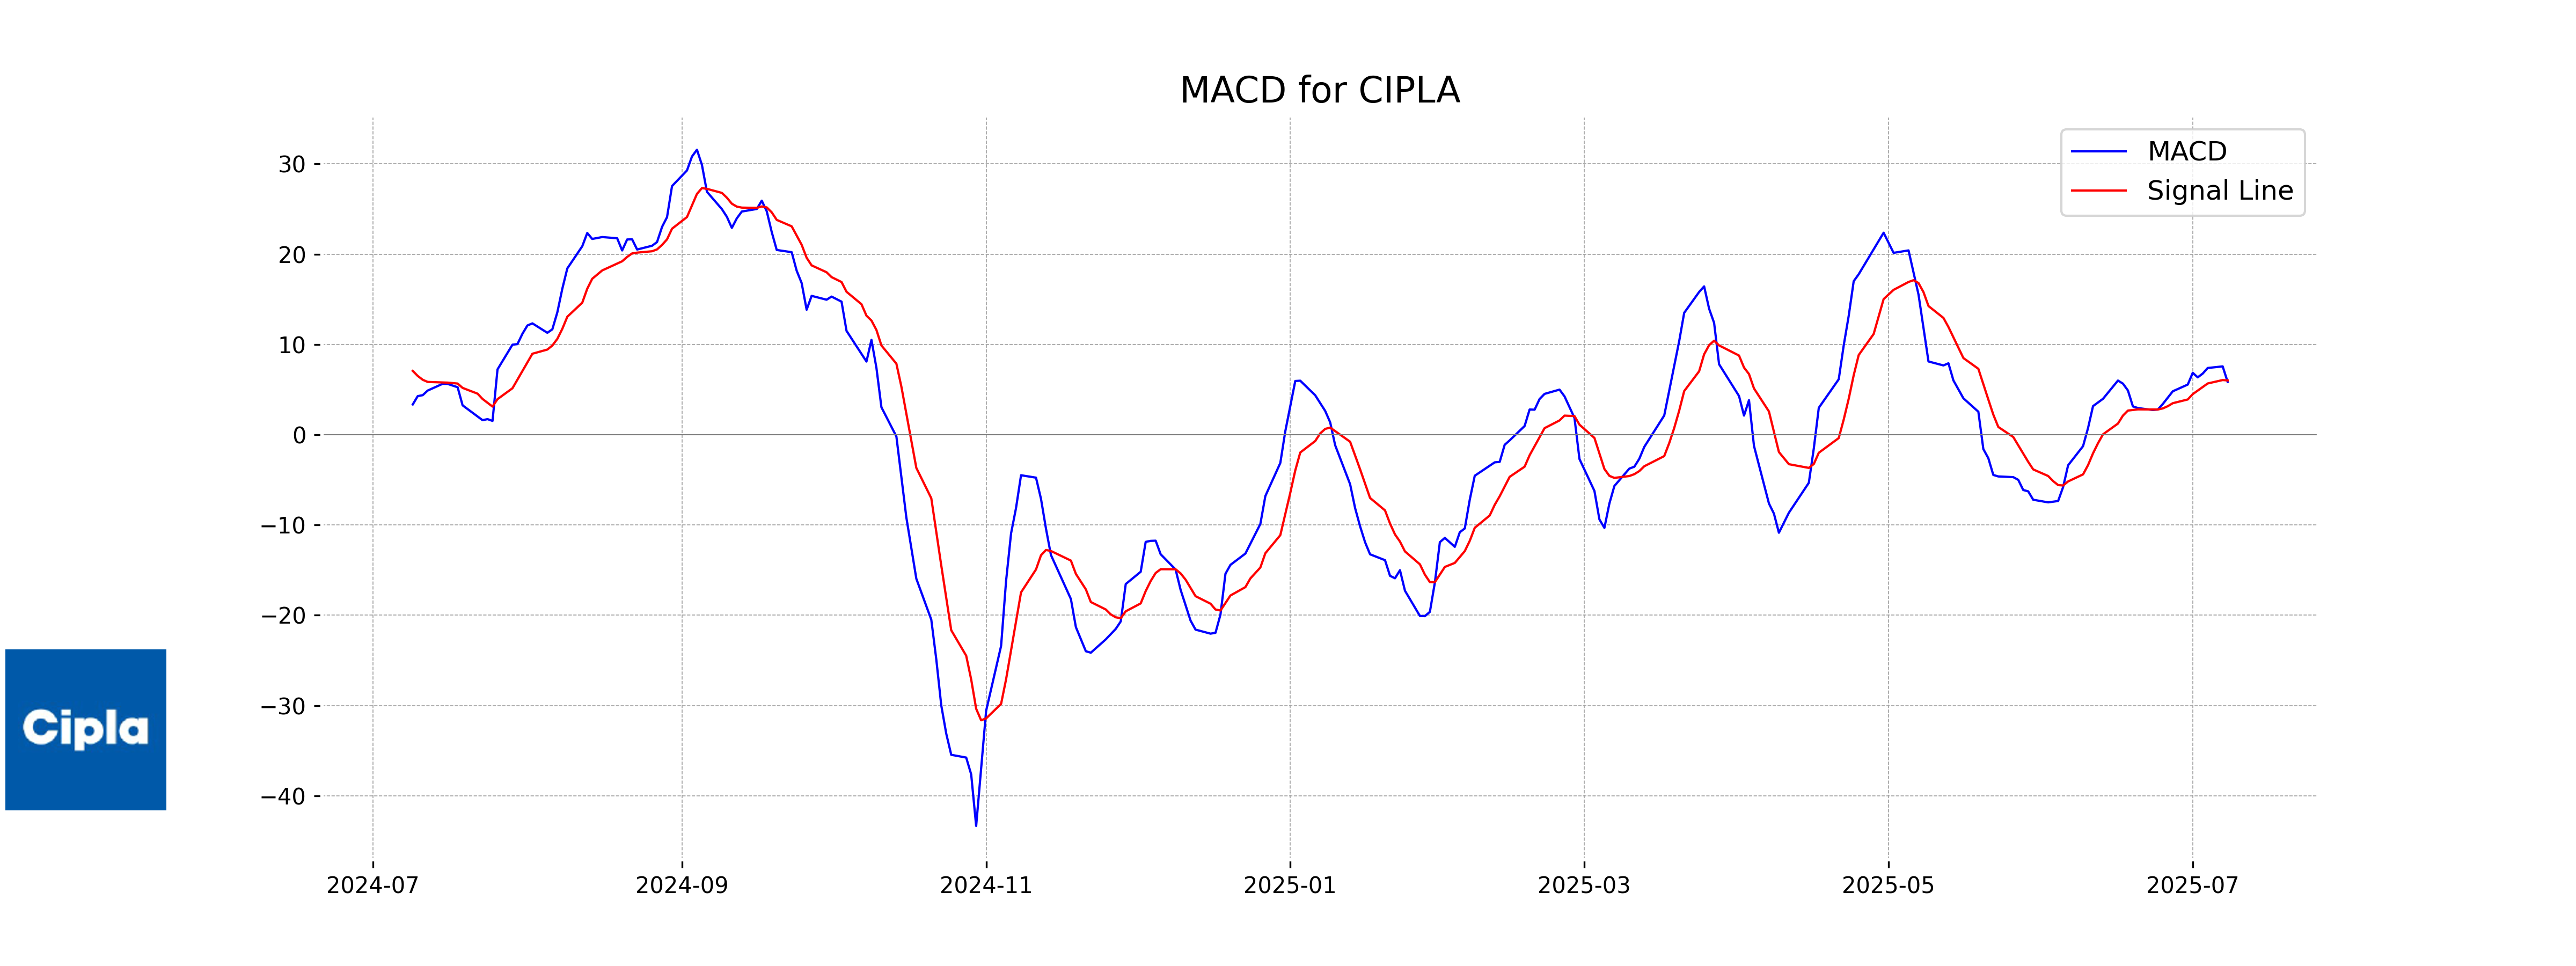
Moving Averages Trend (MACD)
The MACD for Cipla is slightly below its signal line, suggesting a bearish outlook in the short term as it may indicate a potential decline if this trend continues. However, the close proximity of the MACD line to the signal line indicates that any negative sentiment might not be very strong. Monitoring further movements could provide clearer insight into momentum changes.
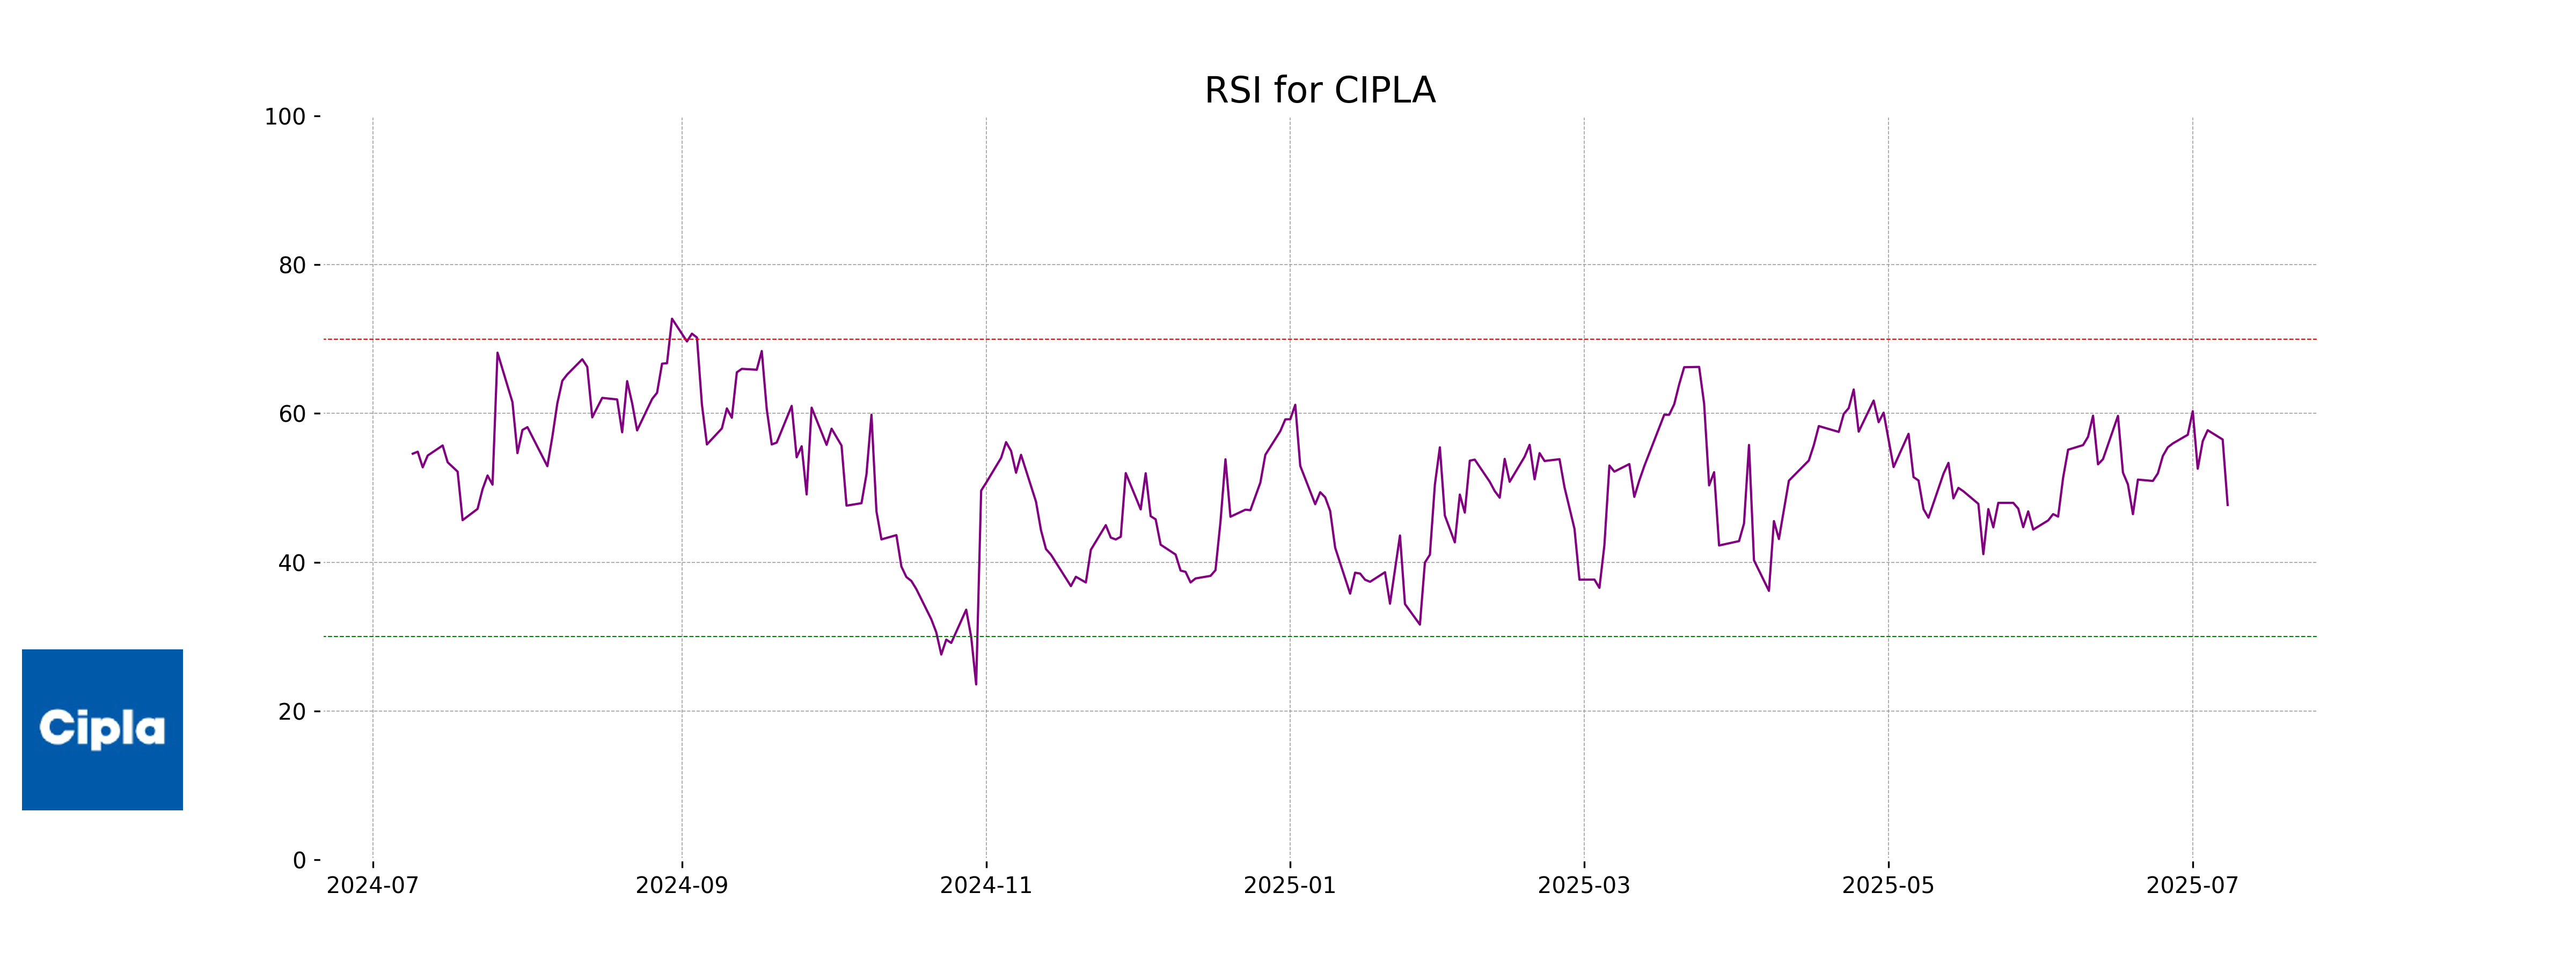
RSI Analysis
Cipla's RSI is 47.70, indicating it is close to a neutral level, suggesting there is no significant momentum towards being overbought or oversold. This implies potential stability in its current price trend, without a strong directional bias.
Analysis for Dr Reddys Labs - July 08, 2025
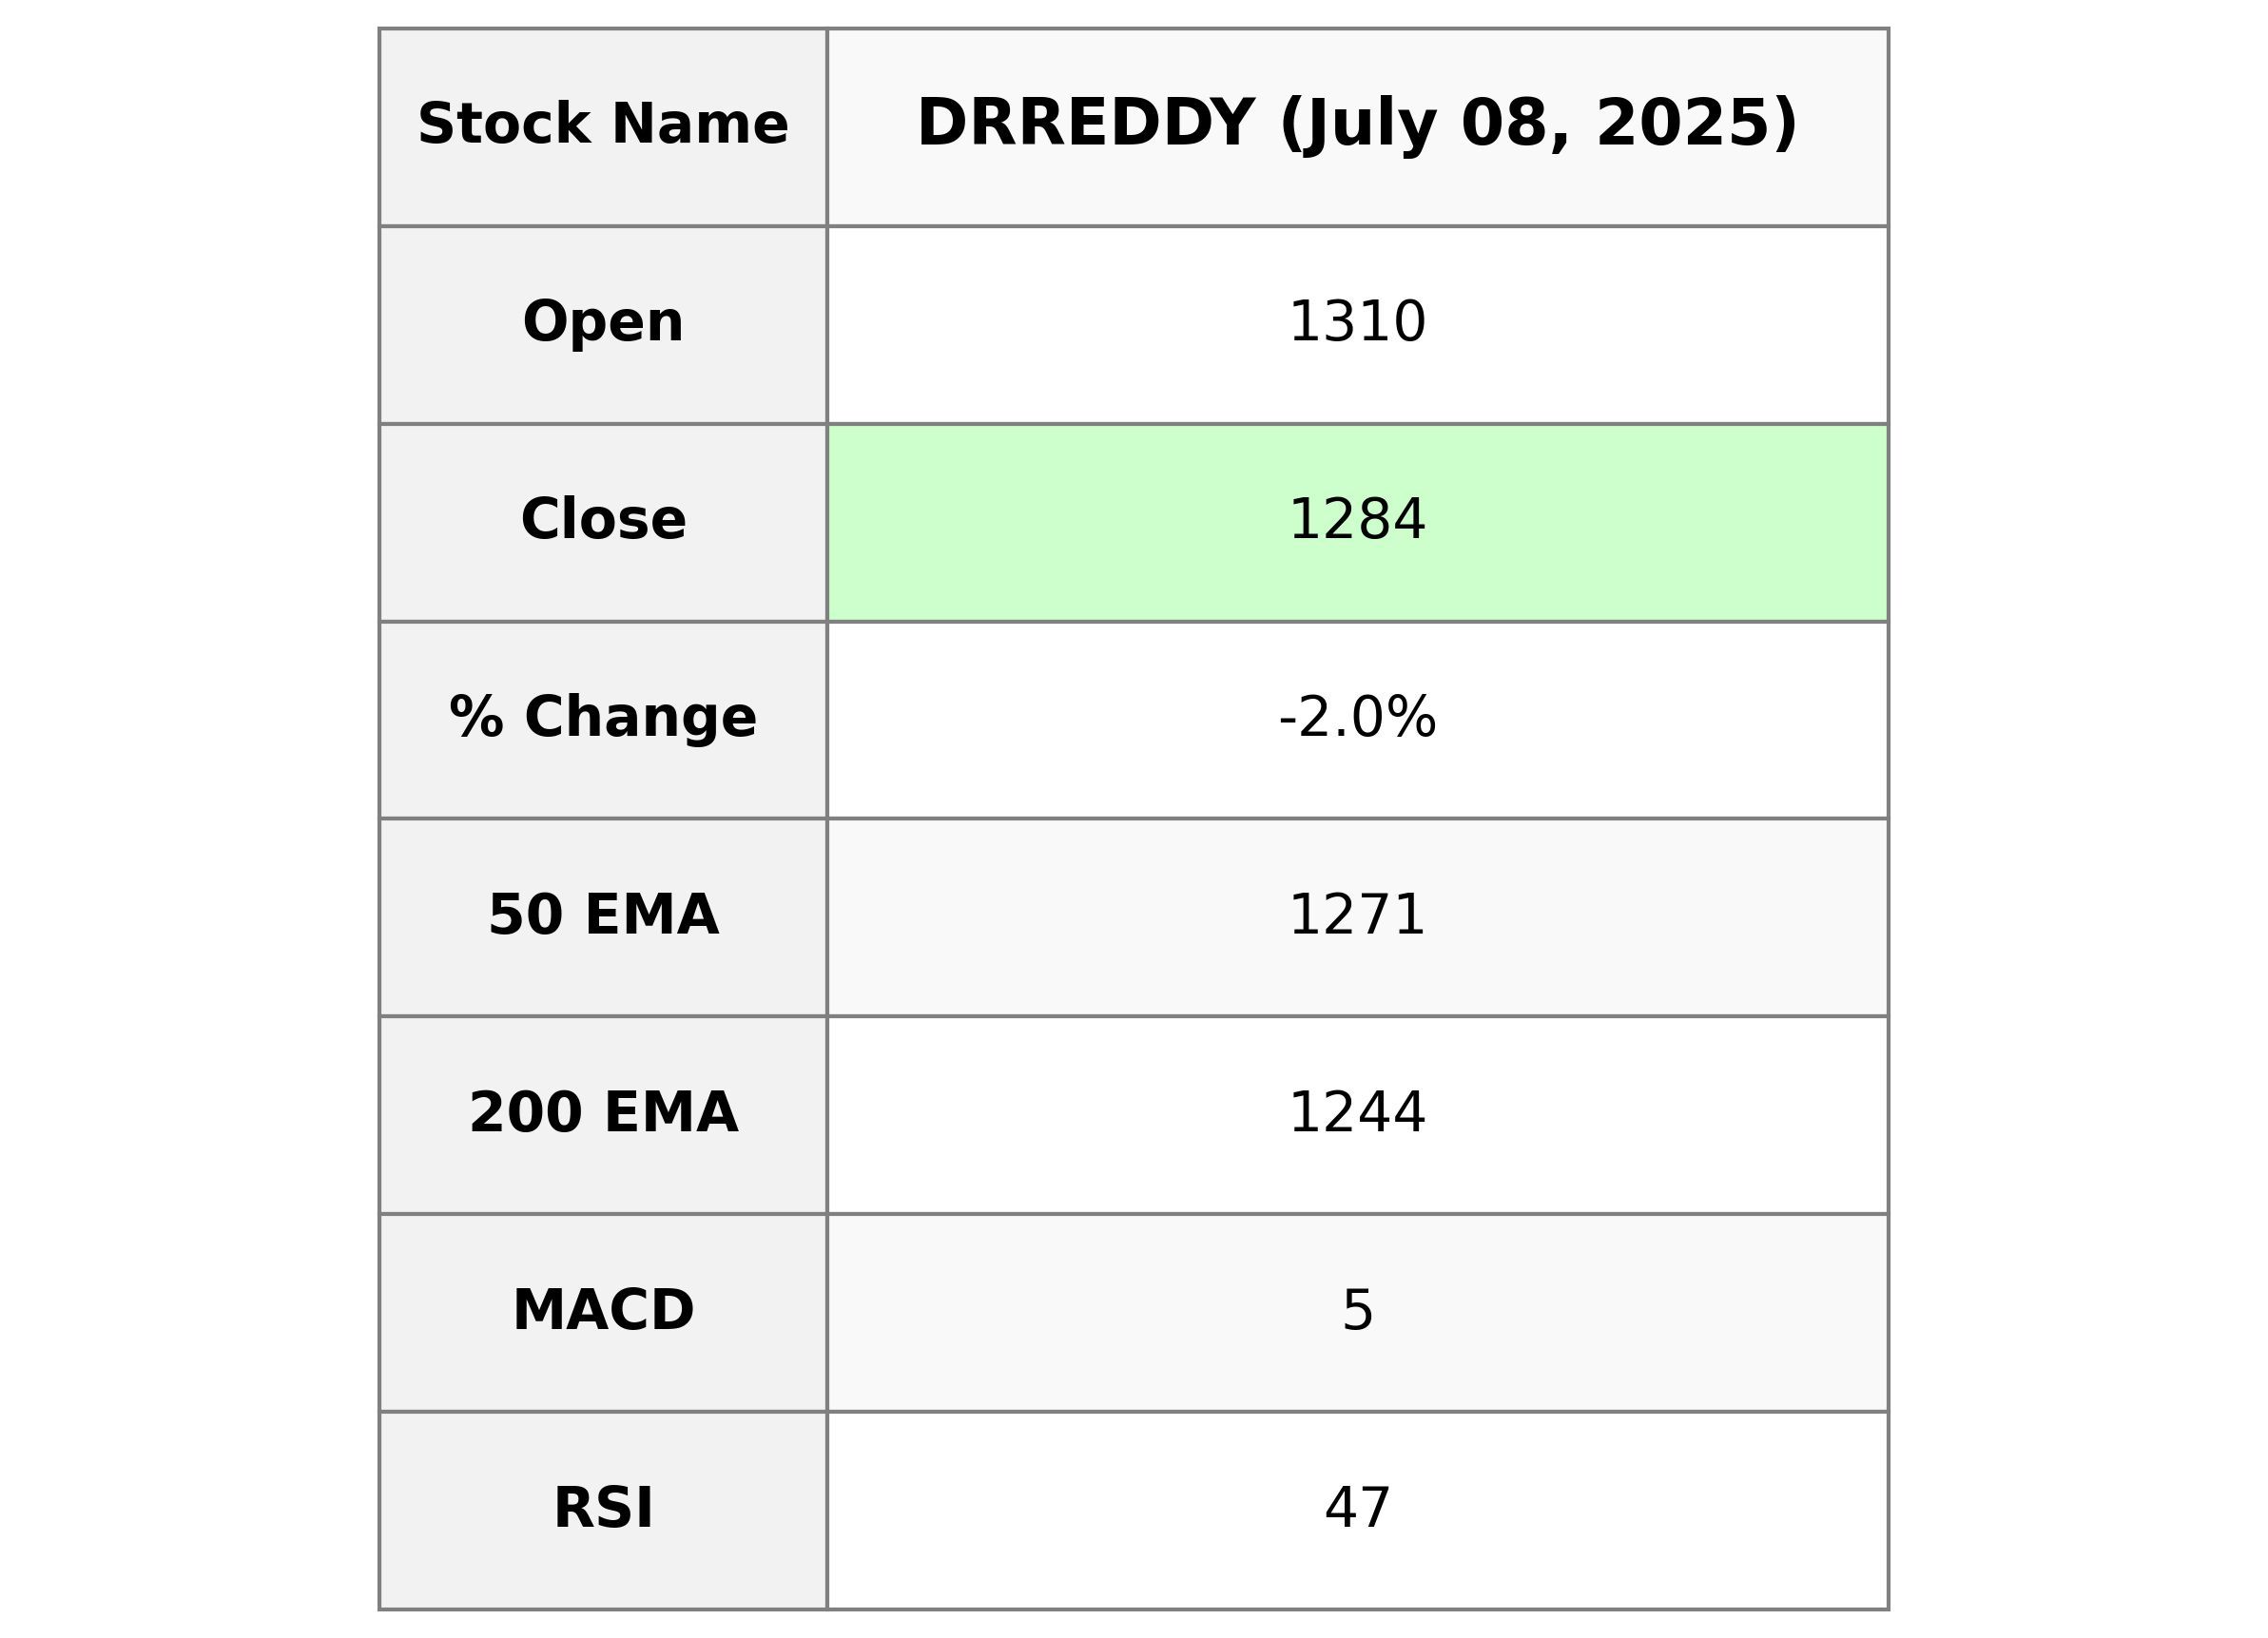
Dr Reddy's Laboratories, listed on the NSE, recently closed at 1,283.80, experiencing a decline of 2.04% from its previous close. The stock has an RSI of 46.90, indicating neither overbought nor oversold conditions. Despite this drop, the company's market cap remains robust at 1,068,288,507,904 INR, with a P/E ratio of 18.95 and earnings per share of 67.75. The pharmaceutical firm is part of the Healthcare sector, specializing in drug manufacturing for specialty and generic markets in India.
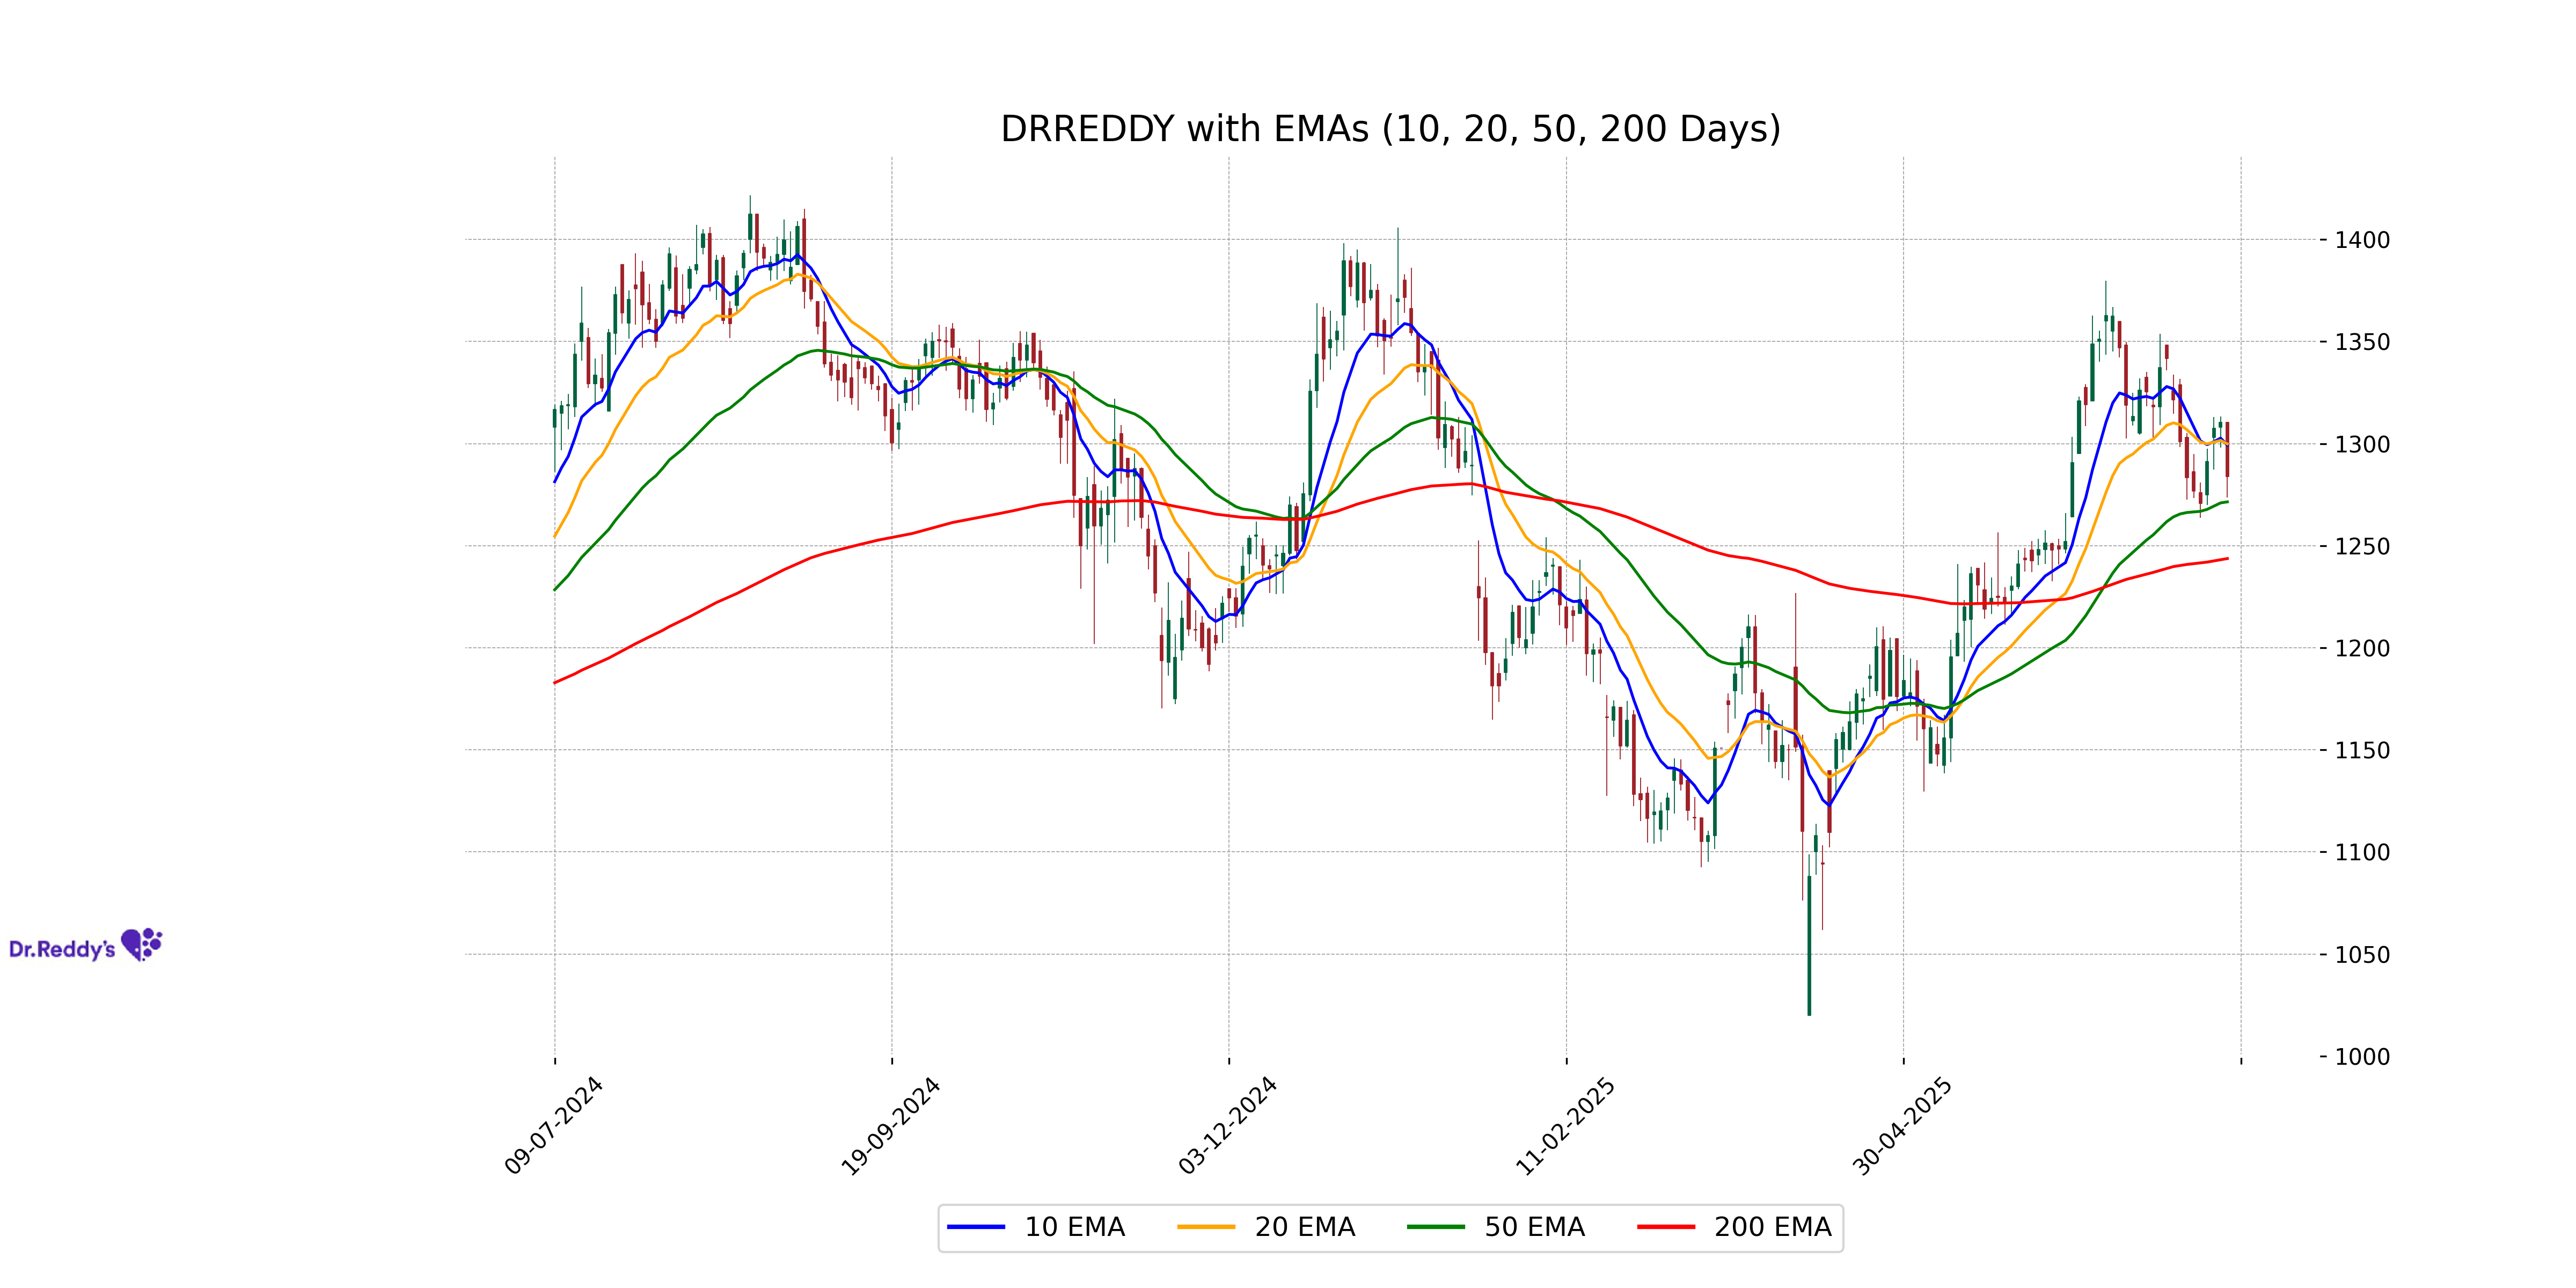
Relationship with Key Moving Averages
Dr Reddy's Labs is trading below both its 10-day and 20-day EMAs, indicating downward momentum in the short term. However, the stock is above its 50-day EMA, suggesting underlying support in a medium-term timeframe.
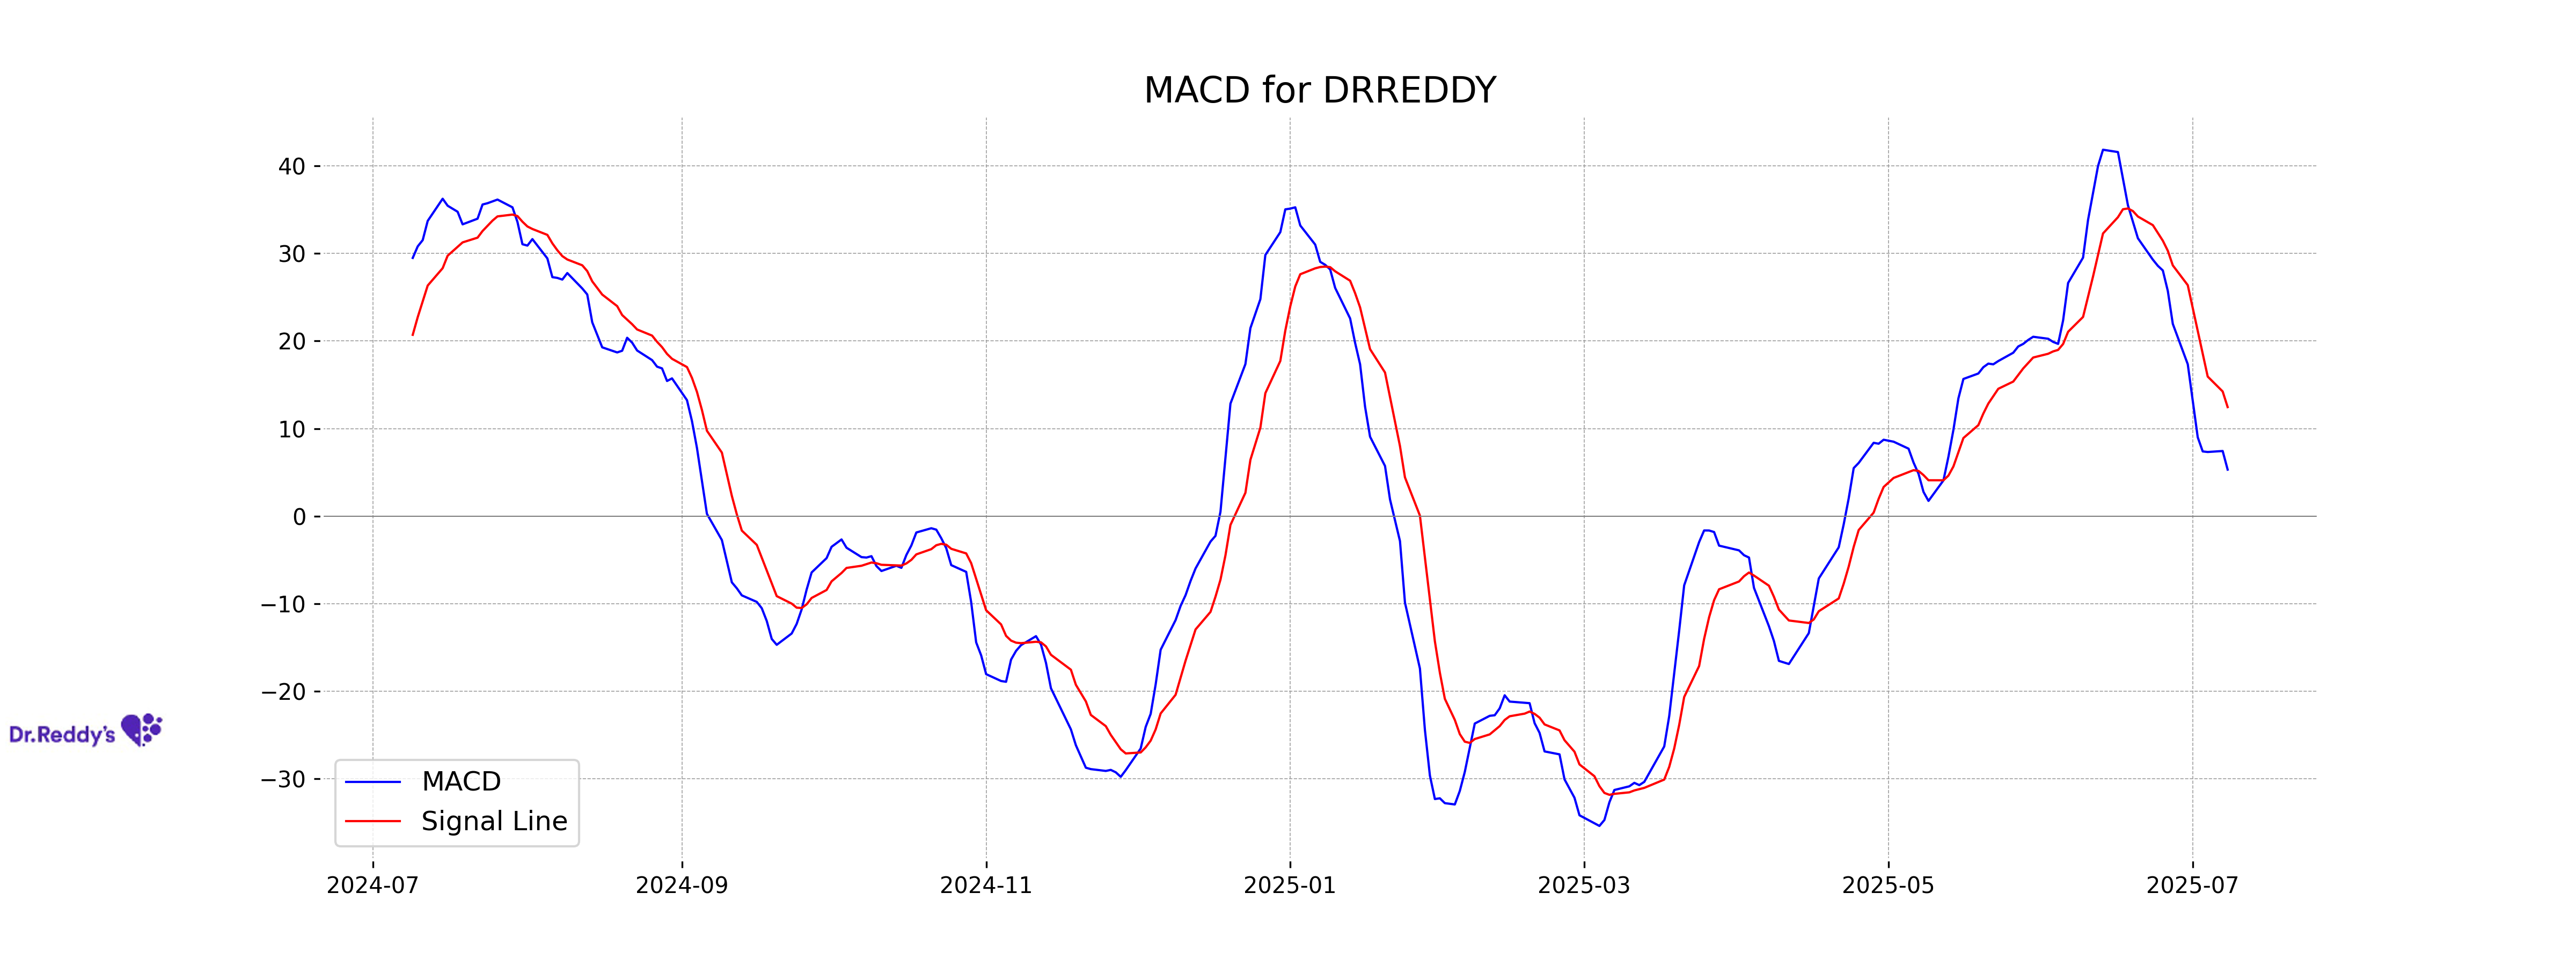
Moving Averages Trend (MACD)
Dr Reddys Labs has a MACD of 5.31, which is below the MACD signal of 12.45, suggesting a potential bearish crossover and indicating possible weakness or downward momentum in the stock price in the short term. Additionally, the RSI at 46.90 suggests the stock is currently neither overbought nor oversold.
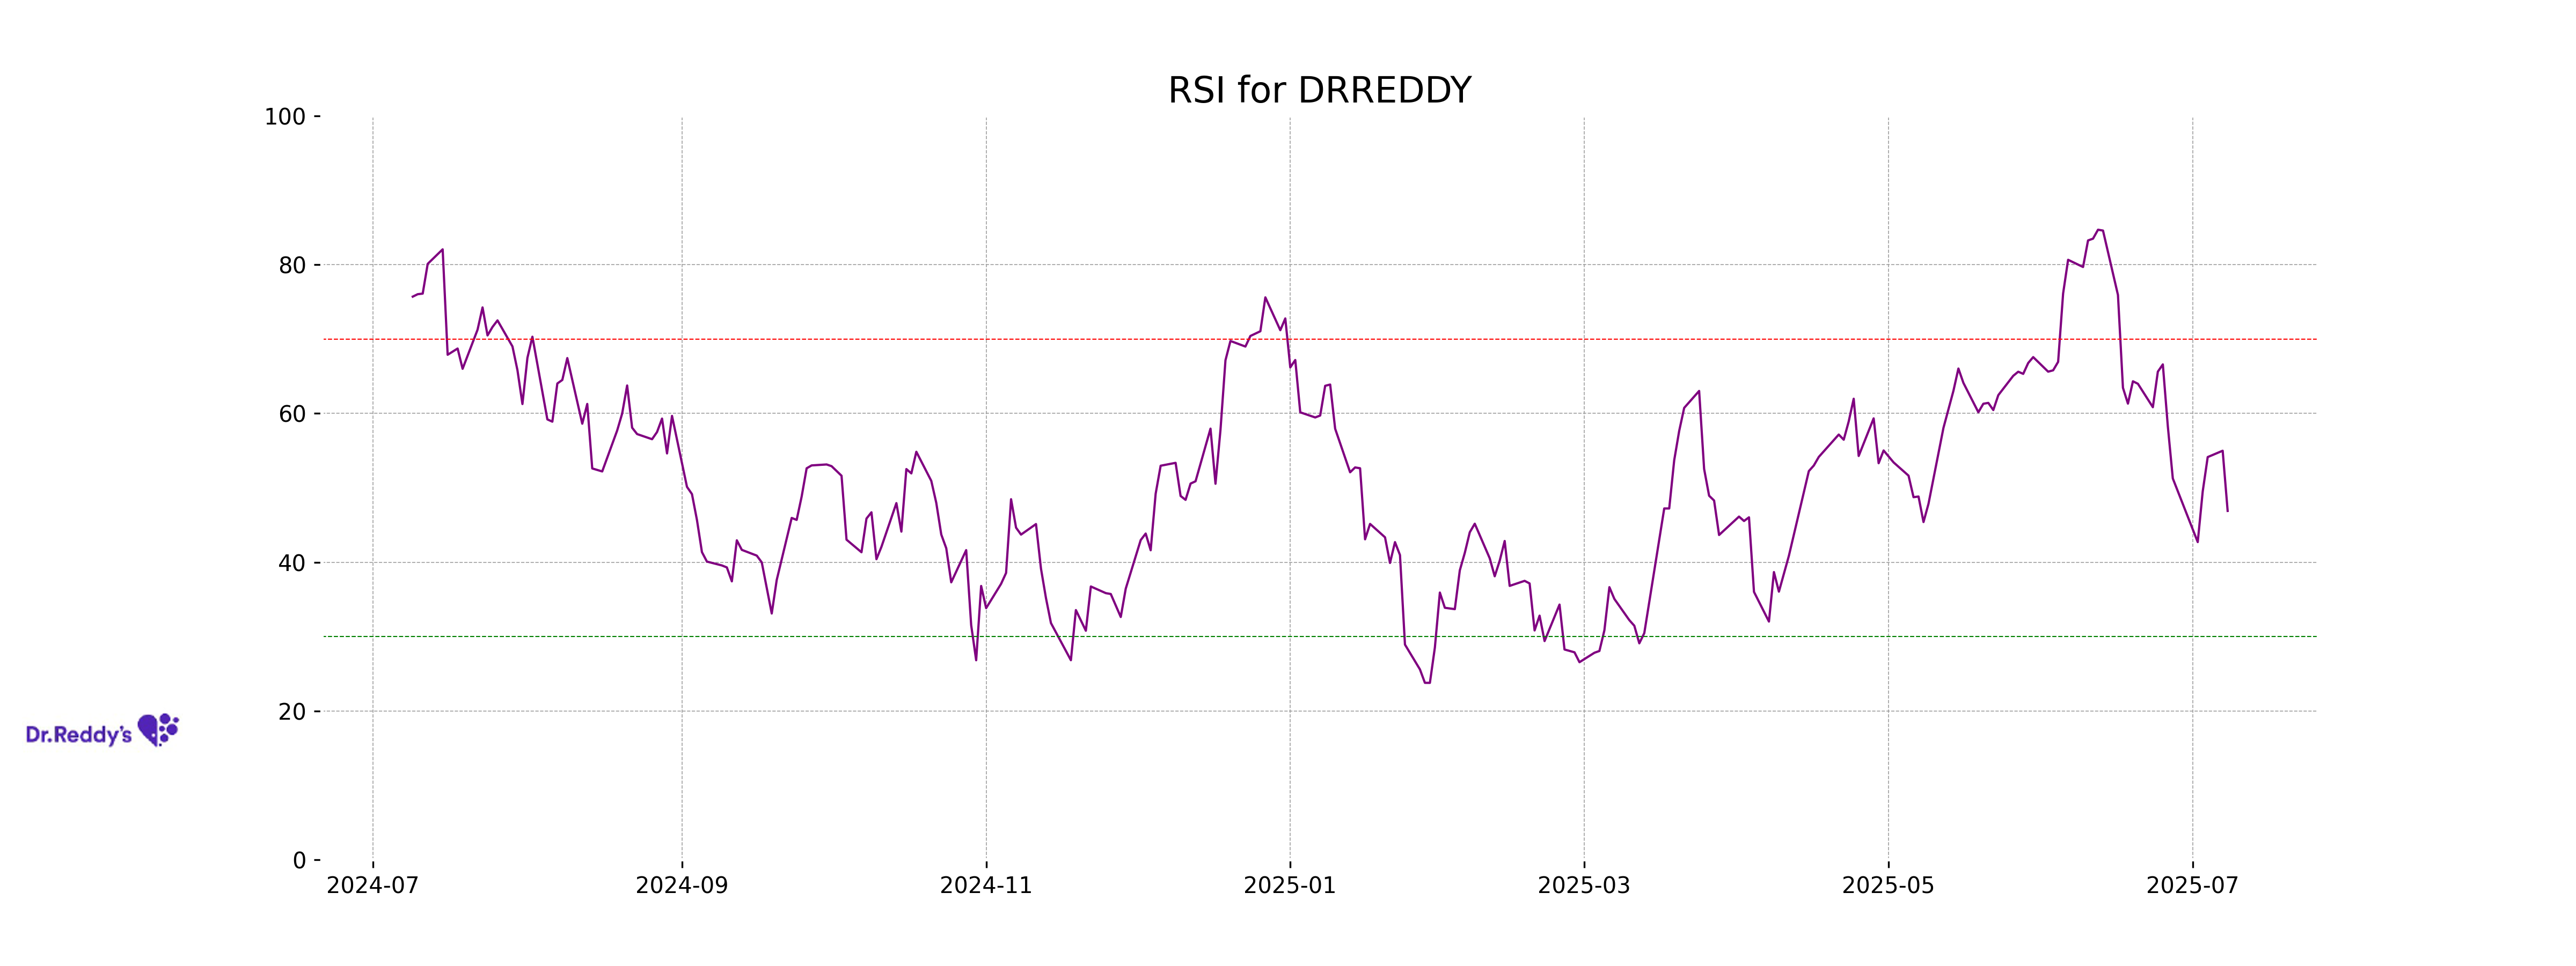
RSI Analysis
The Relative Strength Index (RSI) for Dr Reddys Labs is 46.90, which suggests that the stock is currently in a neutral zone. An RSI around 50 indicates there is no clear trend toward being overbought or oversold.
Analysis for Titan Company - July 08, 2025
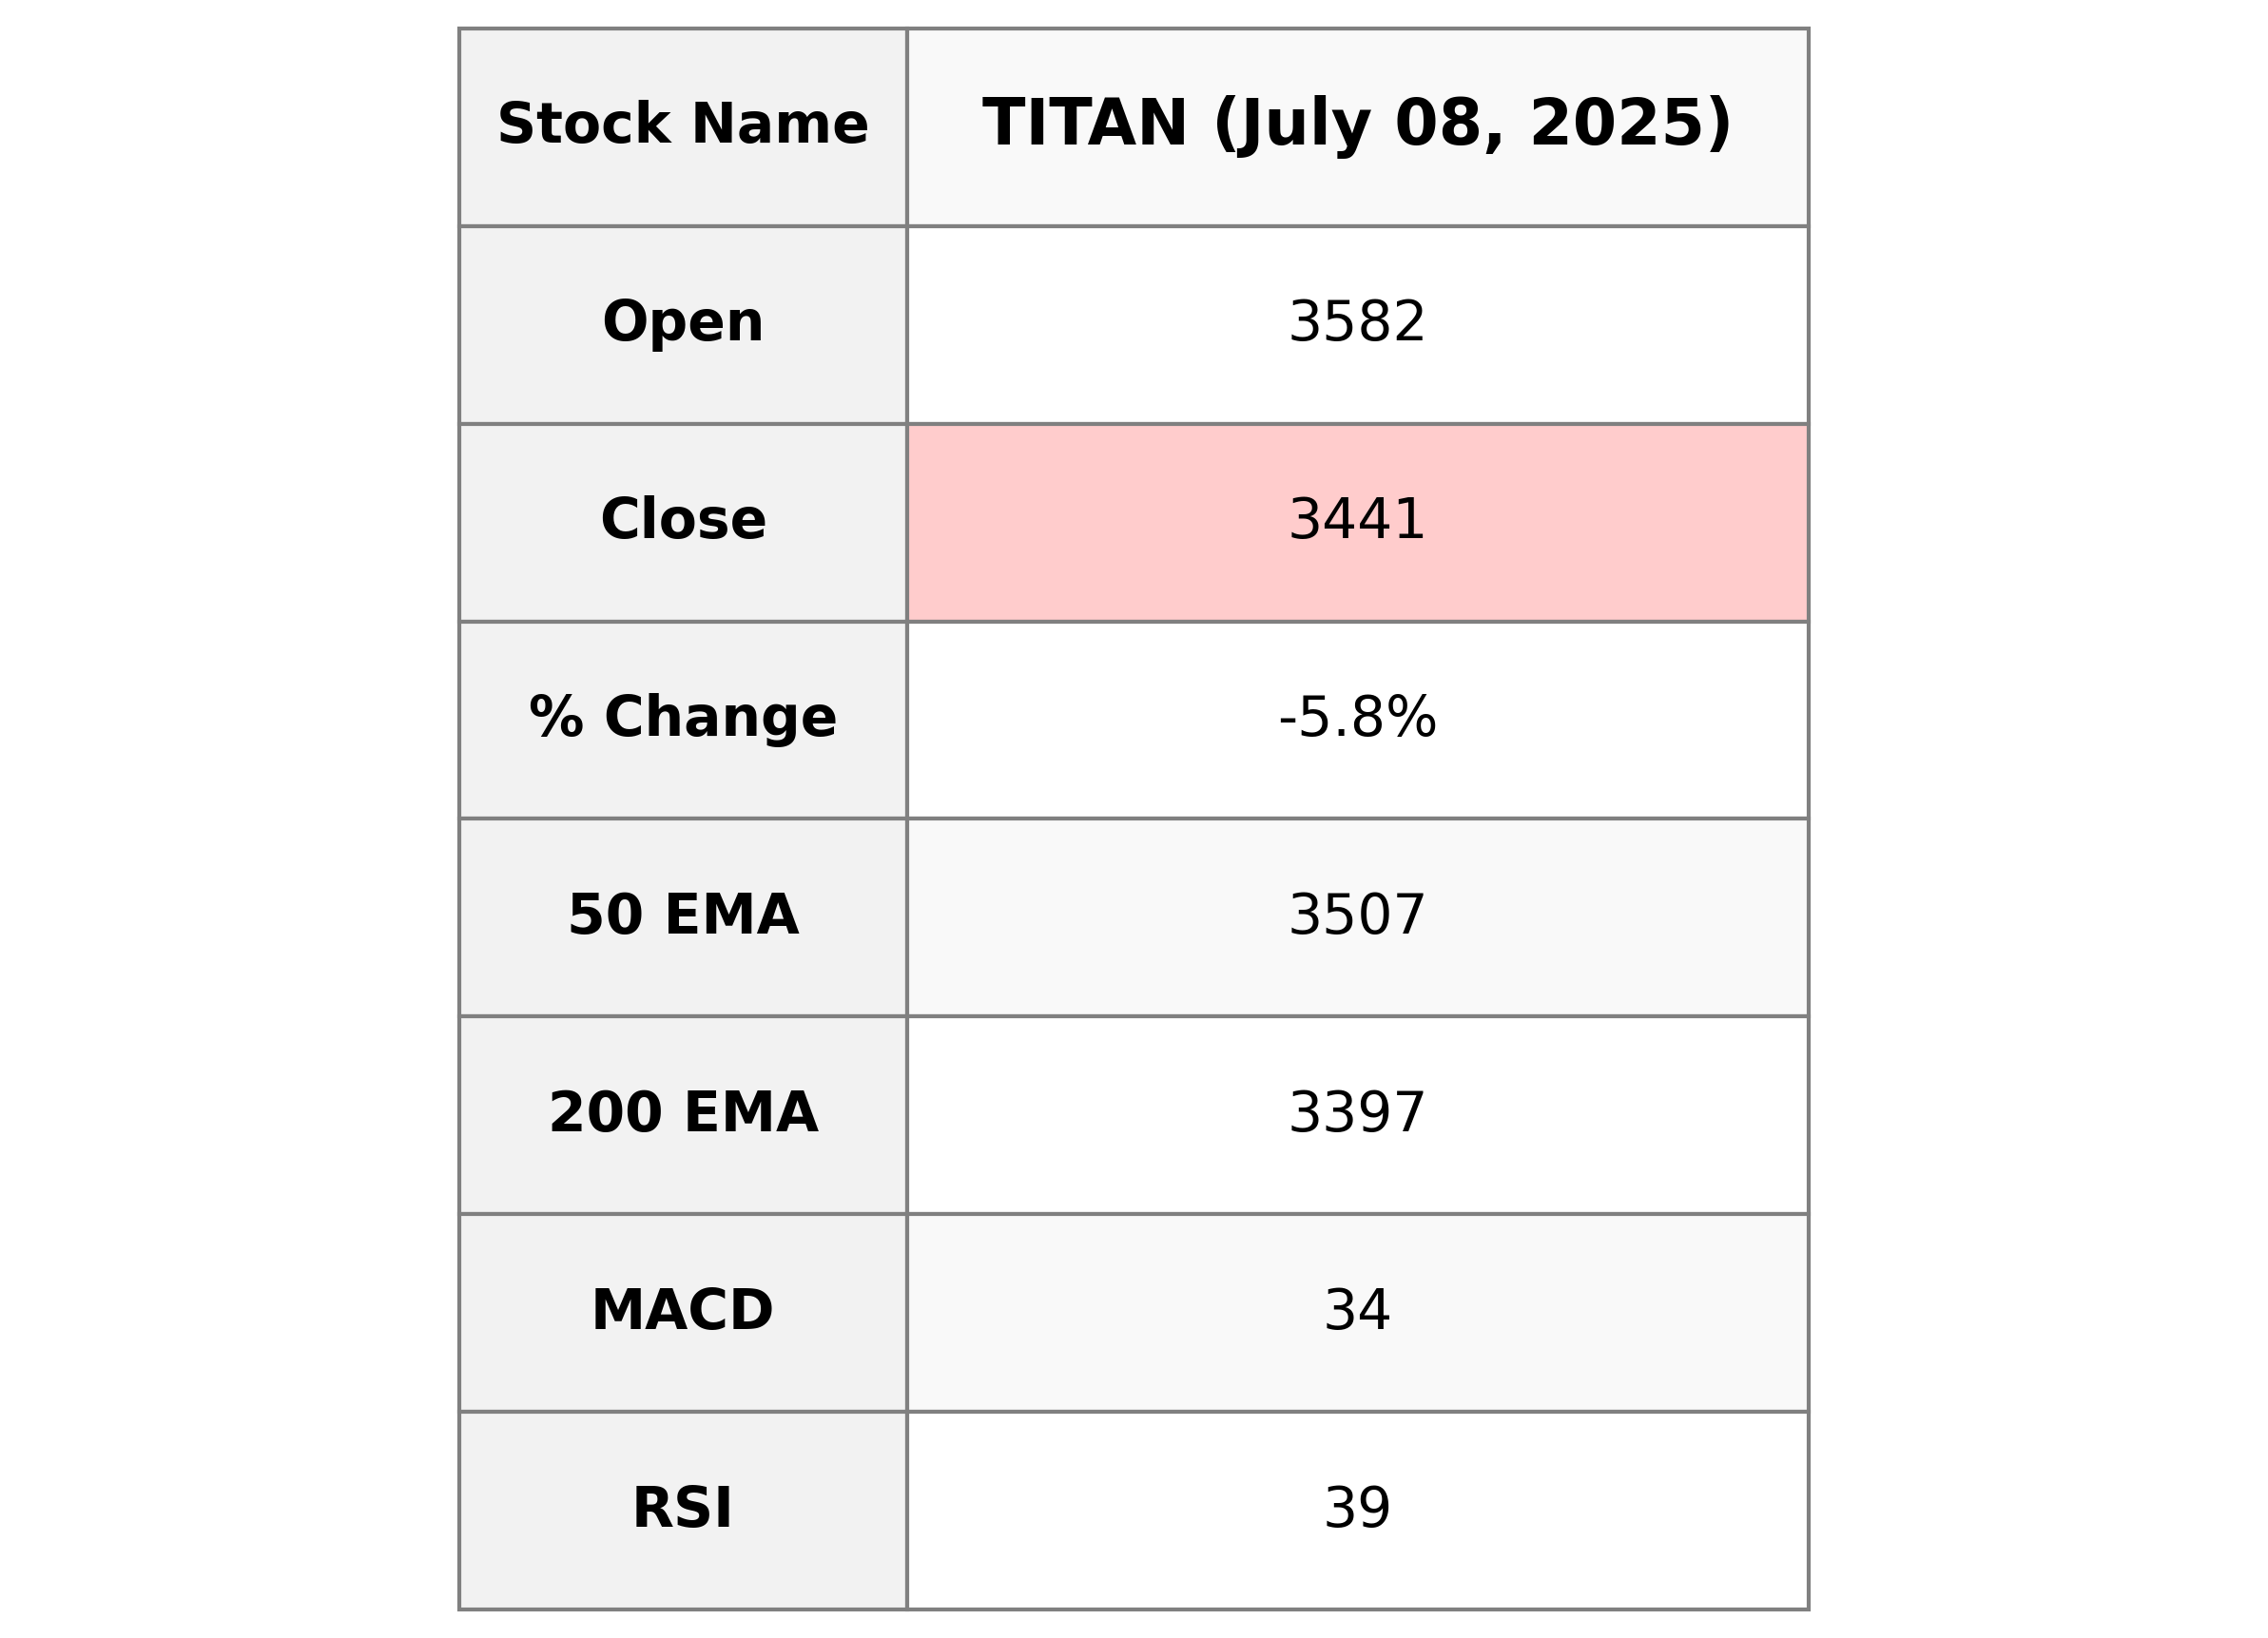
Titan Company experienced a significant drop in its stock price, closing at 3441.30, down from the previous close of 3655.10, marking a decline of approximately 5.85%. The stock showcased bearish signals with an RSI of 38.68, indicating potential underperformance, and trading below its short-term EMAs. Despite this, Titan maintains a robust market position with a market cap of over 3 trillion INR, operating in the Luxury Goods sector in India.
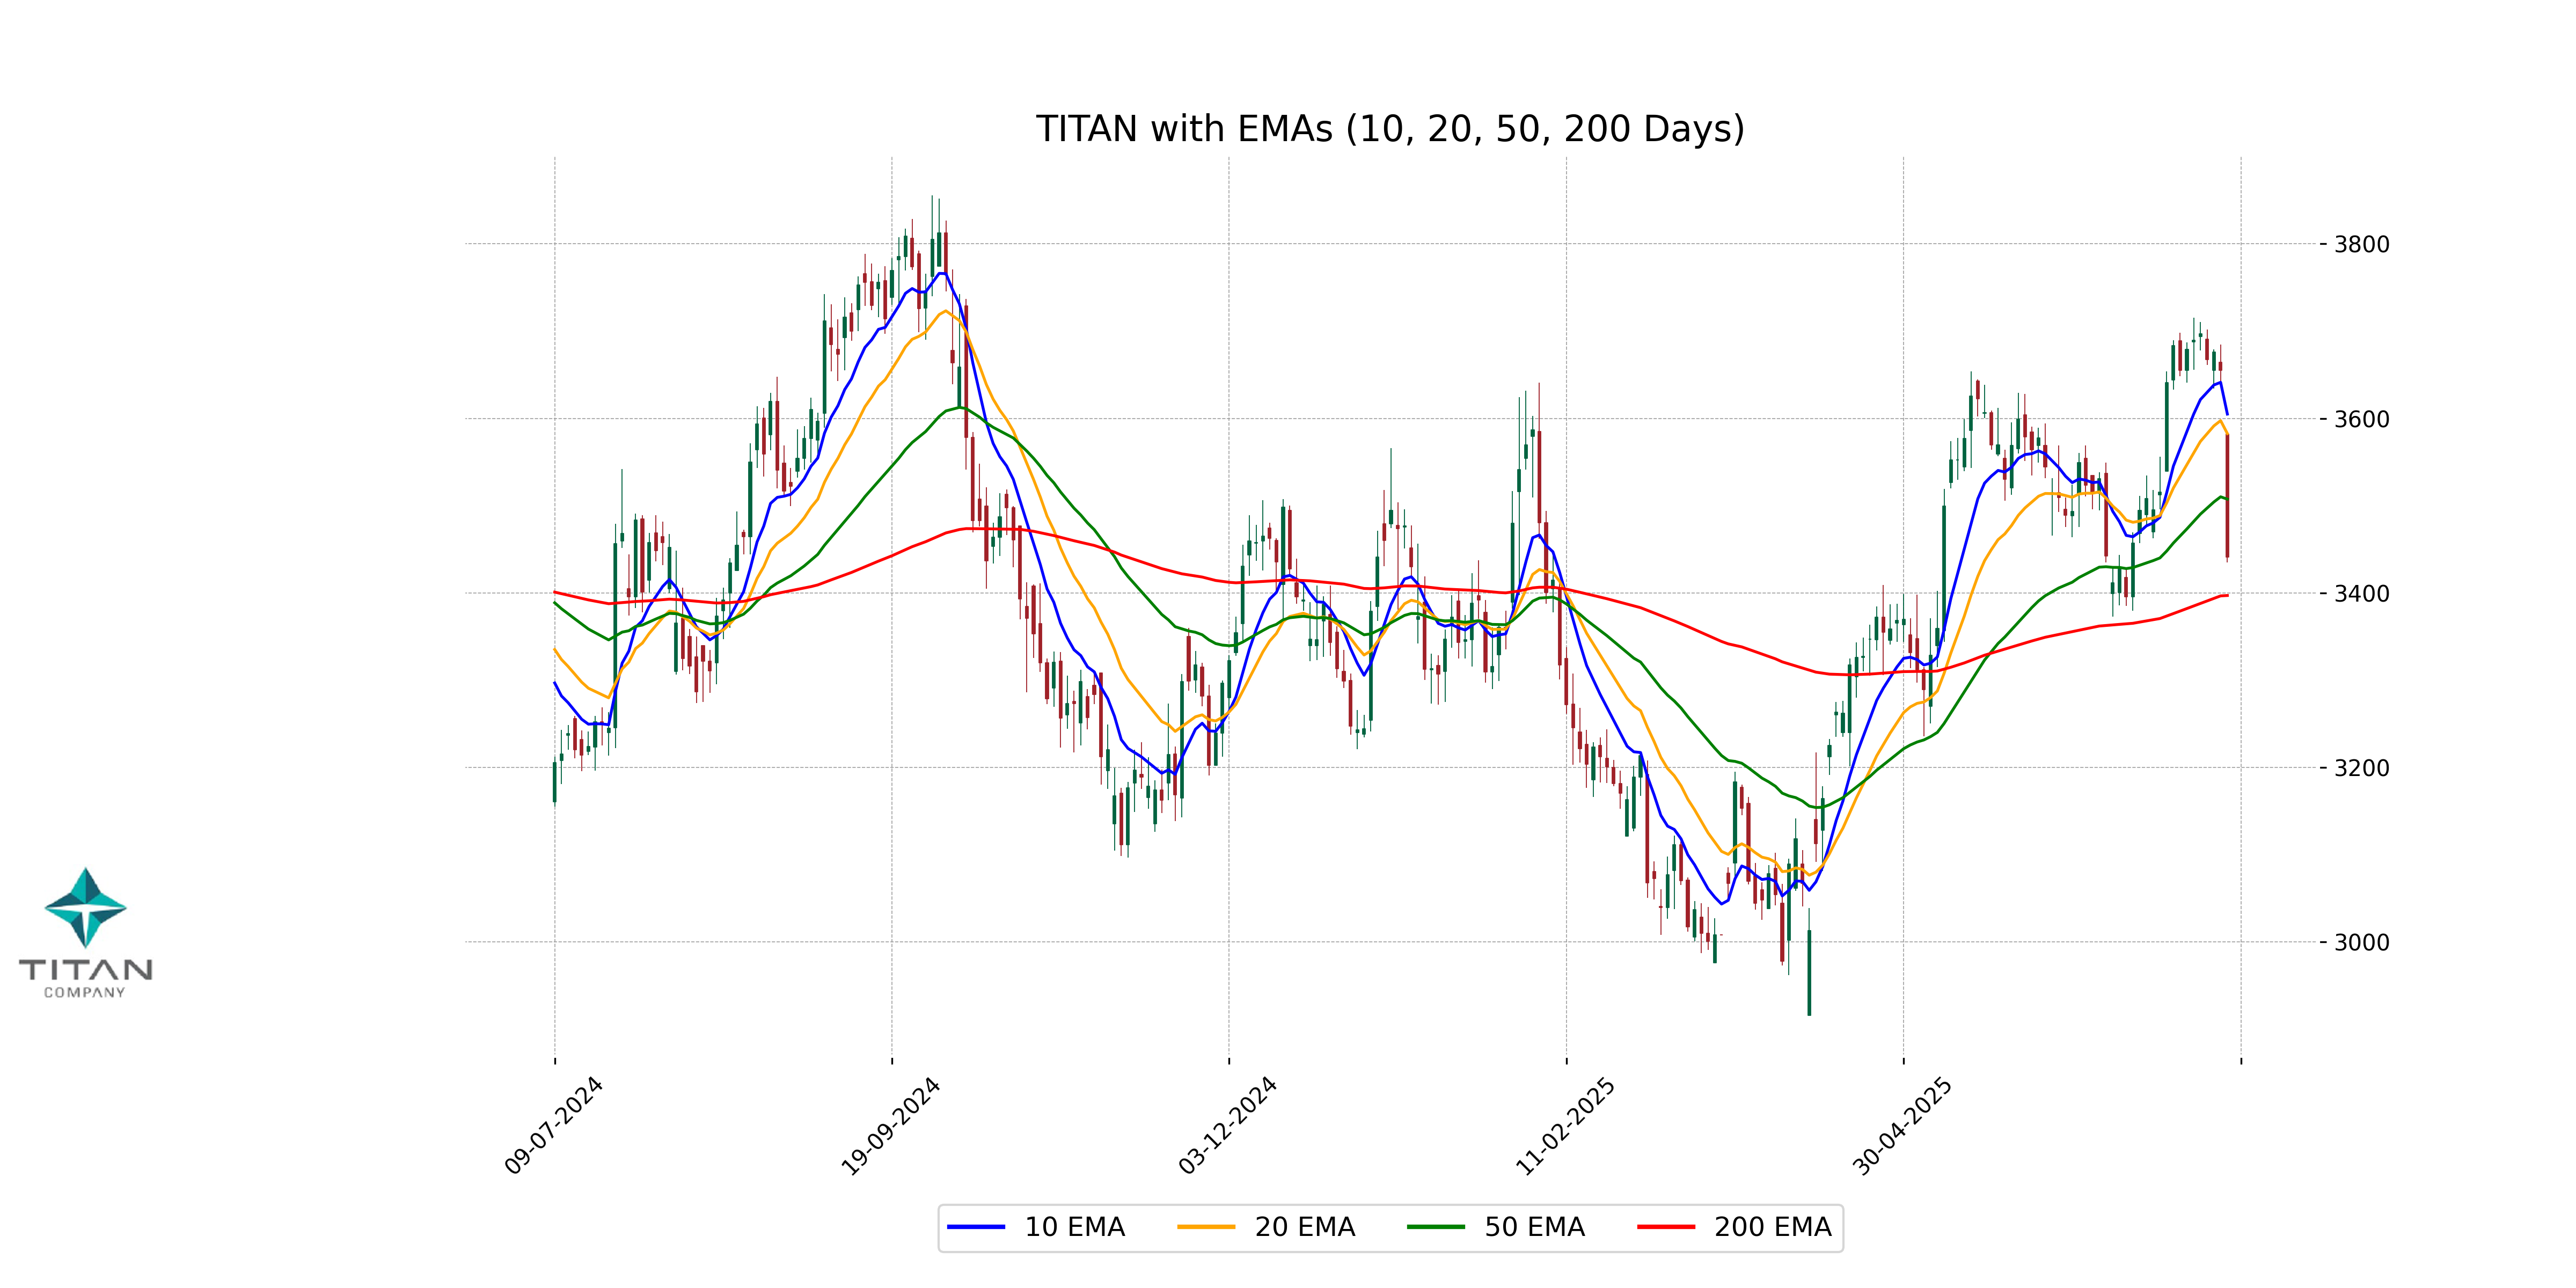
Relationship with Key Moving Averages
Titan Company is trading below its 10-day, 20-day, and 50-day EMAs, indicating a bearish trend in the short and medium term. The current price of 3441.30 is also below the 200-day EMA of 3397.12, suggesting potential support around the long-term average. With a close price well below the 50-day EMA, it indicates recent weakness relative to this key moving average.
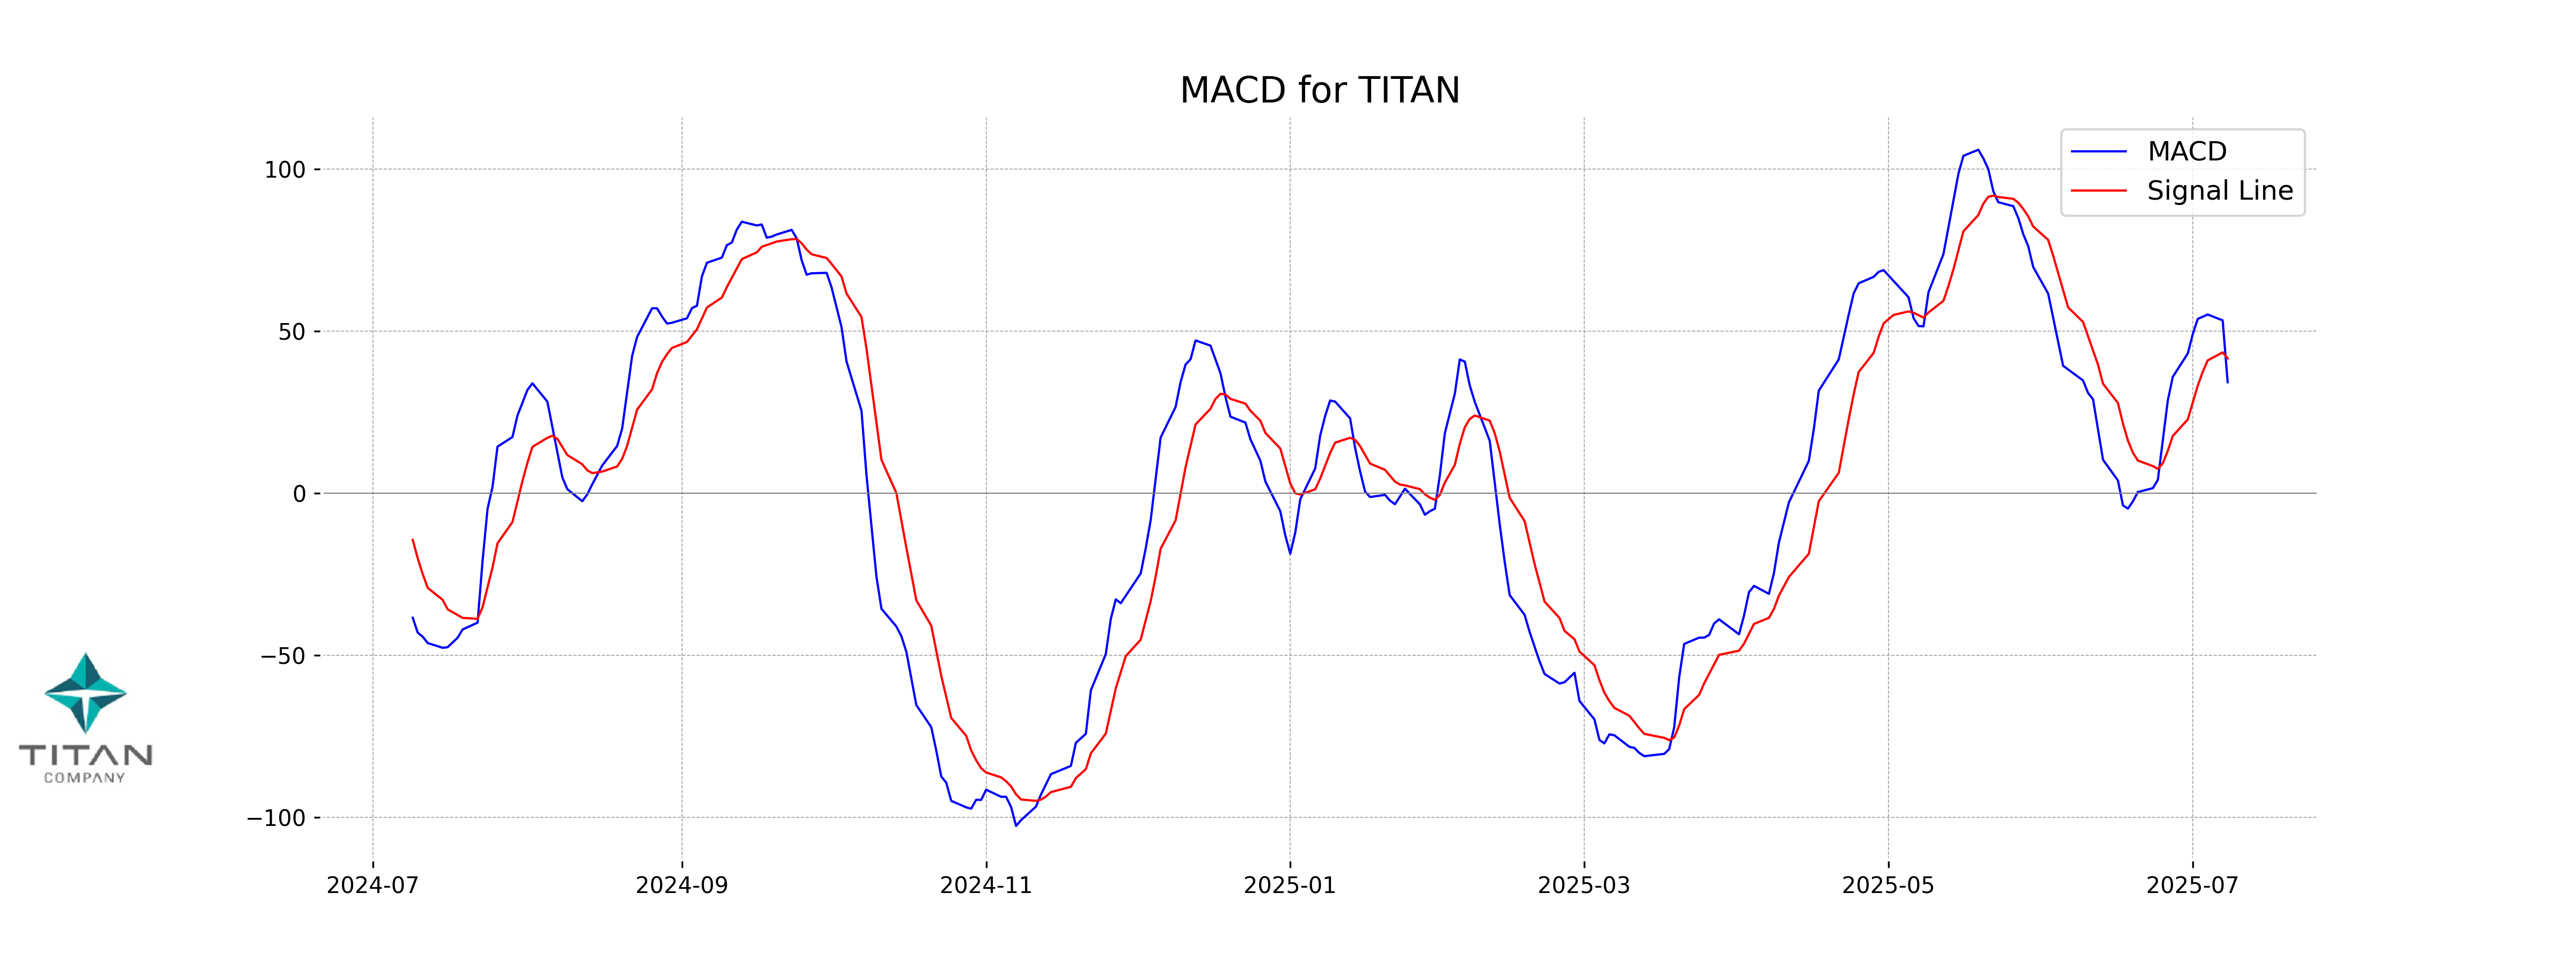
Moving Averages Trend (MACD)
The MACD (Moving Average Convergence Divergence) for Titan Company is 34.25 with a signal line of 41.61. Since the MACD is below the signal line, it suggests a bearish momentum. Additionally, the RSI (Relative Strength Index) at 38.68 indicates that the stock might be approaching an oversold condition.
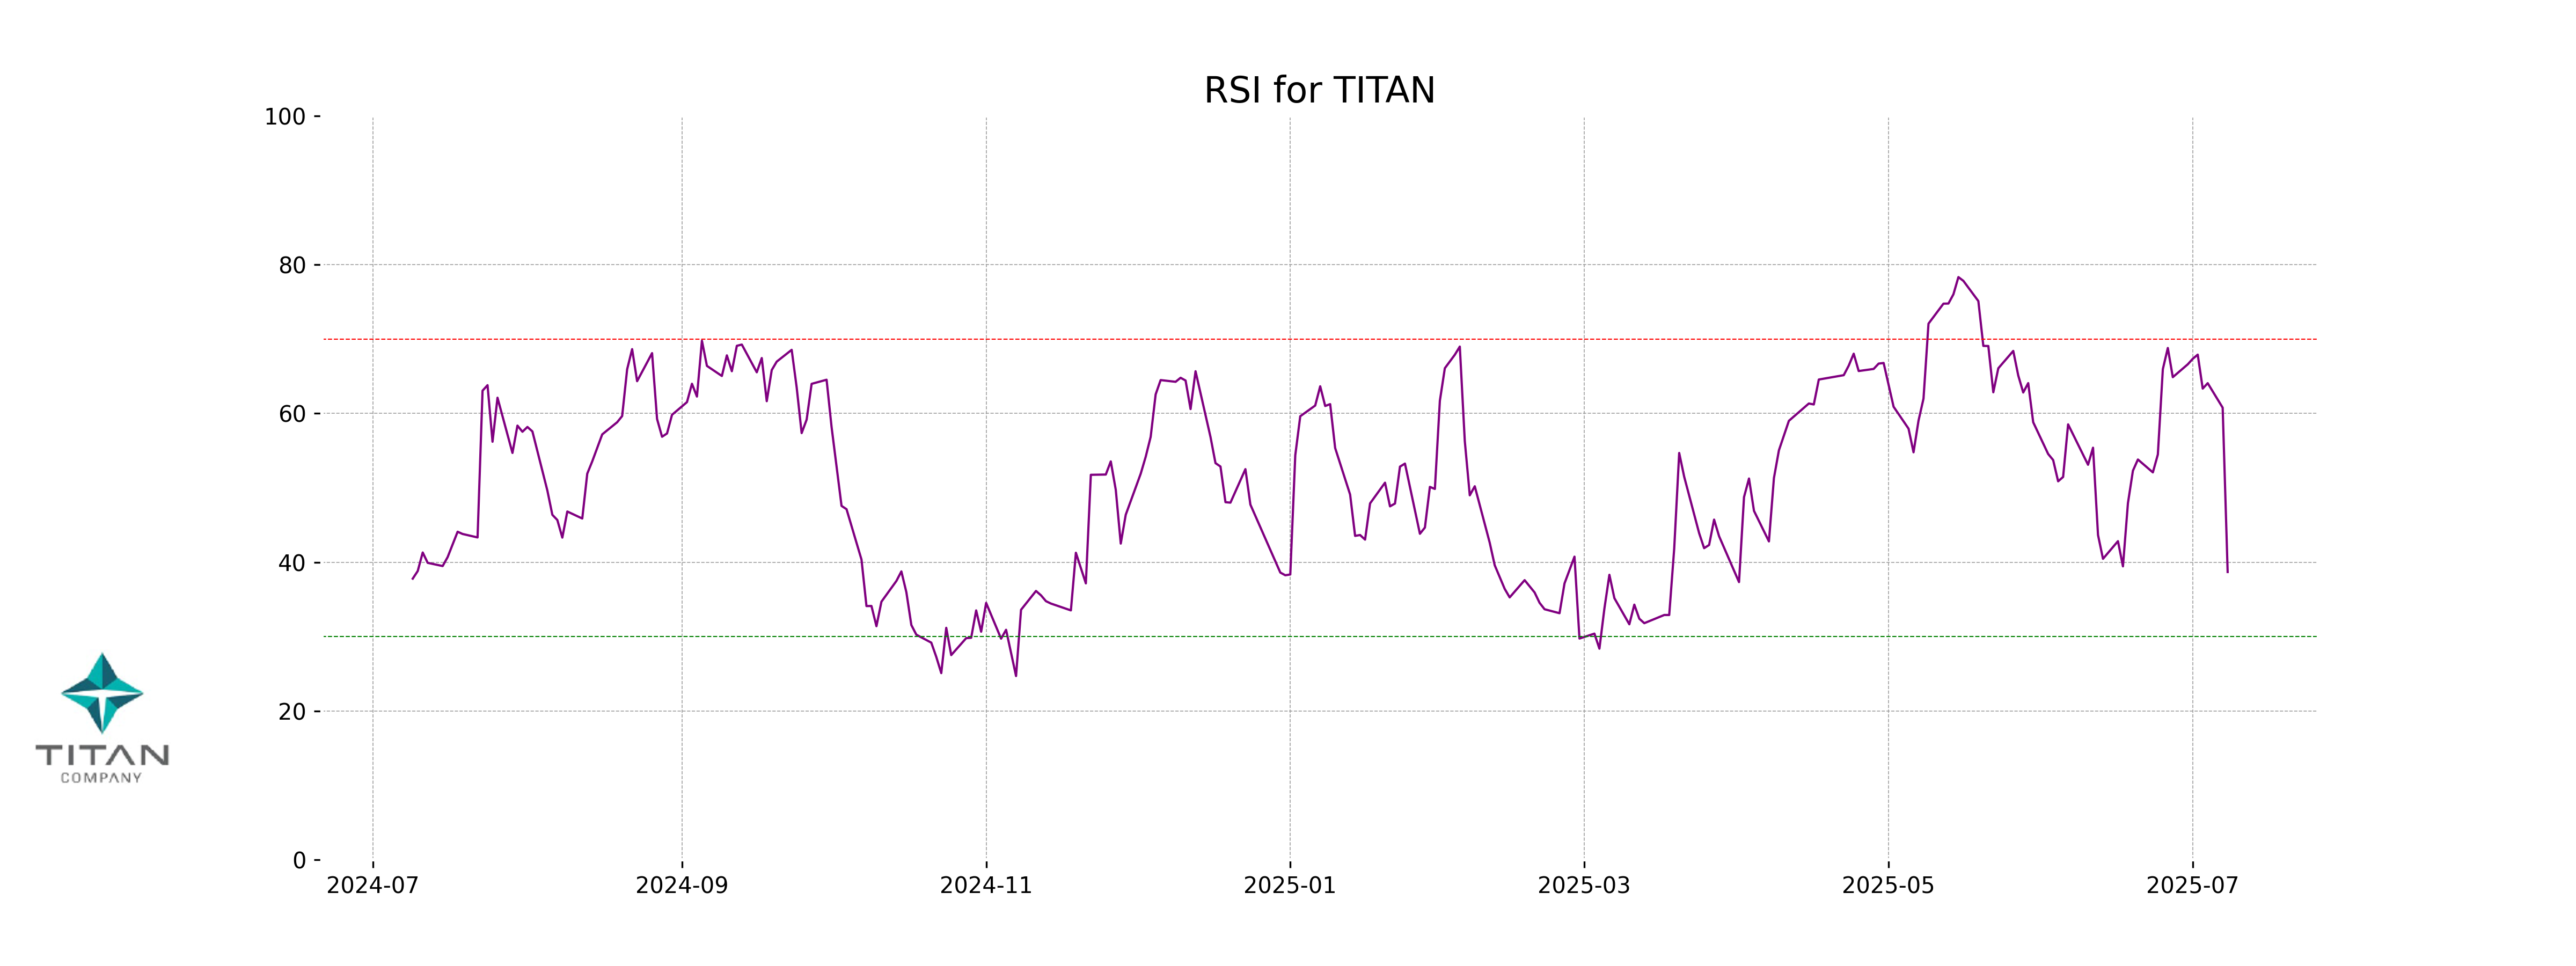
RSI Analysis
RSI Analysis for Titan Company: The RSI for Titan Company is 38.68, indicating that the stock is in the lower range of the RSI scale. This suggests potential oversold conditions, which may present a buying opportunity if investors expect a rebound.
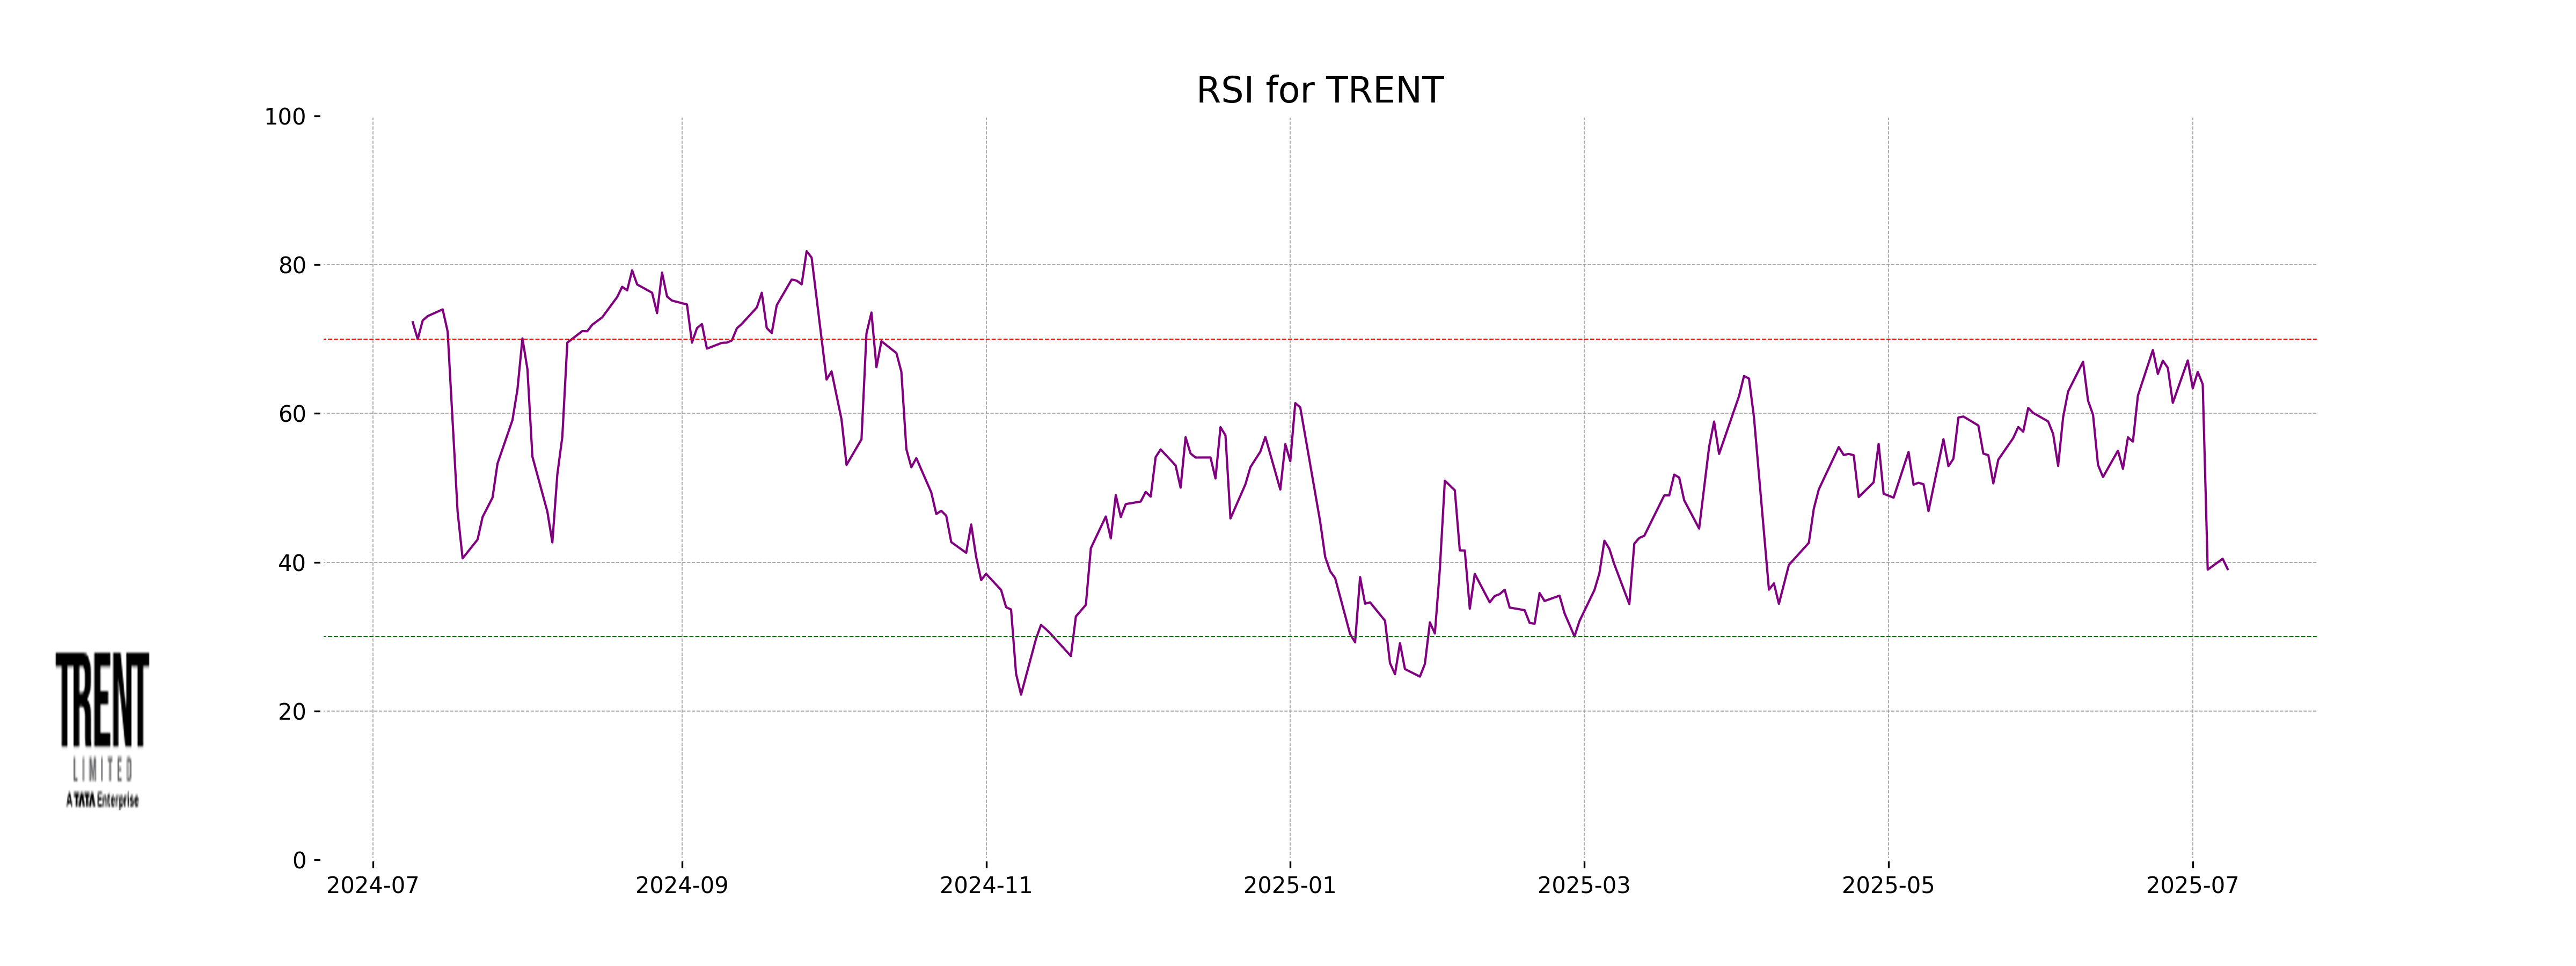
Analysis for Trent - July 08, 2025
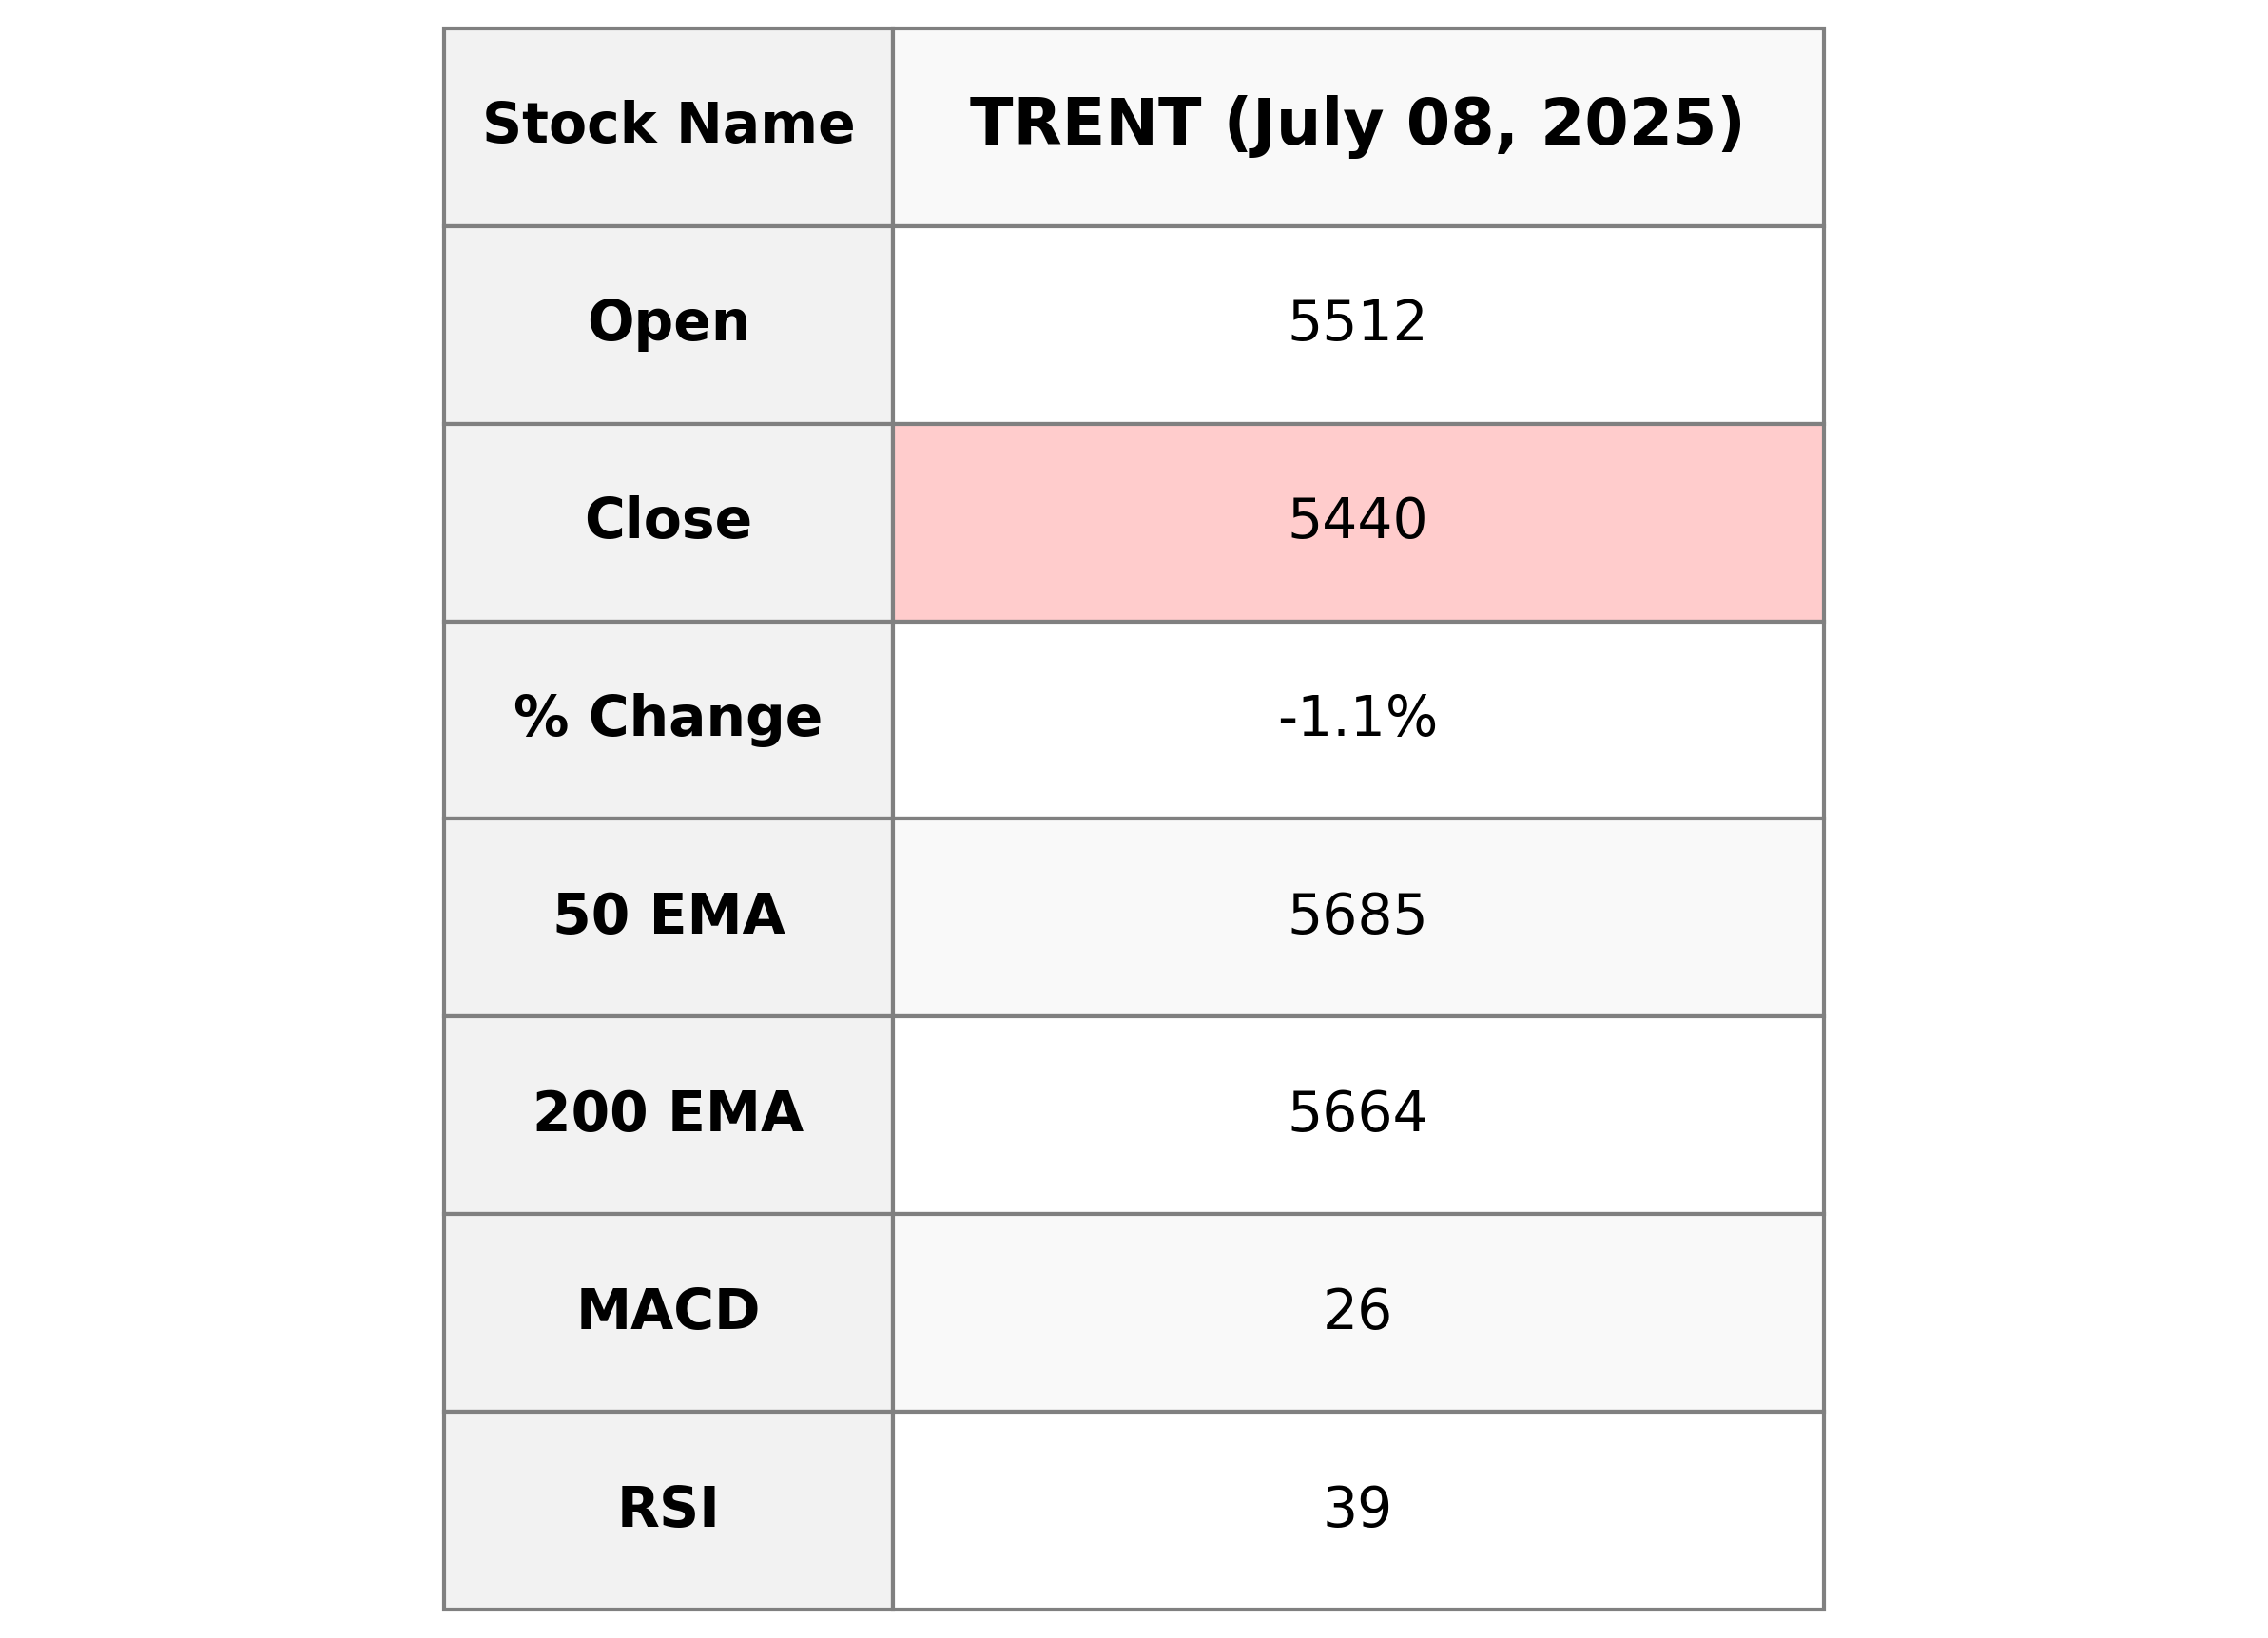
Trent Performance: Trent experienced a decline in its stock price with a closing value of 5440.0, marking a decrease of approximately 1.07% from the previous close. The stock saw a high of 5517.5 and a low of 5370.0, with trading volume reaching 1,698,854. Indicators such as the 50 EMA, at 5684.62, suggest a bearish trend in the short term, while the RSI at 39.08 indicates the stock might be nearing oversold territory.
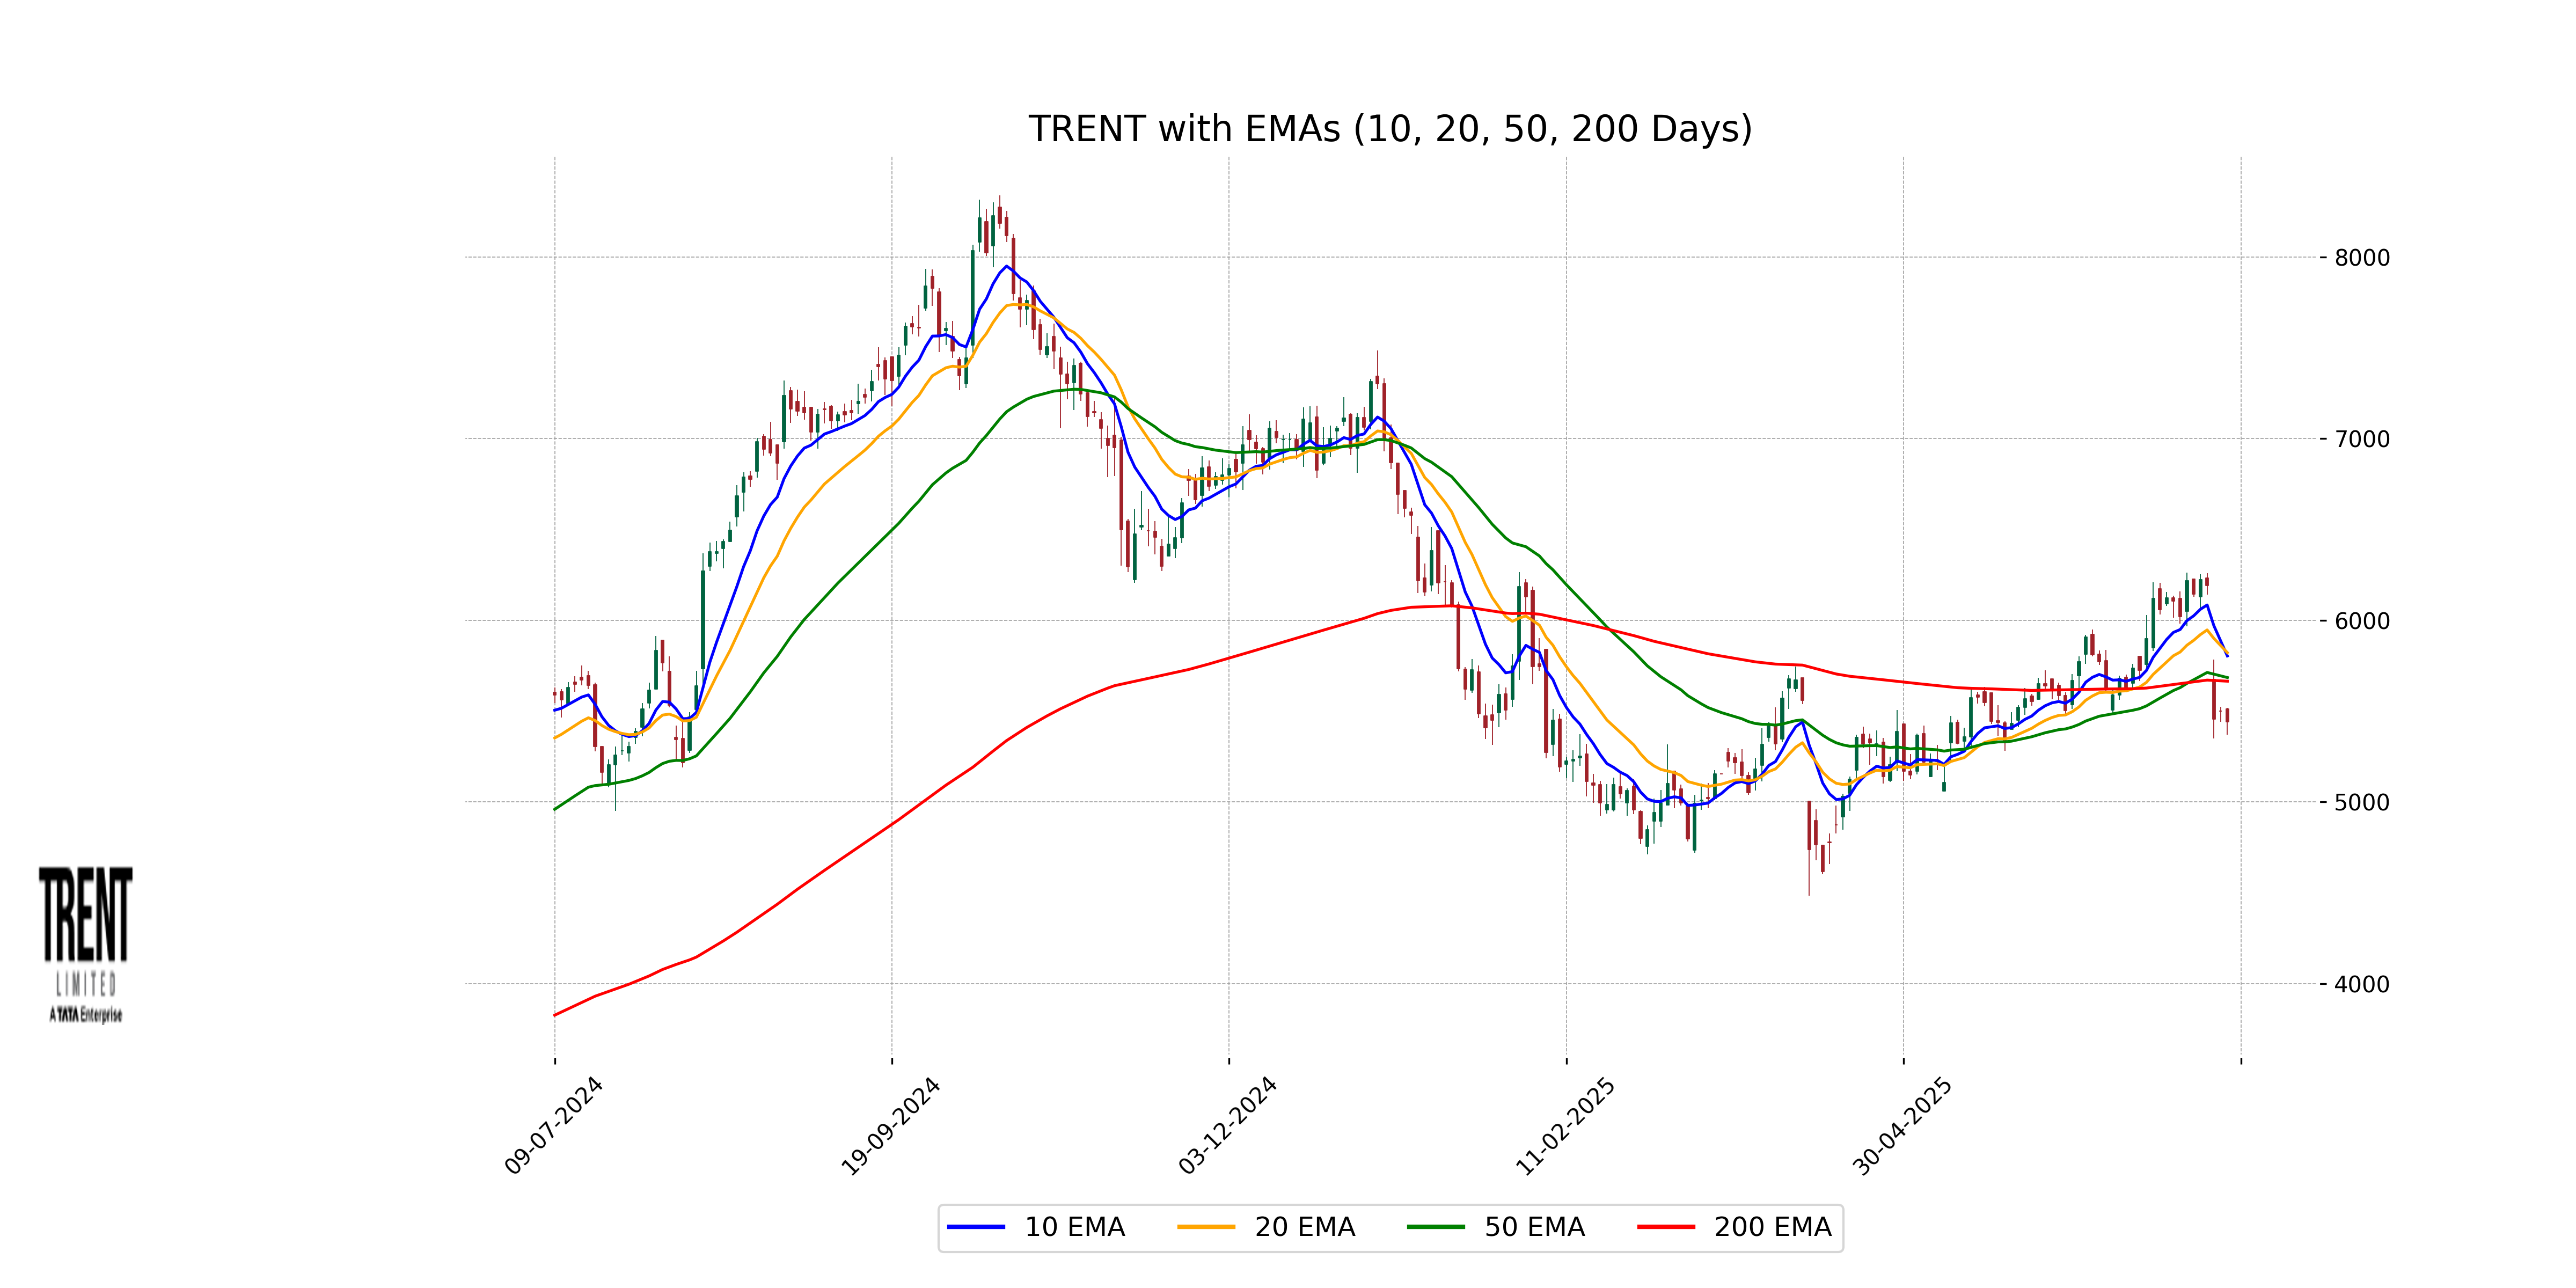
Relationship with Key Moving Averages
The closing price of Trent at 5440.0 is below all key moving averages, suggesting a bearish trend for the stock. Specifically, it is below the 10 EMA (5803.50), 20 EMA (5821.64), 50 EMA (5684.62), and 200 EMA (5664.50), signaling potential resistance at these levels.
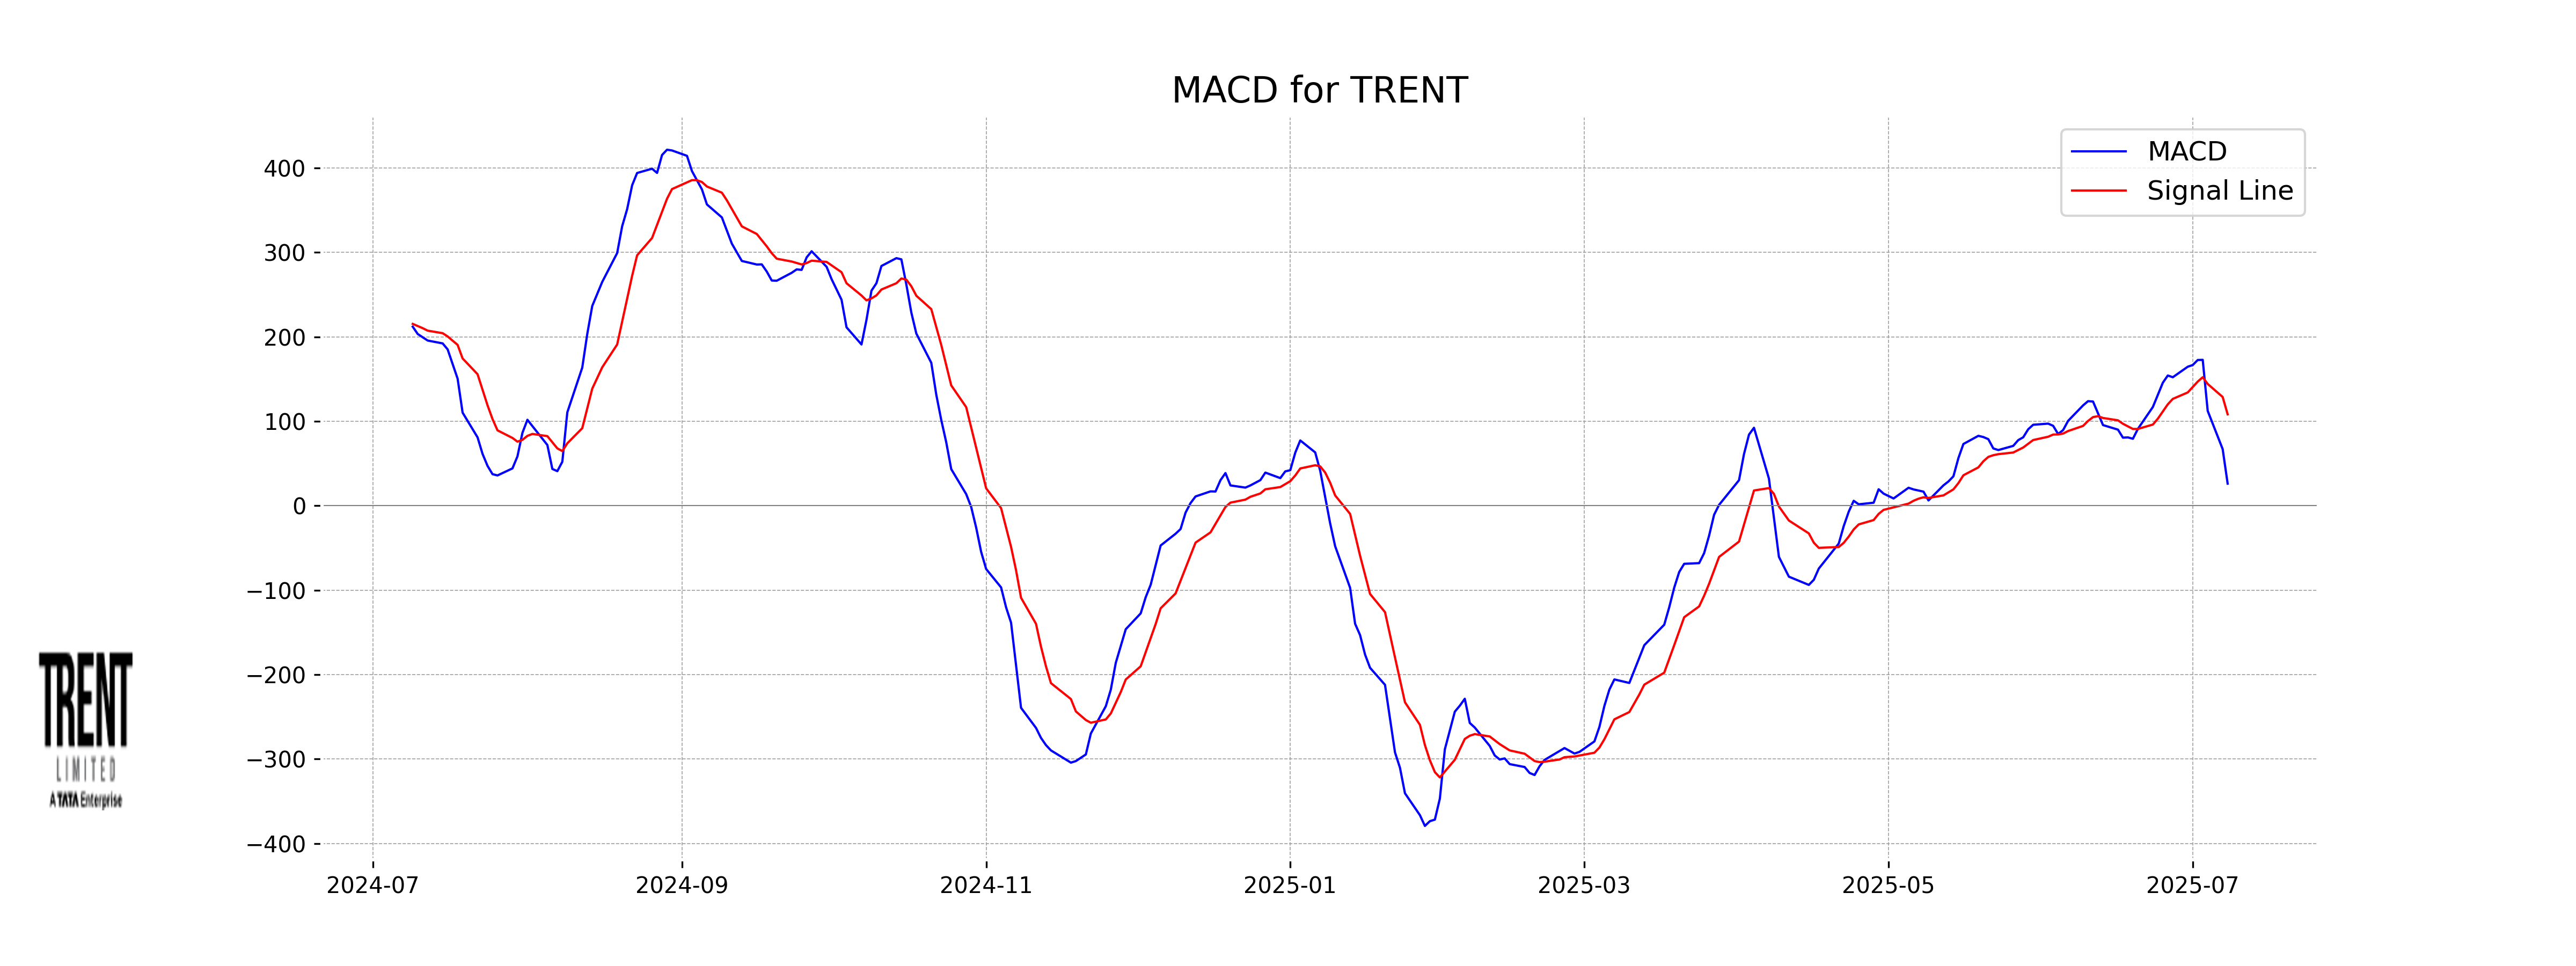
Moving Averages Trend (MACD)
Trent's MACD analysis suggests that the stock may be experiencing bearish momentum. The MACD line (26.22) is below the MACD Signal line (108.30), indicating a potential downtrend. This is also supported by the low RSI value of 39.08, showing that the stock may be in oversold territory.
RSI Analysis
Based on the given data for Trent, the RSI (Relative Strength Index) is 39.08. This suggests that the stock is approaching an oversold condition but is not yet in oversold territory, which typically starts below 30. This could indicate a potential buying opportunity if other indicators align.