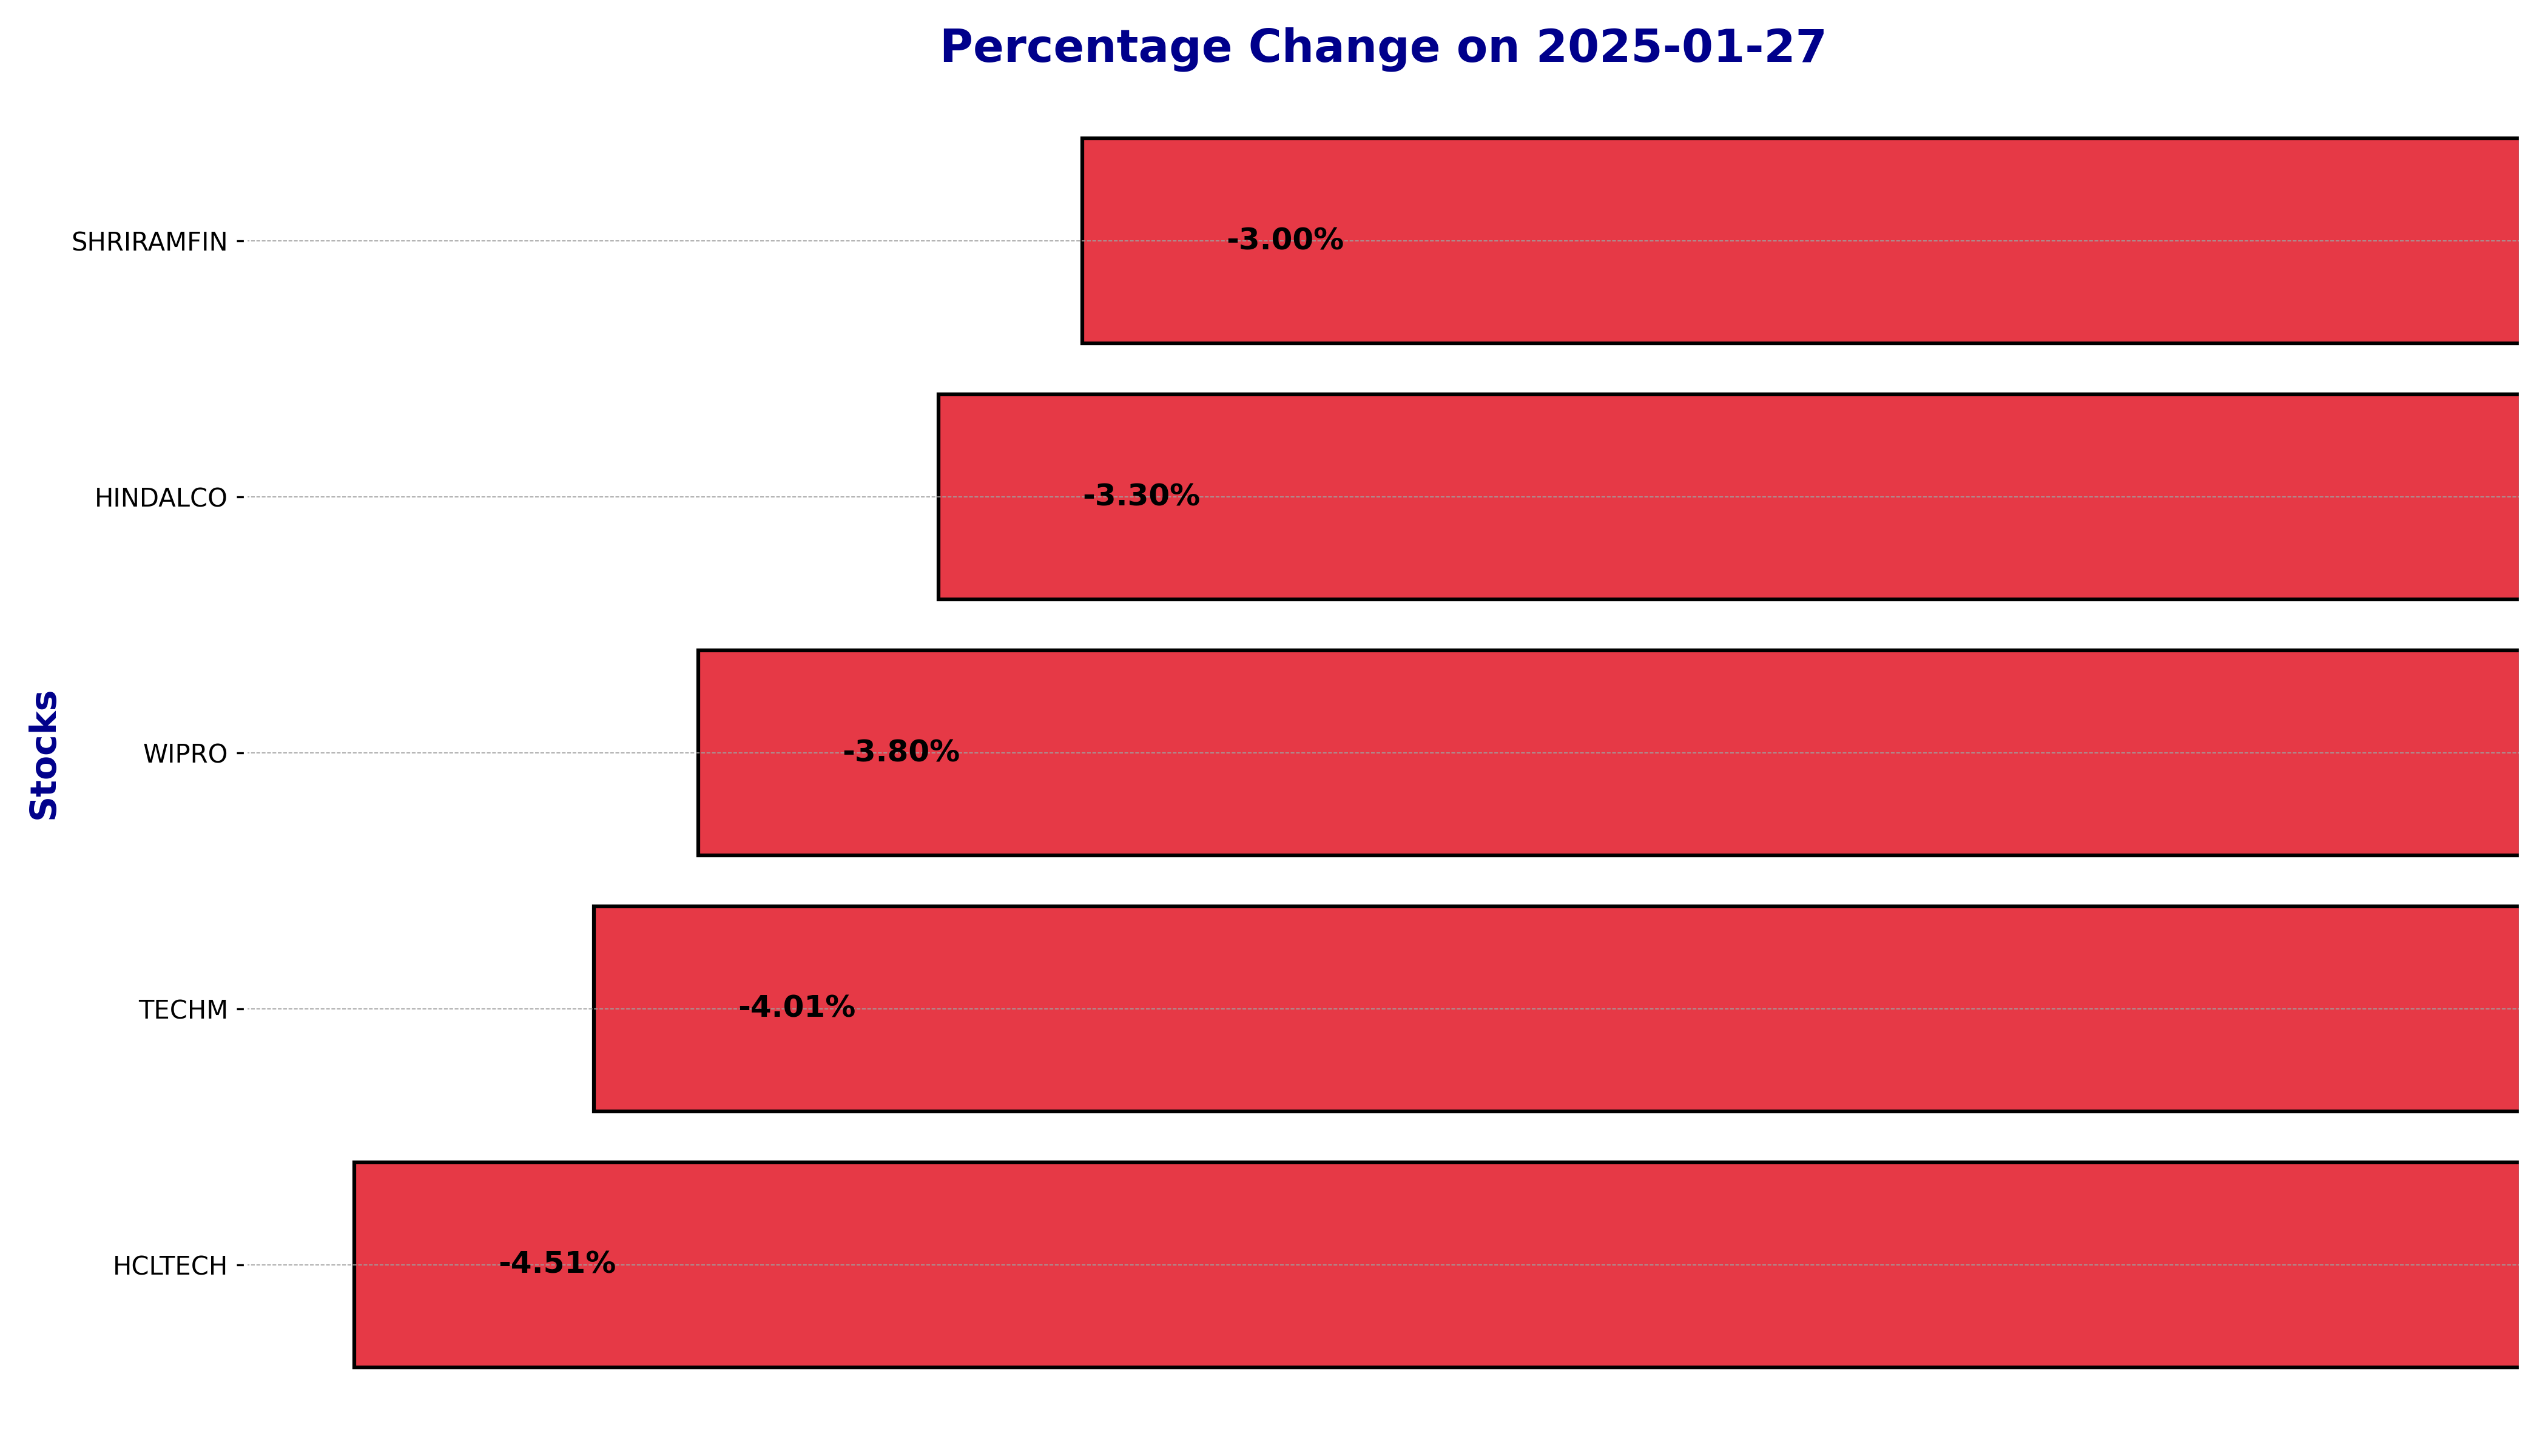
NSE Nifty 50 Top losers: Who are the 5 Biggest Stock losers Today January 27, 2025
In this article, we will explore the technical indicators of some of the low-performing stocks on the Indian stock market, including HCLTECH, HINDALCO, SHRIRAMFIN, TECHM, and WIPRO.
By looking at these stocks through the lens of key technical factors, we aim to better understand their price movements, trends, and potential future performance.
HCLTECH Stock Performance on January 27, 2025:
- Open Price: ₹1775.00
- High Price: ₹1779.75
- Low Price: ₹1707.30
- Close Price: ₹1711.95
- Previous Close: ₹1792.85
- Percentage Change: -4.51%
- Points Change: -80.90


Relationship with Key Moving Averages:
- The stock is trading below its 10-EMA (₹1804.14) and 20-EMA (₹1838.09), indicating a bearish trend in the short term.
- It is also below the 50-EMA (₹1853.85), which further confirms the bearish sentiment in the medium term.
- However, it is slightly above the 200-EMA (₹1698.47), suggesting some long-term support that may prevent further declines.
RSI and MACD Analysis:
- RSI (Relative Strength Index): The RSI is at 31.24, indicating the stock is approaching oversold territory, which might lead to a potential bounce back.

- MACD (Moving Average Convergence Divergence): The MACD value is -34.93, with a signal line of -20.36, showing a bearish crossover and supporting the negative trend.

Stock Performance for HINDALCO on January 27, 2025:
- Open: ₹600.05
- High: ₹601.60
- Low: ₹585.35
- Close: ₹586.90
- Previous Close: ₹606.90
- Percentage Change: -3.30%
- Points Change: -20.00 points
- Volume: 2,914,649


Relationship with Key Moving Averages:
The stock's current price of ₹586.90 is below the 10-EMA (₹602.14), 20-EMA (₹604.79), 50-EMA (₹624.98), and 200-EMA (₹635.82). This indicates a bearish trend as the stock is trading below all these key moving averages, suggesting downward momentum. The fact that the 10-EMA is the highest among the shorter EMAs and the price is below it, further signifies potential short-term bearish pressure.
RSI Analysis:
The RSI is at 39.56, which is below the neutral level of 50, indicating that the stock is currently in a bearish momentum and possibly approaching the oversold territory.

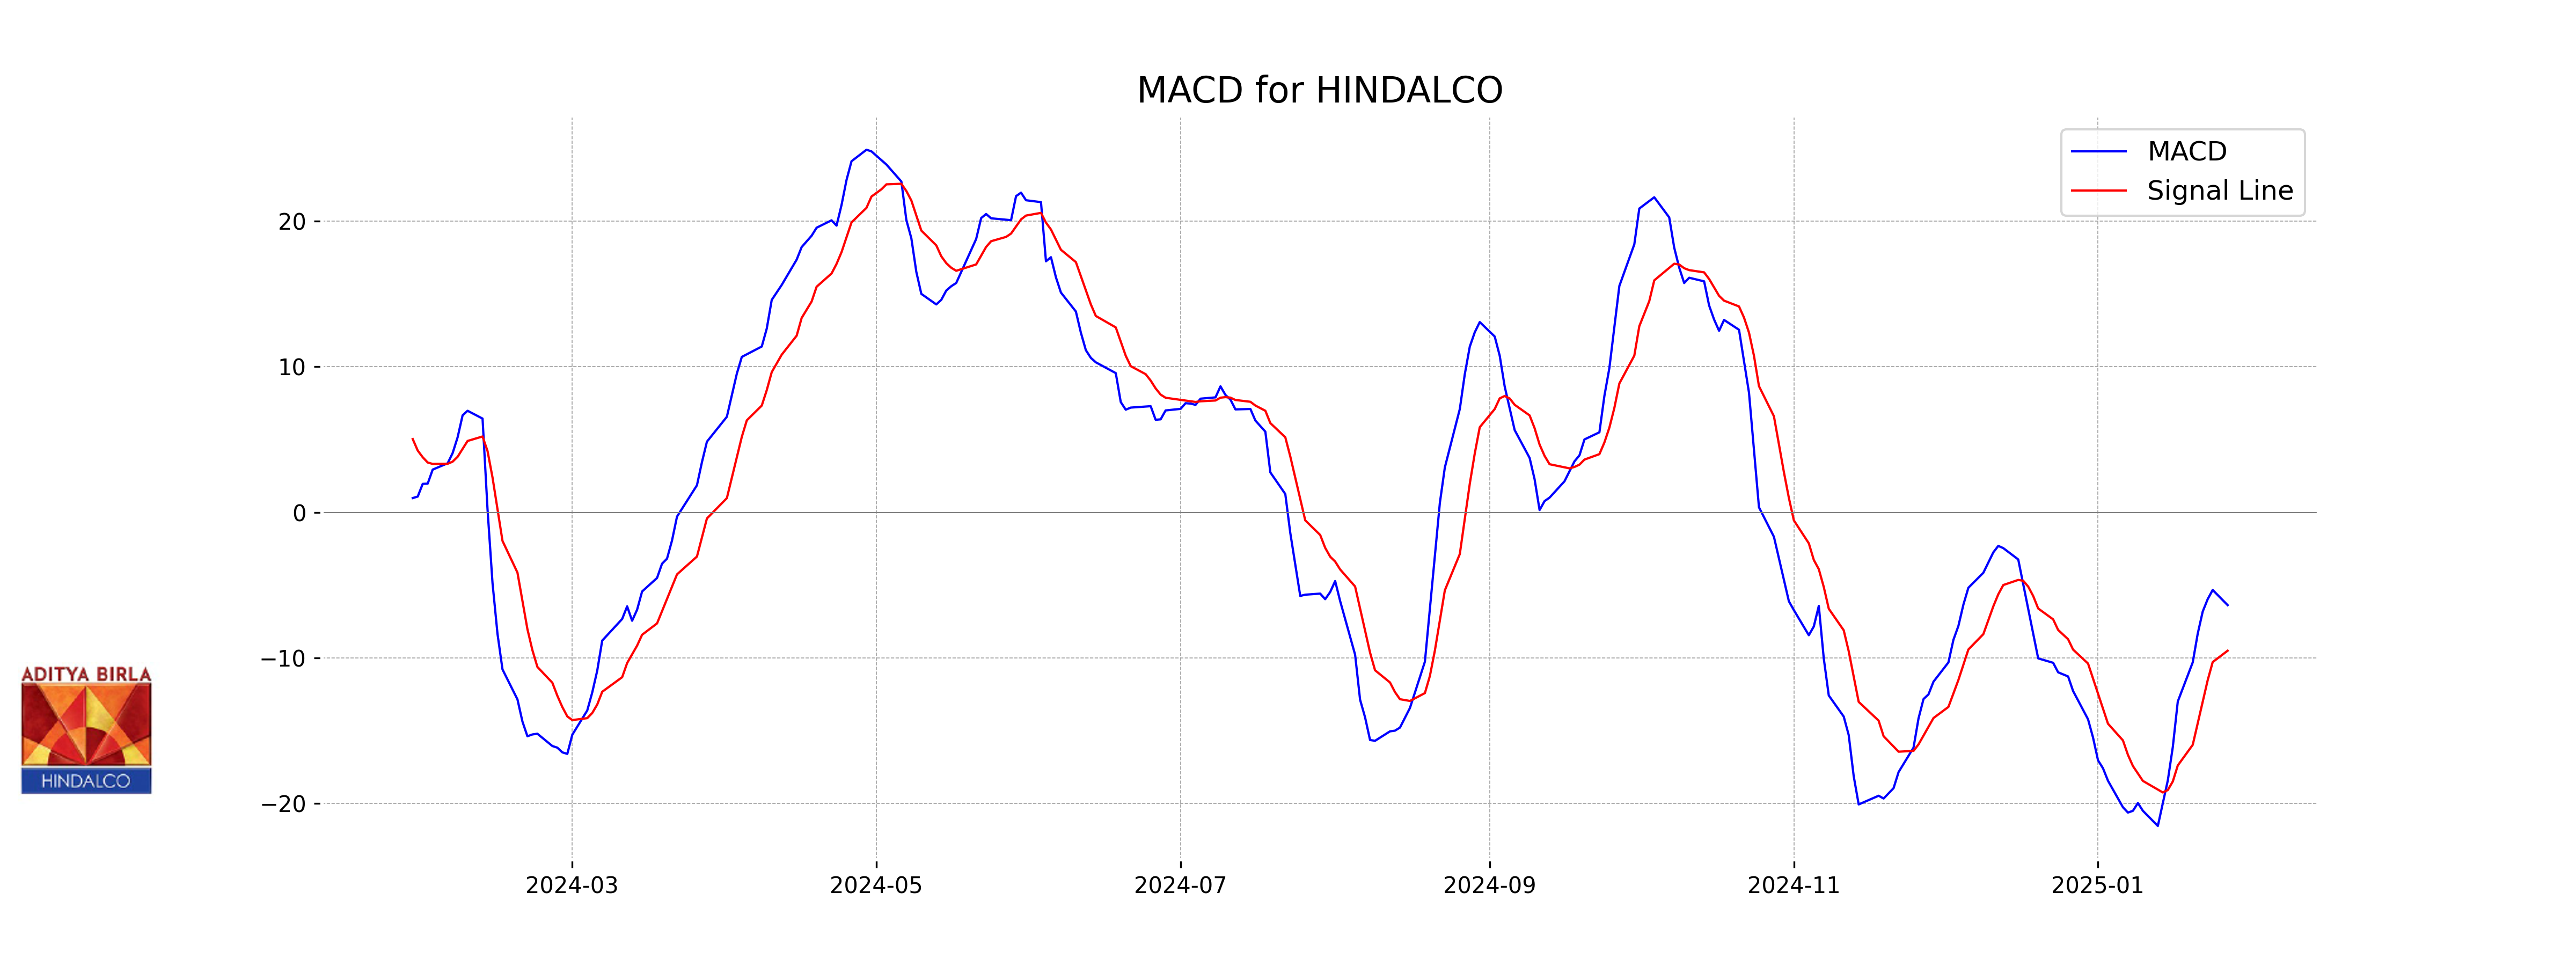
MACD Analysis:
The MACD value is -6.37, with the MACD Signal at -9.50. The negative MACD value and the fact that it is below the MACD Signal line suggest a bearish sentiment for the stock.
SHRIRAMFIN Stock Performance - January 27, 2025
- Open Price: ₹525.90
- High Price: ₹530.65
- Low Price: ₹508.15
- Close Price: ₹511.65
- Previous Close Price: ₹527.45
- Percentage Change: -2.99%
- Points Change: -15.80


SHRIRAMFIN and Key Moving Averages
The close price of SHRIRAMFIN is below all the key moving averages: 10-EMA (₹529.42), 20-EMA (₹545.65), 50-EMA (₹575.14), and 200-EMA (₹565.43). This indicates a bearish trend as the current price movement is consistently below these averages, showing a downtrend in the short to long term.
RSI and MACD Analysis
The RSI (Relative Strength Index) is at 34.65, which is approaching the oversold territory, suggesting that the stock may be undervalued and could see a price correction in the future.

The MACD (Moving Average Convergence Divergence) is -20.70, with a signal of -19.11. The negative MACD indicates further bearish momentum.

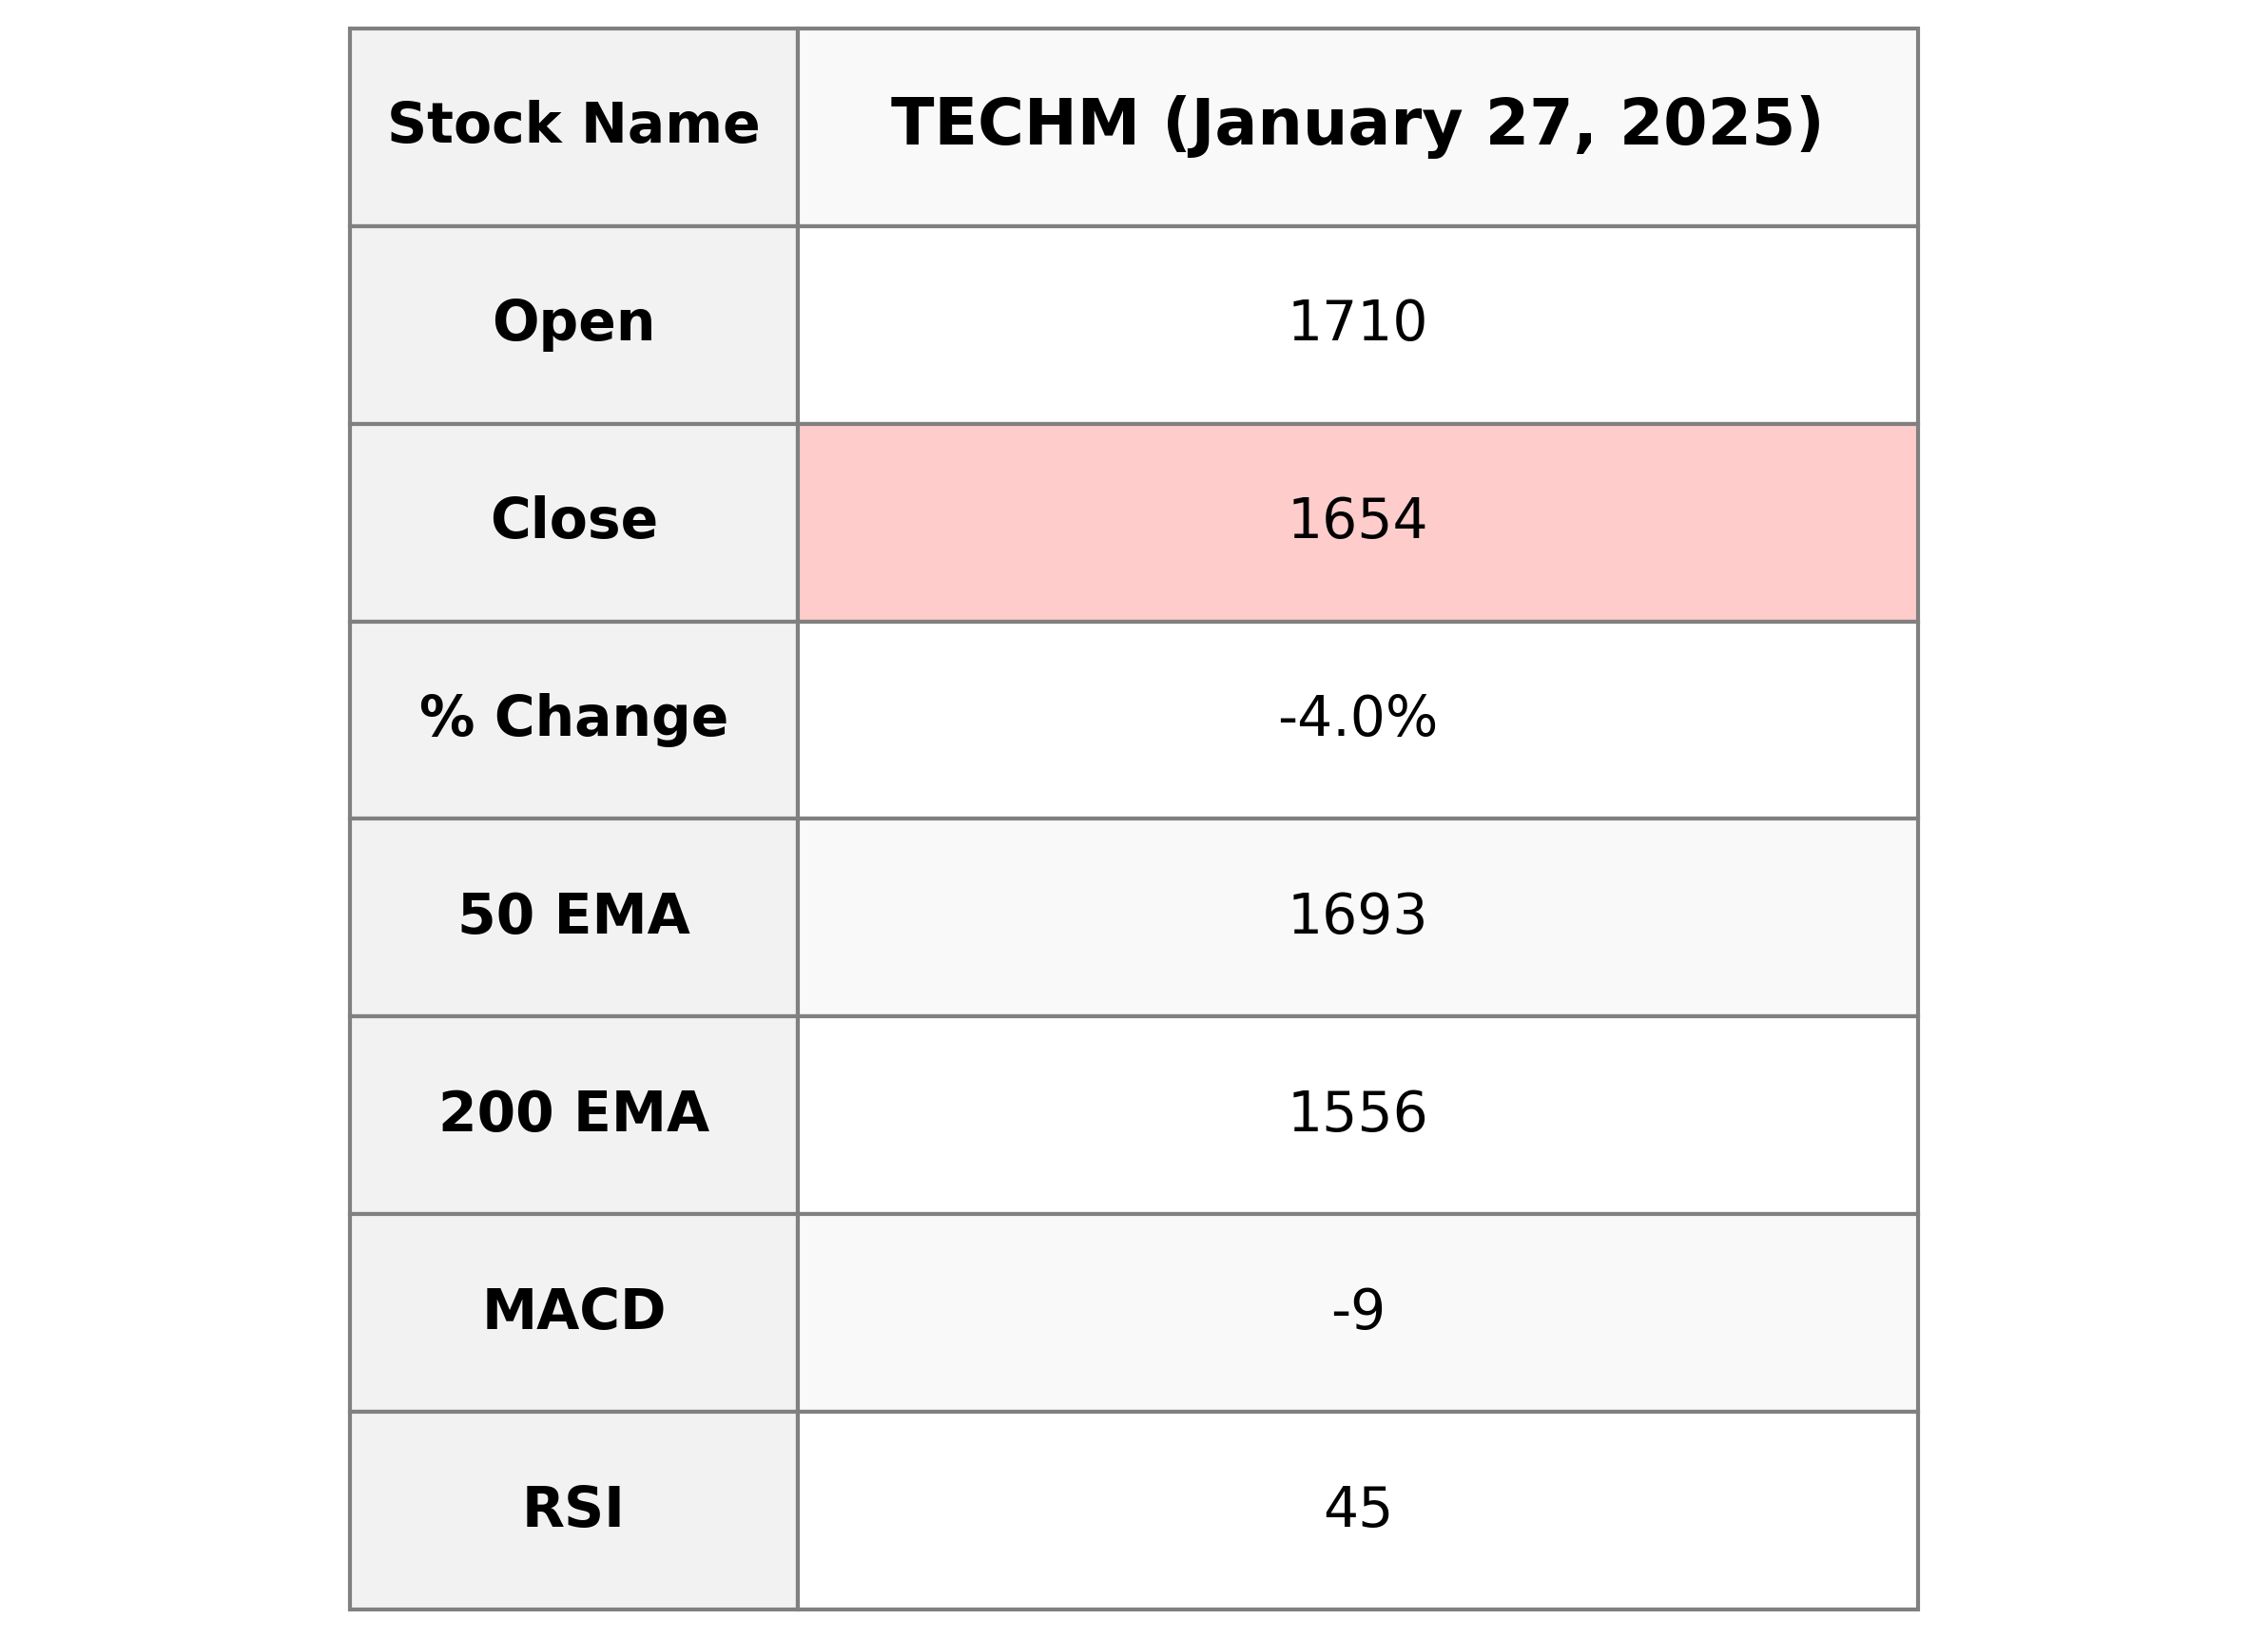
Stock Performance for TECHM on January 27, 2025:
- The stock opened at 1710.0.
- It reached a high of 1713.9 and a low of 1645.0.
- The closing price was 1653.9.
- The percentage change was -4.01%.
- The points change was -69.15.
- The trading volume for the day was 1,174,616 shares.
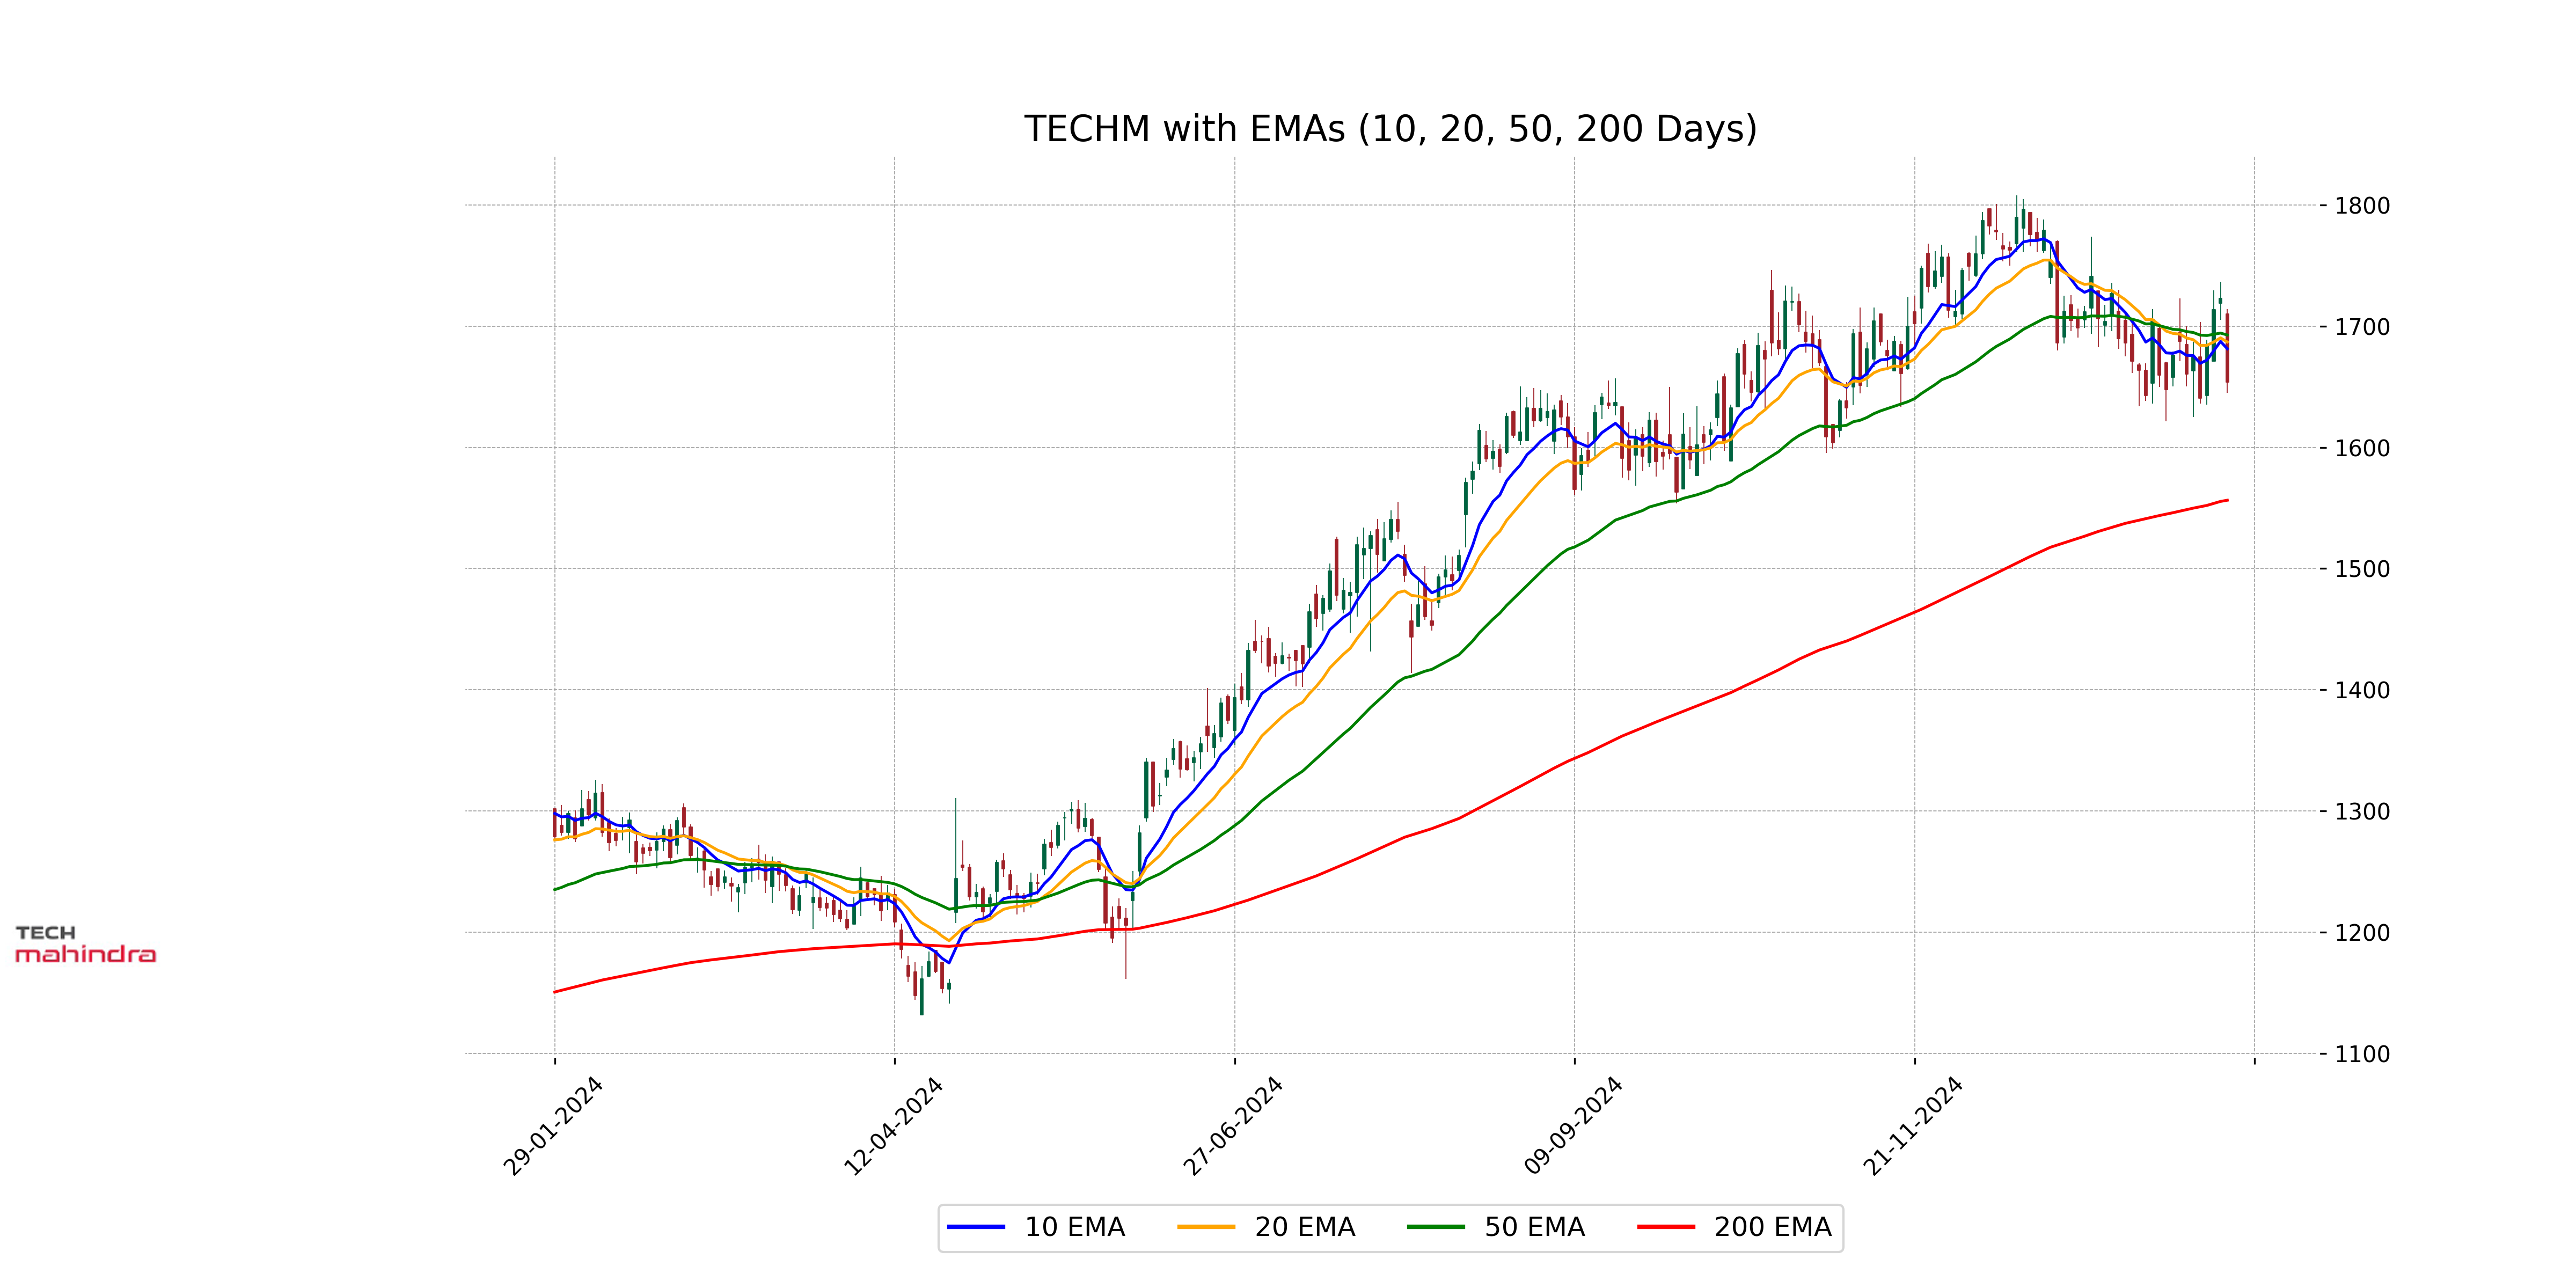
Moving Averages Analysis:
- The 10-EMA is at 1681.32.
- The 20-EMA is at 1686.89.
- The 50-EMA is at 1692.67, which is higher than the closing price of 1653.9, and slightly lower than the 10-EMA and 20-EMA.
- The 200-EMA stands at 1556.38.
- The position of the stock below all its short-term EMAs indicates a bearish trend in the short term. Meanwhile, it remains above the 200-EMA, suggesting long-term stability compared to the current trend.
RSI: The RSI is at 44.64, indicating that the stock is not currently in overbought or oversold condition.

MACD: The MACD value is -8.93 with a Signal Line at -12.04, hinting at a bearish momentum.

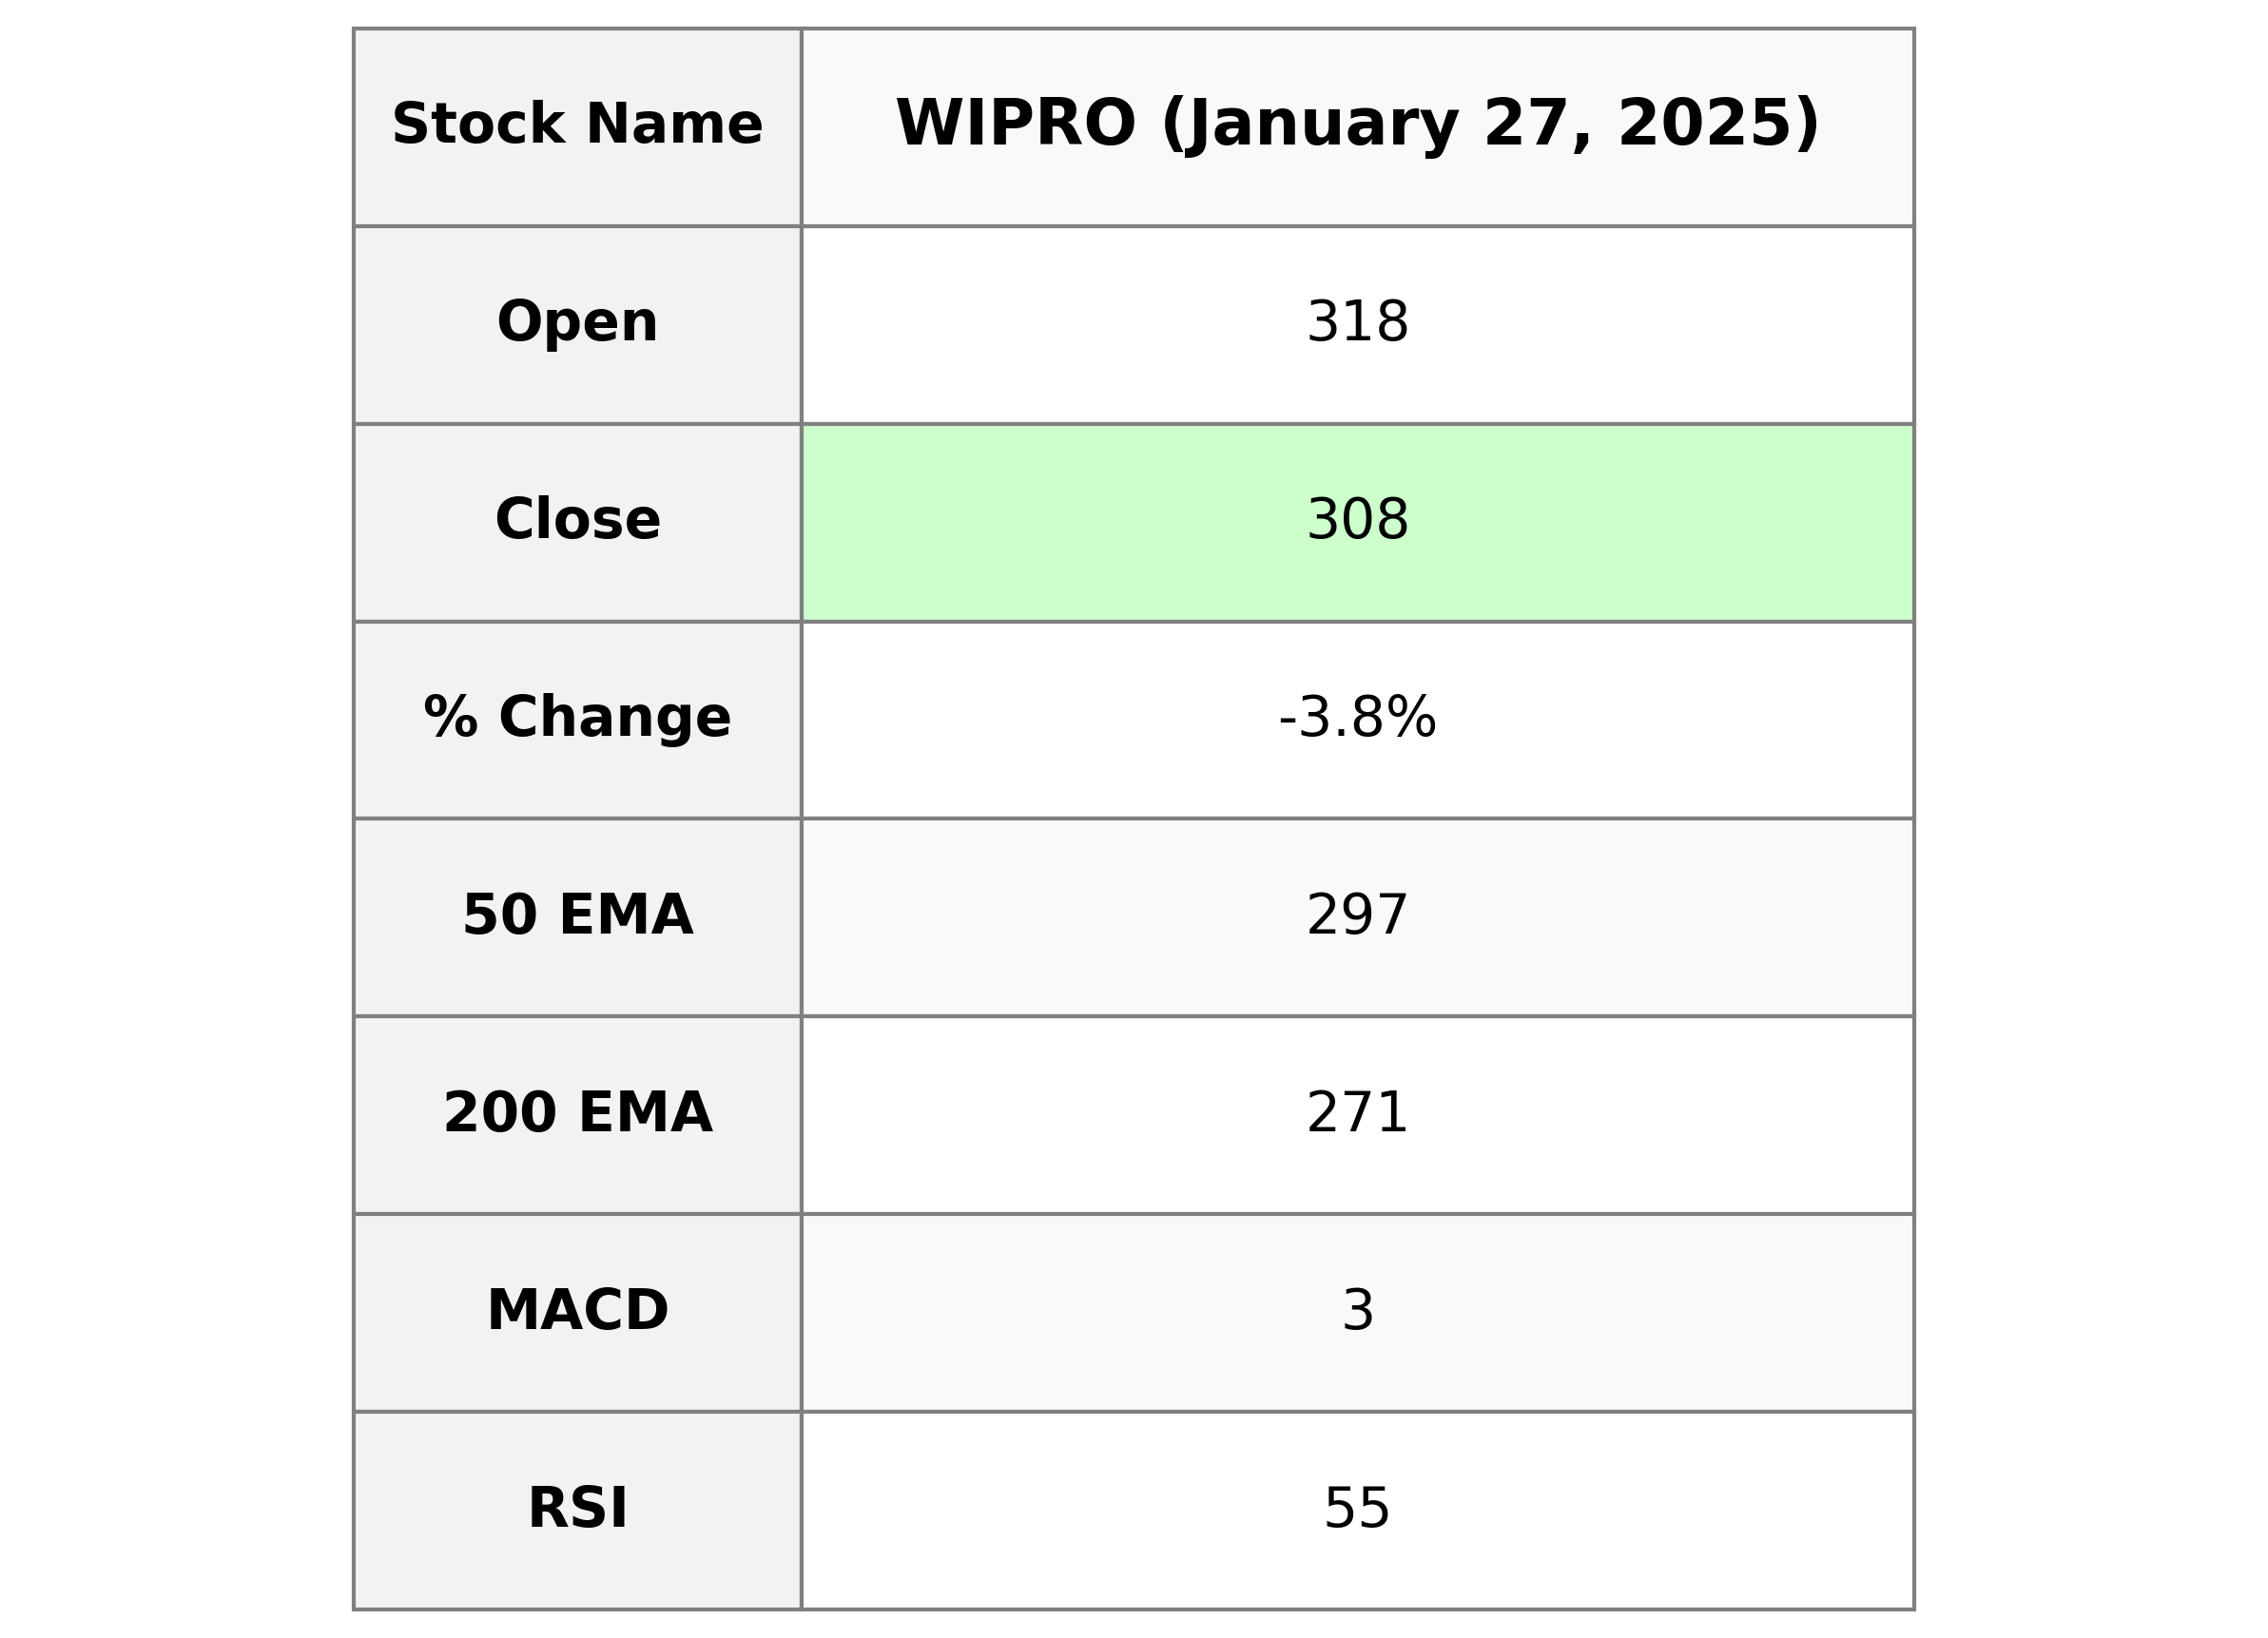
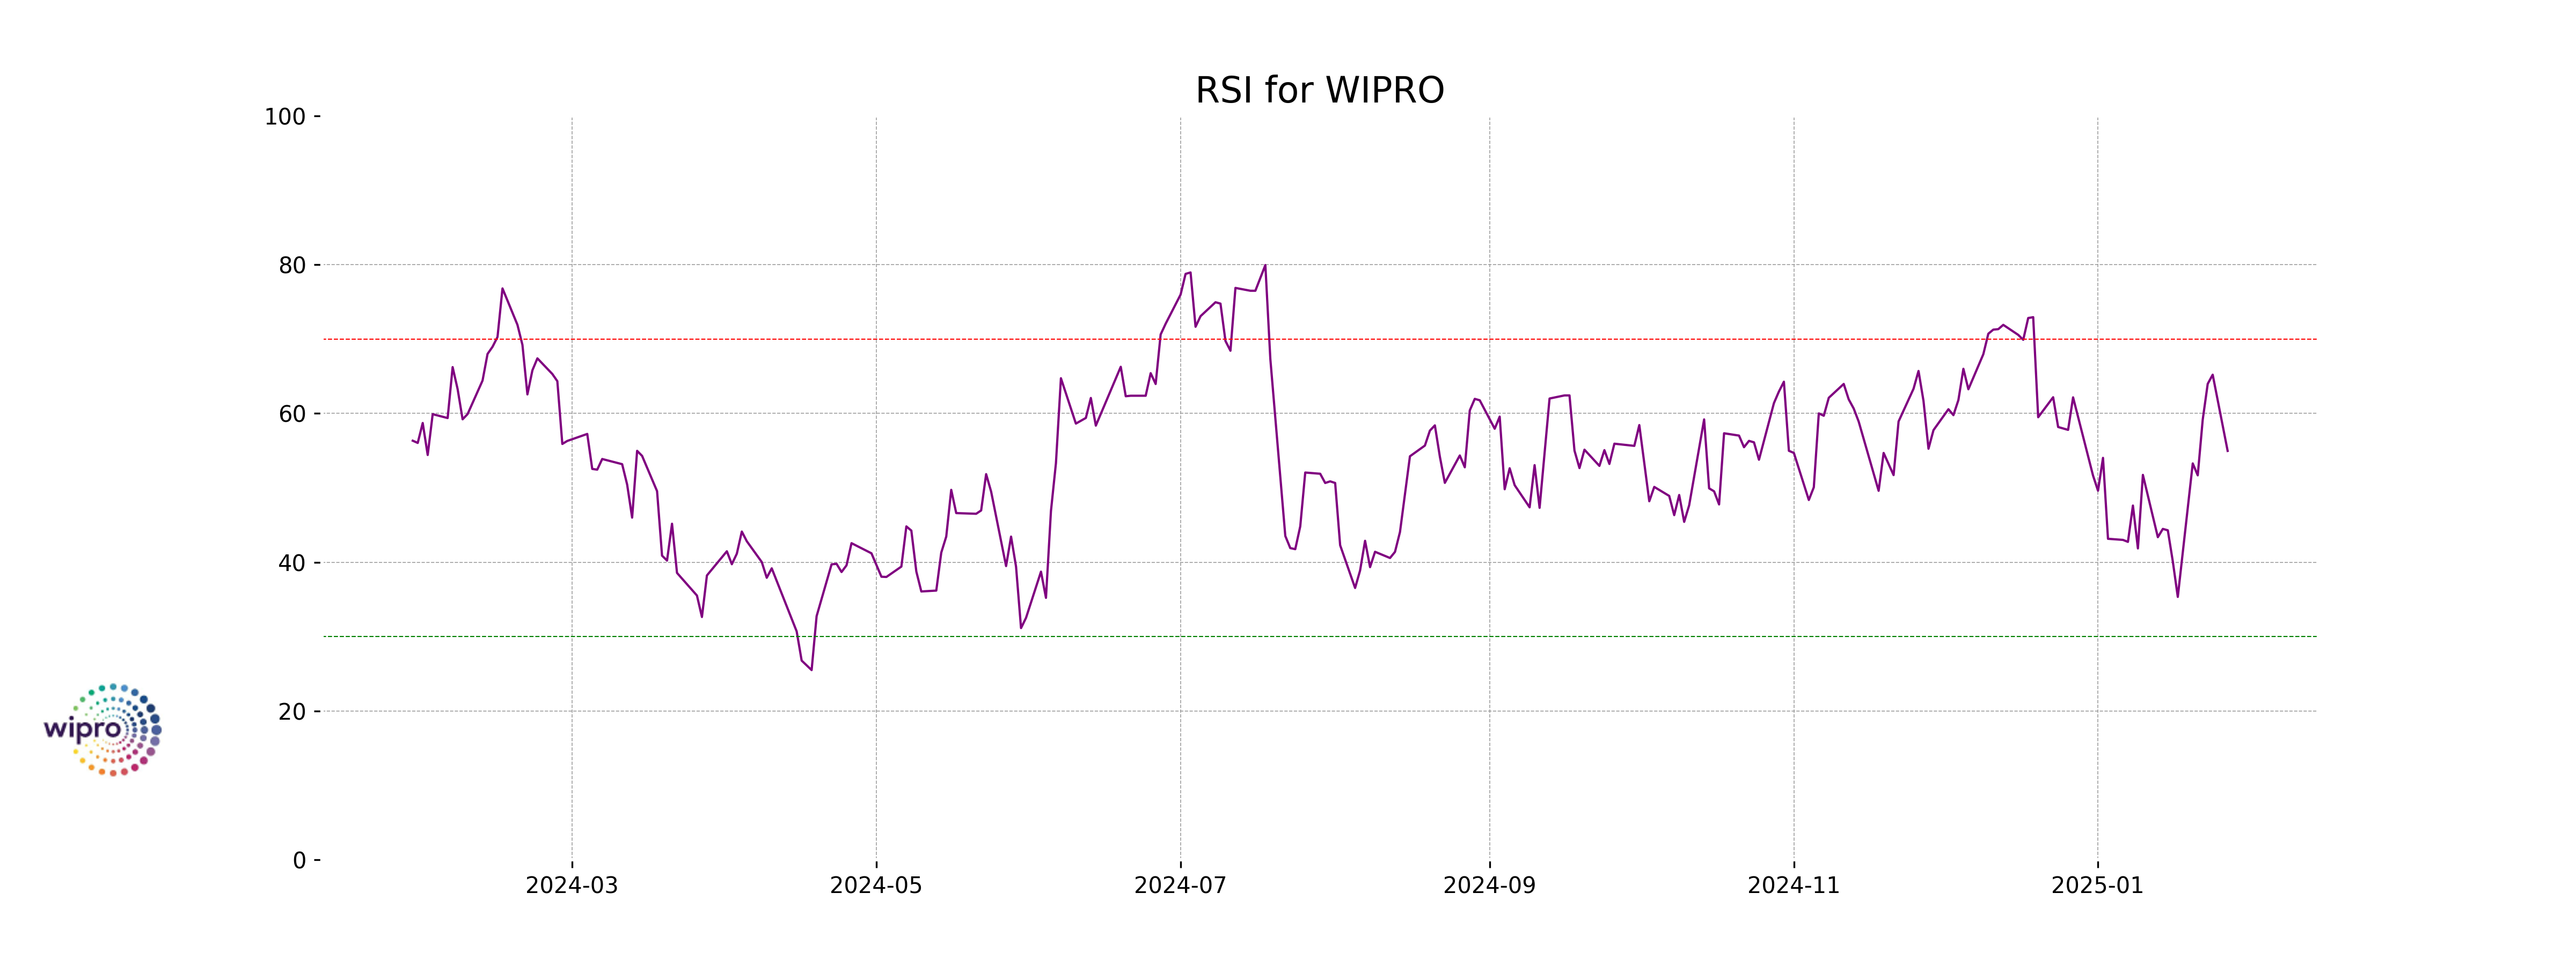
Analysis of WIPRO for January 27, 2025:
1. Stock Performance:
- Open Price: ₹317.80
- High Price: ₹319.15
- Low Price: ₹306.75
- Close Price: ₹307.95
- Previous Close: ₹320.10
- Percentage Change: -3.80%
- Points Change: -12.15
- Volume: 12,354,236 shares

2. Moving Averages Analysis:
WIPRO's current close price of ₹307.95 is above its 50-day EMA of ₹296.61 and 200-day EMA of ₹271.16, indicating a long-term bullish trend. However, its price is slightly above the 10-day EMA of ₹305.02 and the 20-day EMA of ₹301.94, suggesting short-term bullish momentum.
3. RSI (Relative Strength Index):
- The RSI is at 54.96, which indicates that the stock is neither overbought nor oversold. It reflects a neutral stance in terms of momentum.
4. MACD (Moving Average Convergence Divergence):
- The MACD value is 3.03 with a MACD Signal of 0.79, indicating a bullish crossover, which could signify an upward trend in the near term. The MACD line is above the signal line.