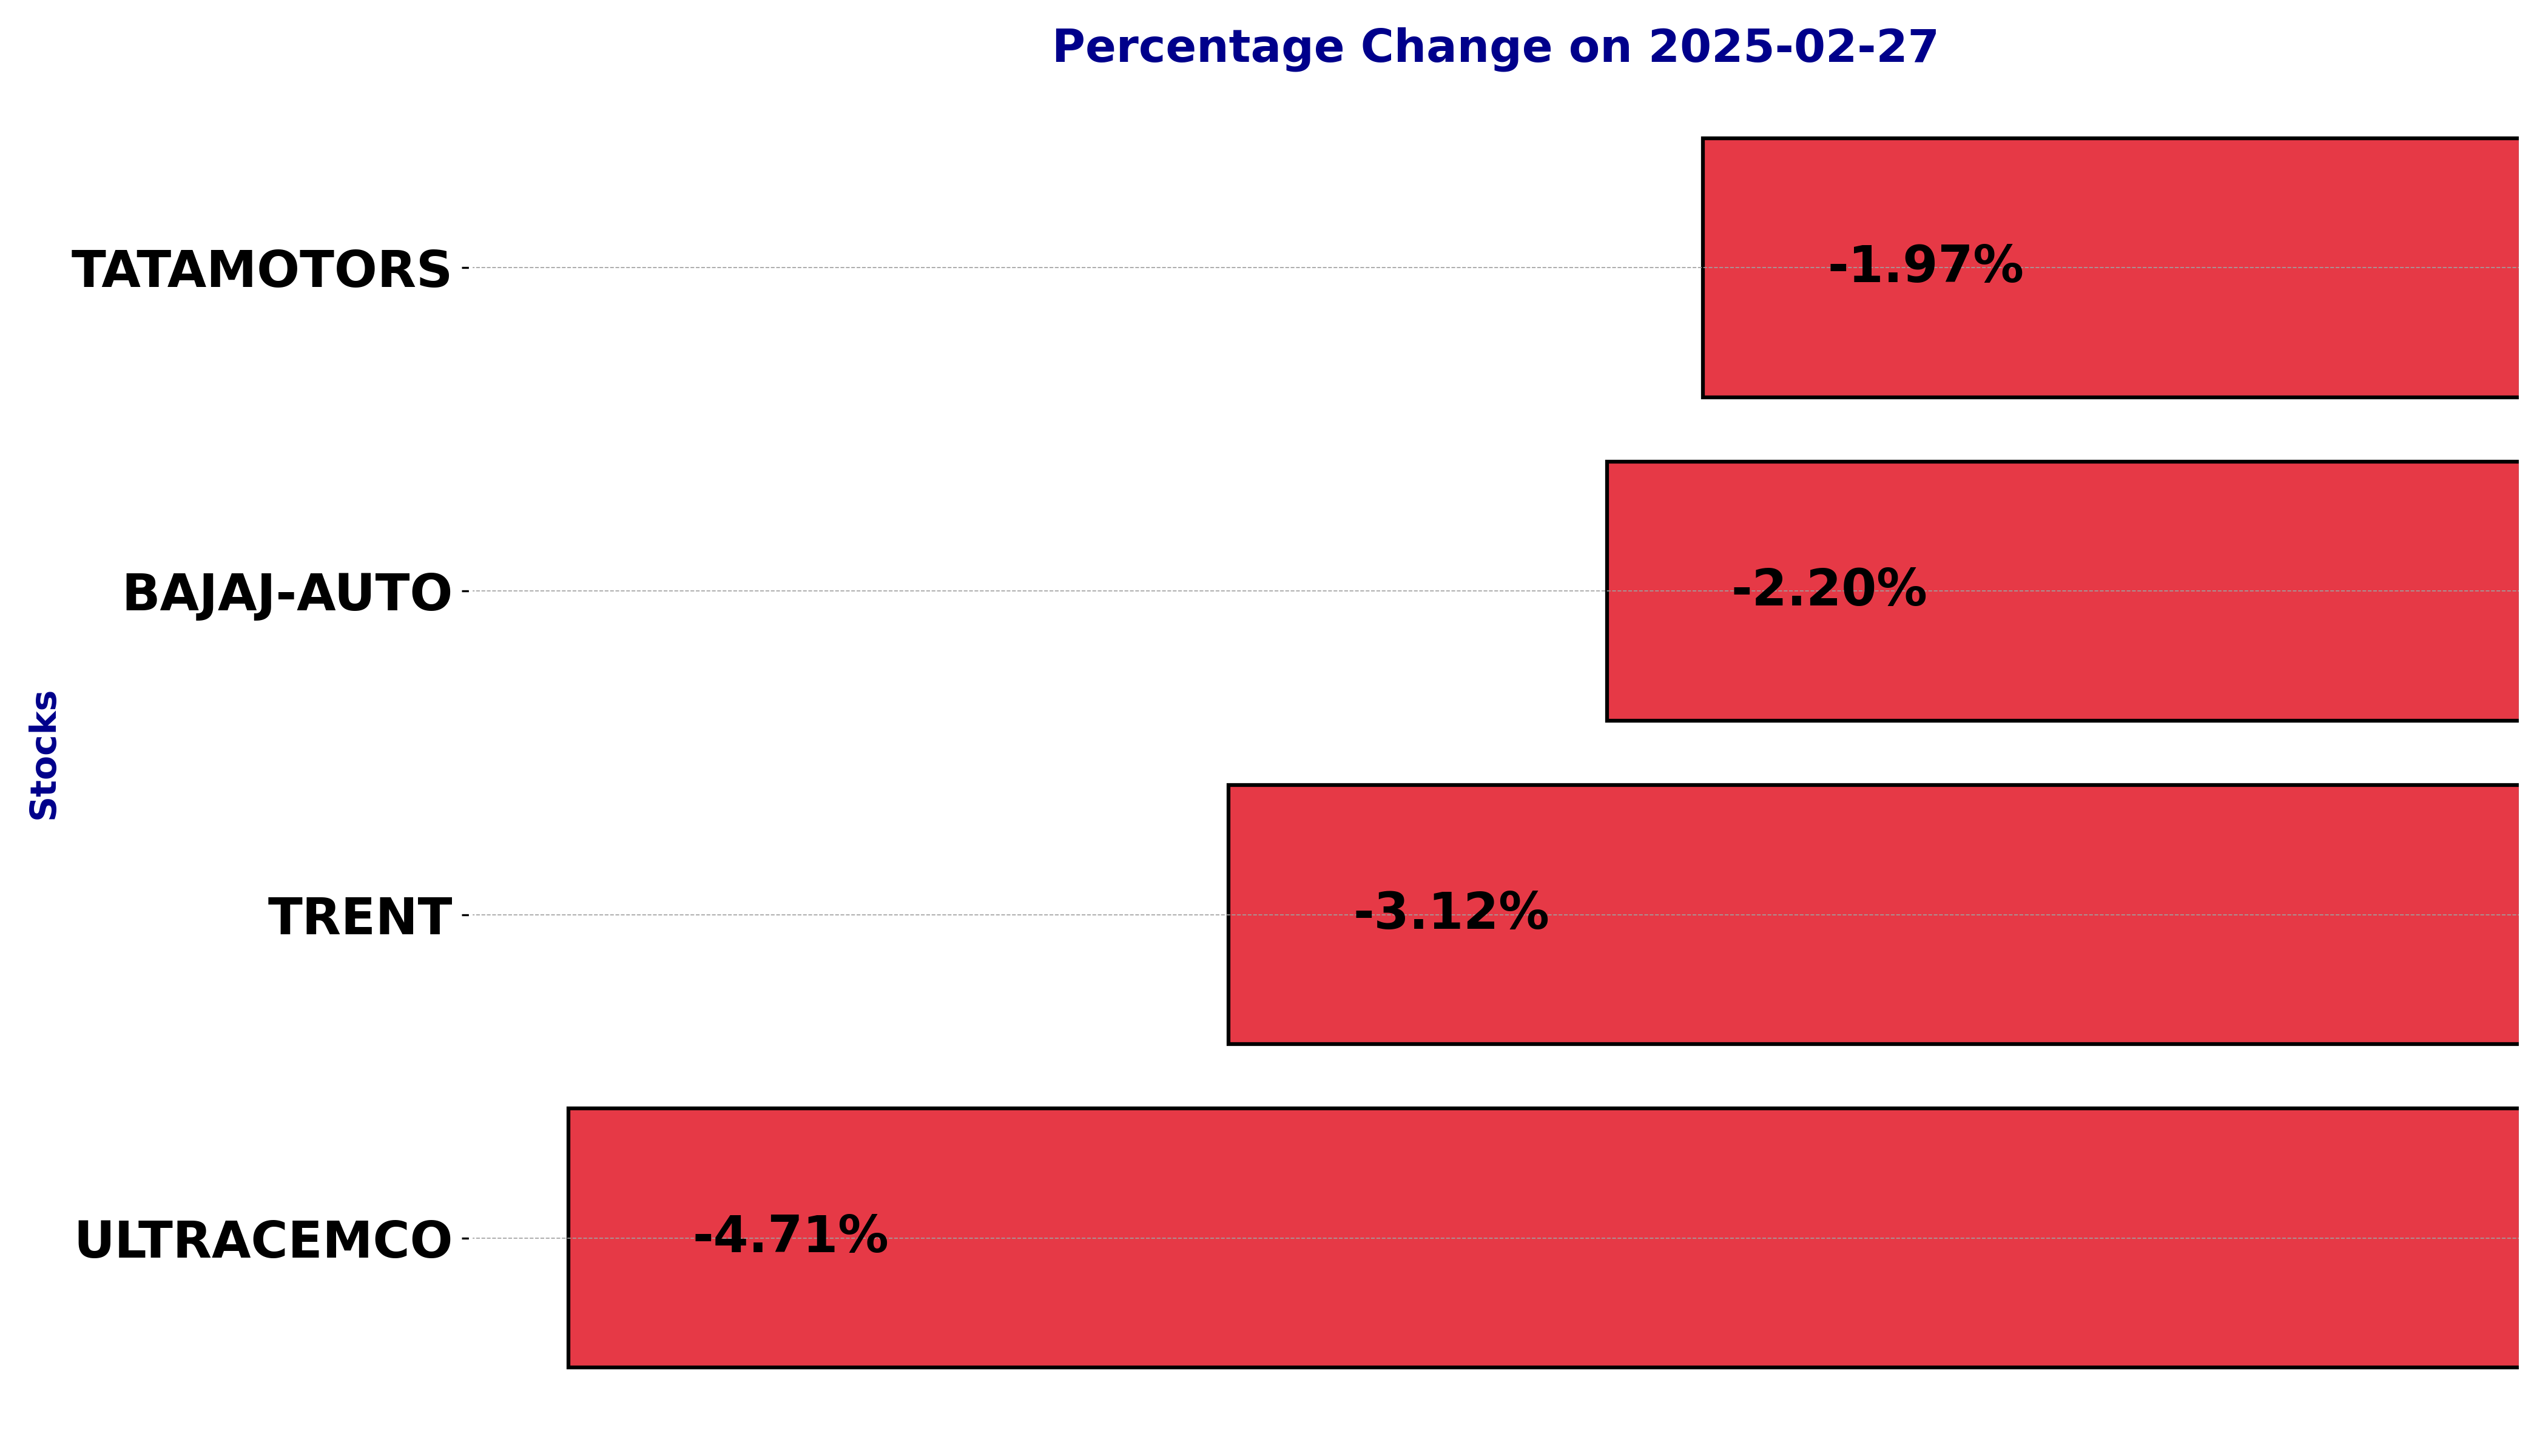
NSE Nifty 50 Top losers: What are the 5 Biggest Stock losers Today February 27, 2025
In this article, we will explore the technical indicators of some of the low-performing stocks on the Indian stock market, including BAJAJ-AUTO, TATAMOTORS, TRENT, and ULTRACEMCO.
By looking at these stocks through the lens of key technical factors, we aim to better understand their price movements, trends, and potential future performance.
Analysis for Bajaj Auto - February 27, 2025
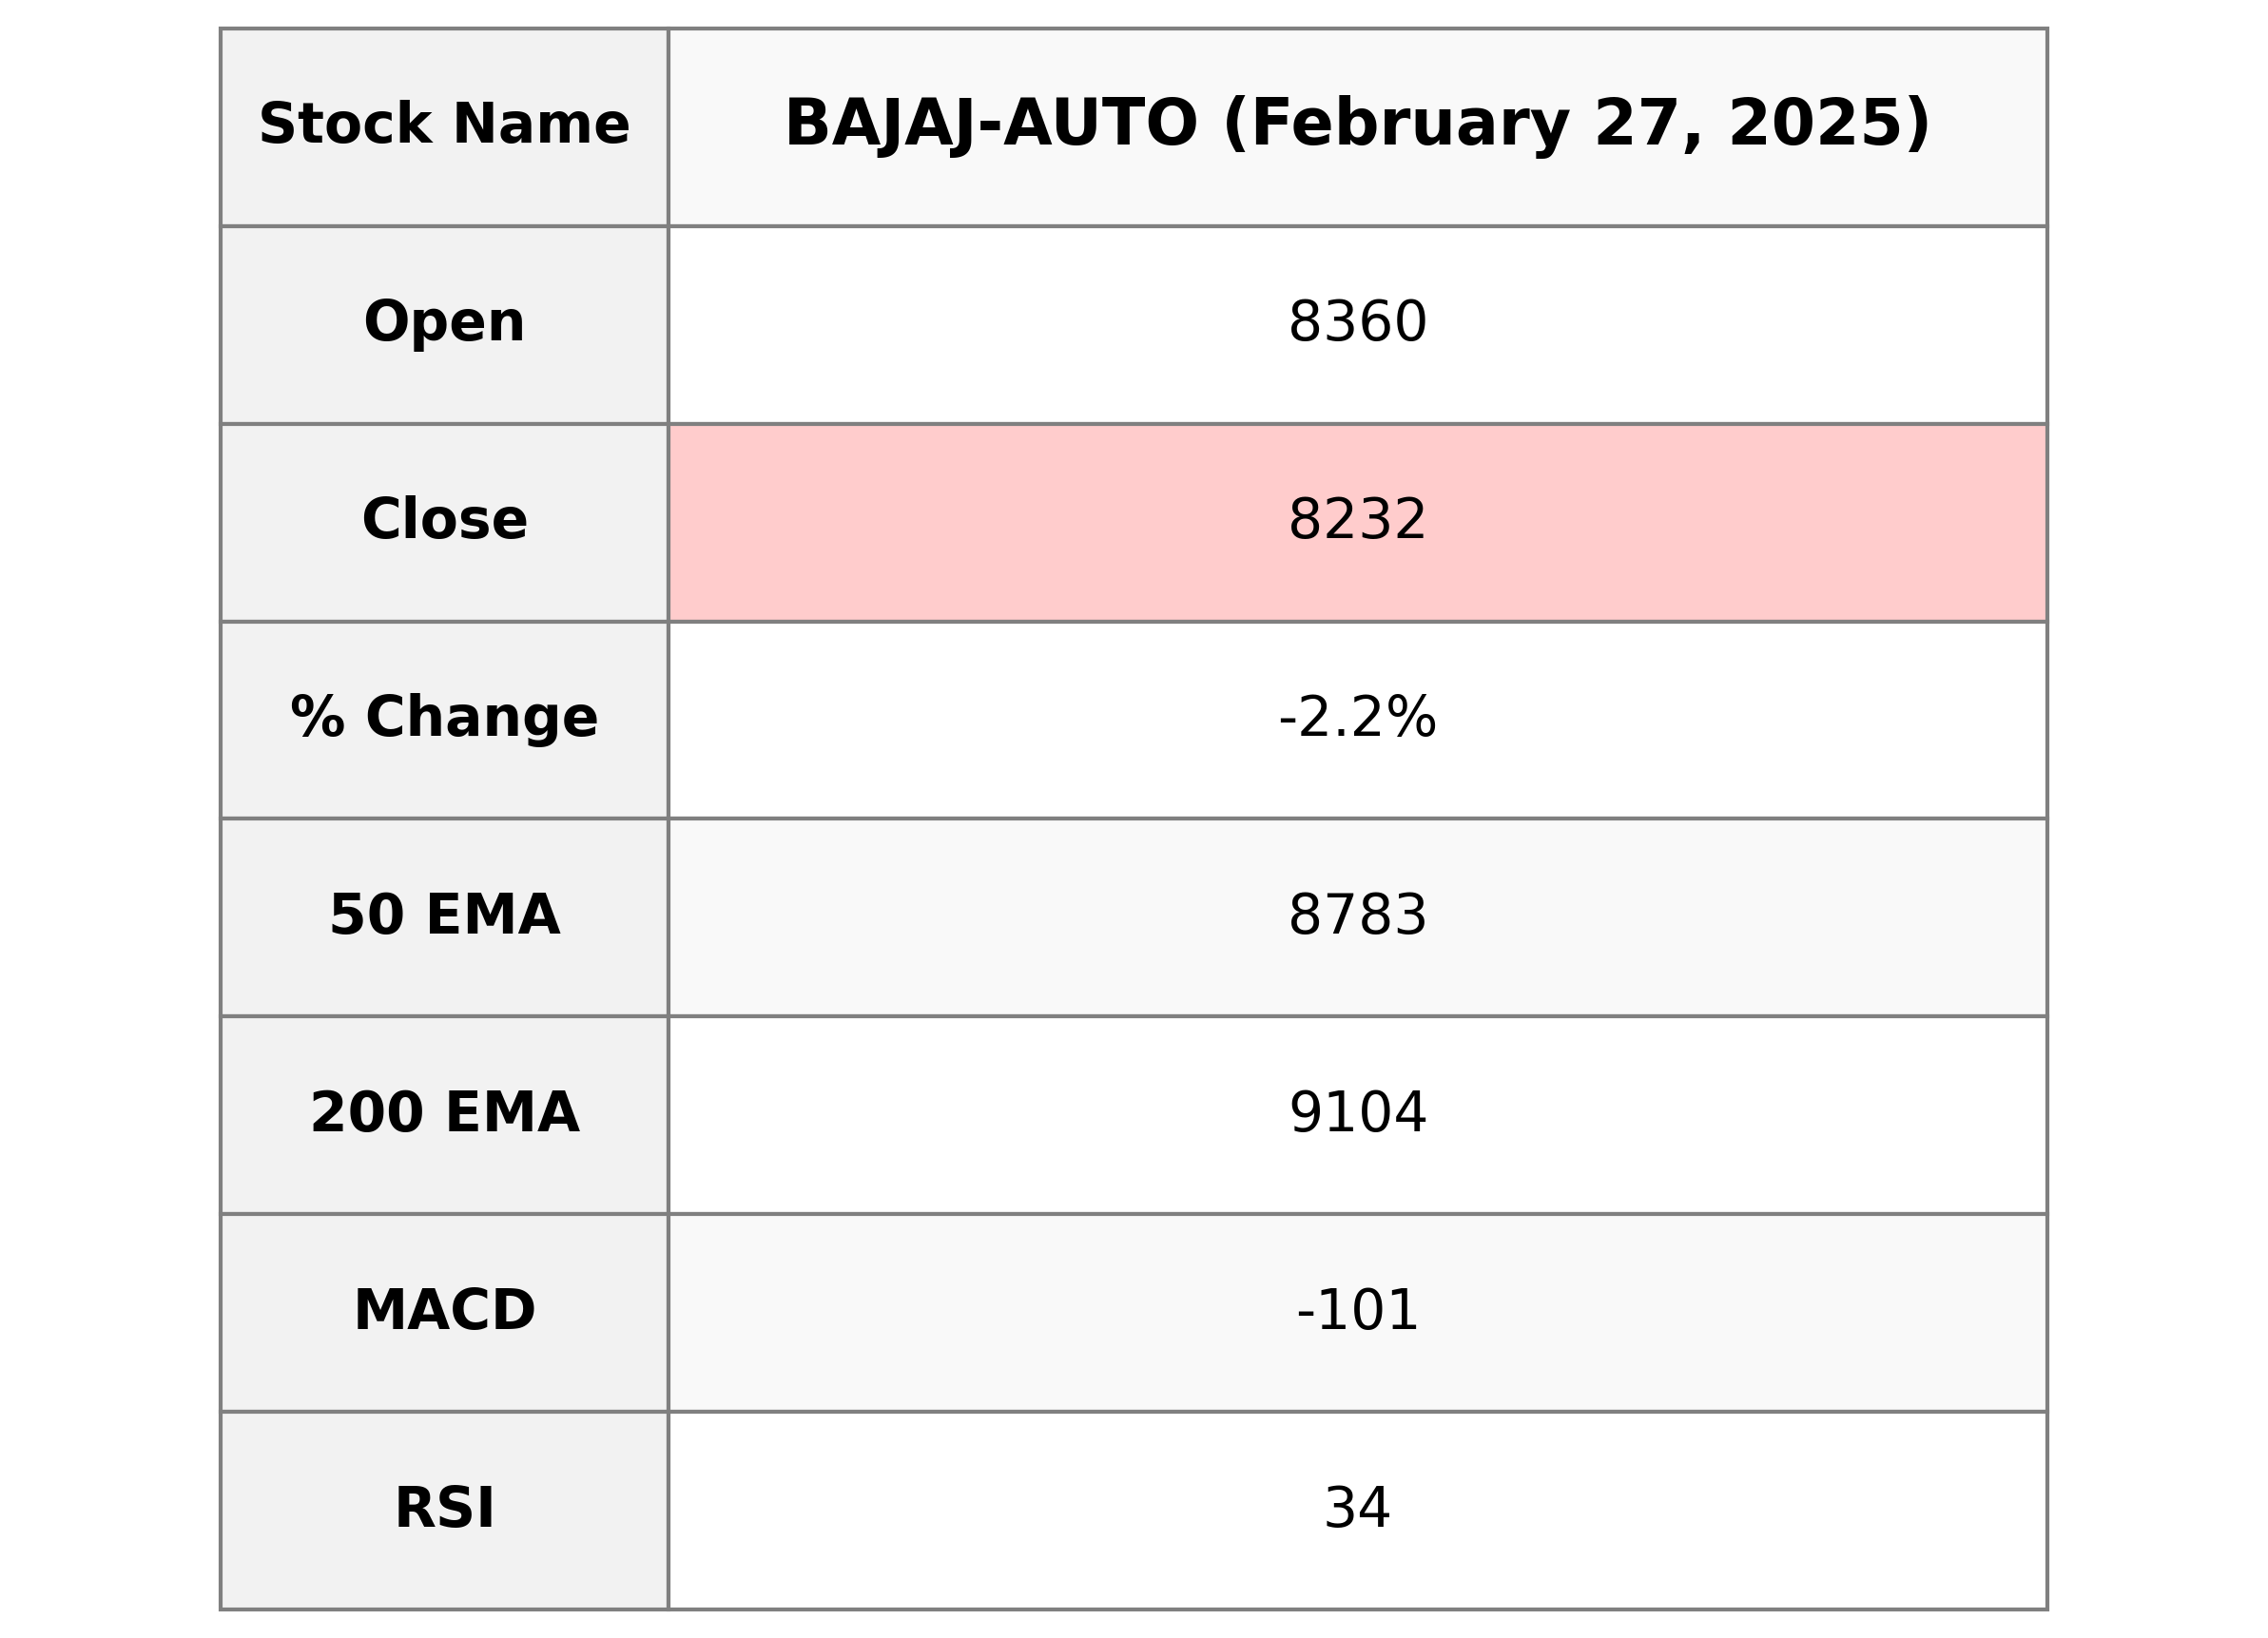
Bajaj Auto Performance Bajaj Auto demonstrated a downtrend with a closing price of 8,232.35, reflecting a decrease of 2.20% from the previous close. With a RSI of 34.14, the stock indicates potential overselling, while the MACD of -101.11 further supports the bearish sentiment. Despite a strong market cap, the stock is underperforming relative to its 50-Day and 200-Day EMAs.
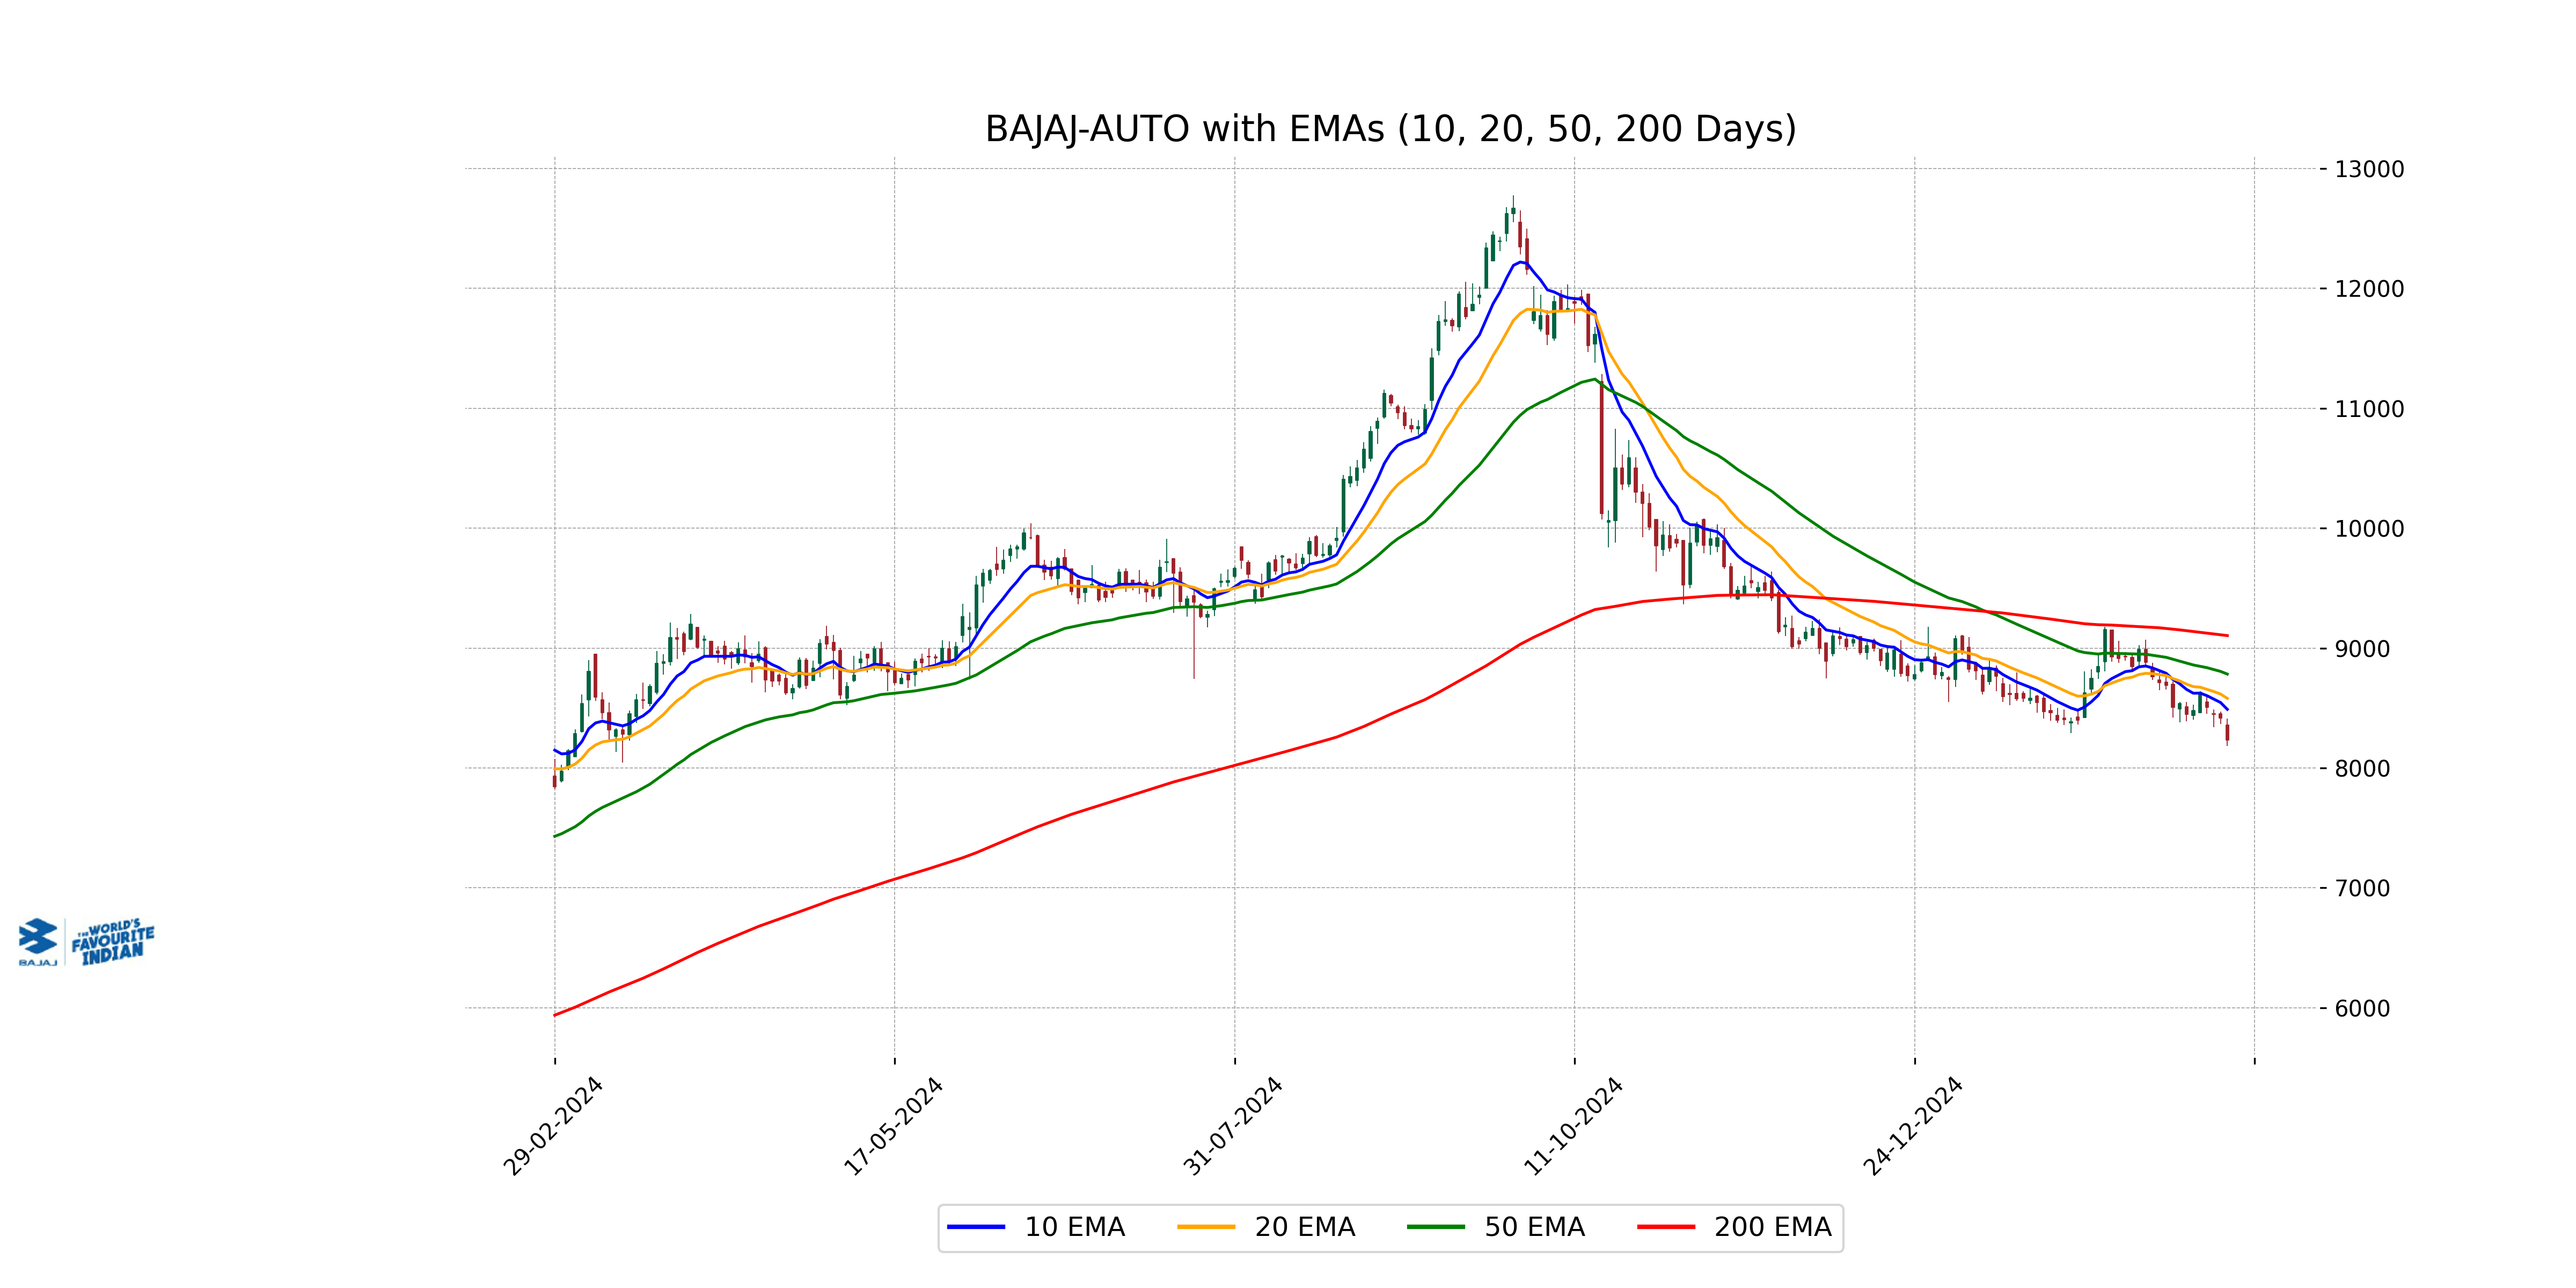
Relationship with Key Moving Averages
Bajaj Auto's stock currently trades below its key moving averages, with the closing price significantly under the 10-day EMA at 8489.15, the 50-day EMA at 8783.03, and the 200-day EMA at 9104.15. This situation suggests a bearish sentiment in the market for the stock, as it is below short-term, medium-term, and long-term trends.
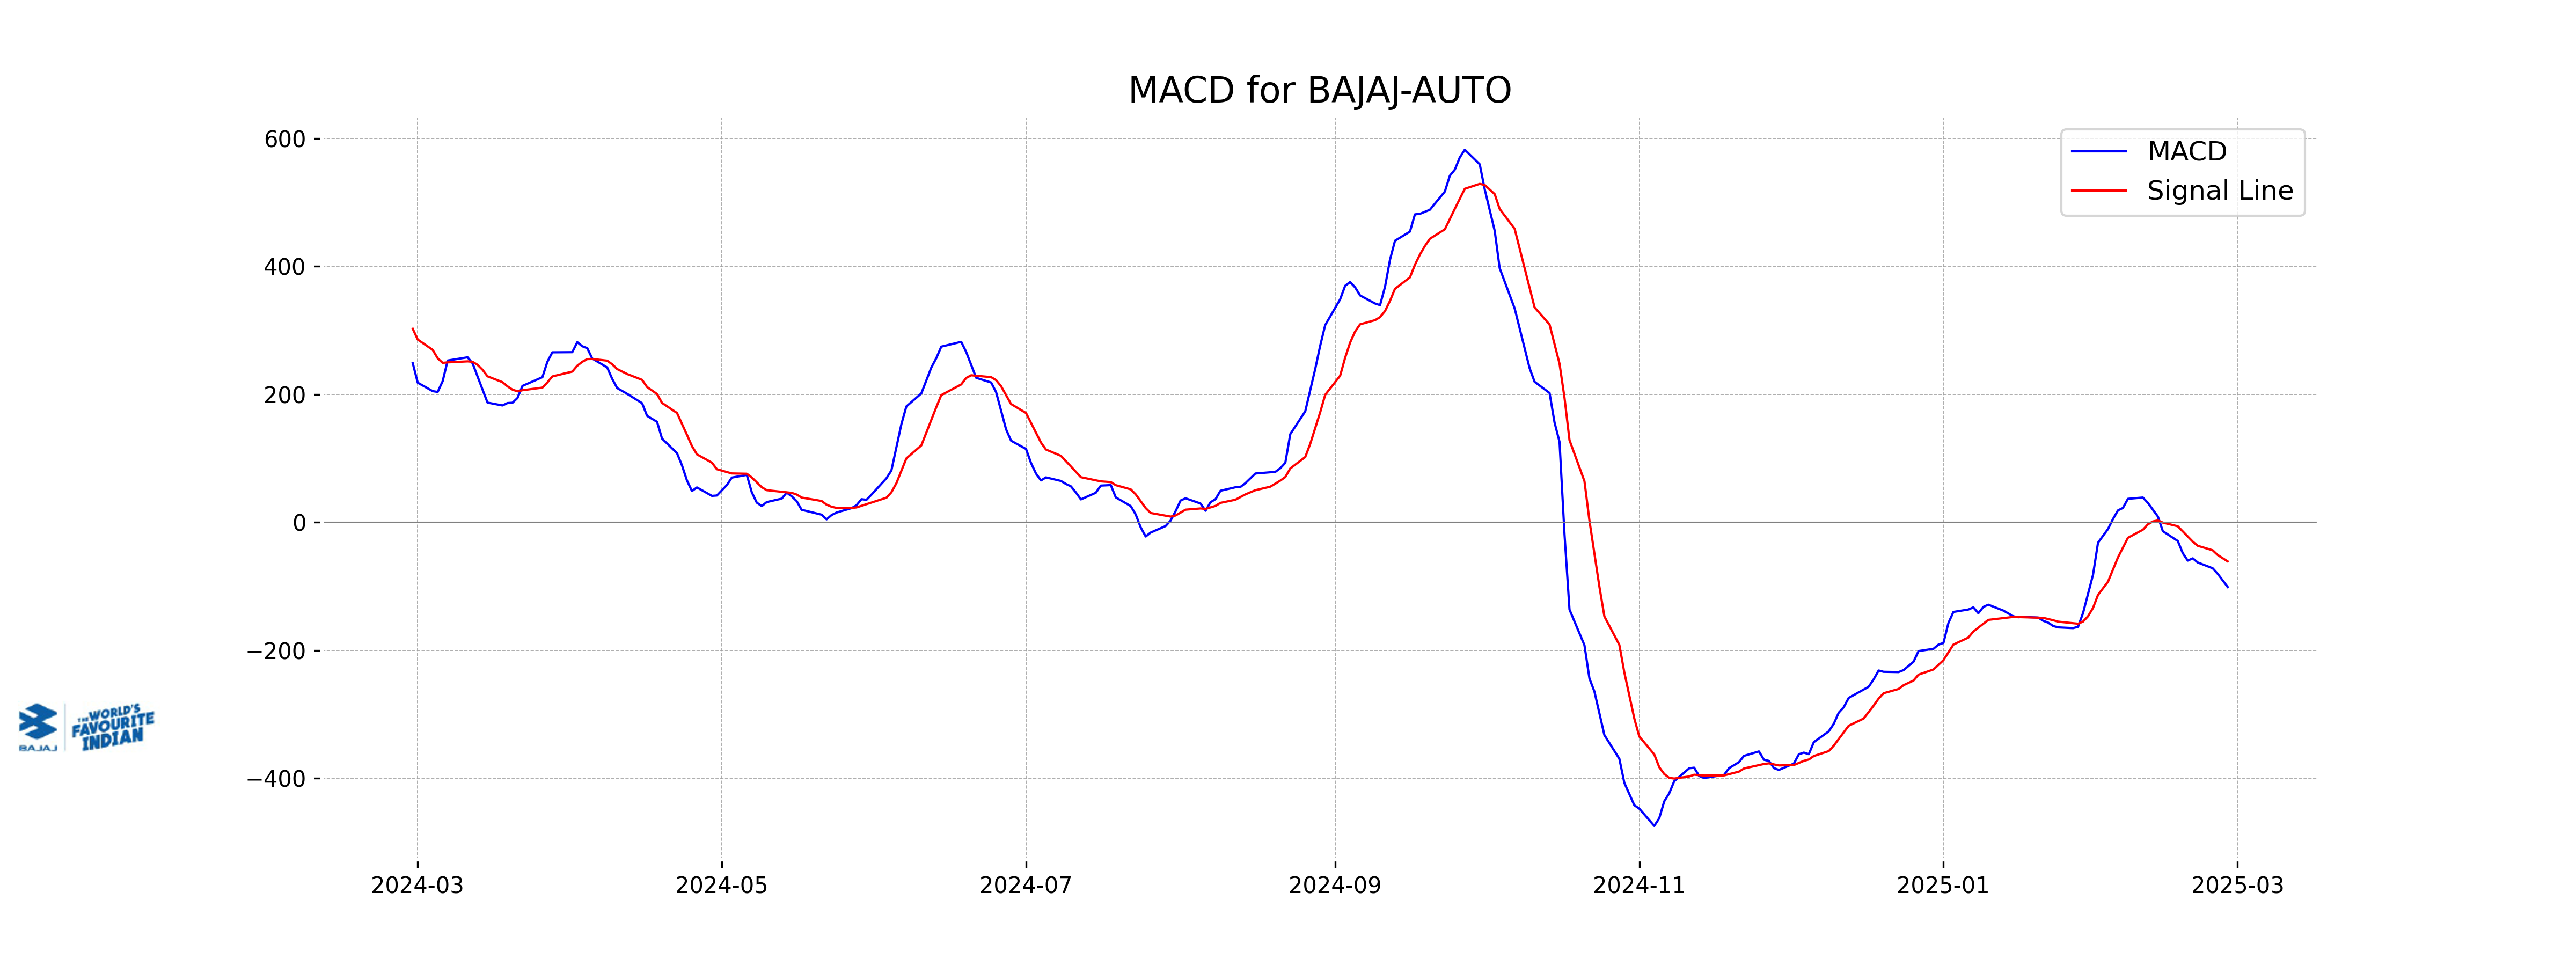
Moving Averages Trend (MACD)
Bajaj Auto MACD Analysis: The MACD for Bajaj Auto is currently at -101.11, indicating a bearish momentum as it is below the signal line, which is at -61.11. This suggests that the stock's current downtrend might continue unless there's a reversal in the momentum.
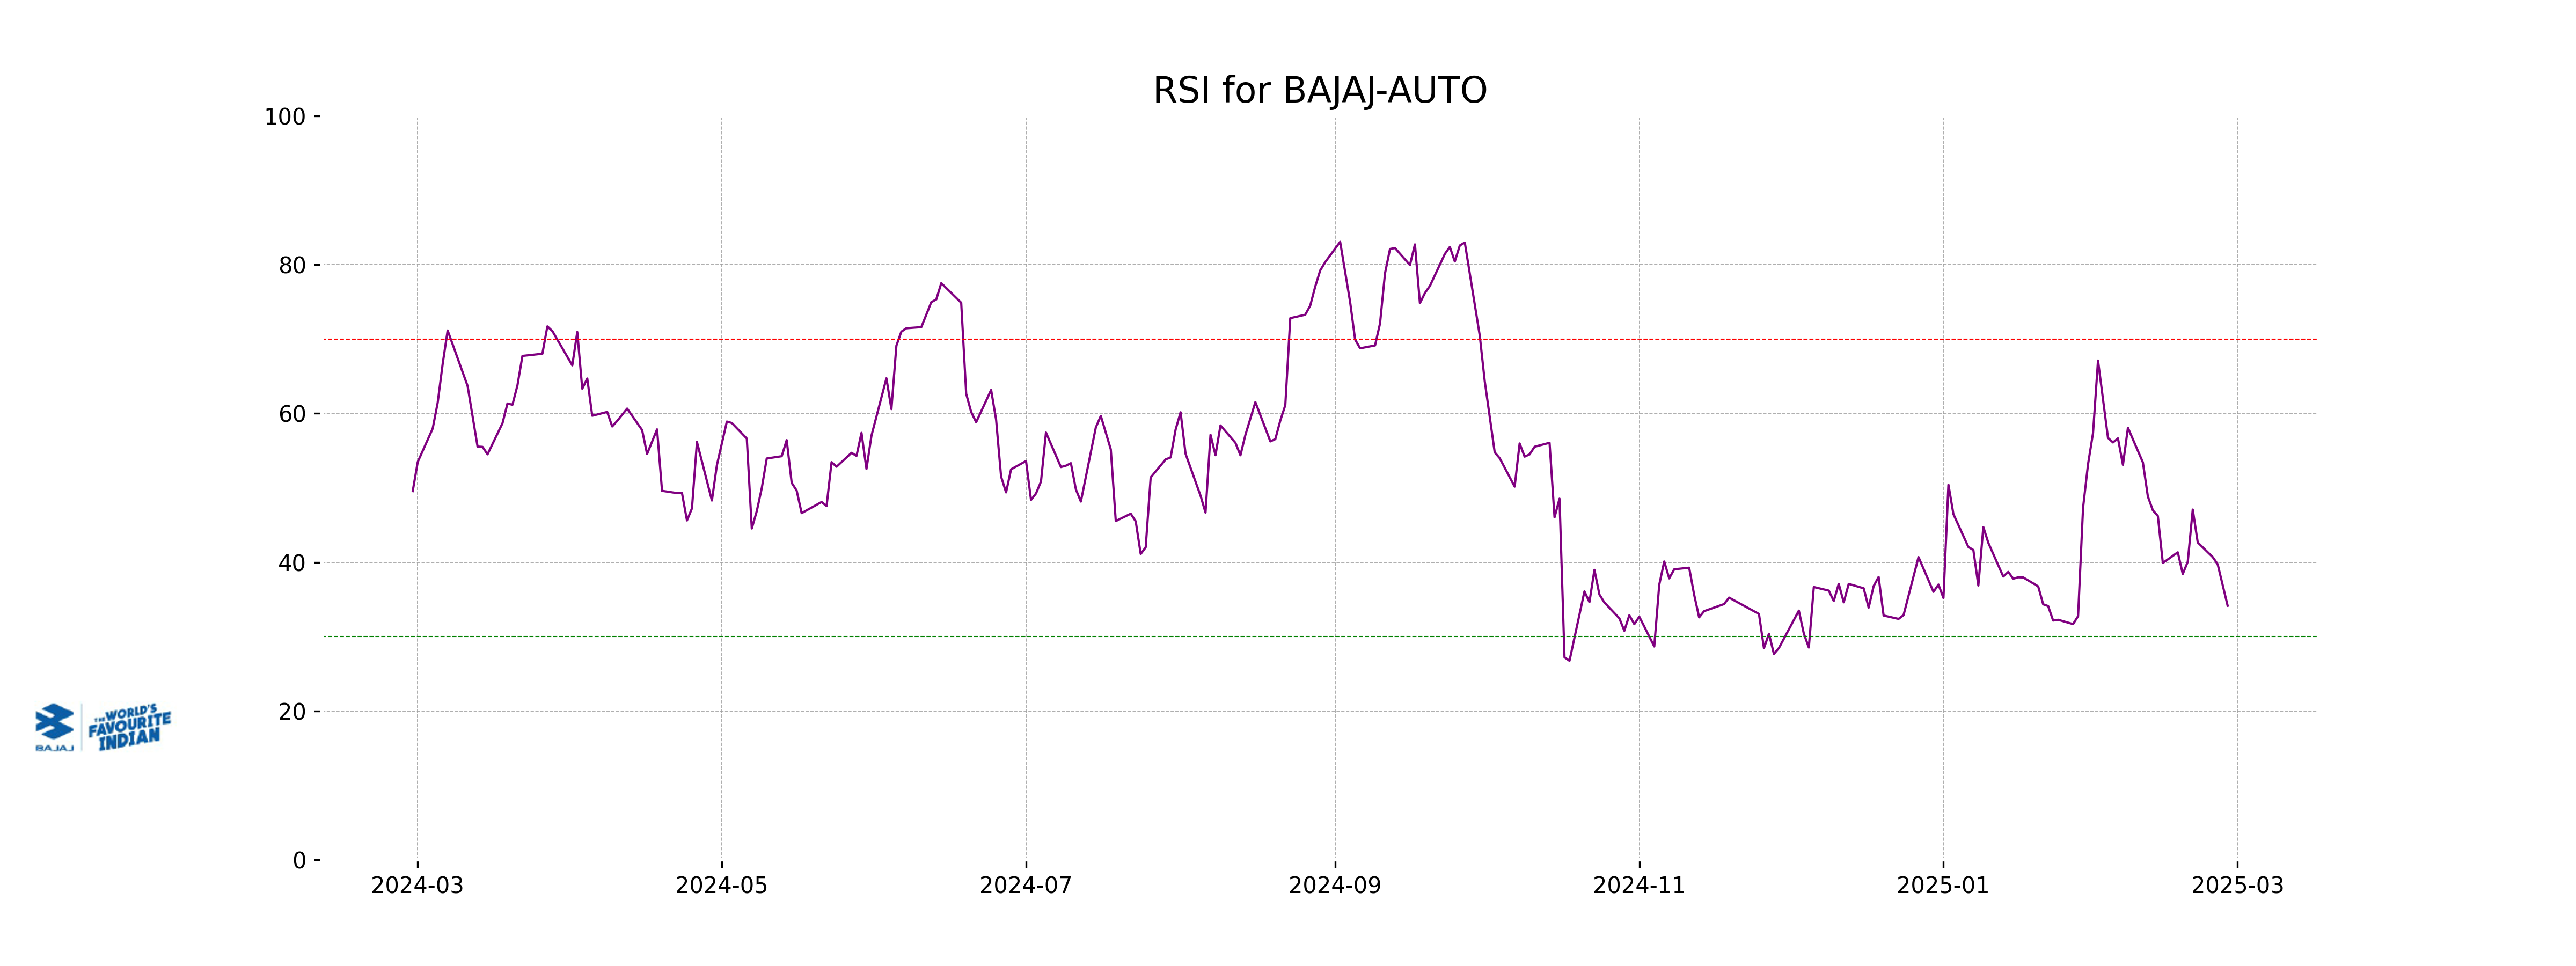
RSI Analysis
RSI Analysis for Bajaj Auto: The Relative Strength Index (RSI) of Bajaj Auto is 34.15, which suggests that the stock is approaching the oversold territory (typically RSI below 30 is considered oversold). This may indicate potential for a price reversal or buying opportunity, but further analysis of other technical indicators is advised before making decisions.
Analysis for Tata Motors - February 27, 2025
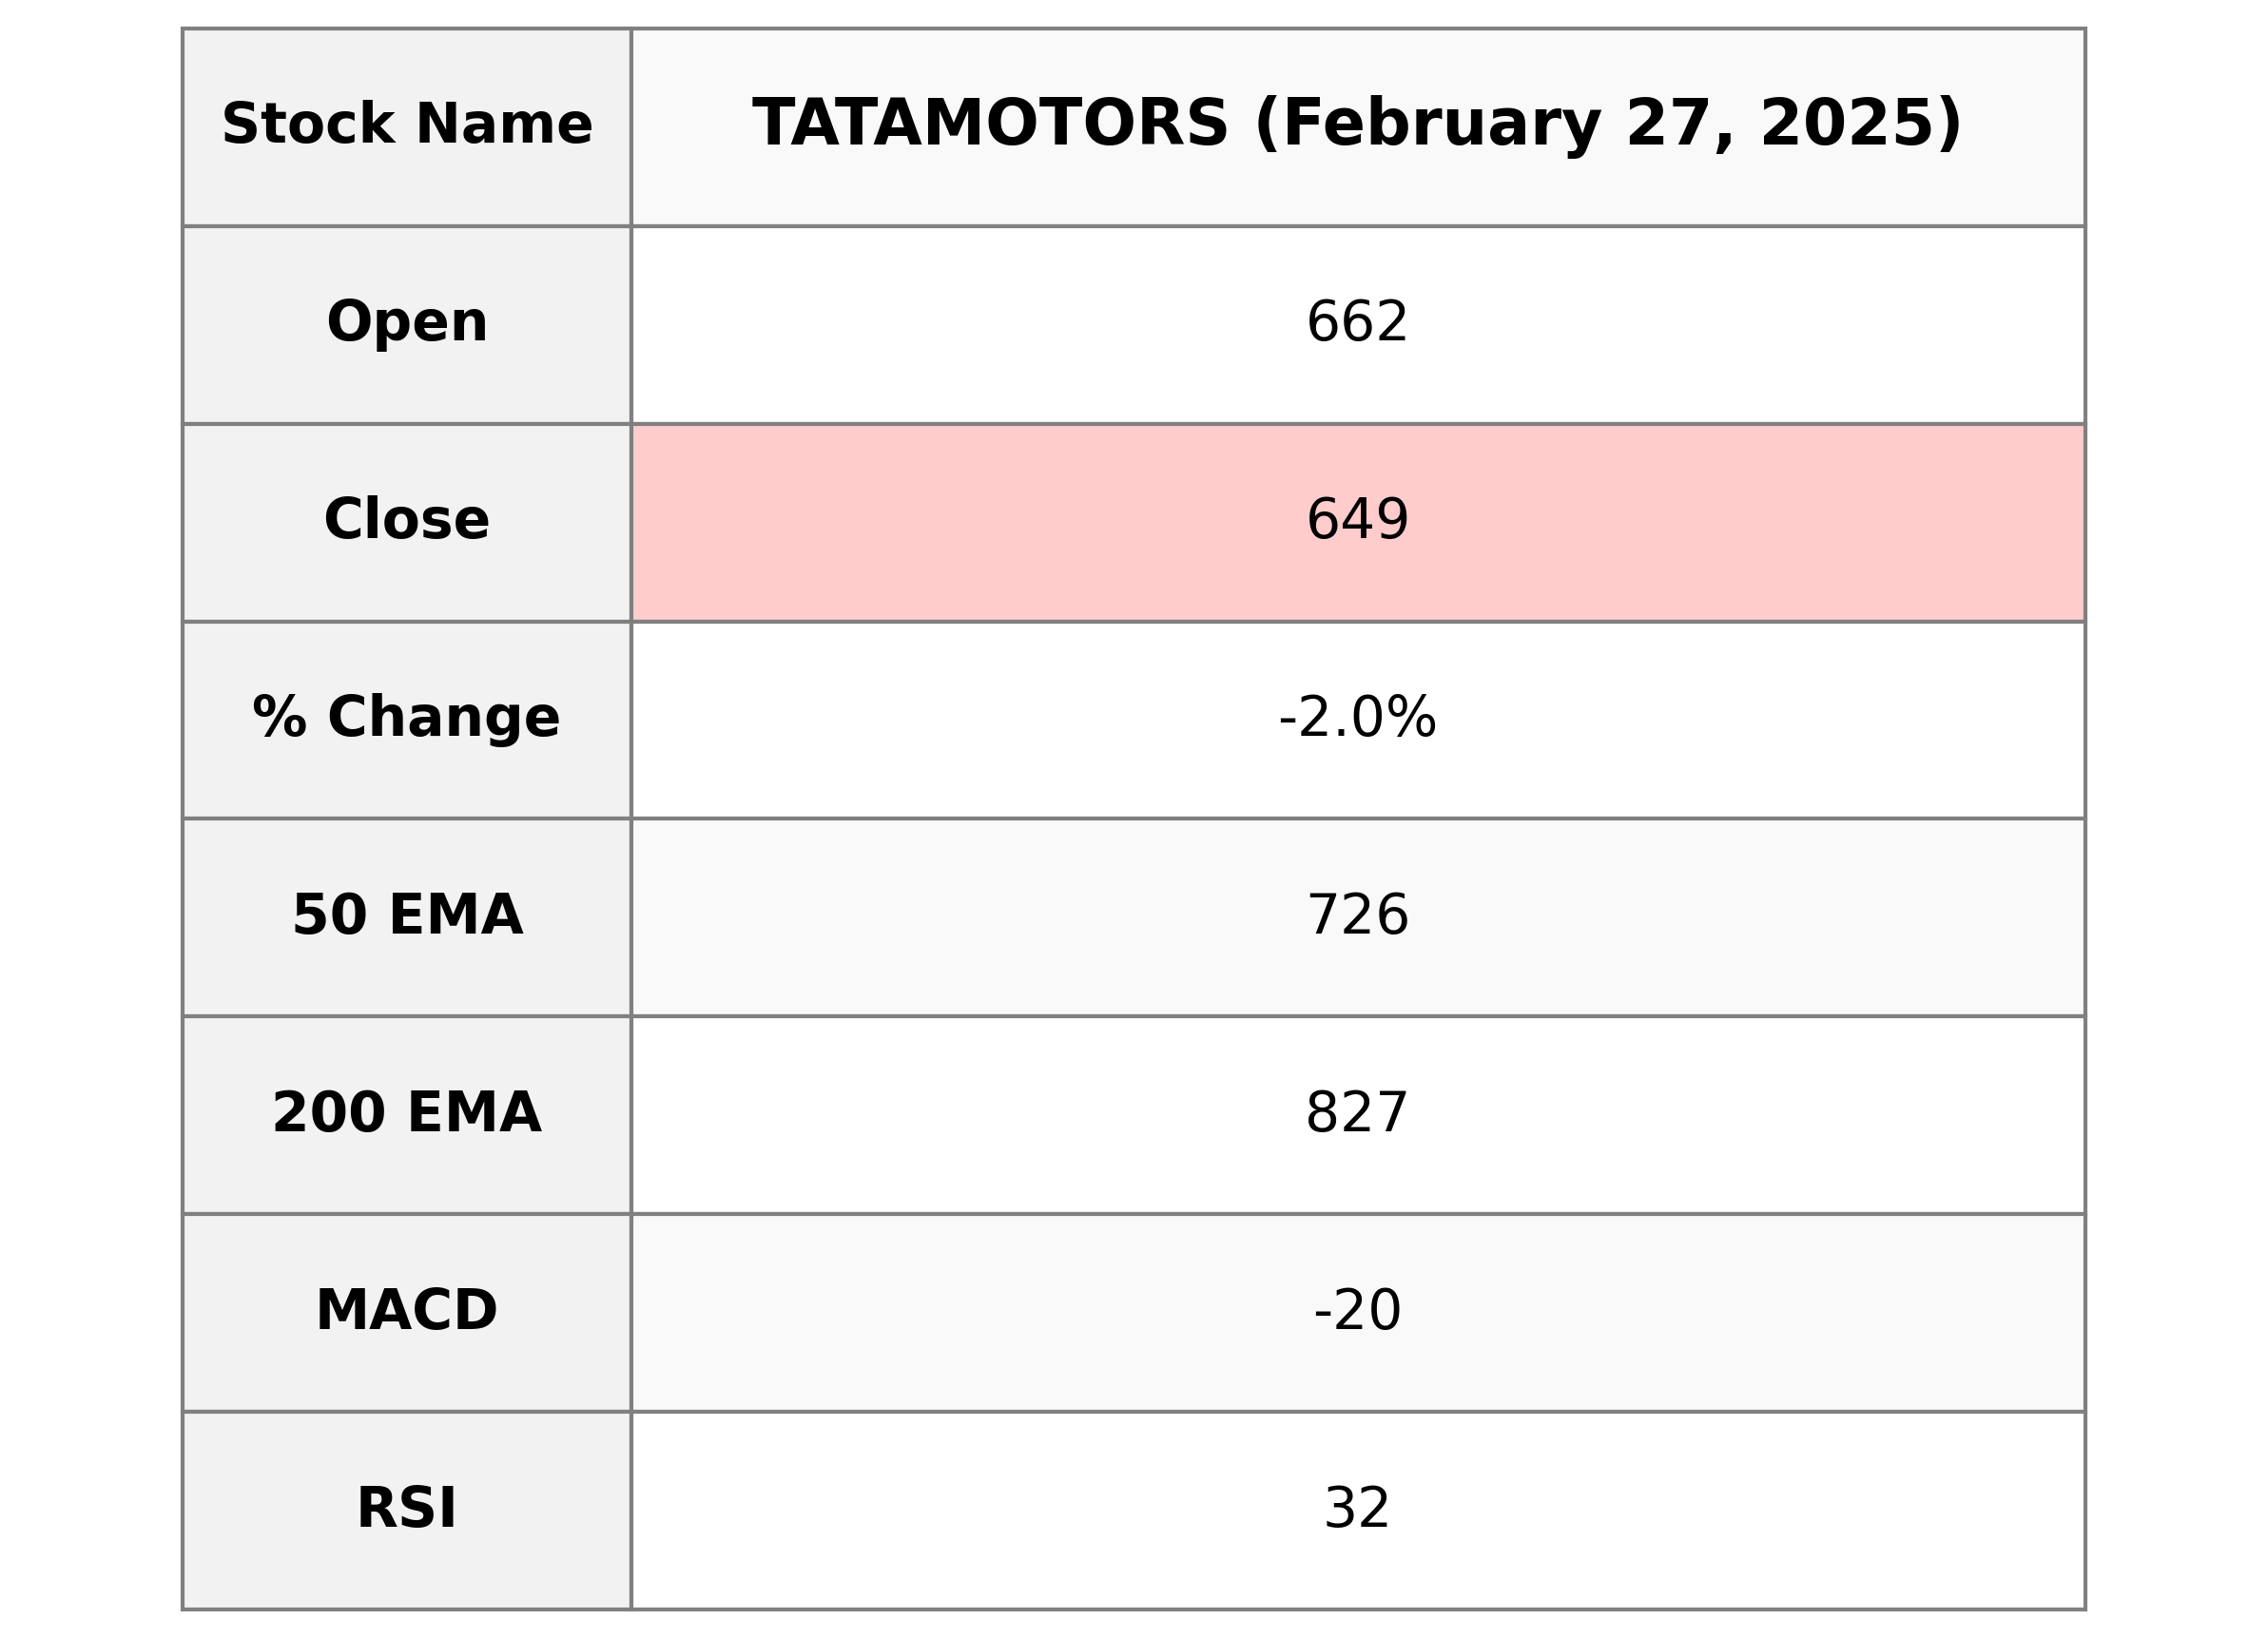
Tata Motors Performance Summary: Tata Motors, operating in the consumer cyclical sector of the auto manufacturing industry, witnessed a decline in its stock price by 1.97%, closing at 648.55 from a previous close of 661.60. The stock traded with a volume of 12,278,434 shares and recorded movement between a high of 665.0 and a low of 645.65. Its RSI at 31.71 indicates the stock may be nearing oversold territory. With a MACD indicator of -20.15 versus a signal of -18.77, there's a negative sentiment surrounding the stock's momentum. Currently, its PE Ratio stands at 7.49, supported by an EPS of 86.6.
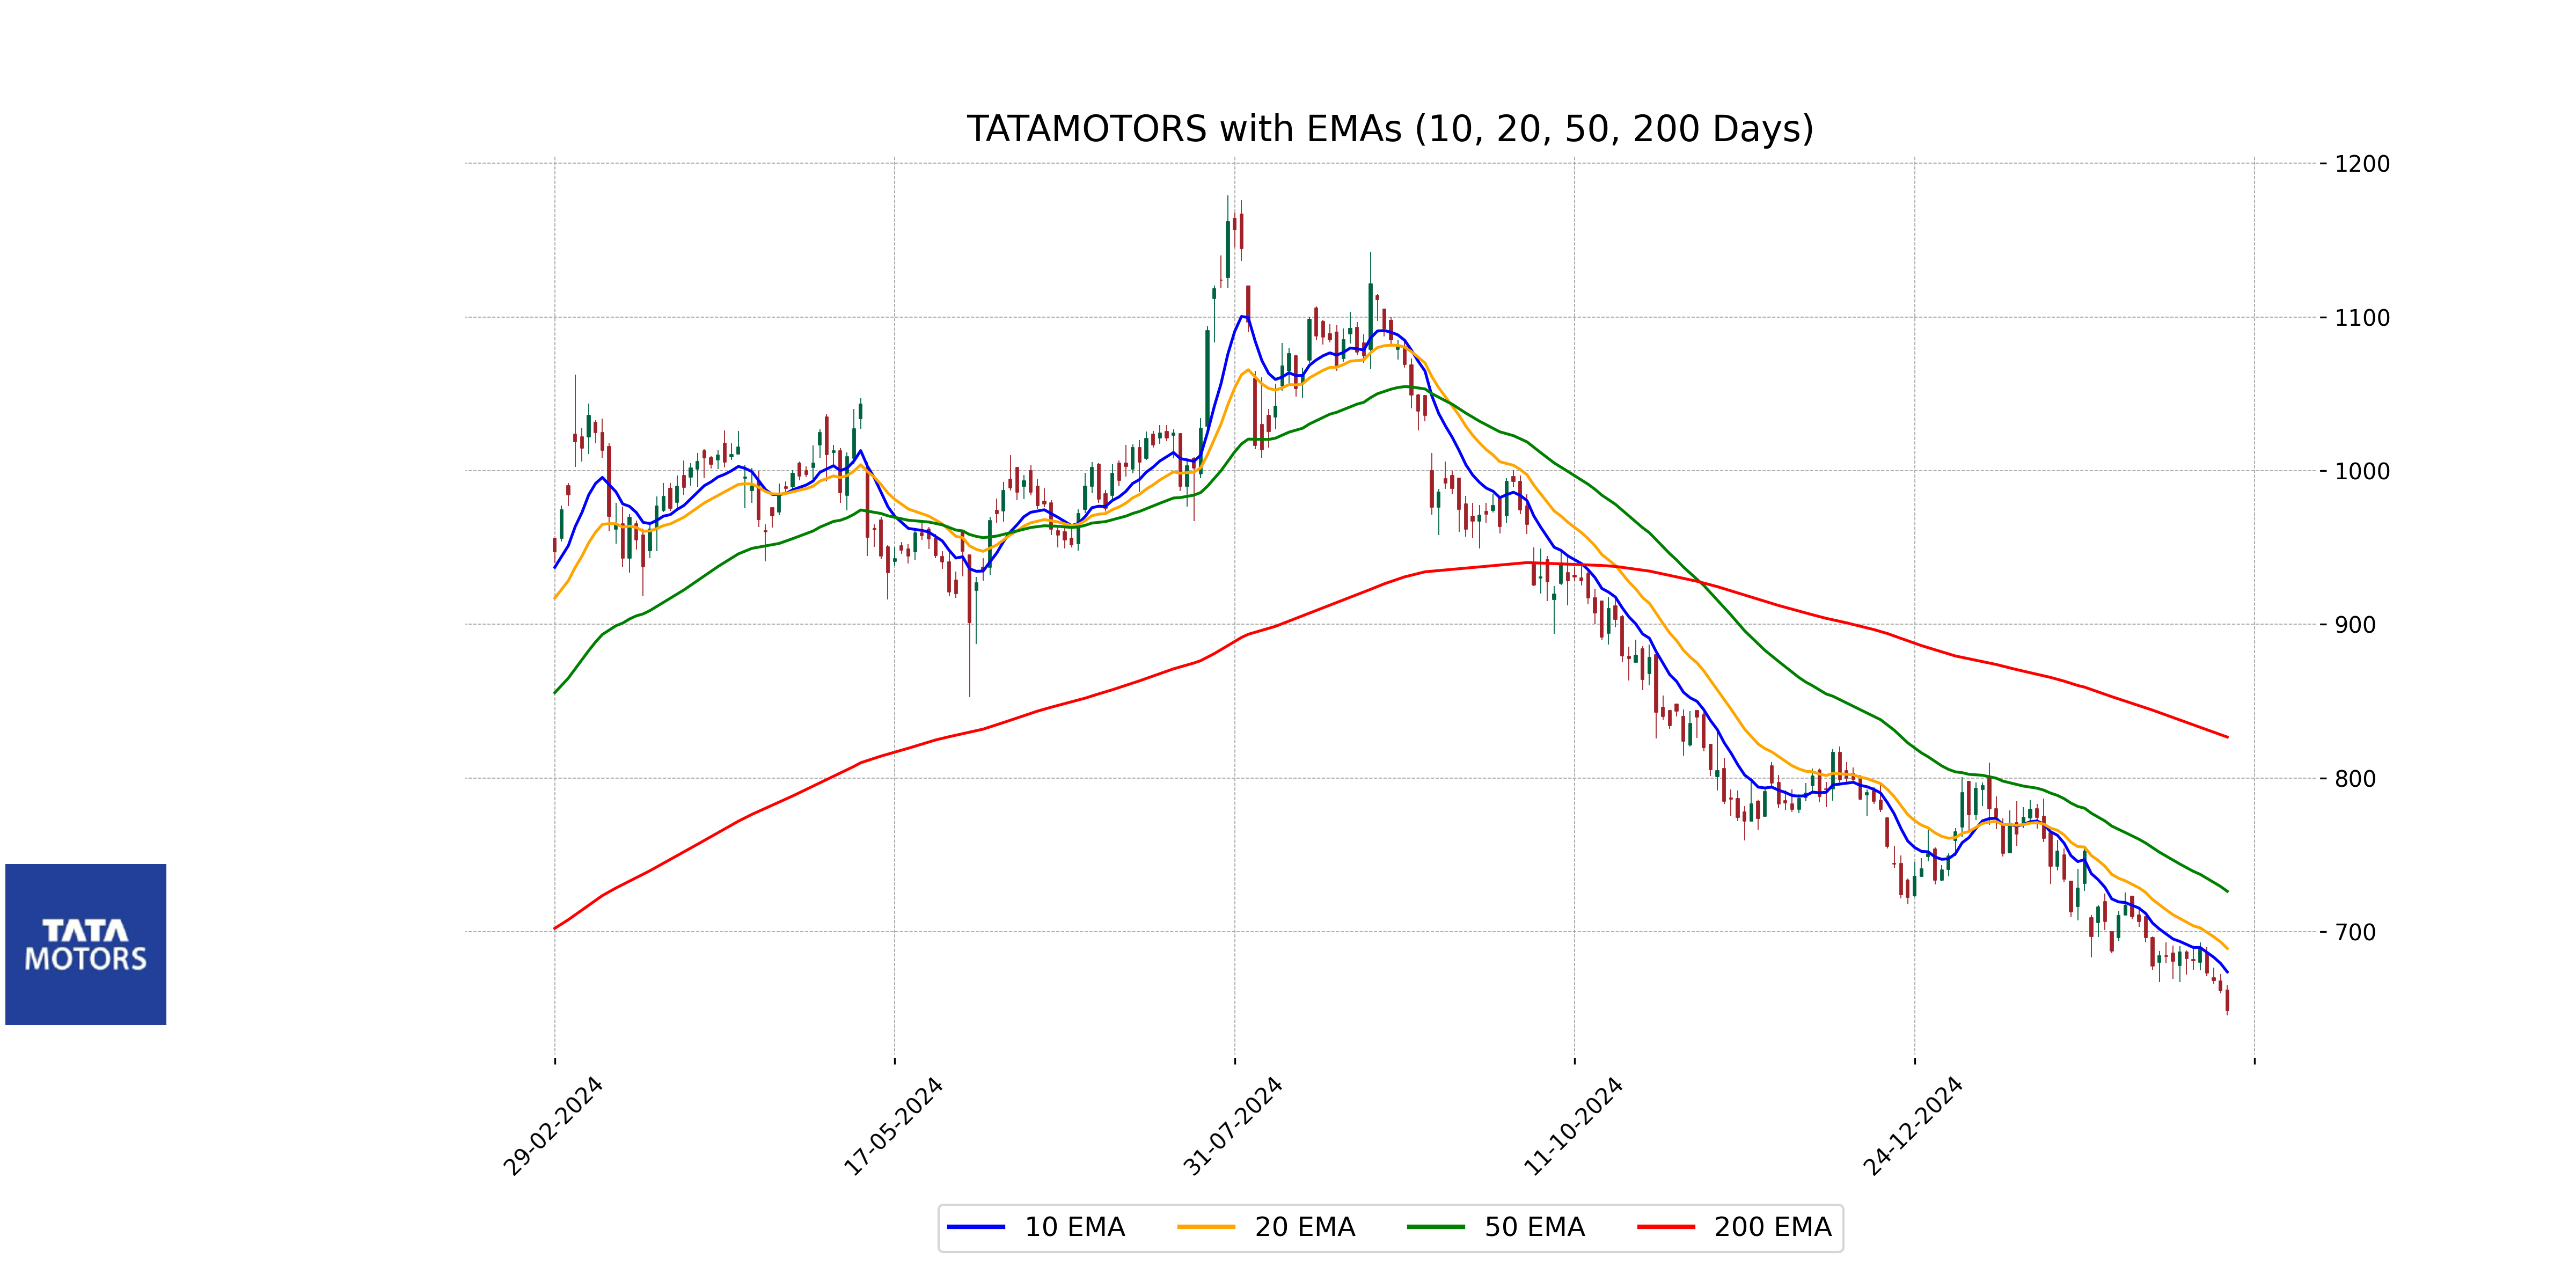
Relationship with Key Moving Averages
Tata Motors is currently trading below its key moving averages, with the close price of 648.55 lower than the 10-day EMA of 673.79, the 50-day EMA of 726.26, and the 200-day EMA of 826.61. This indicates a bearish trend in the stock's performance.
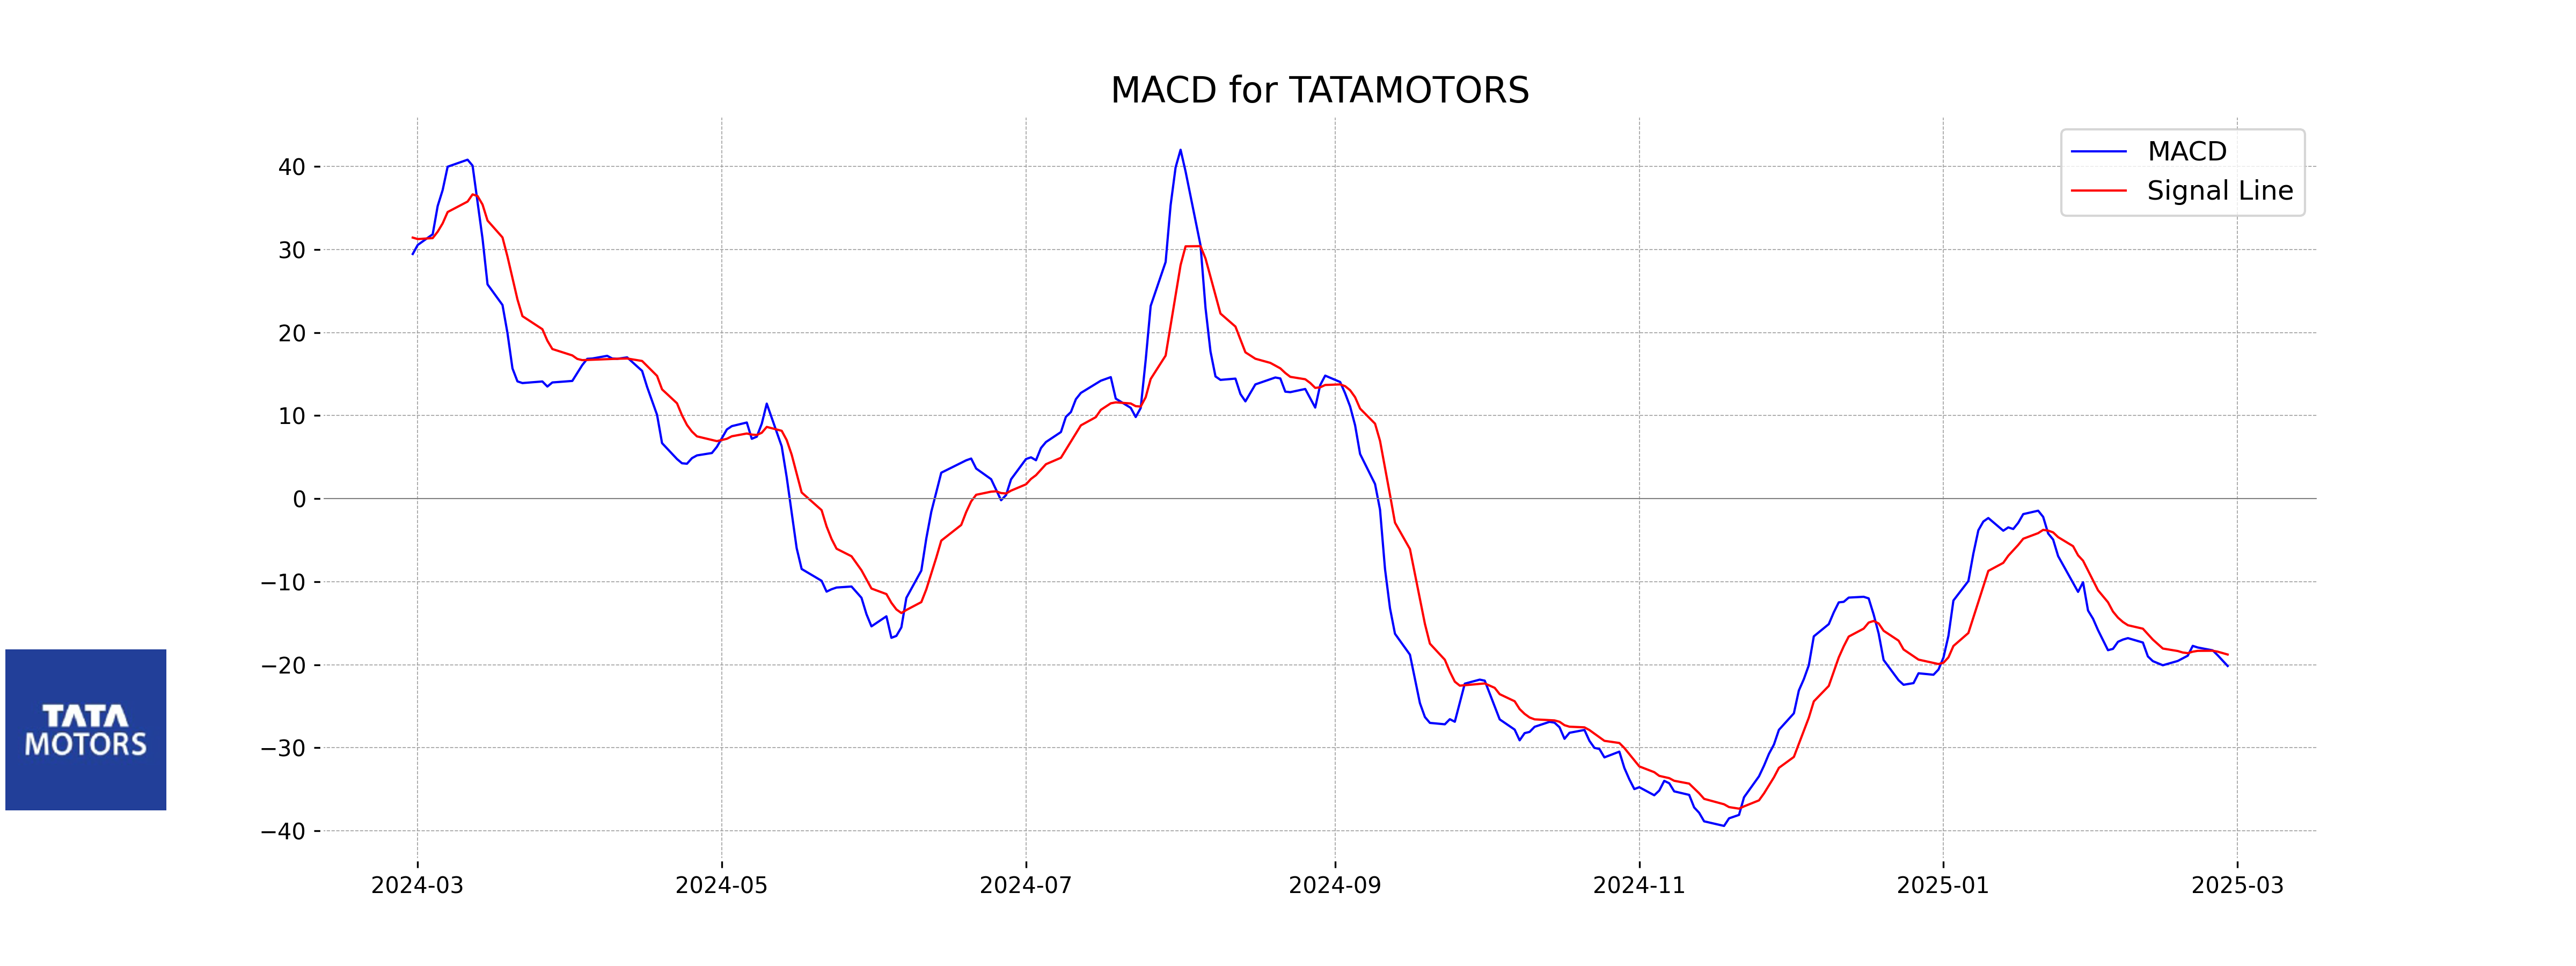
Moving Averages Trend (MACD)
The MACD for Tata Motors indicates a bearish divergence, with the current MACD value at -20.15 and the Signal Line at -18.77, suggesting a potential downtrend continuation. Additionally, the RSI is at 31.71, which is close to the oversold territory, indicating potential weakness in momentum.
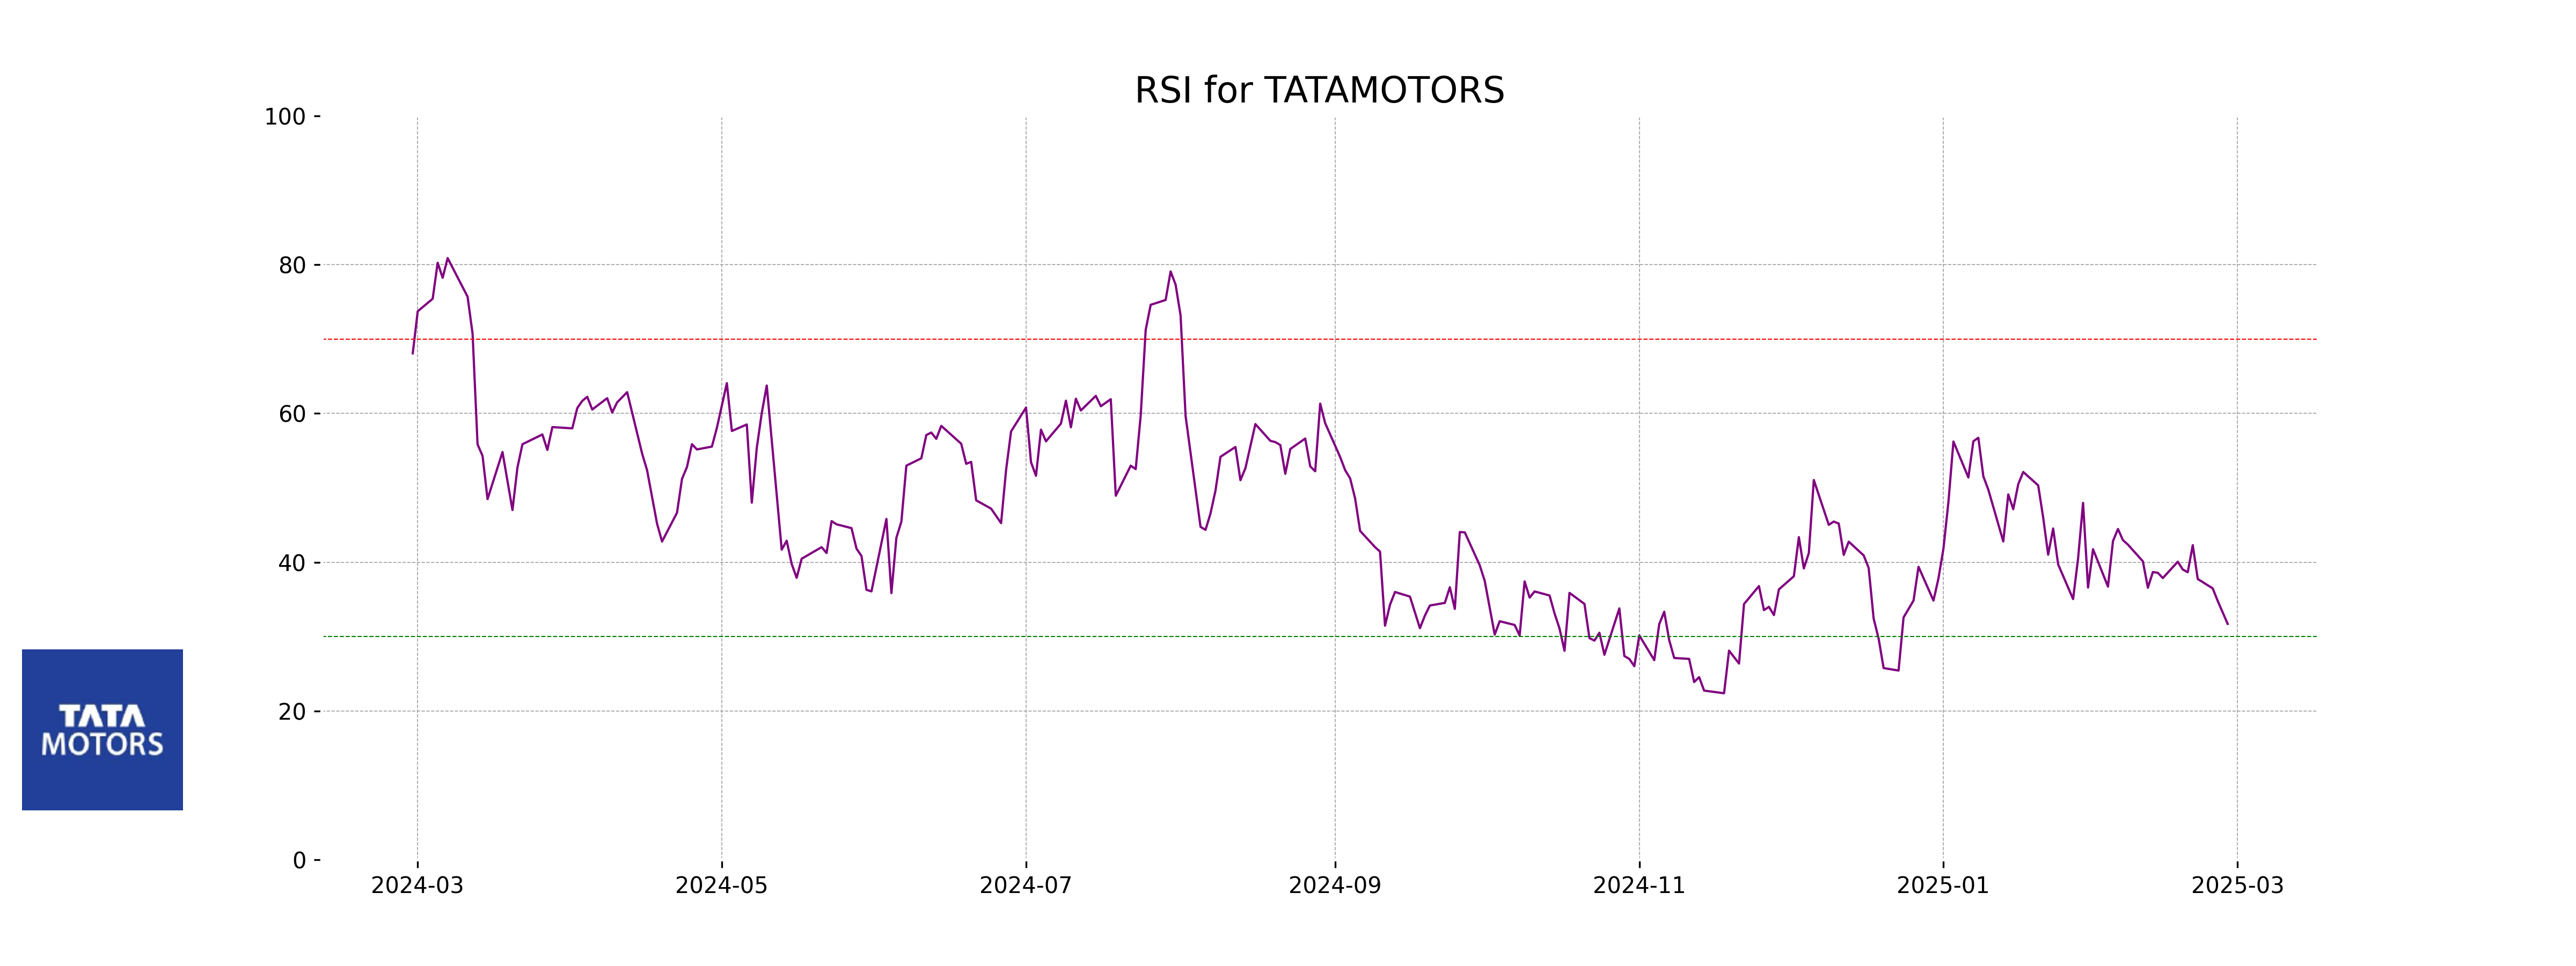
RSI Analysis
Tata Motors has an RSI of 31.71, indicating that the stock is currently in the oversold territory. This suggests that the stock may be undervalued at the moment, and there could be potential for a price rebound. However, further analysis and market conditions should be considered before making investment decisions.
Analysis for Trent - February 27, 2025
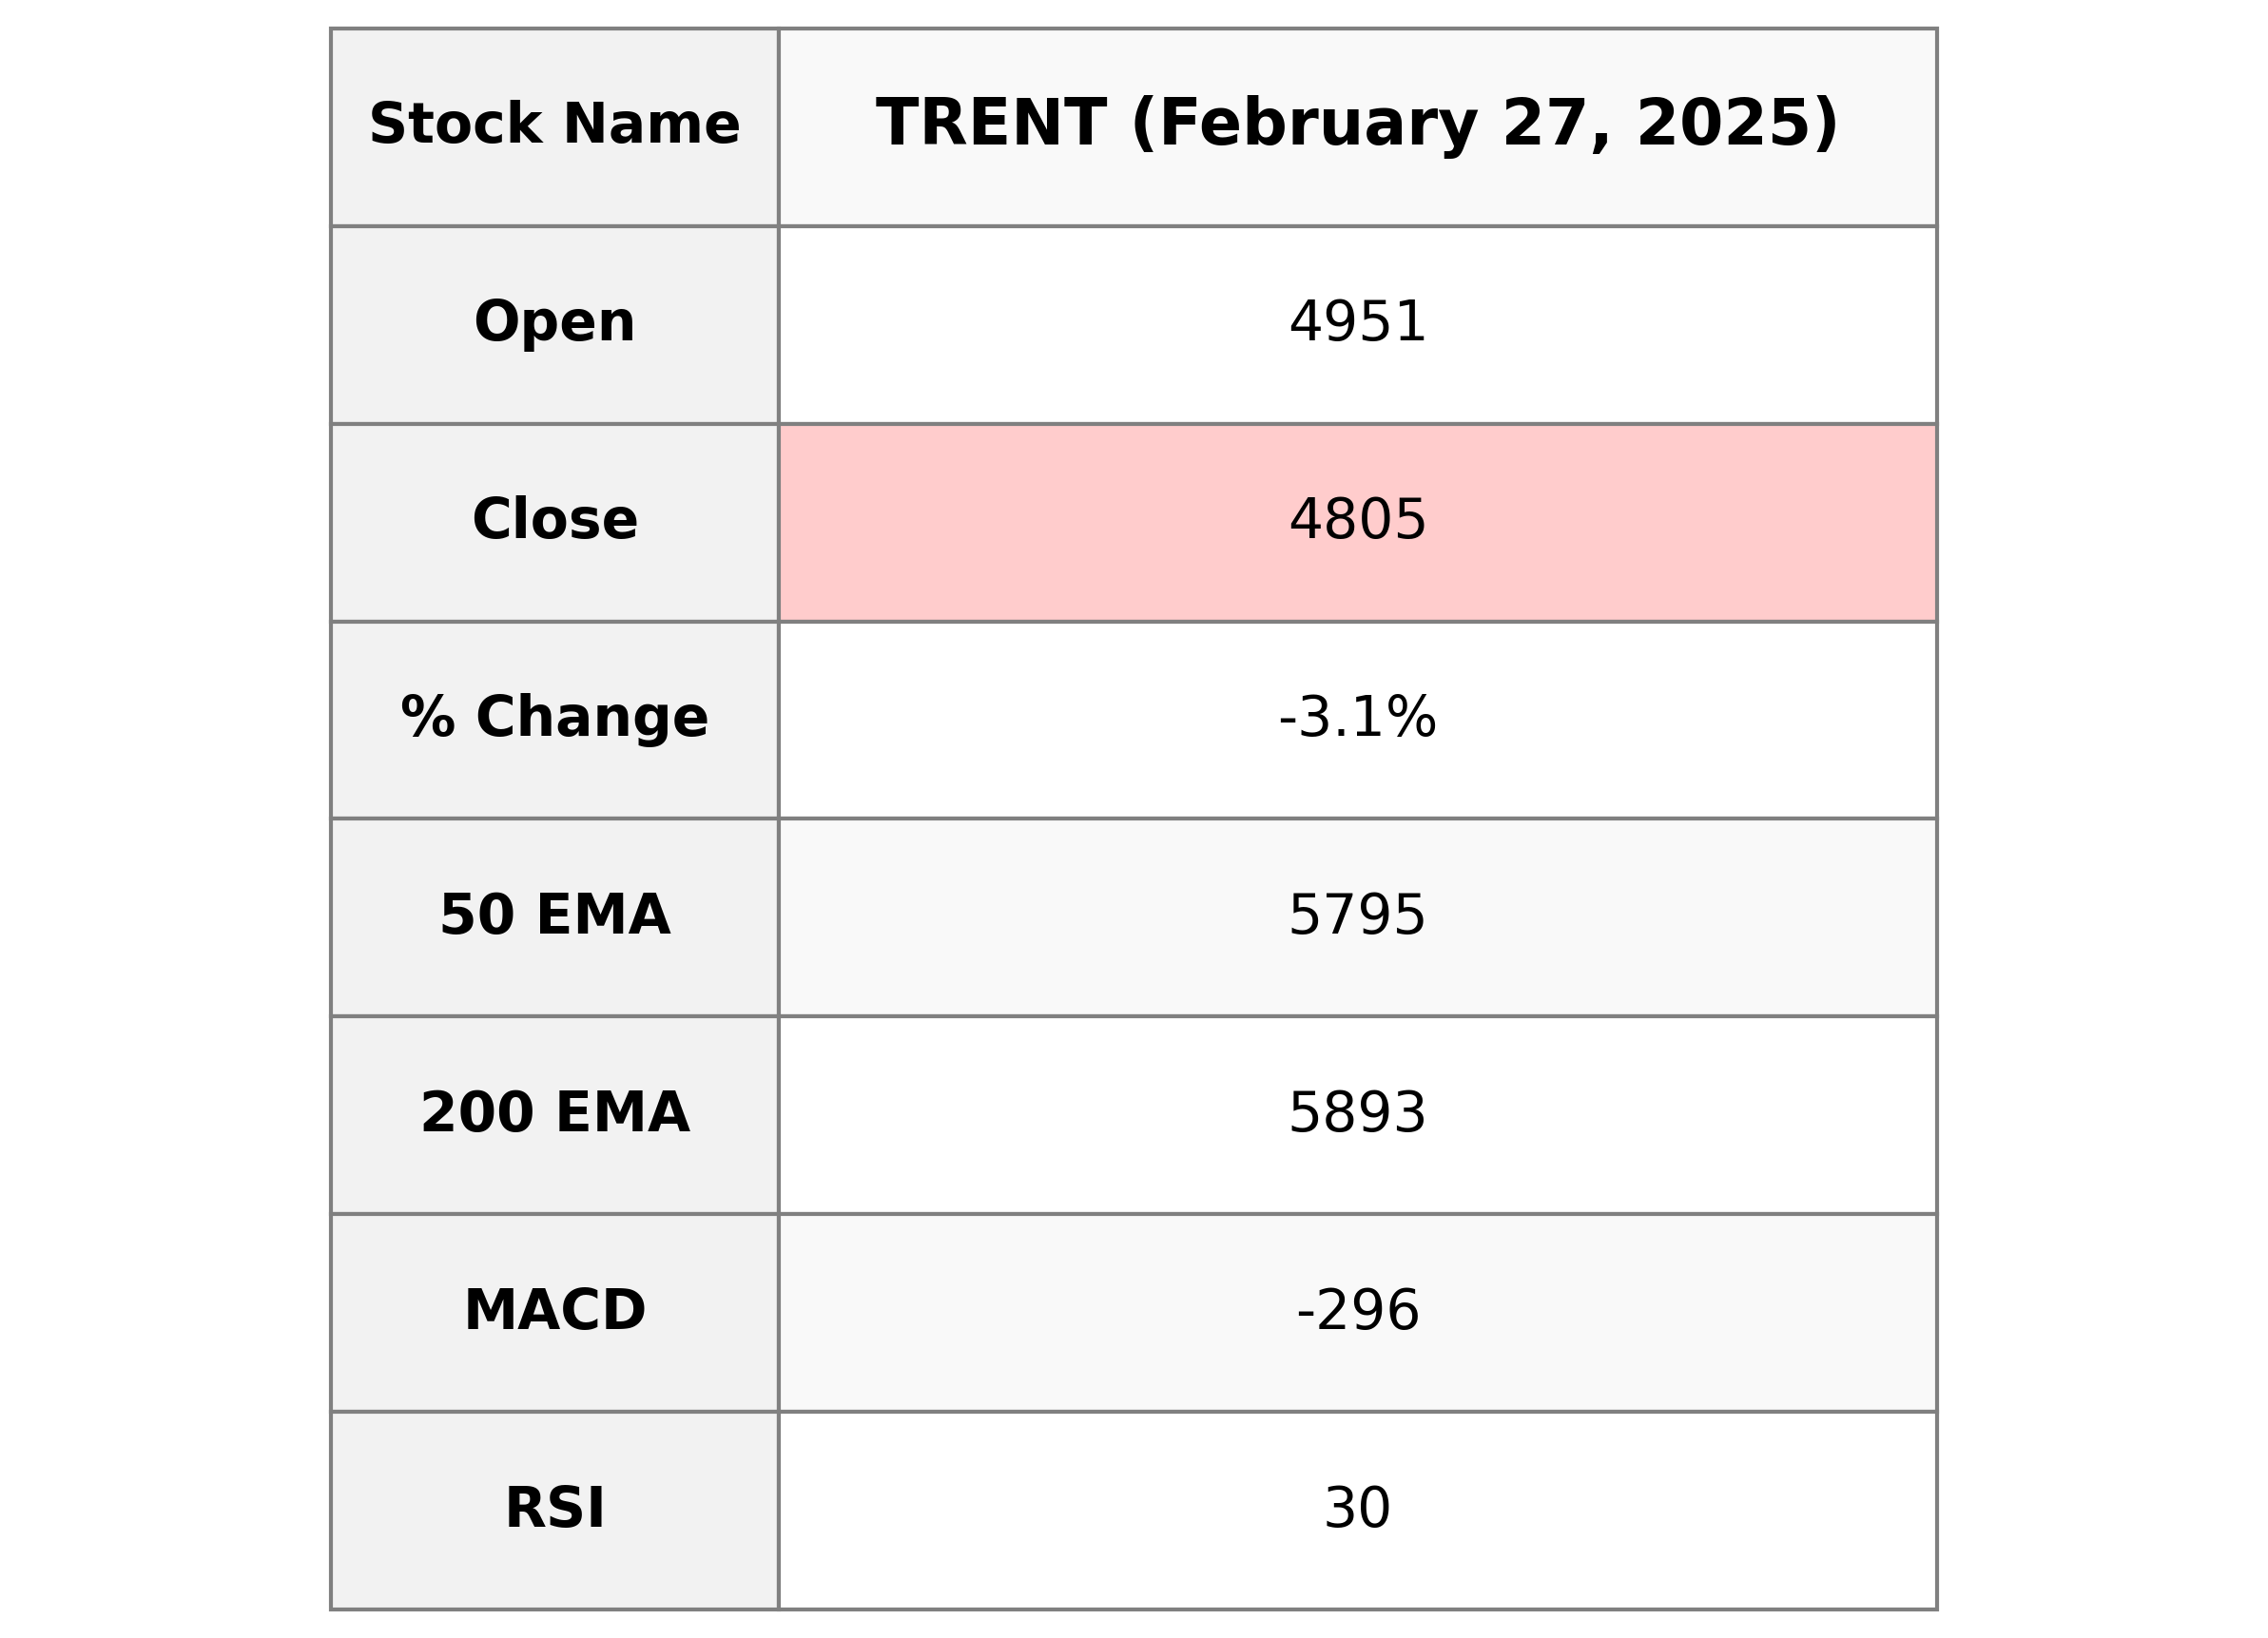
Trent Performance Description: Trent experienced a significant decline, with the stock closing at 4805.30 compared to the previous close of 4959.90, causing a percentage drop of -3.12%. The company belongs to the Consumer Cyclical sector and the Apparel Retail industry in India. The RSI indicates the stock is near oversold territory, while the MACD suggests a negative trend.
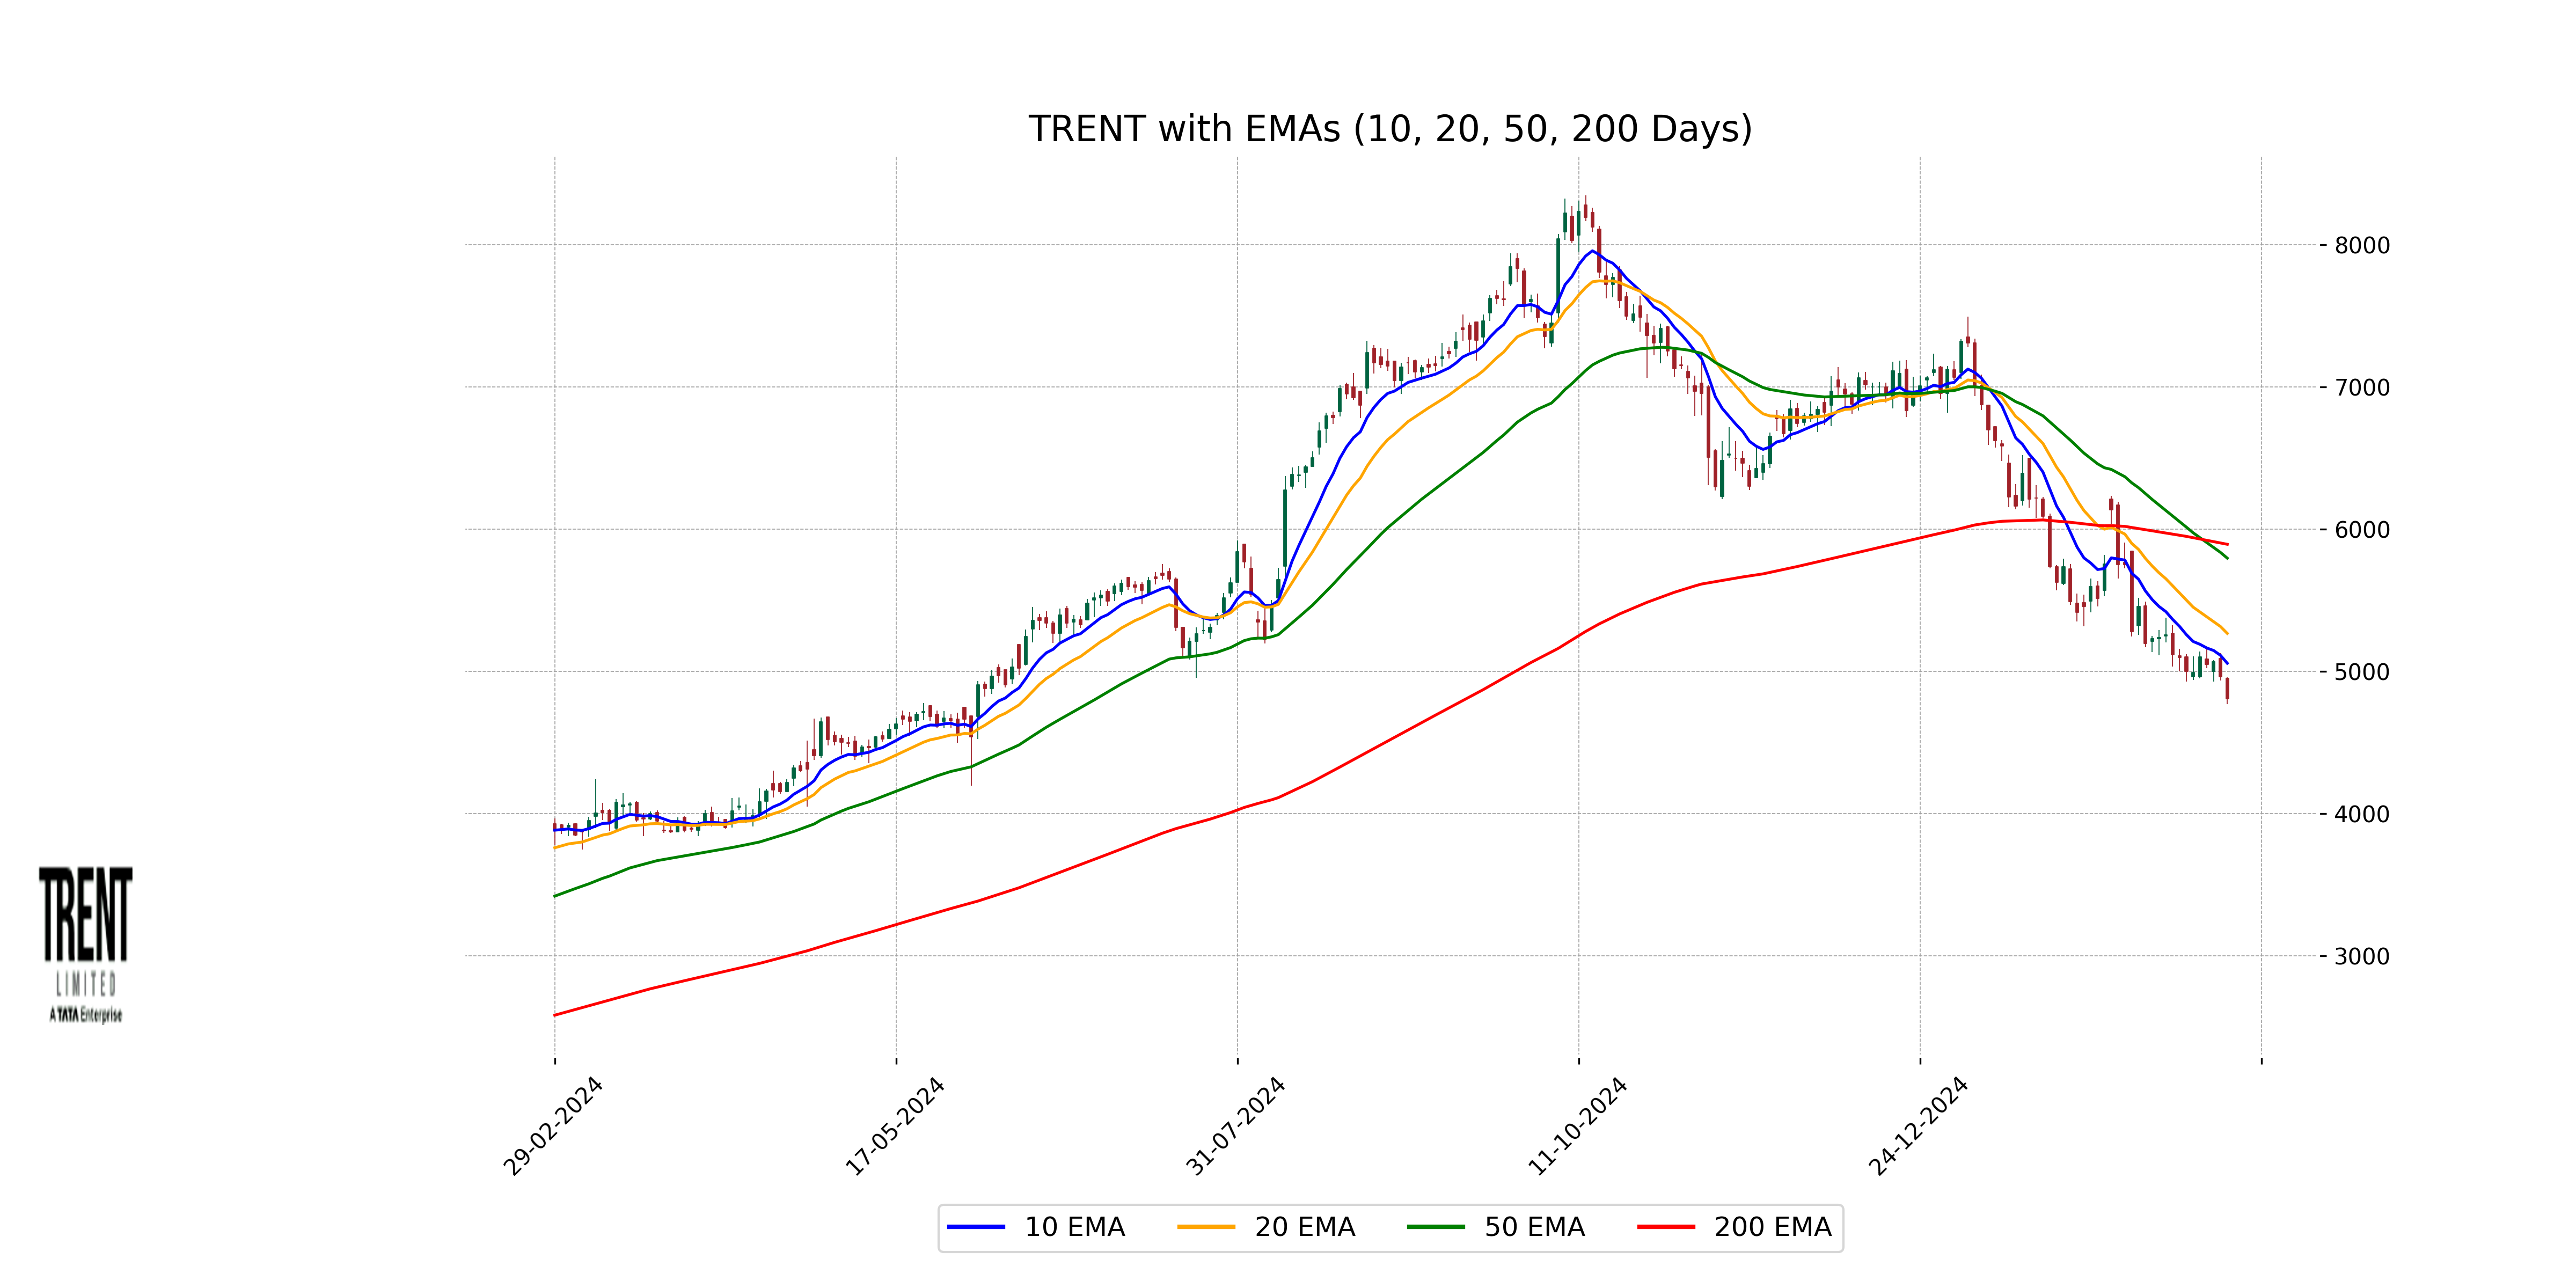
Relationship with Key Moving Averages
Trent is currently trading below its key moving averages, with the close price (4805.30) under the 10-EMA (5056.38), 20-EMA (5266.22), 50-EMA (5795.38), and 200-EMA (5892.86). This indicates a bearish trend, as the price is below all these moving averages, suggesting weakness in the stock's current price action.
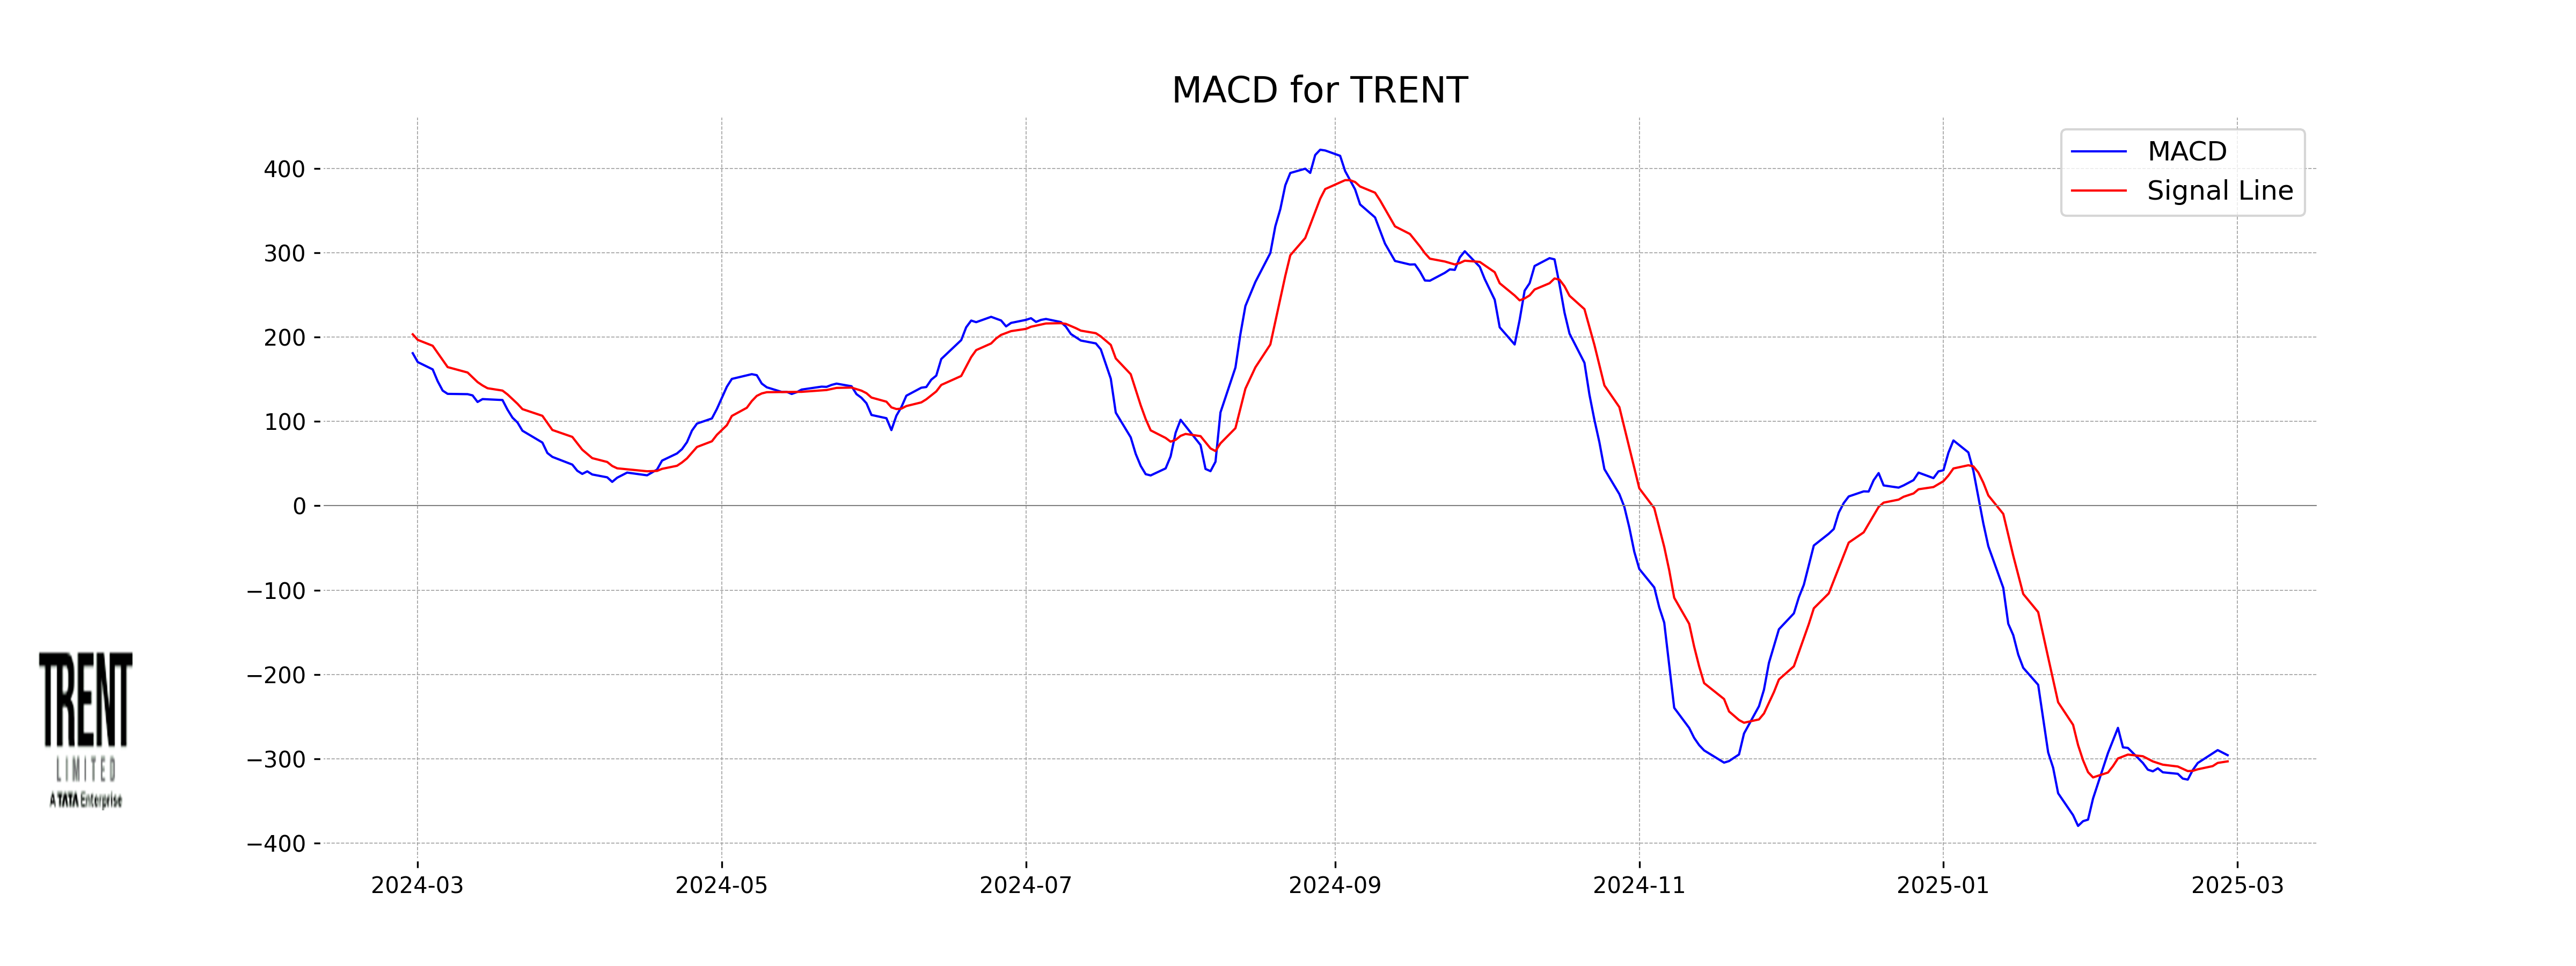
Moving Averages Trend (MACD)
The MACD for Trent indicates a bearish trend as the MACD line (-295.6177) is above the signal line (-302.9393), yet both are in negative territory, suggesting the stock is experiencing downward momentum. The significant negative MACD value, combined with a RSI of 30.22, points towards potential oversold conditions.
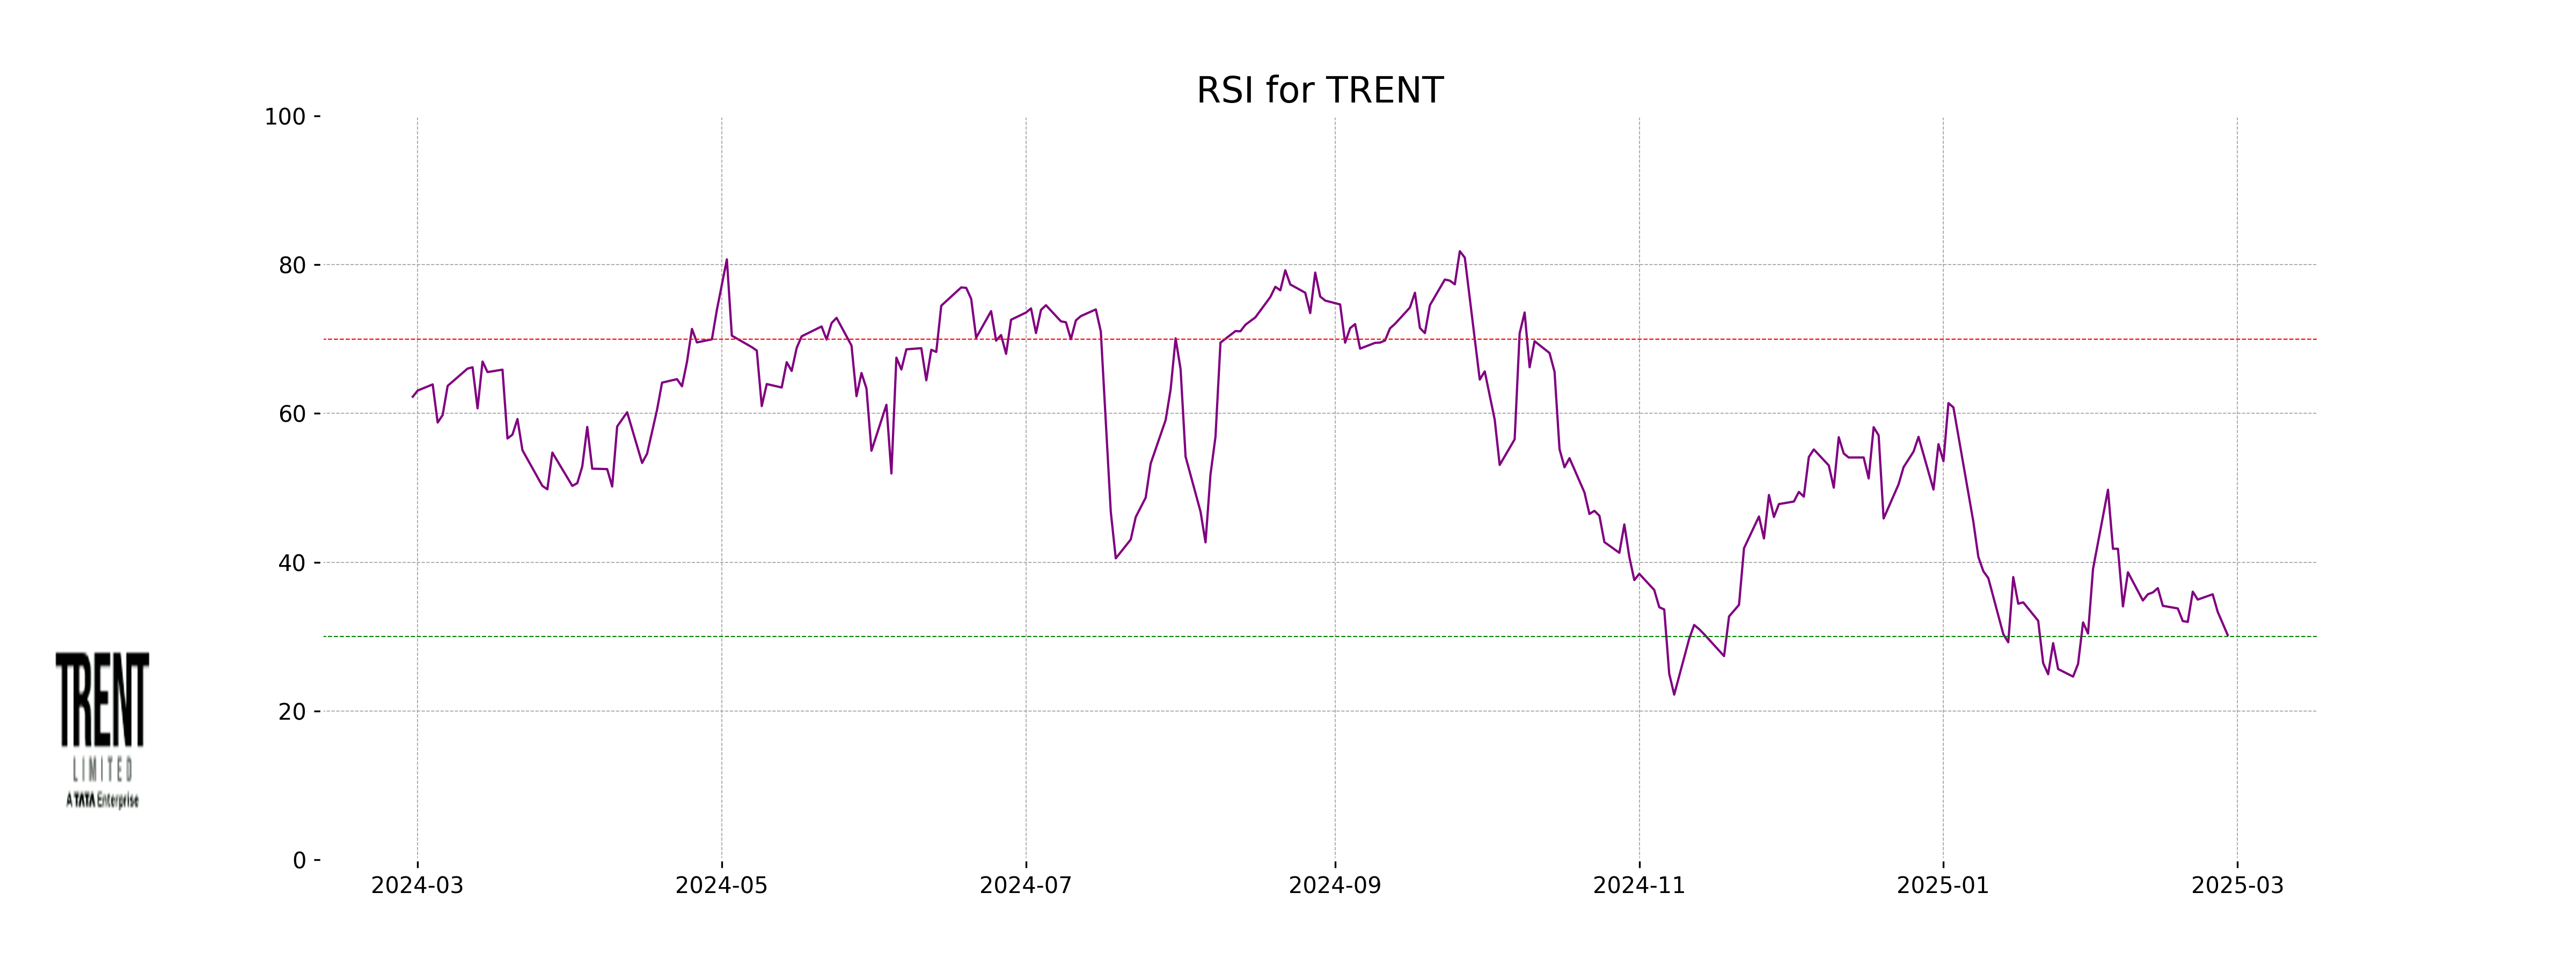
RSI Analysis
Trent's RSI, currently at 30.22, is typically considered to be in the oversold territory, suggesting that the stock may be undervalued or due for a potential reversal. This could indicate a buying opportunity for traders who follow RSI as part of their strategy. However, additional analysis is recommended before making any trading decisions.
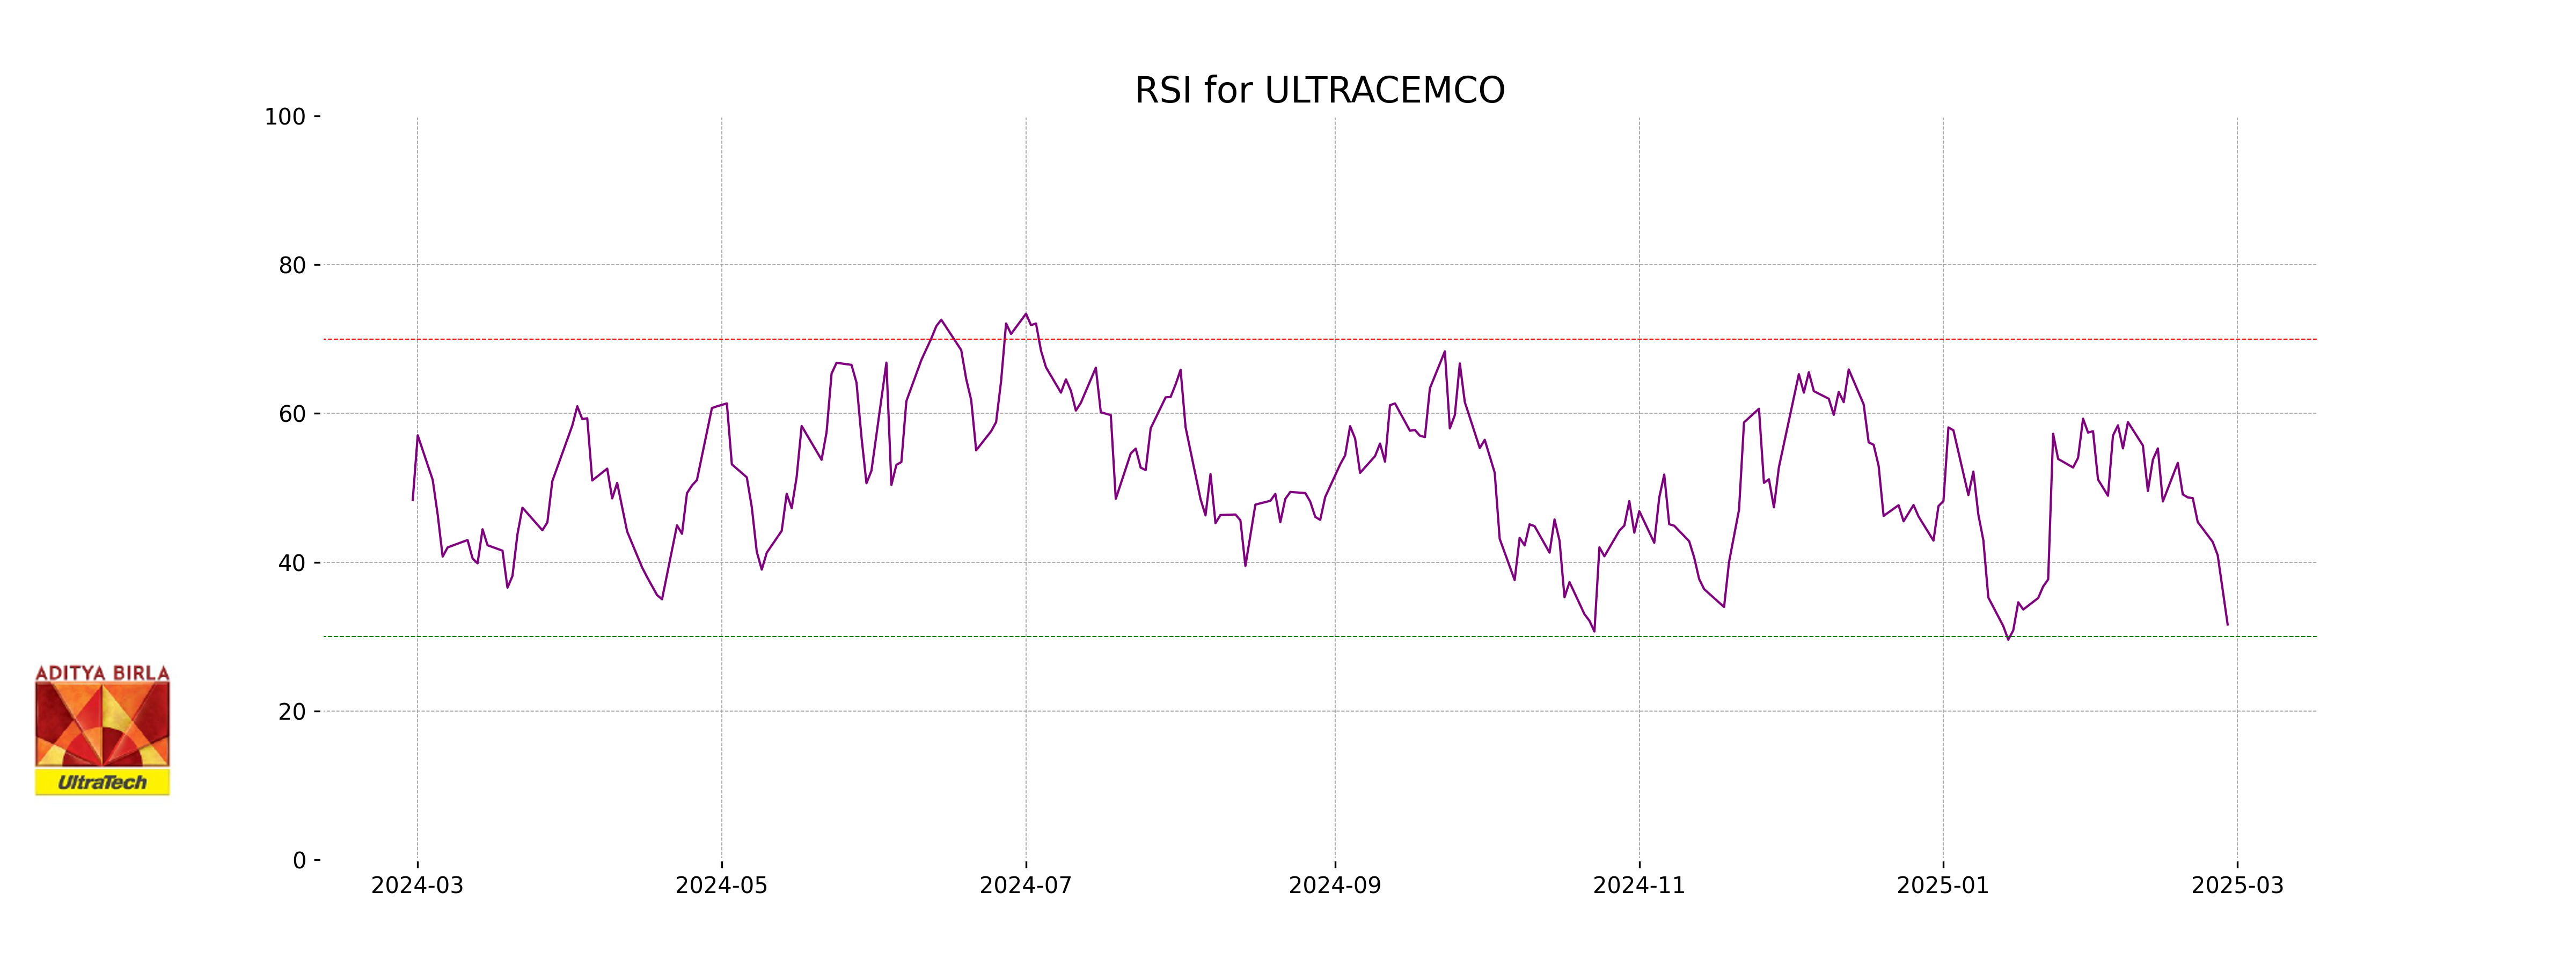
Analysis for UltraTech Cement - February 27, 2025
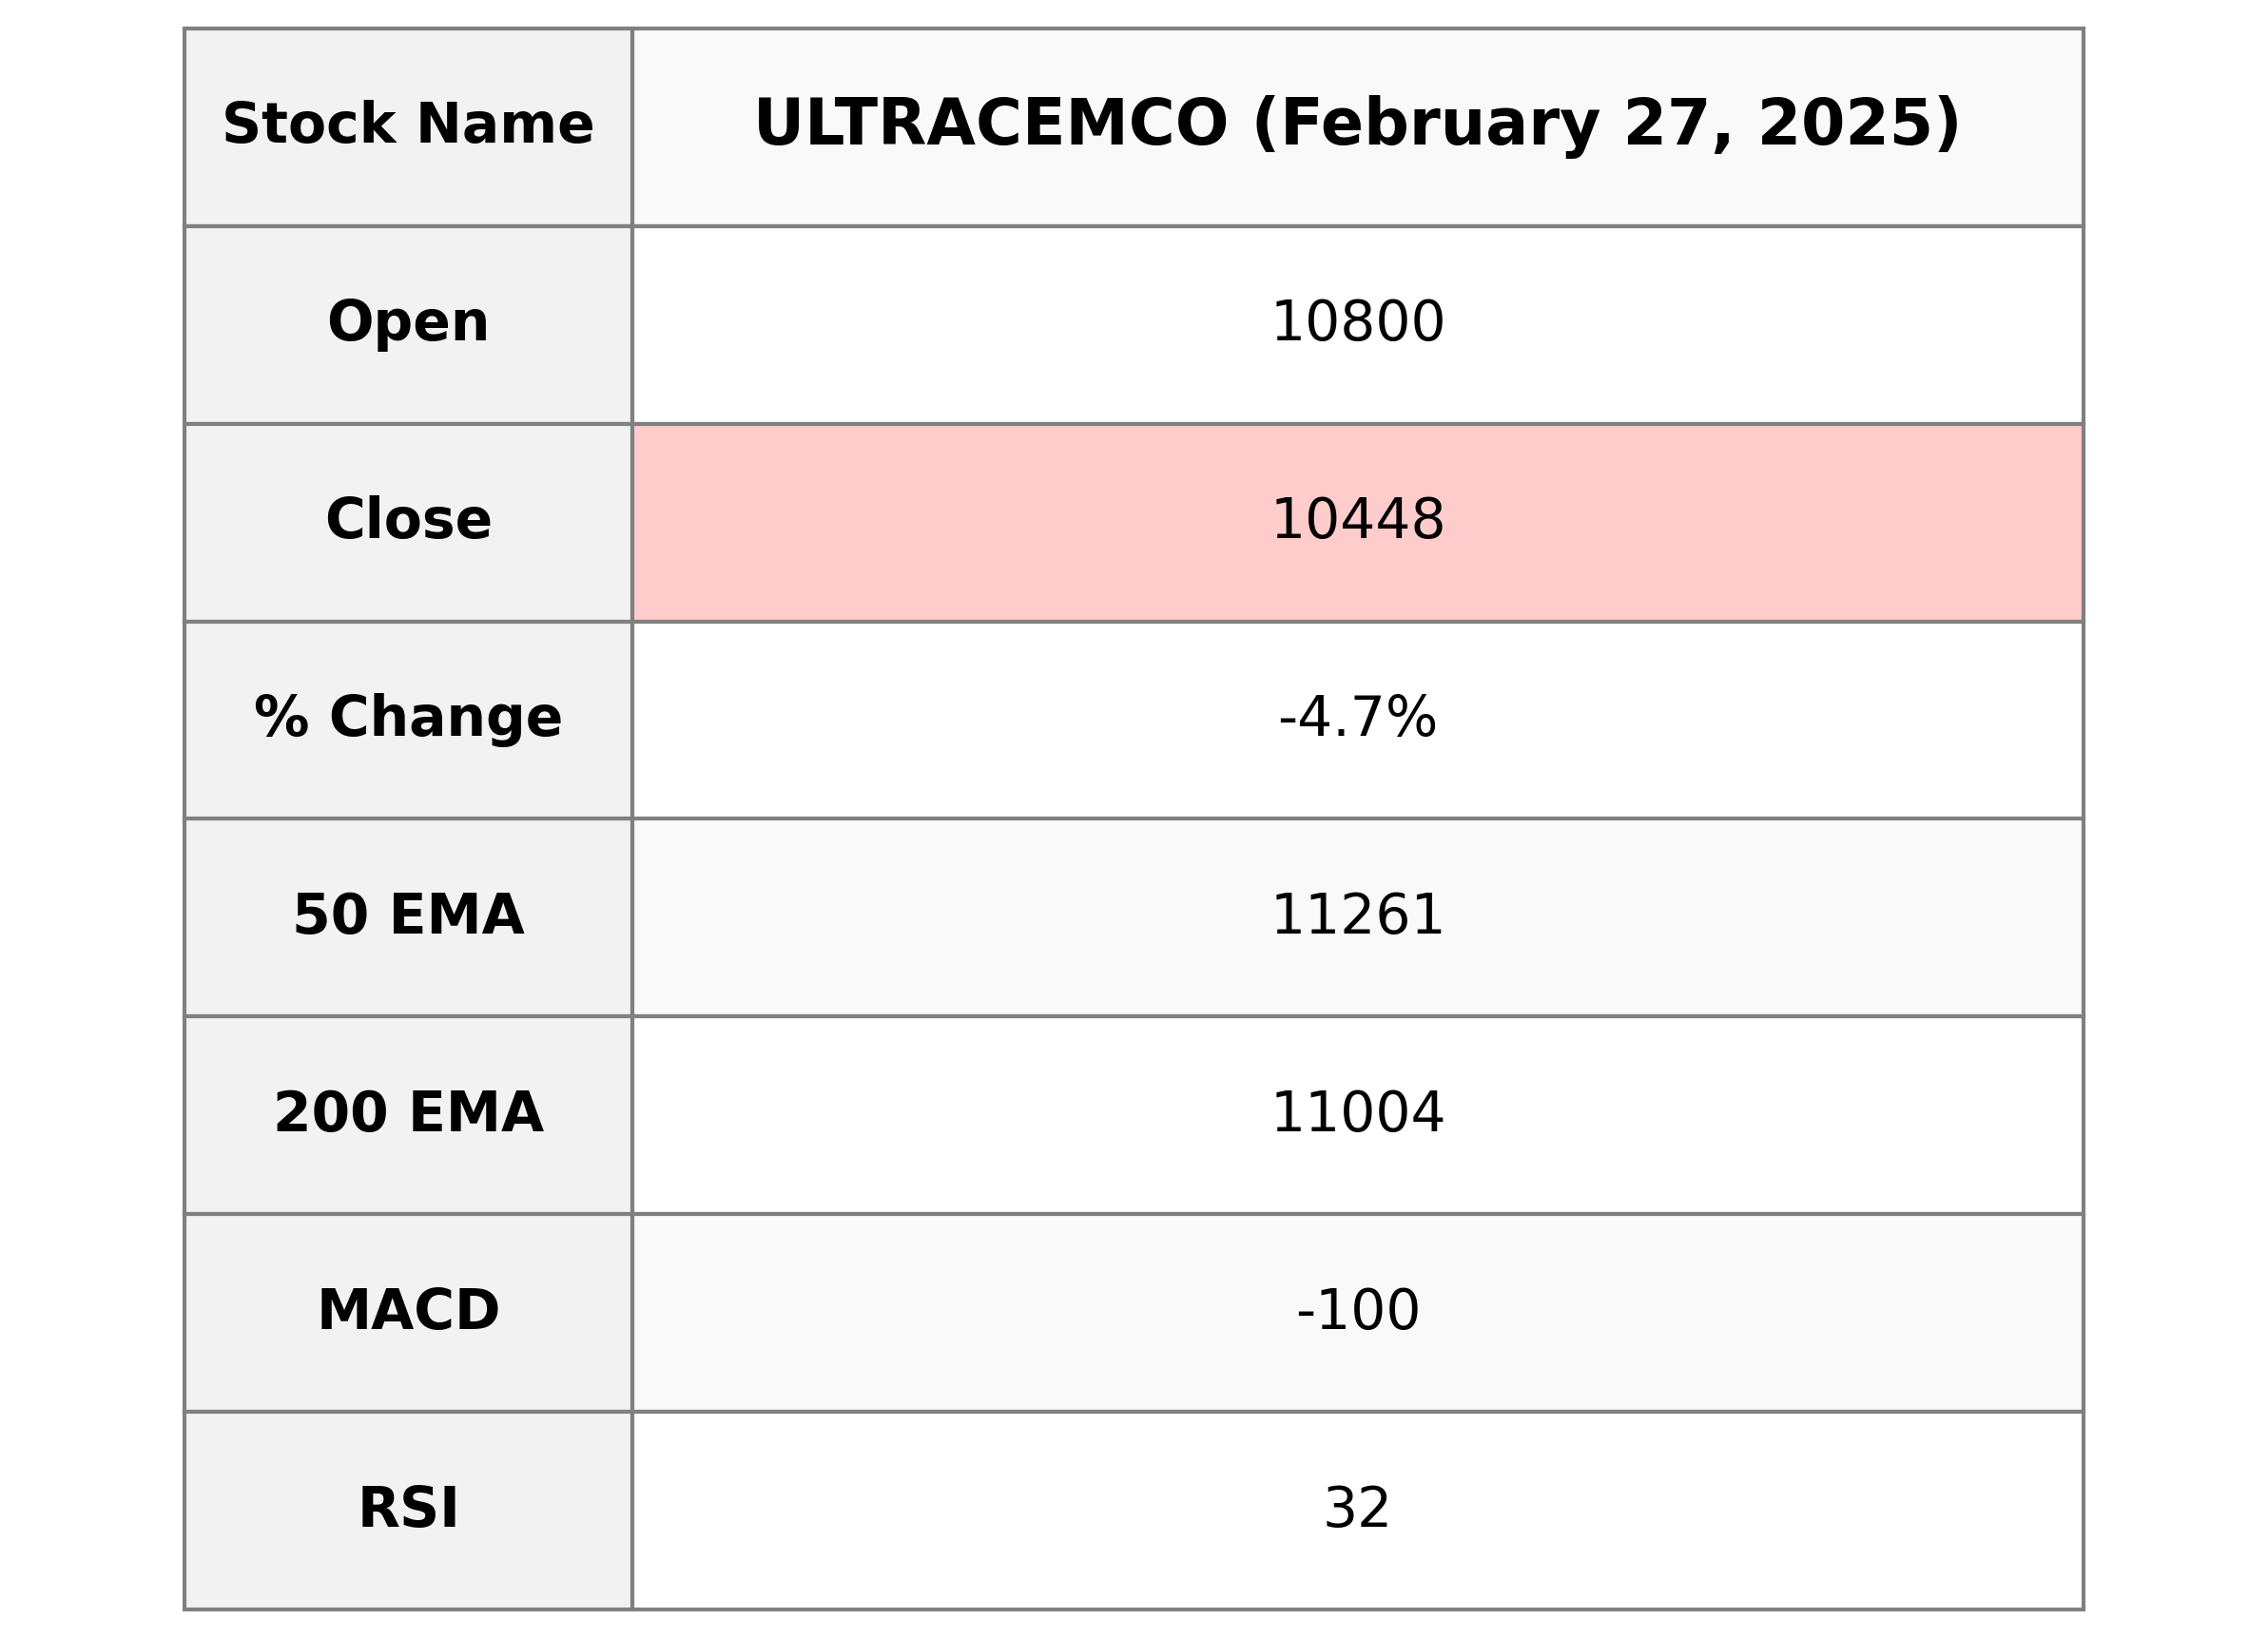
UltraTech Cement experienced a notable decline, with a closing price of 10,447.65 INR, reflecting a decrease of 4.71% from its previous close. The stock's Relative Strength Index (RSI) is at 31.63, indicating it is nearing oversold territory. Despite the short-term setback, the company's substantial market capitalization and presence within the Basic Materials sector suggest potential resilience.
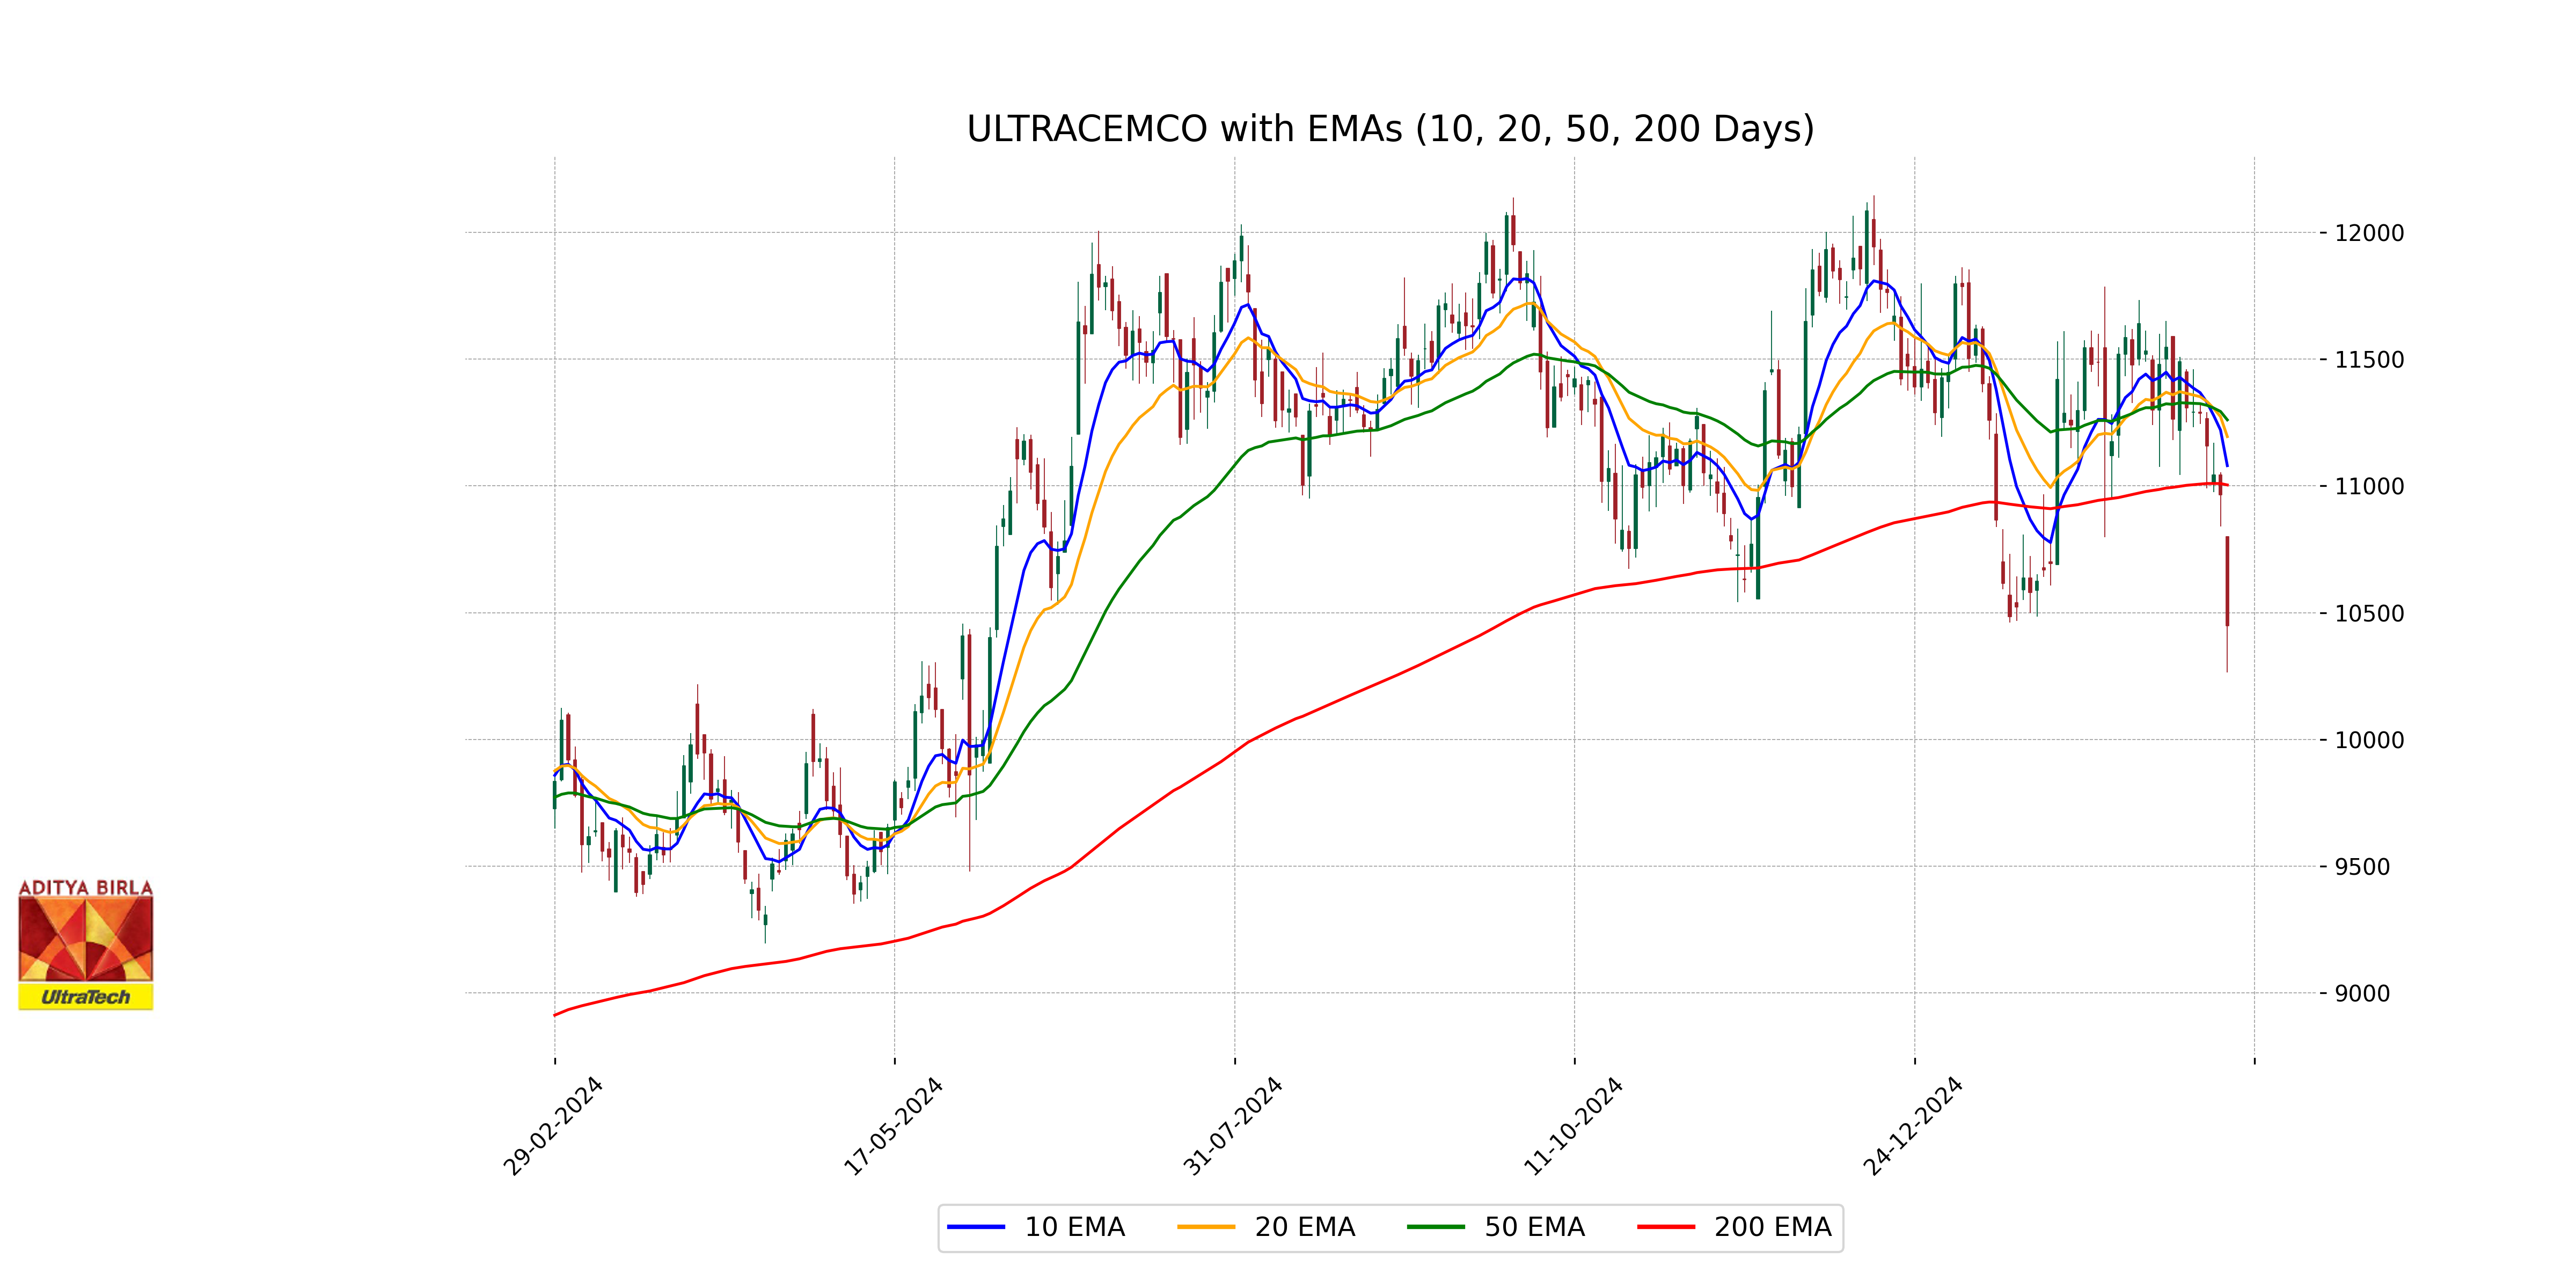
Relationship with Key Moving Averages
### Relationship with Key Moving Averages for UltraTech Cement The stock price of UltraTech Cement, with a current closing price of 10447.65, is trading below its 50-day EMA (11260.57), 20-day EMA (11194.60), and 10-day EMA (11080.02), indicating a bearish trend in the short to medium term. It's also below the 200-day EMA (11003.94), suggesting overall bearish sentiment.
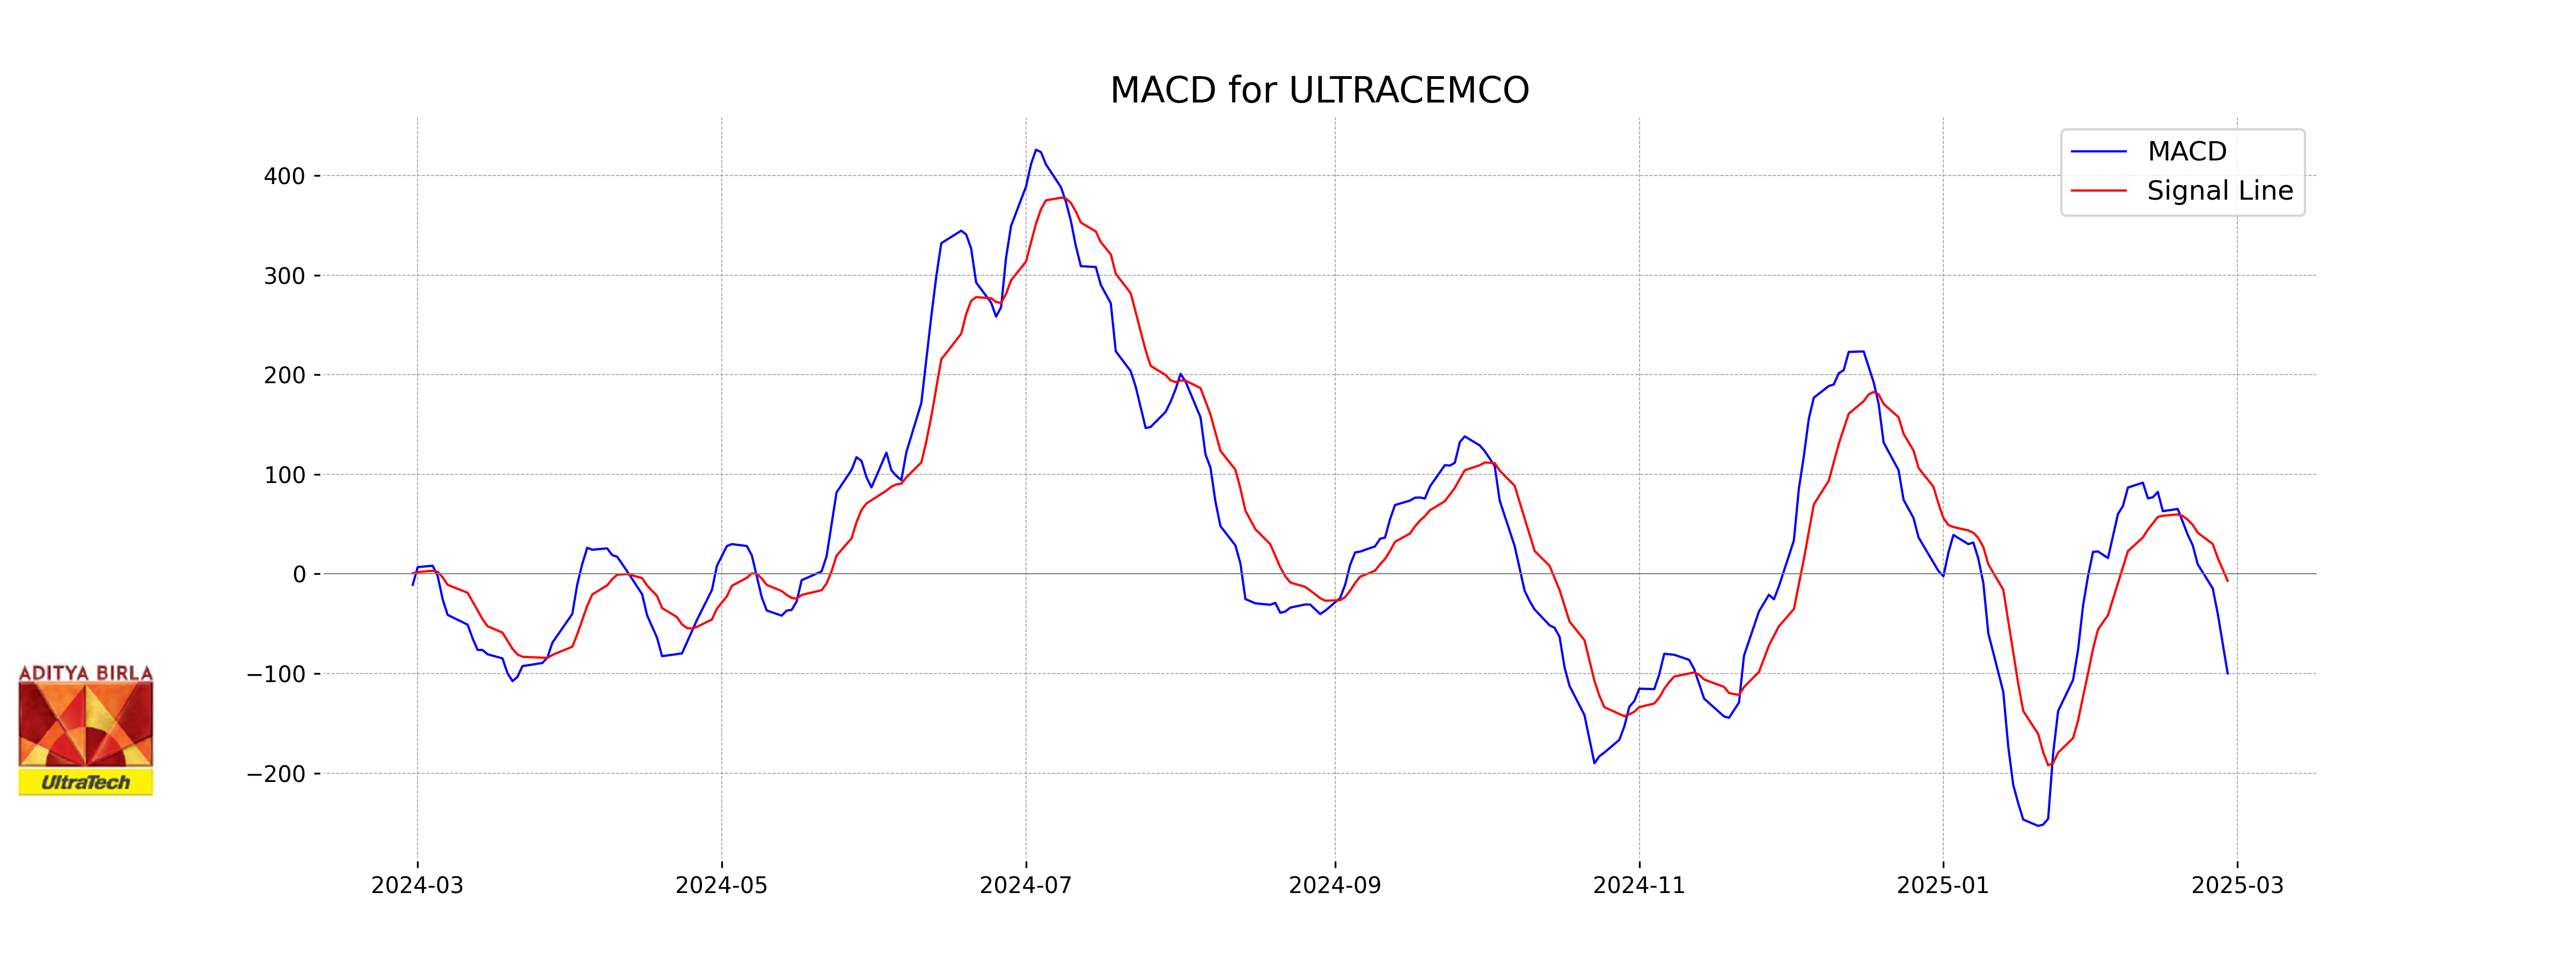
Moving Averages Trend (MACD)
UltraTech Cement's MACD value of -99.79, along with a MACD Signal of -6.93, indicates a bearish trend as the MACD line is significantly below the signal line. This suggests that the stock may continue in a downward momentum until there is a crossing or convergence of these lines.
RSI Analysis
UltraTech Cement's current Relative Strength Index (RSI) is 31.63, indicating it is nearing an oversold territory. An RSI below 30 typically suggests that a stock is oversold, which might hint at a potential buying opportunity, although investors should consider other factors as well.