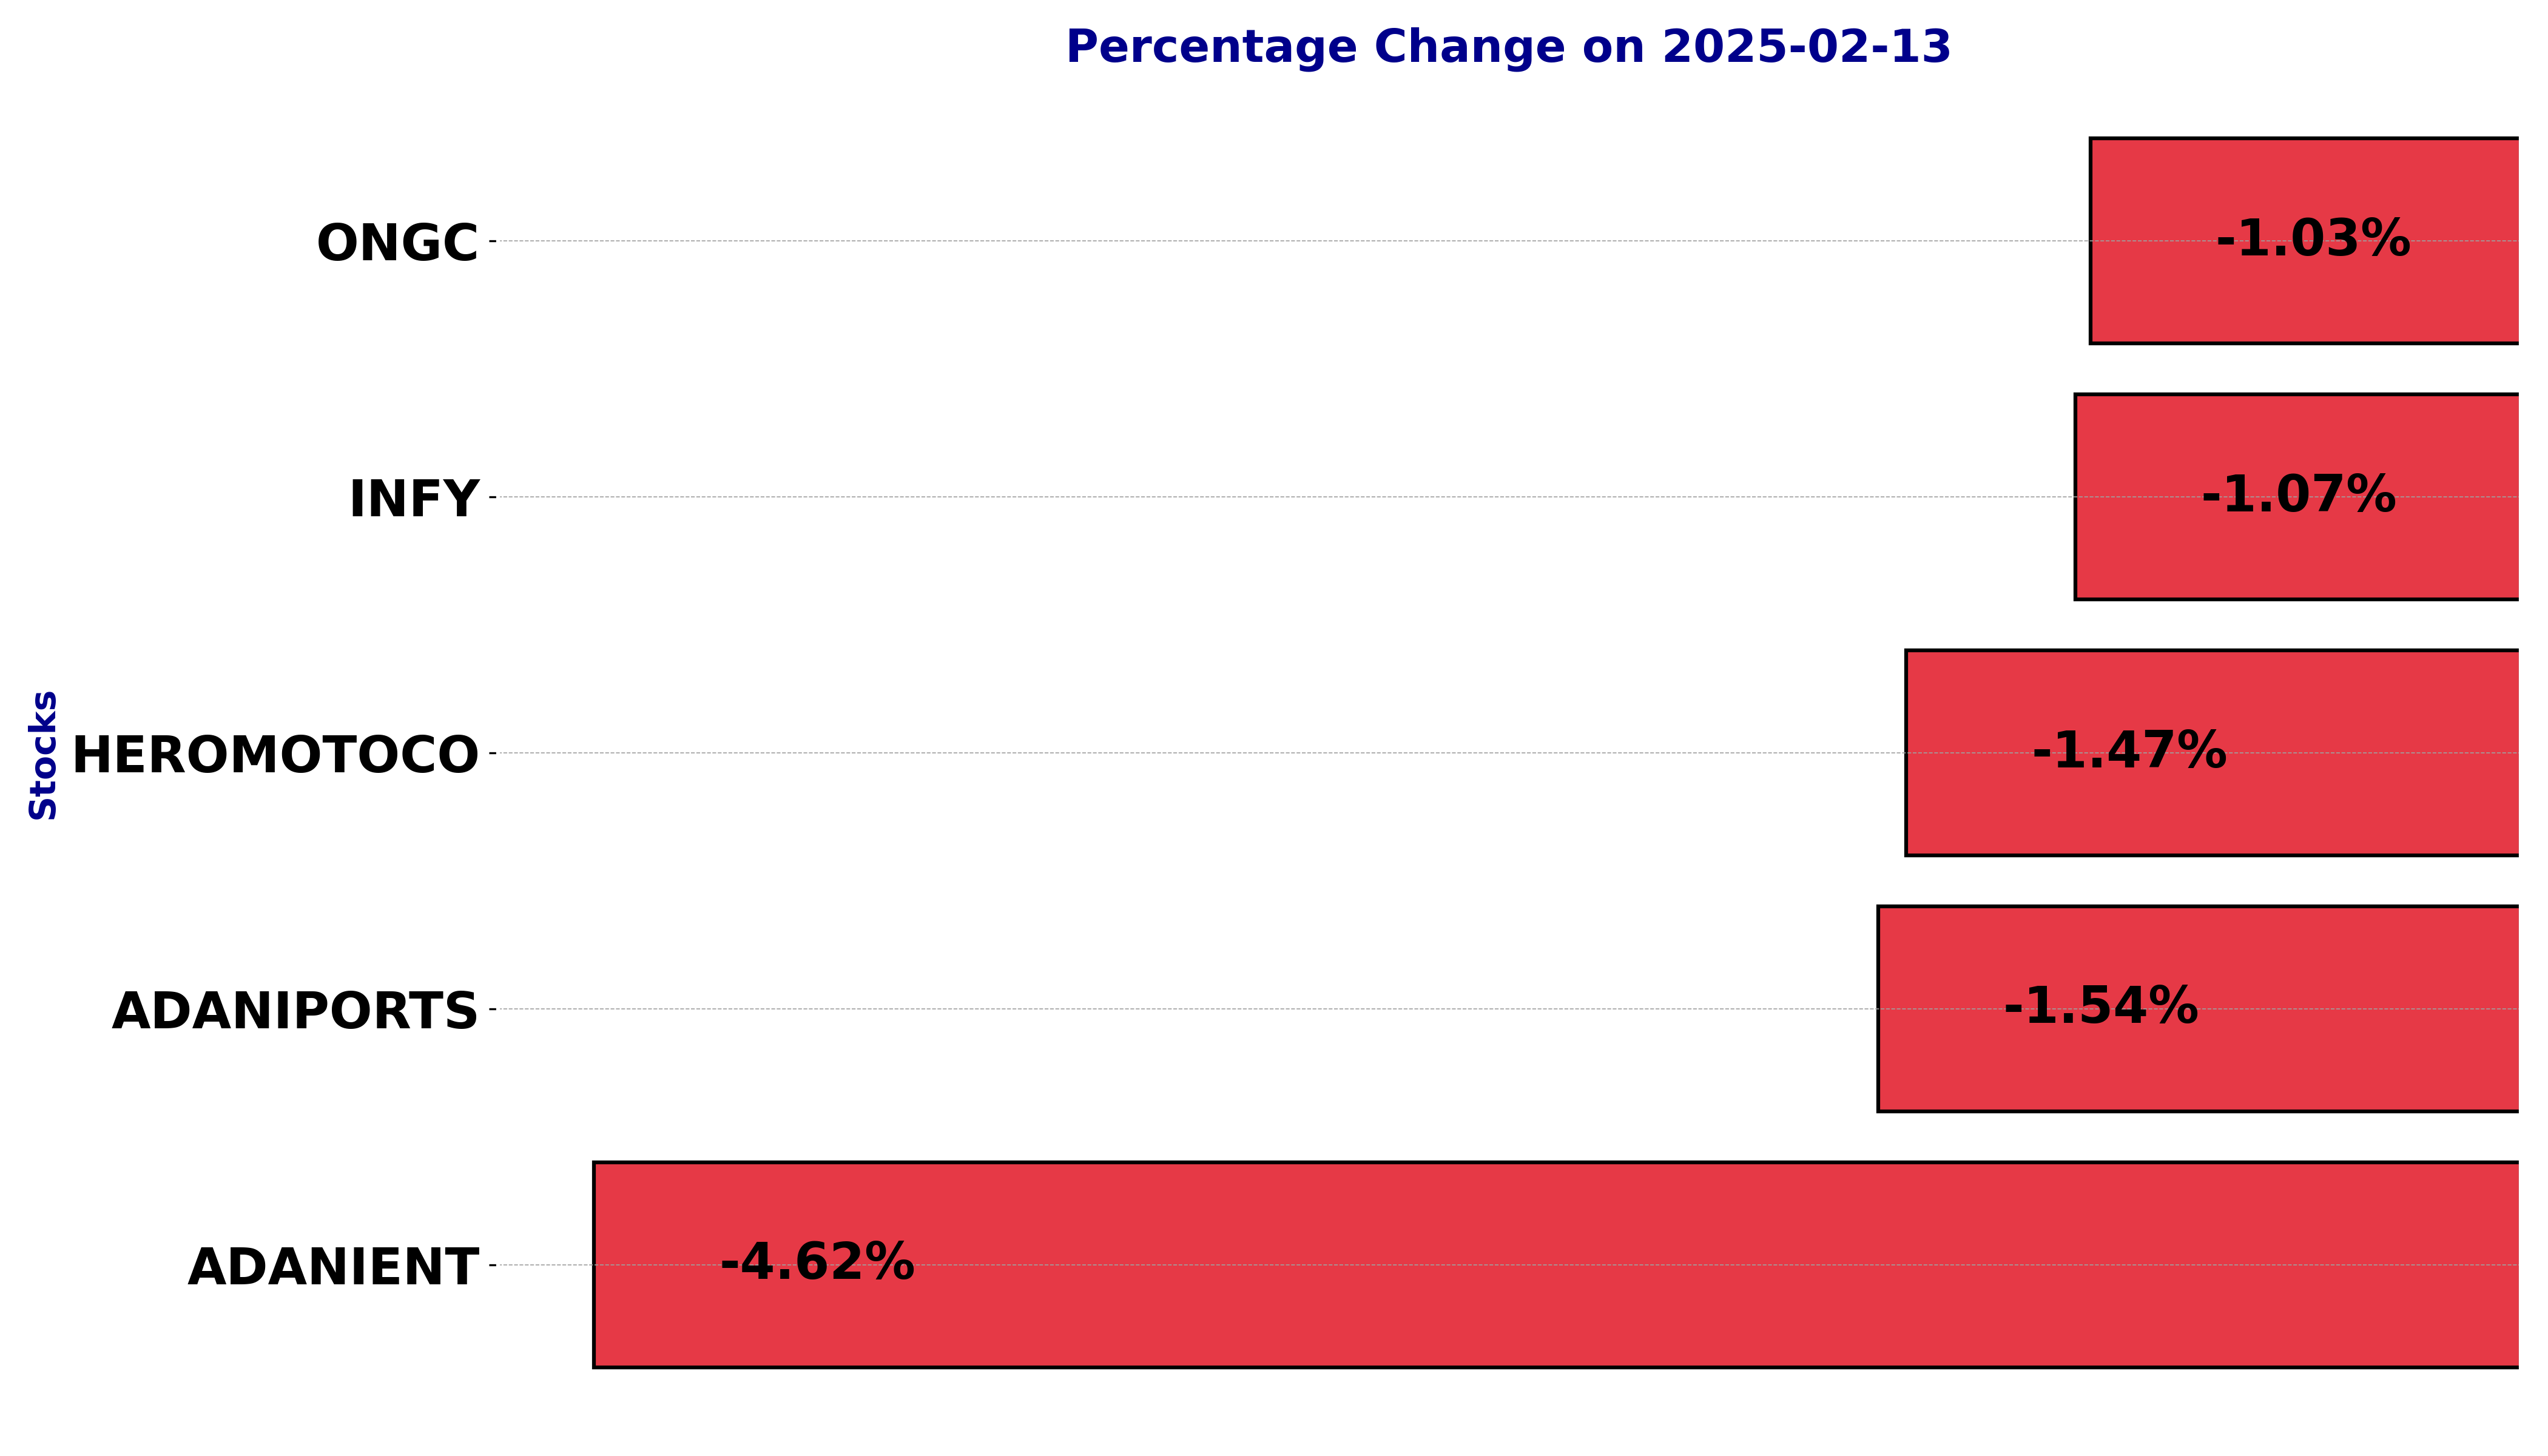
NSE Nifty 50 Top losers: What are the 5 Biggest Stock losers Today February 13, 2025
In this article, we will explore the technical indicators of some of the low-performing stocks on the Indian stock market, including ADANIENT, ADANIPORTS, HEROMOTOCO, INFY, and ONGC.
By looking at these stocks through the lens of key technical factors, we aim to better understand their price movements, trends, and potential future performance.
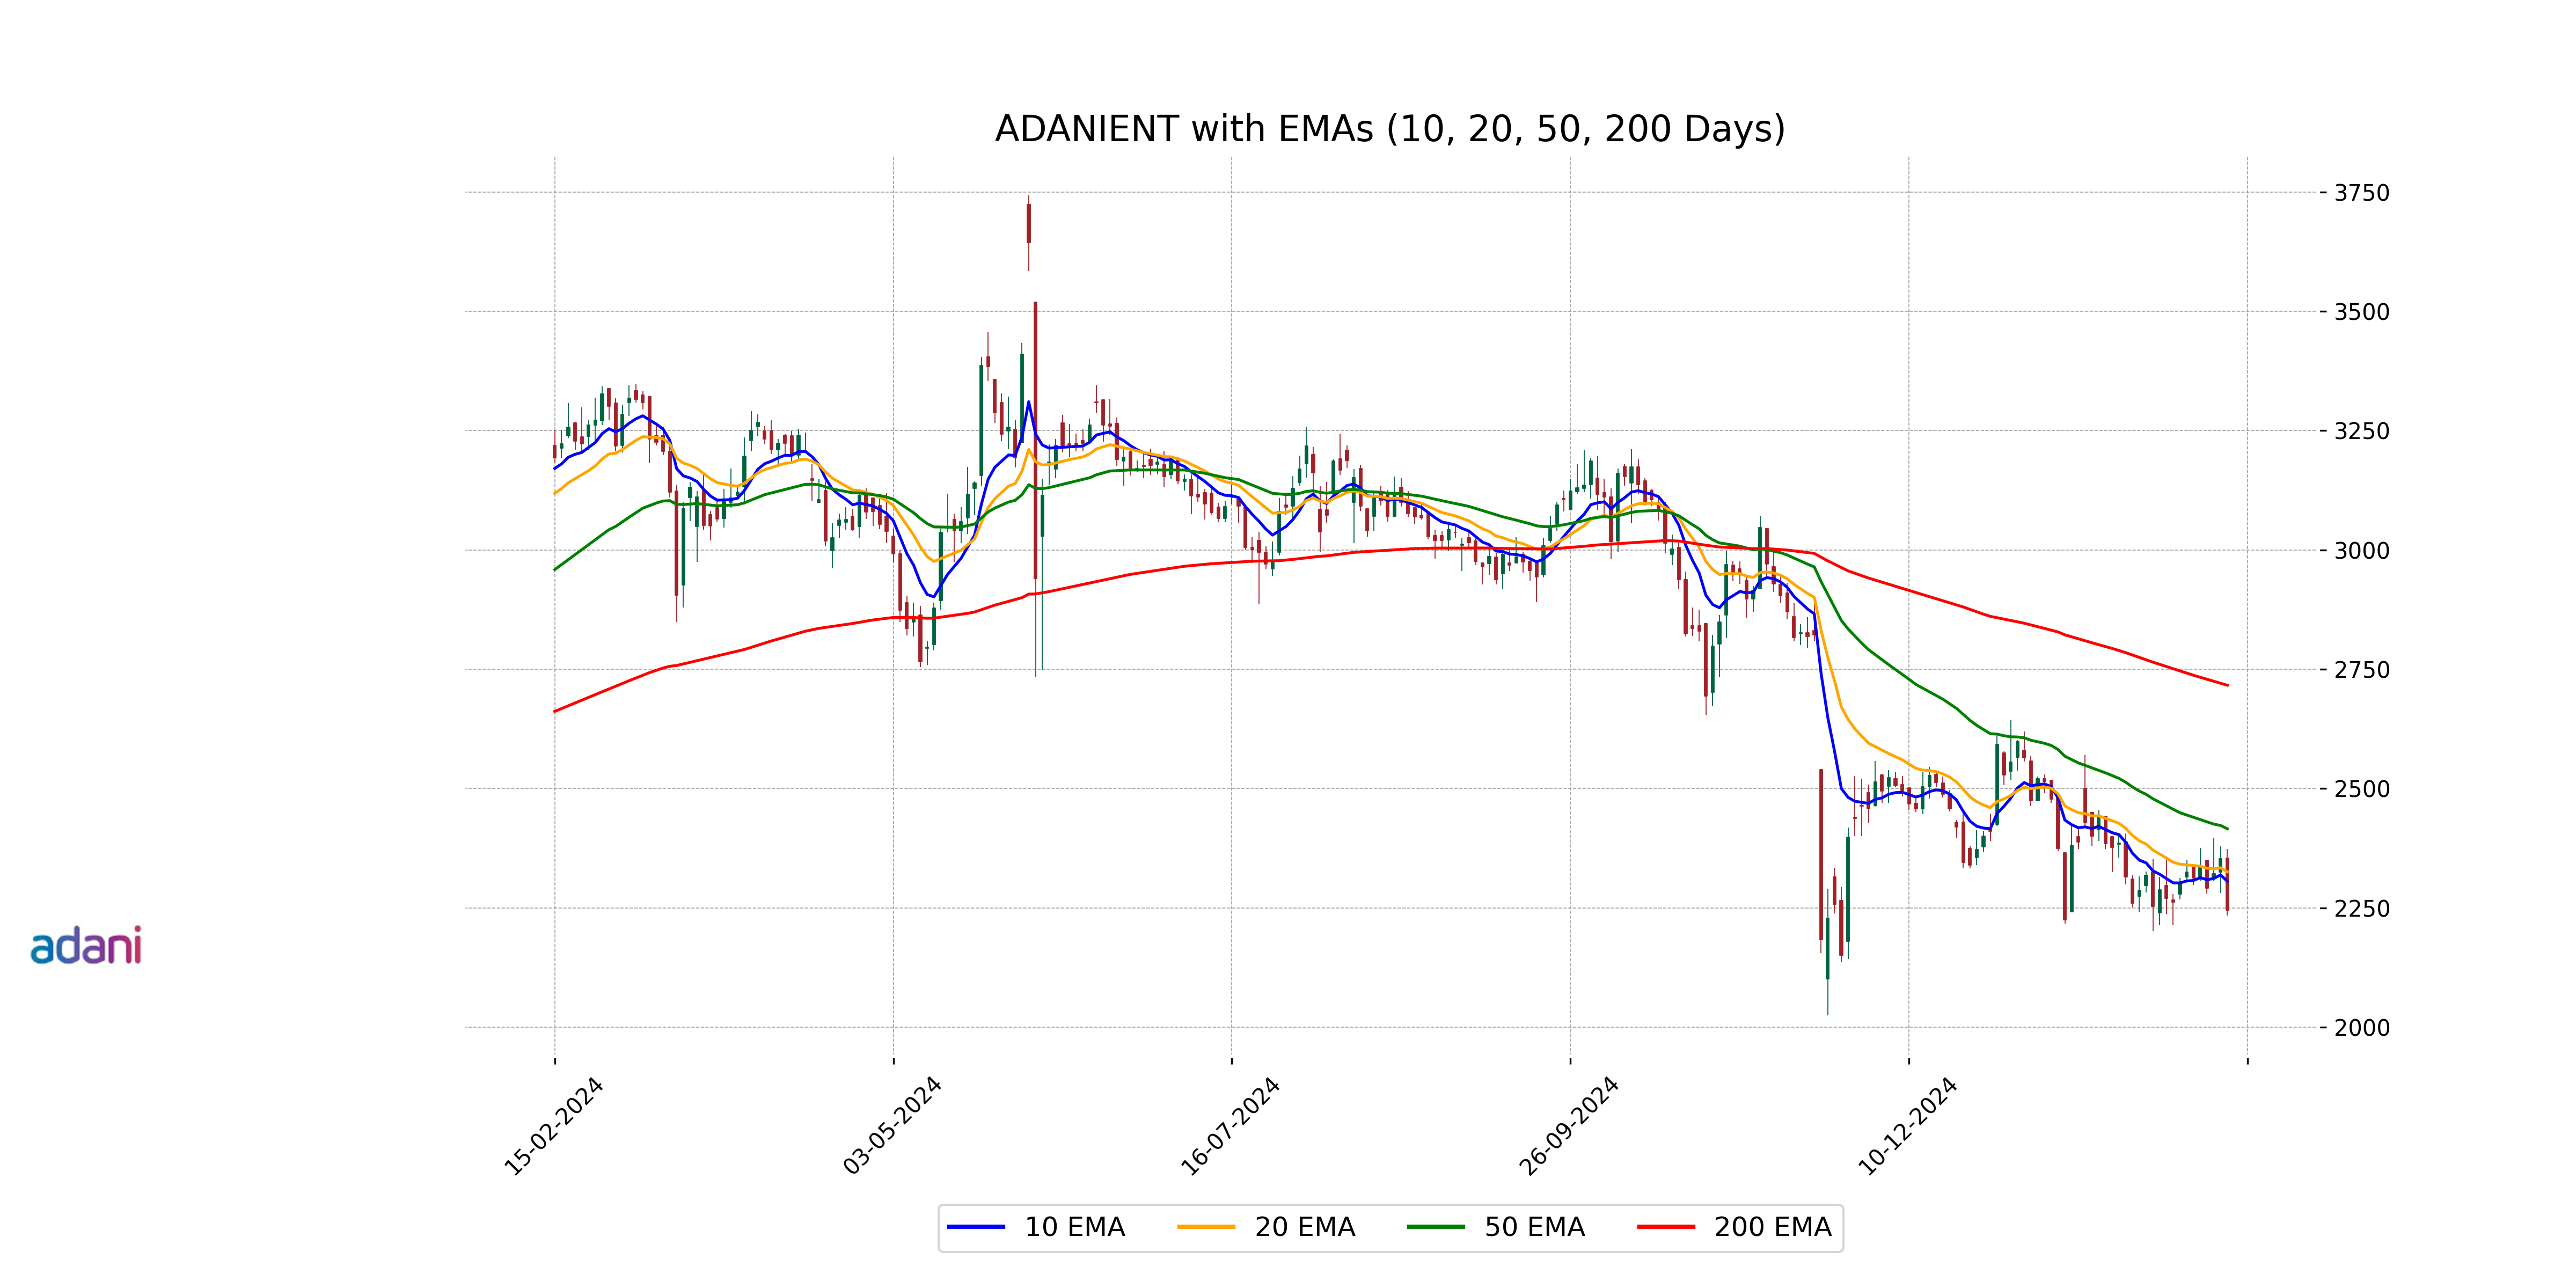
Analysis for Adani Enterprises - February 13, 2025
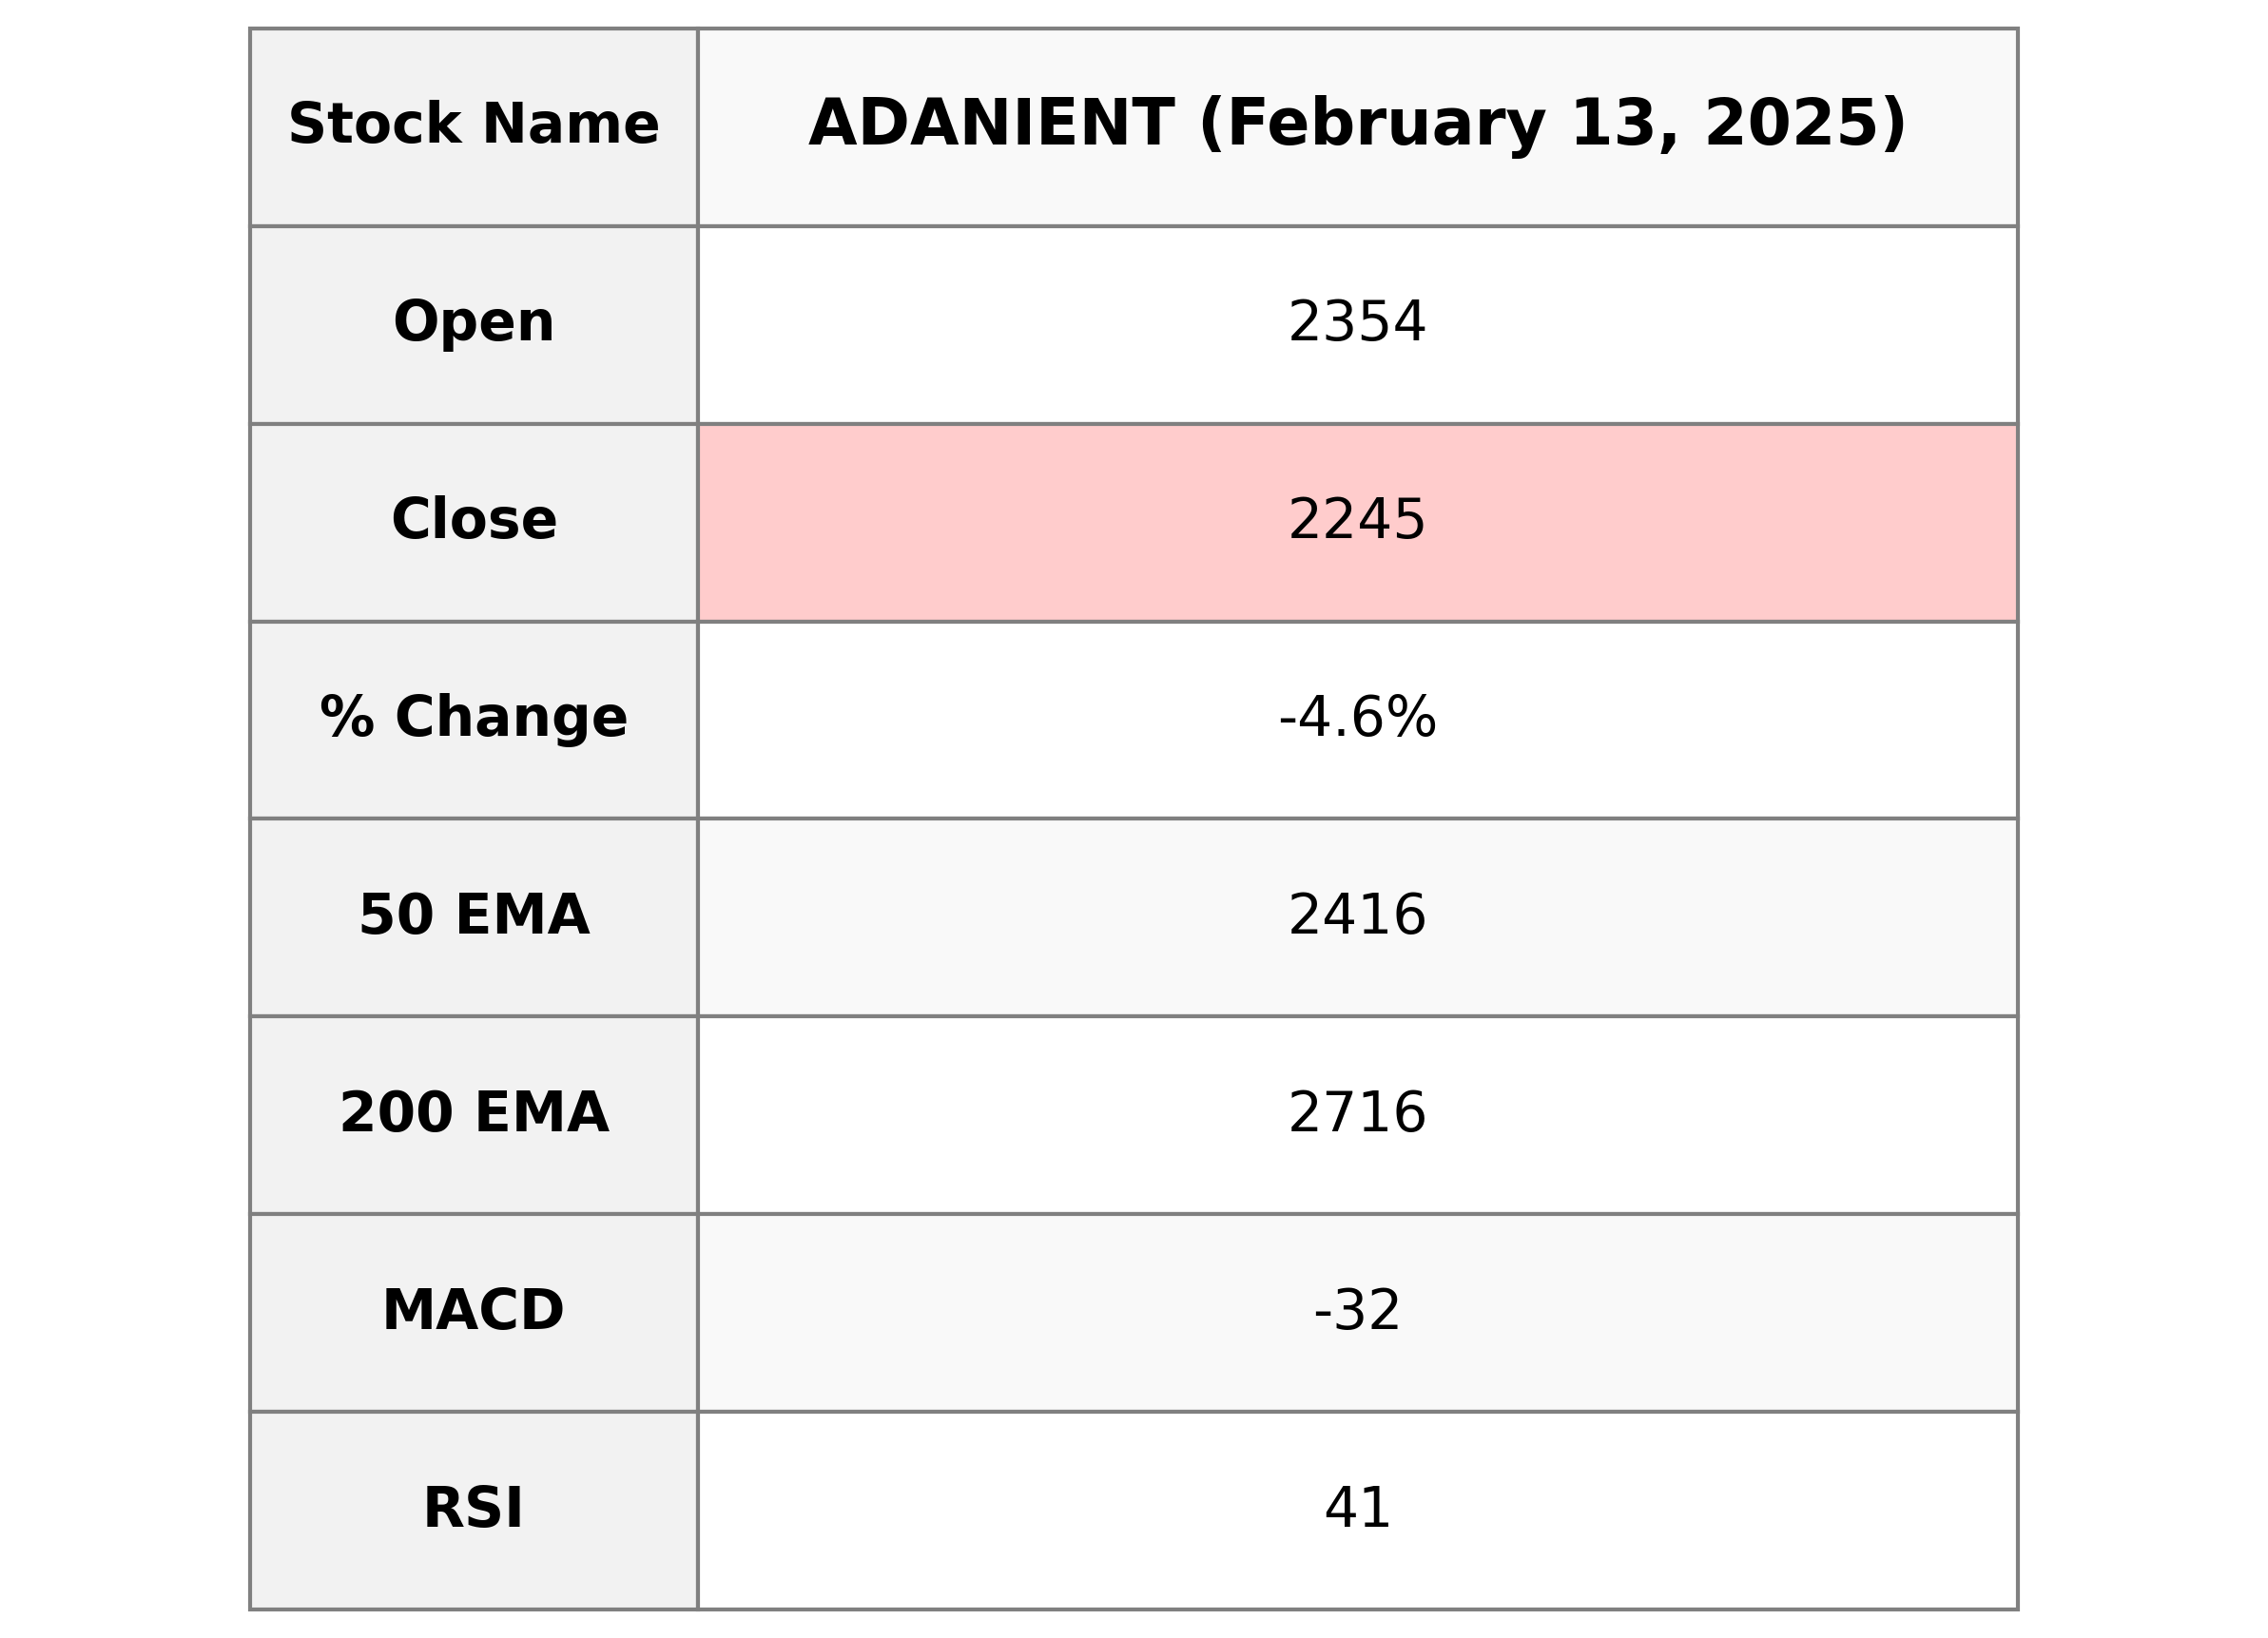
**Adani Enterprises** experienced a decline, with its closing price at 2244.70, reflecting a drop of 4.62% from the previous close of 2353.45. The technical indicators suggest bearish signals, with RSI at 41.24 indicating weaker momentum, and the MACD at -32.39 showing a negative trend below its signal line. Despite these short-term movements, the company's market cap remains substantial at approximately 2.59 trillion INR, as it operates within the thermal coal sector in India.
Relationship with Key Moving Averages
Adani Enterprises closed at 2244.70, which is below its 50 EMA of 2415.52 and the 200 EMA of 2716.30, indicating a bearish trend. The closing price is also below the 10 EMA of 2305.47 and the 20 EMA of 2325.36, supporting short-term downward momentum.
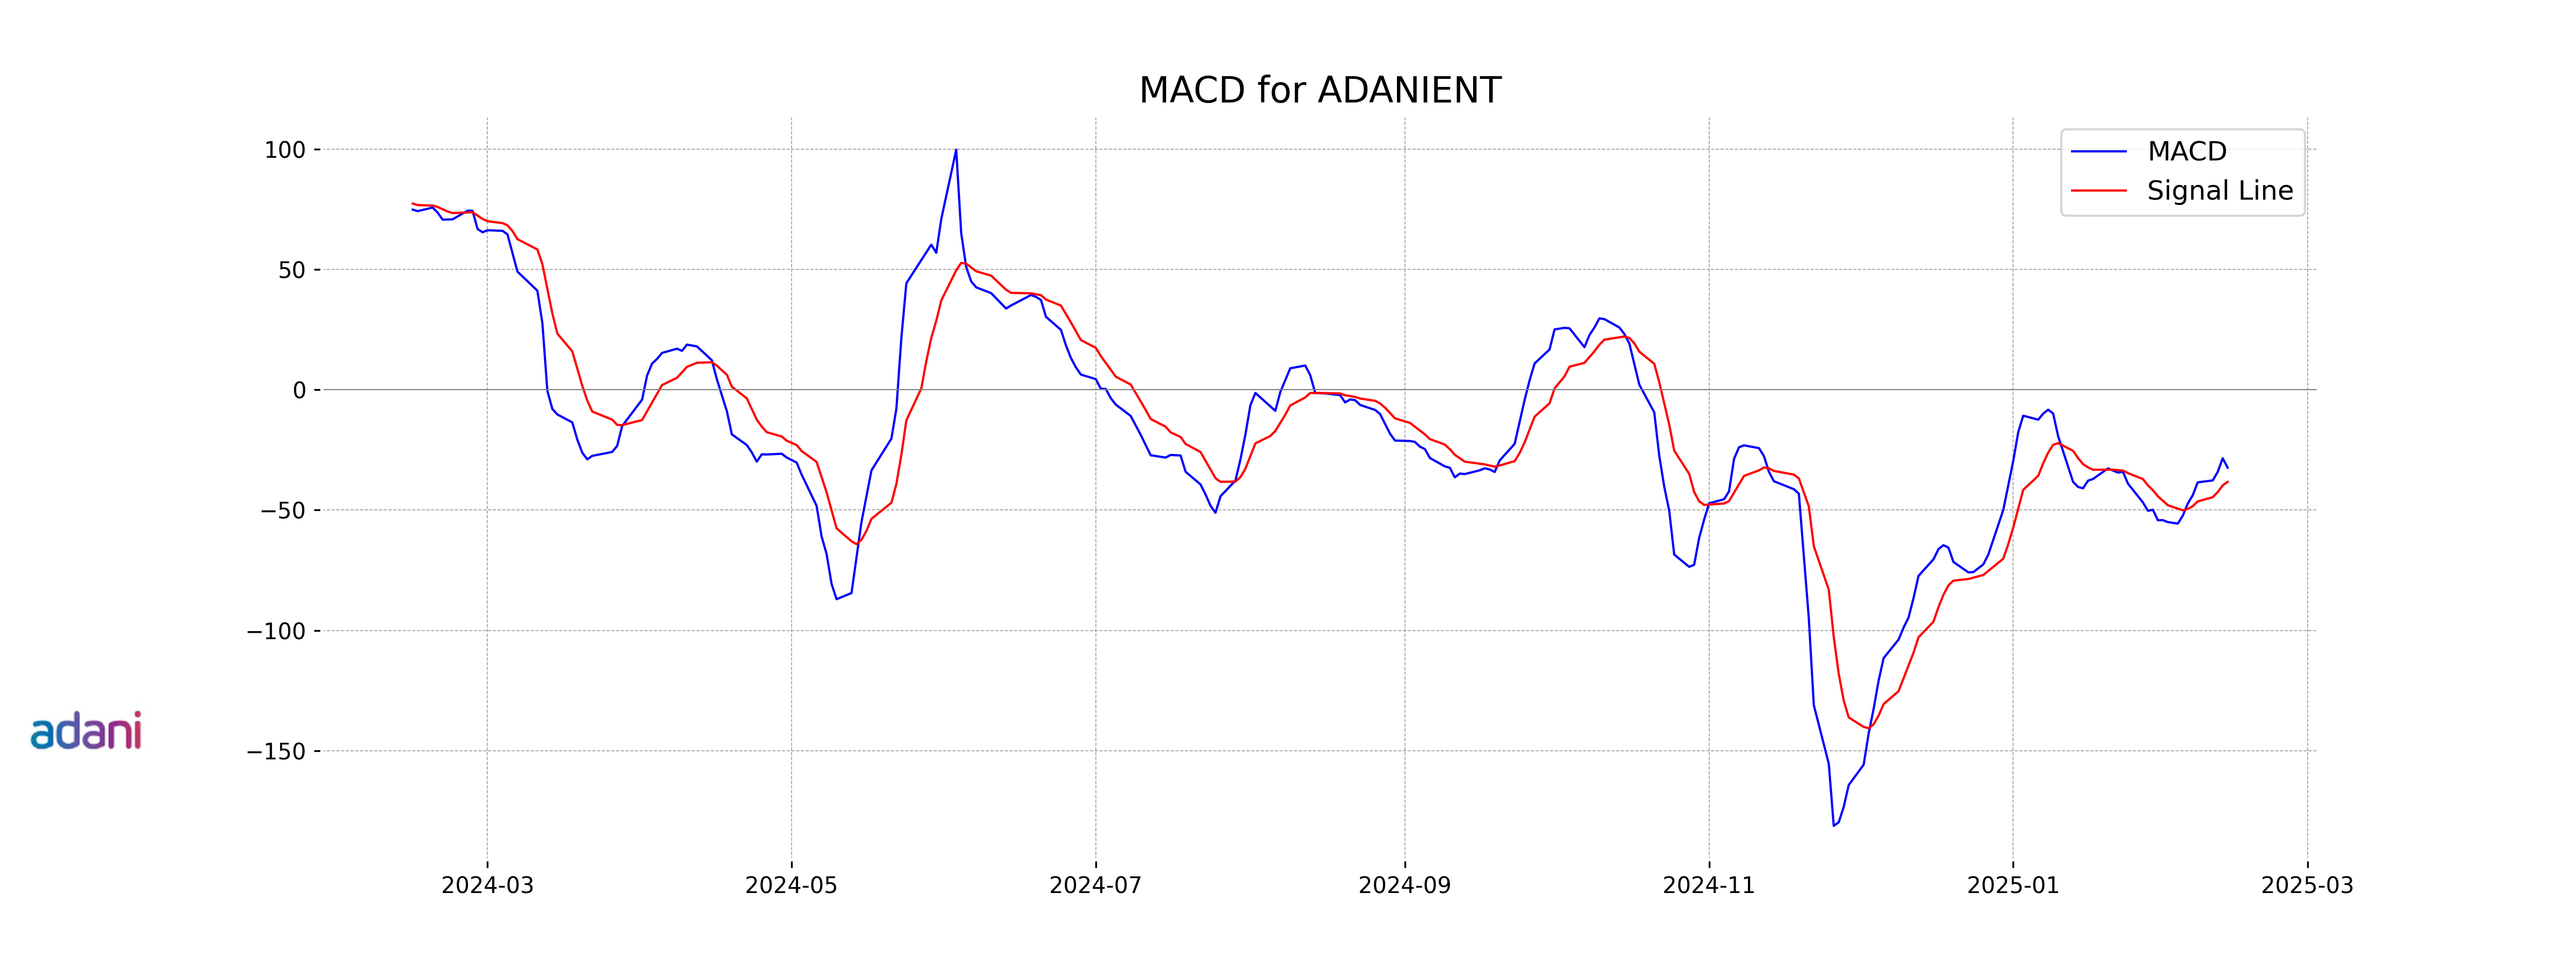
Moving Averages Trend (MACD)
Adani Enterprises is exhibiting a bearish trend with a negative MACD value of -32.39, indicating that the stock is currently experiencing downward momentum. The MACD is below the signal line, suggesting continued bearish sentiment in the short term.
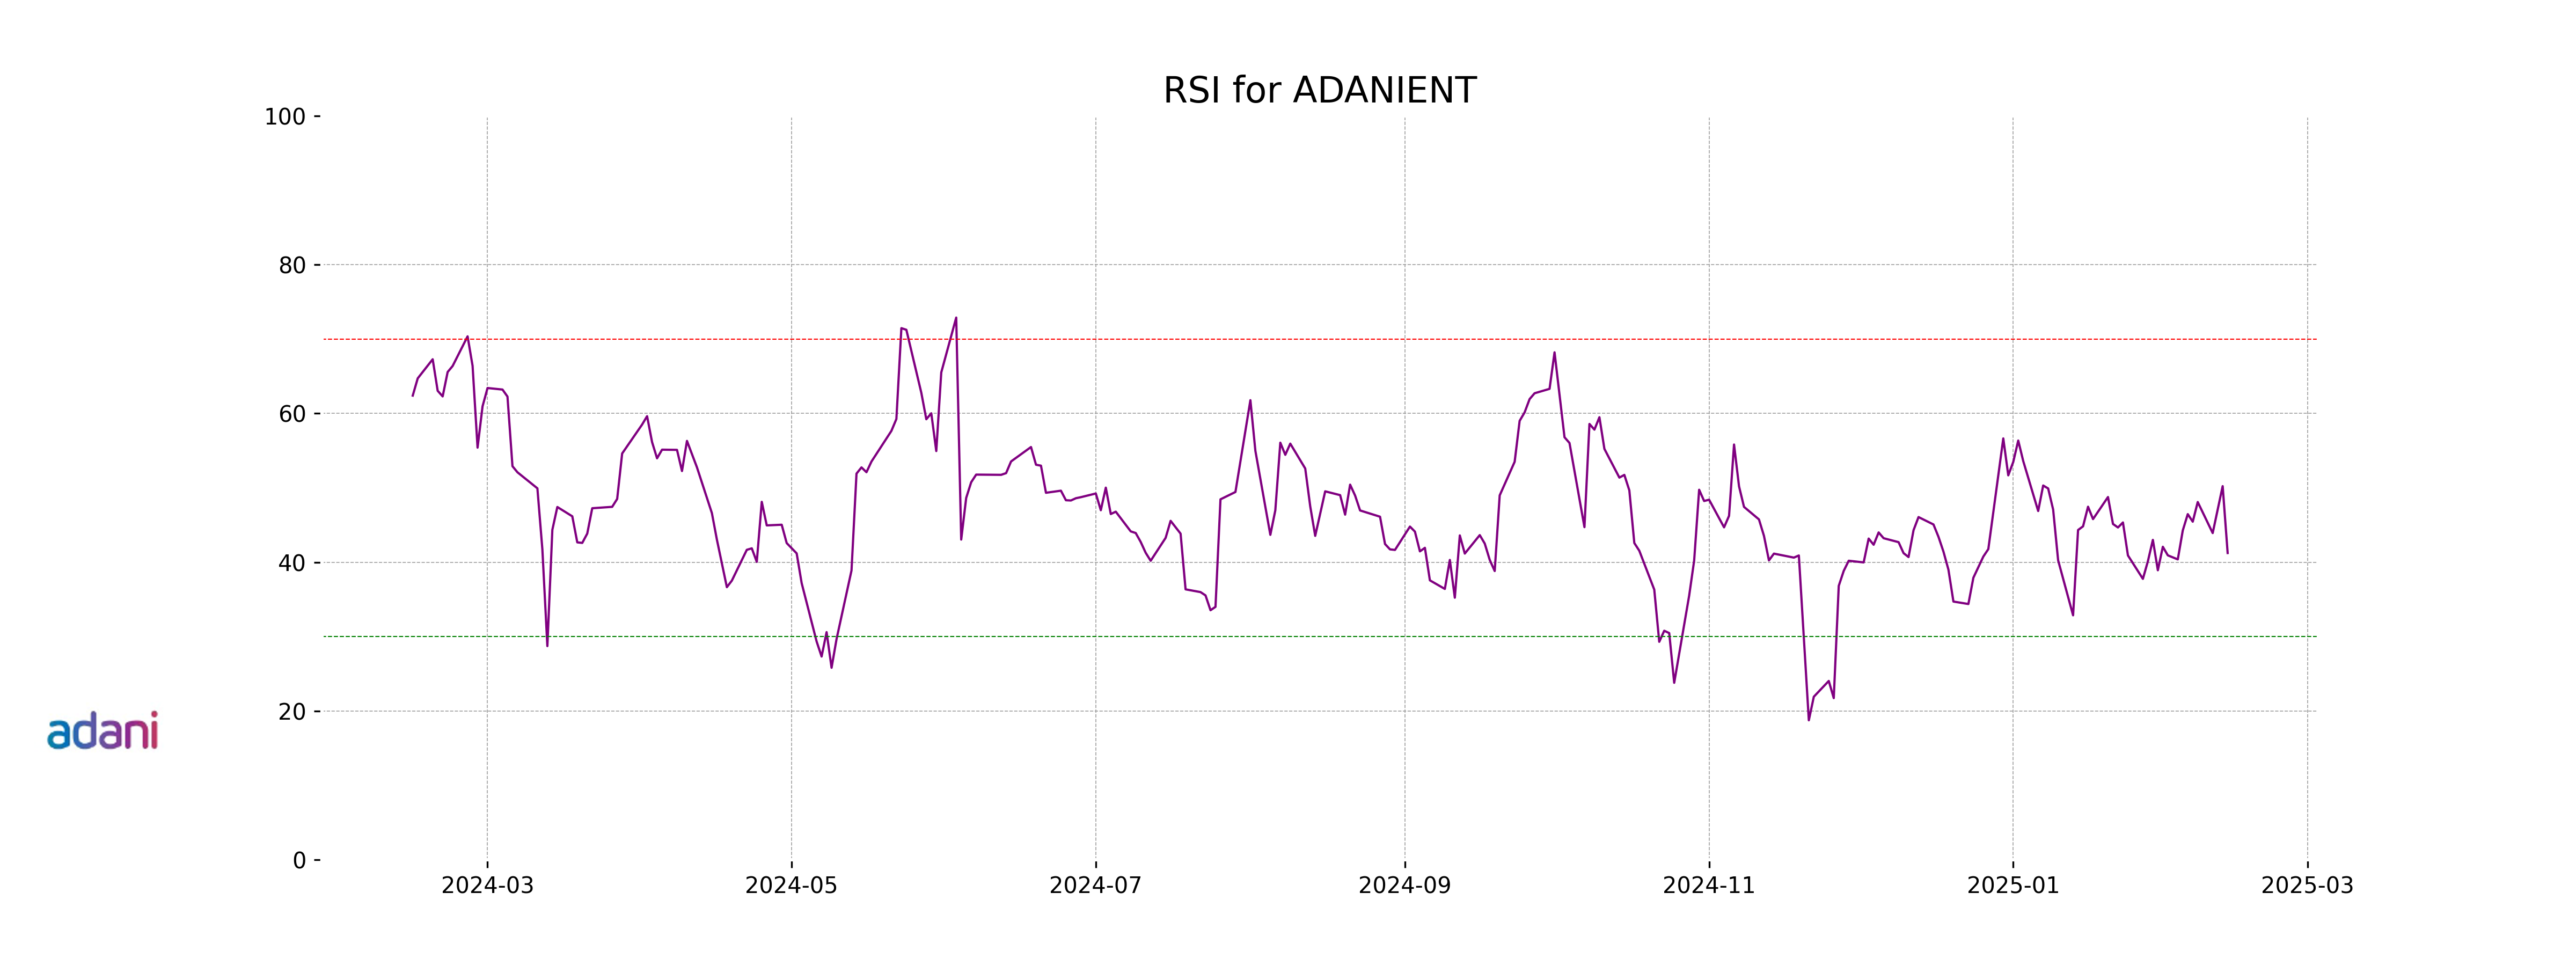
RSI Analysis
The RSI (Relative Strength Index) for Adani Enterprises is 41.24, indicating that the stock is in a moderately bearish territory. An RSI value below 50 generally suggests that the stock might be experiencing more selling pressure than buying pressure, but it hasn't reached oversold levels typically marked by RSI values below 30.
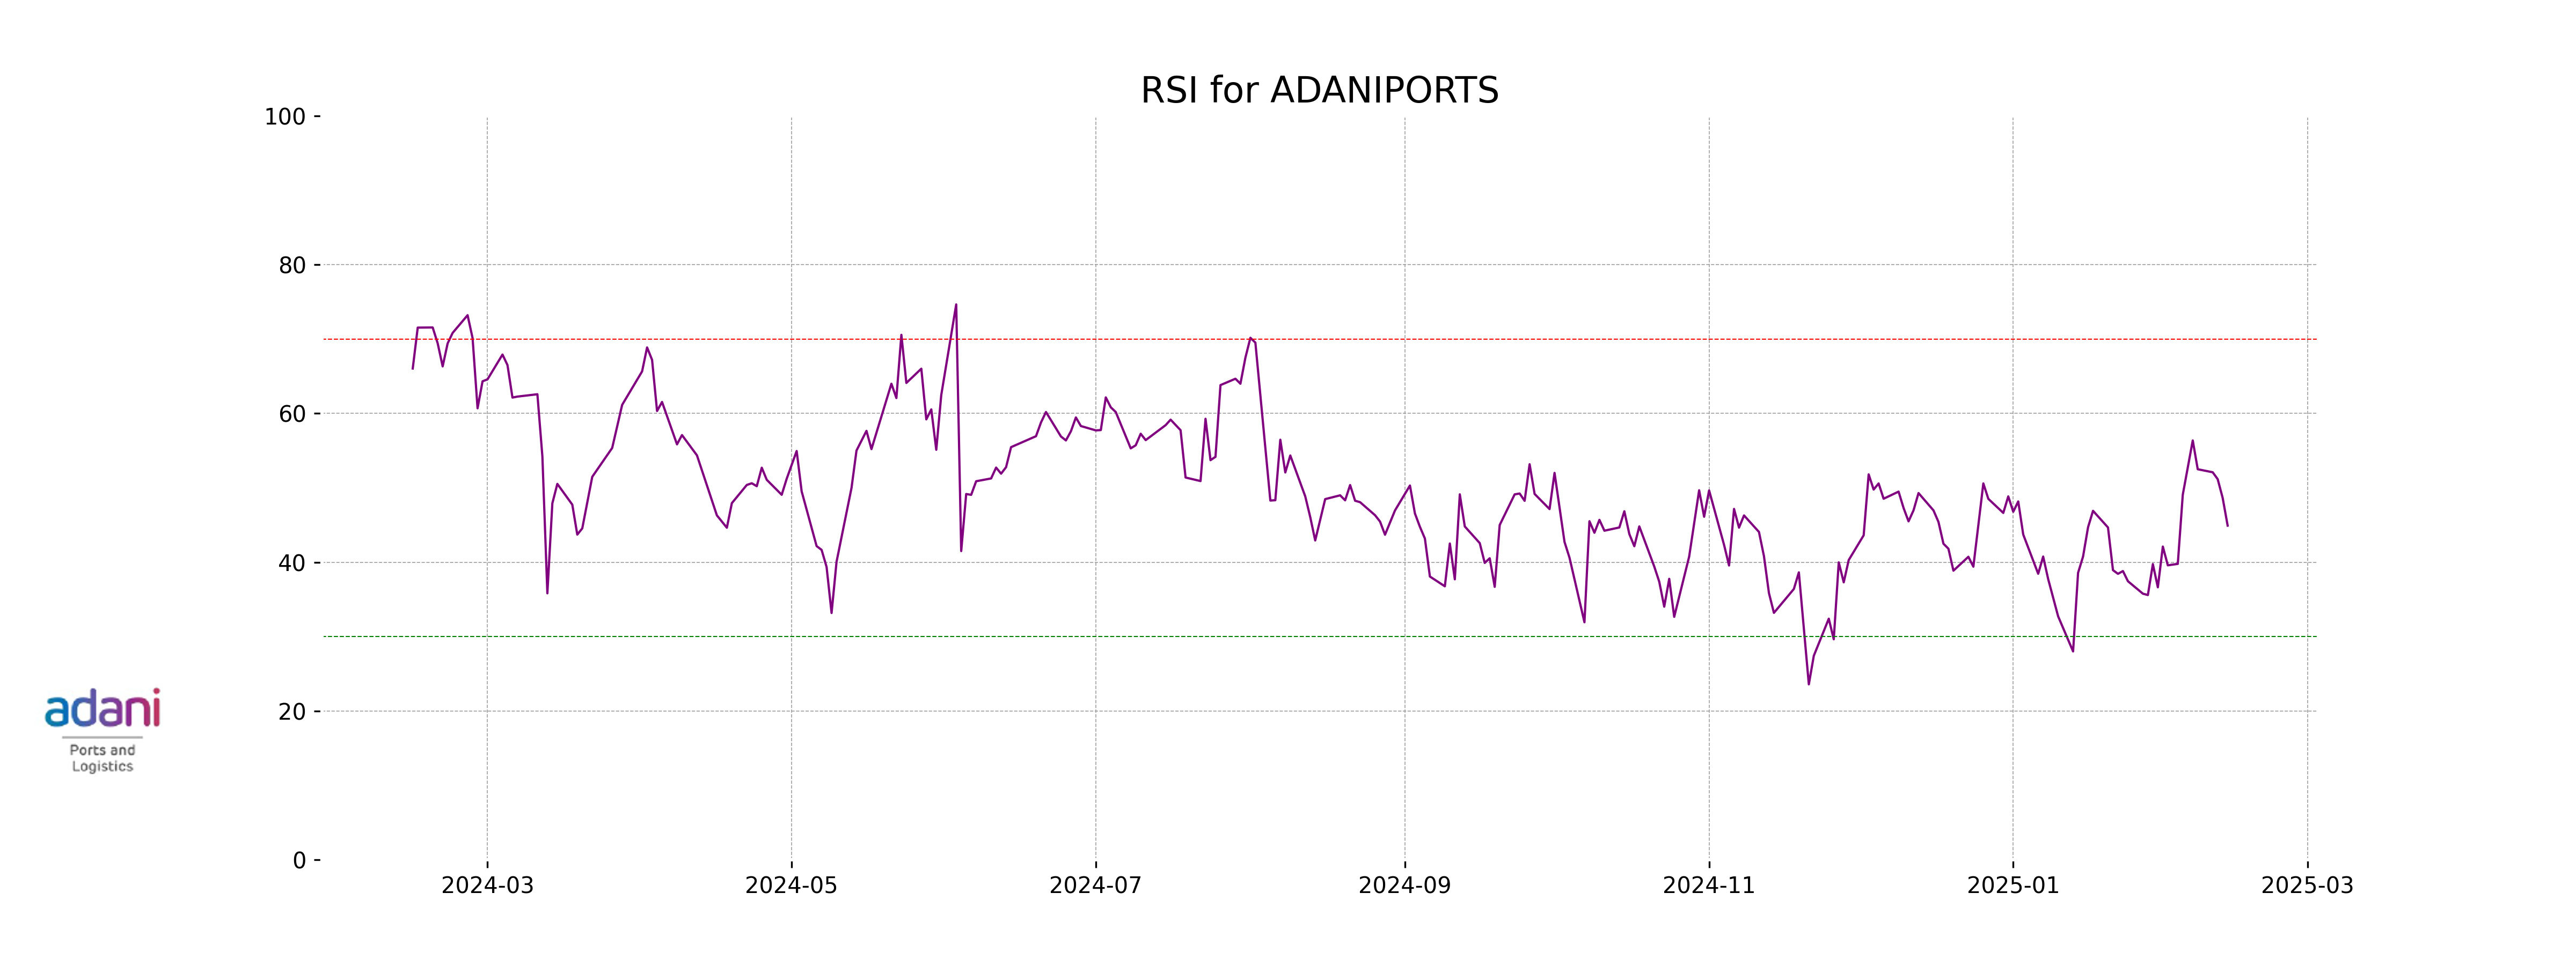
Analysis for Adani Ports - February 13, 2025
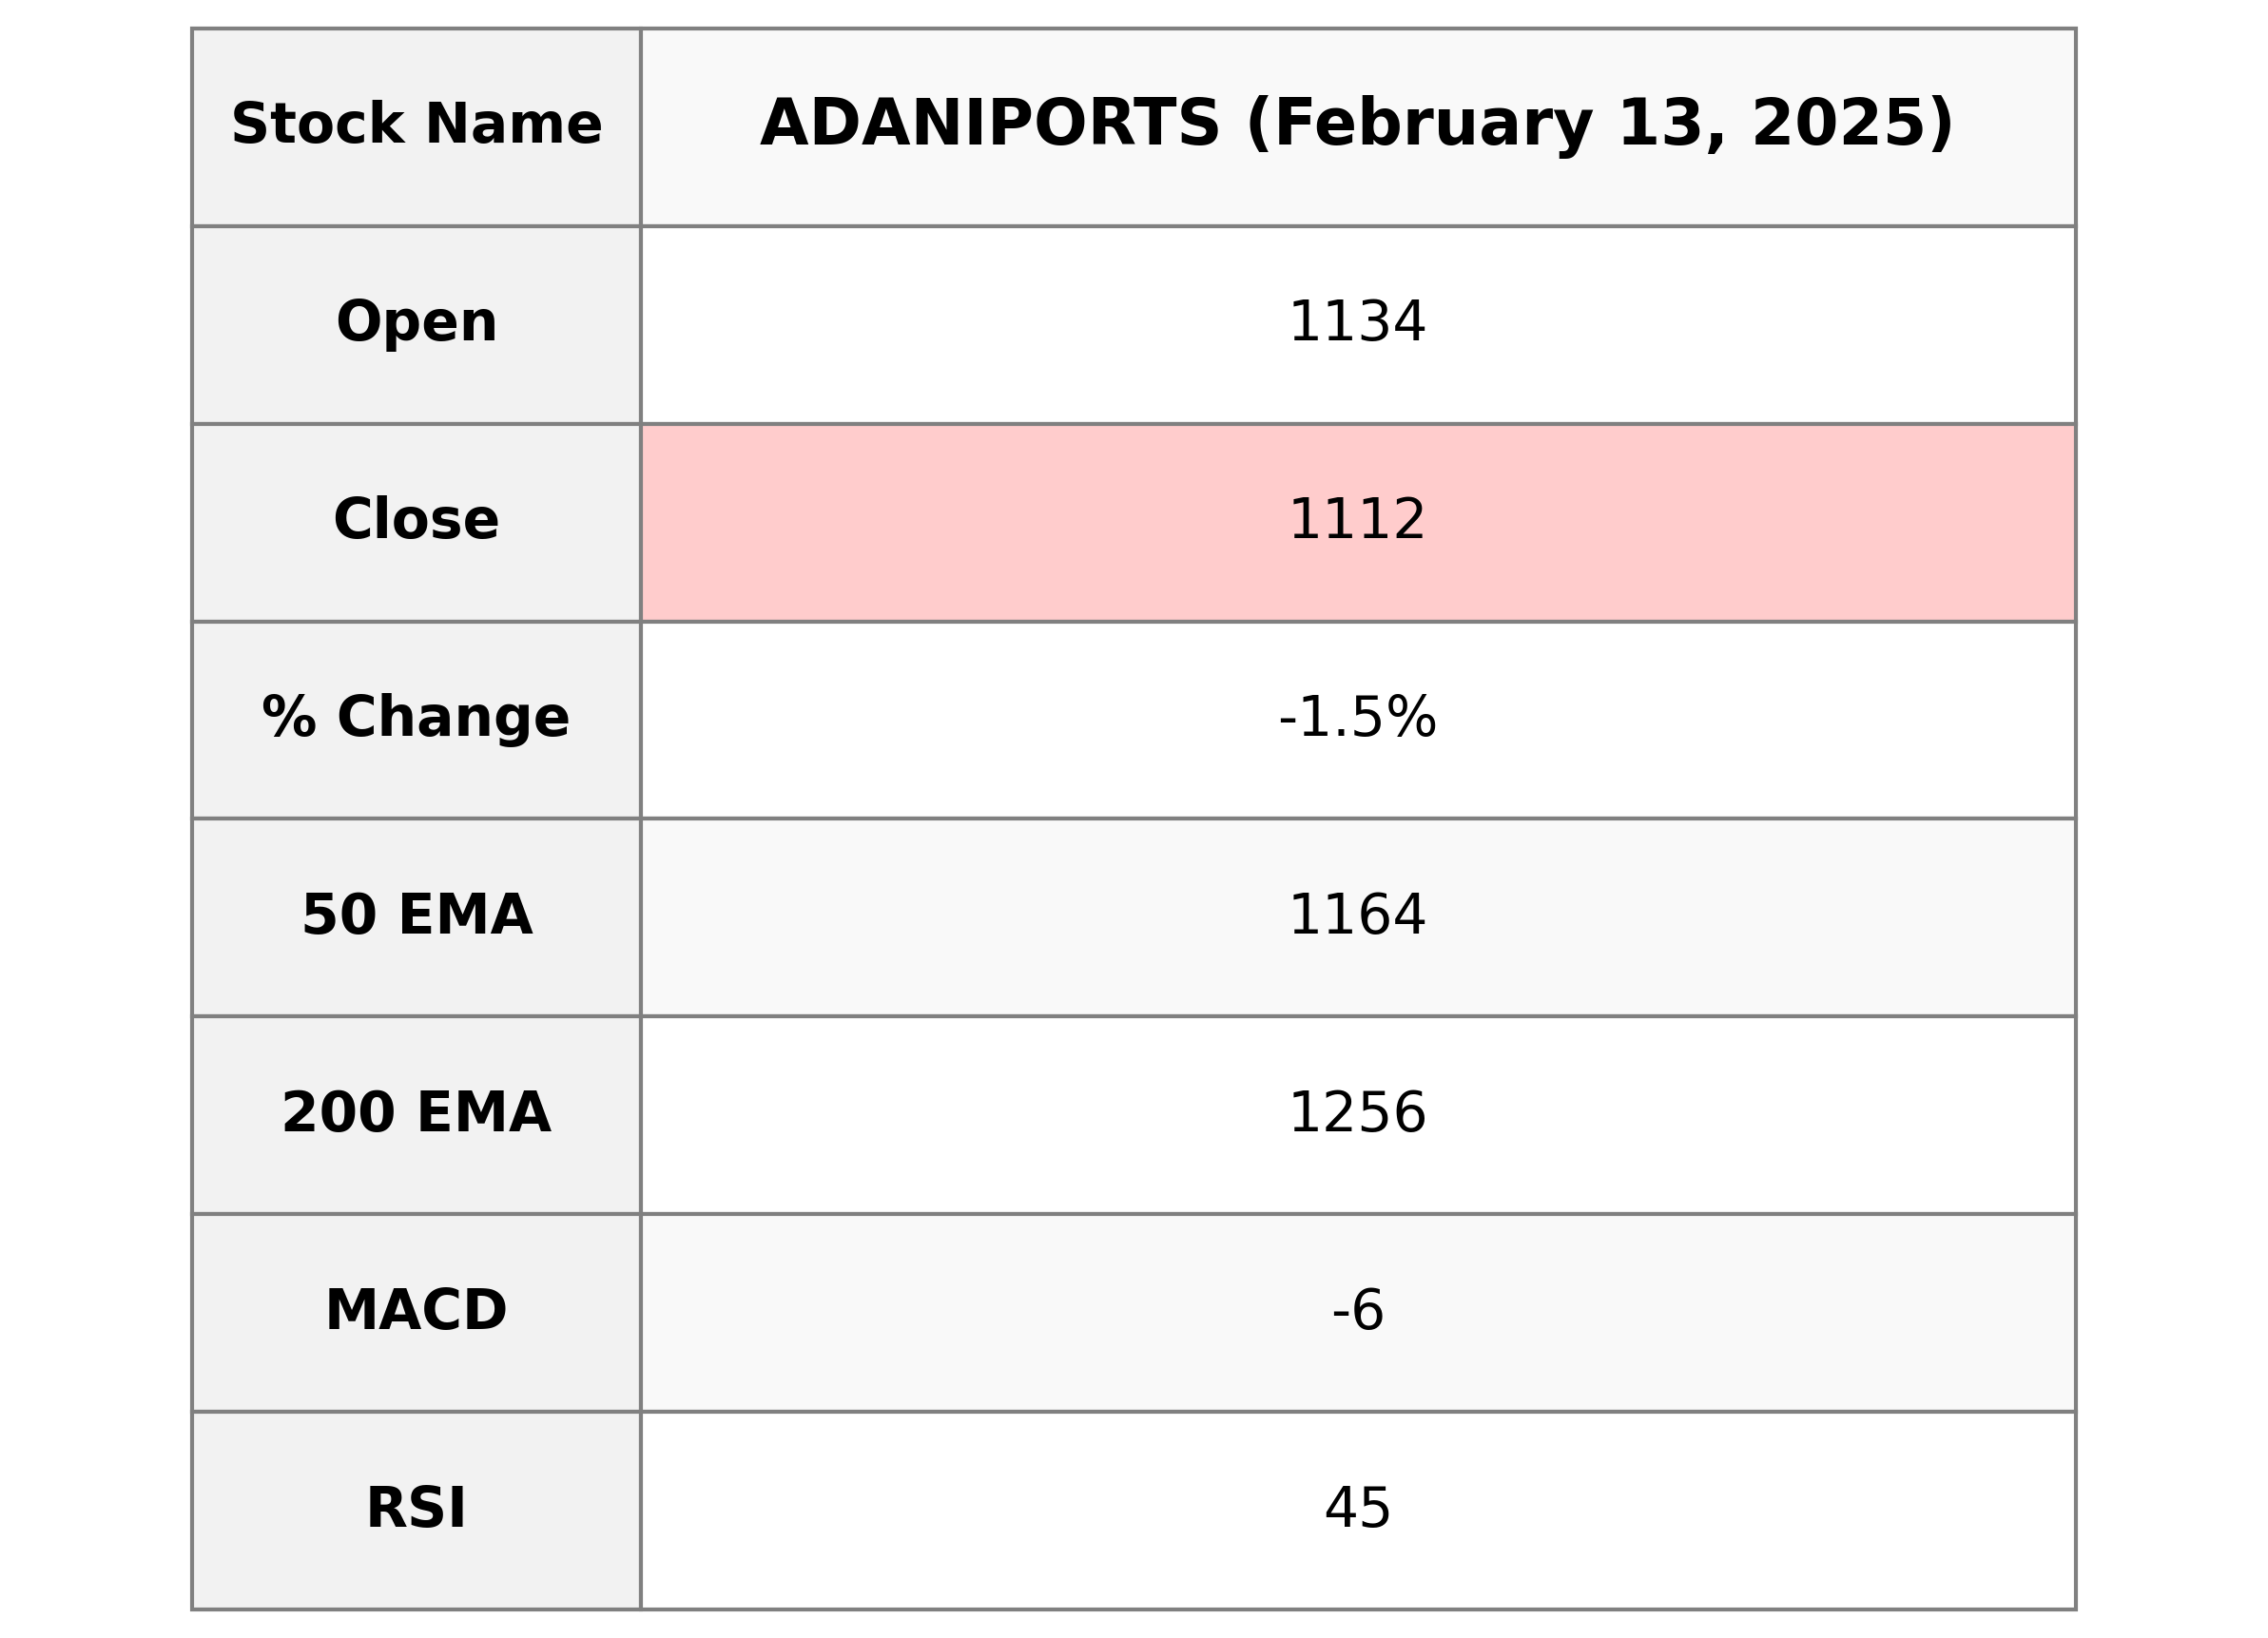
**Adani Ports** experienced a negative trading session with the stock closing at 1111.55, a decline of 1.54% from the previous close of 1128.95. The trading volume was 3,763,501 shares, with technical indicators like the MACD showing a slight bearish trend, as it remains below the signal. The RSI suggests the stock is neither overbought nor oversold, standing at 44.92. However, the stock is below its 50-day and 200-day EMAs, indicating potential bearish momentum in the short-to-medium term.
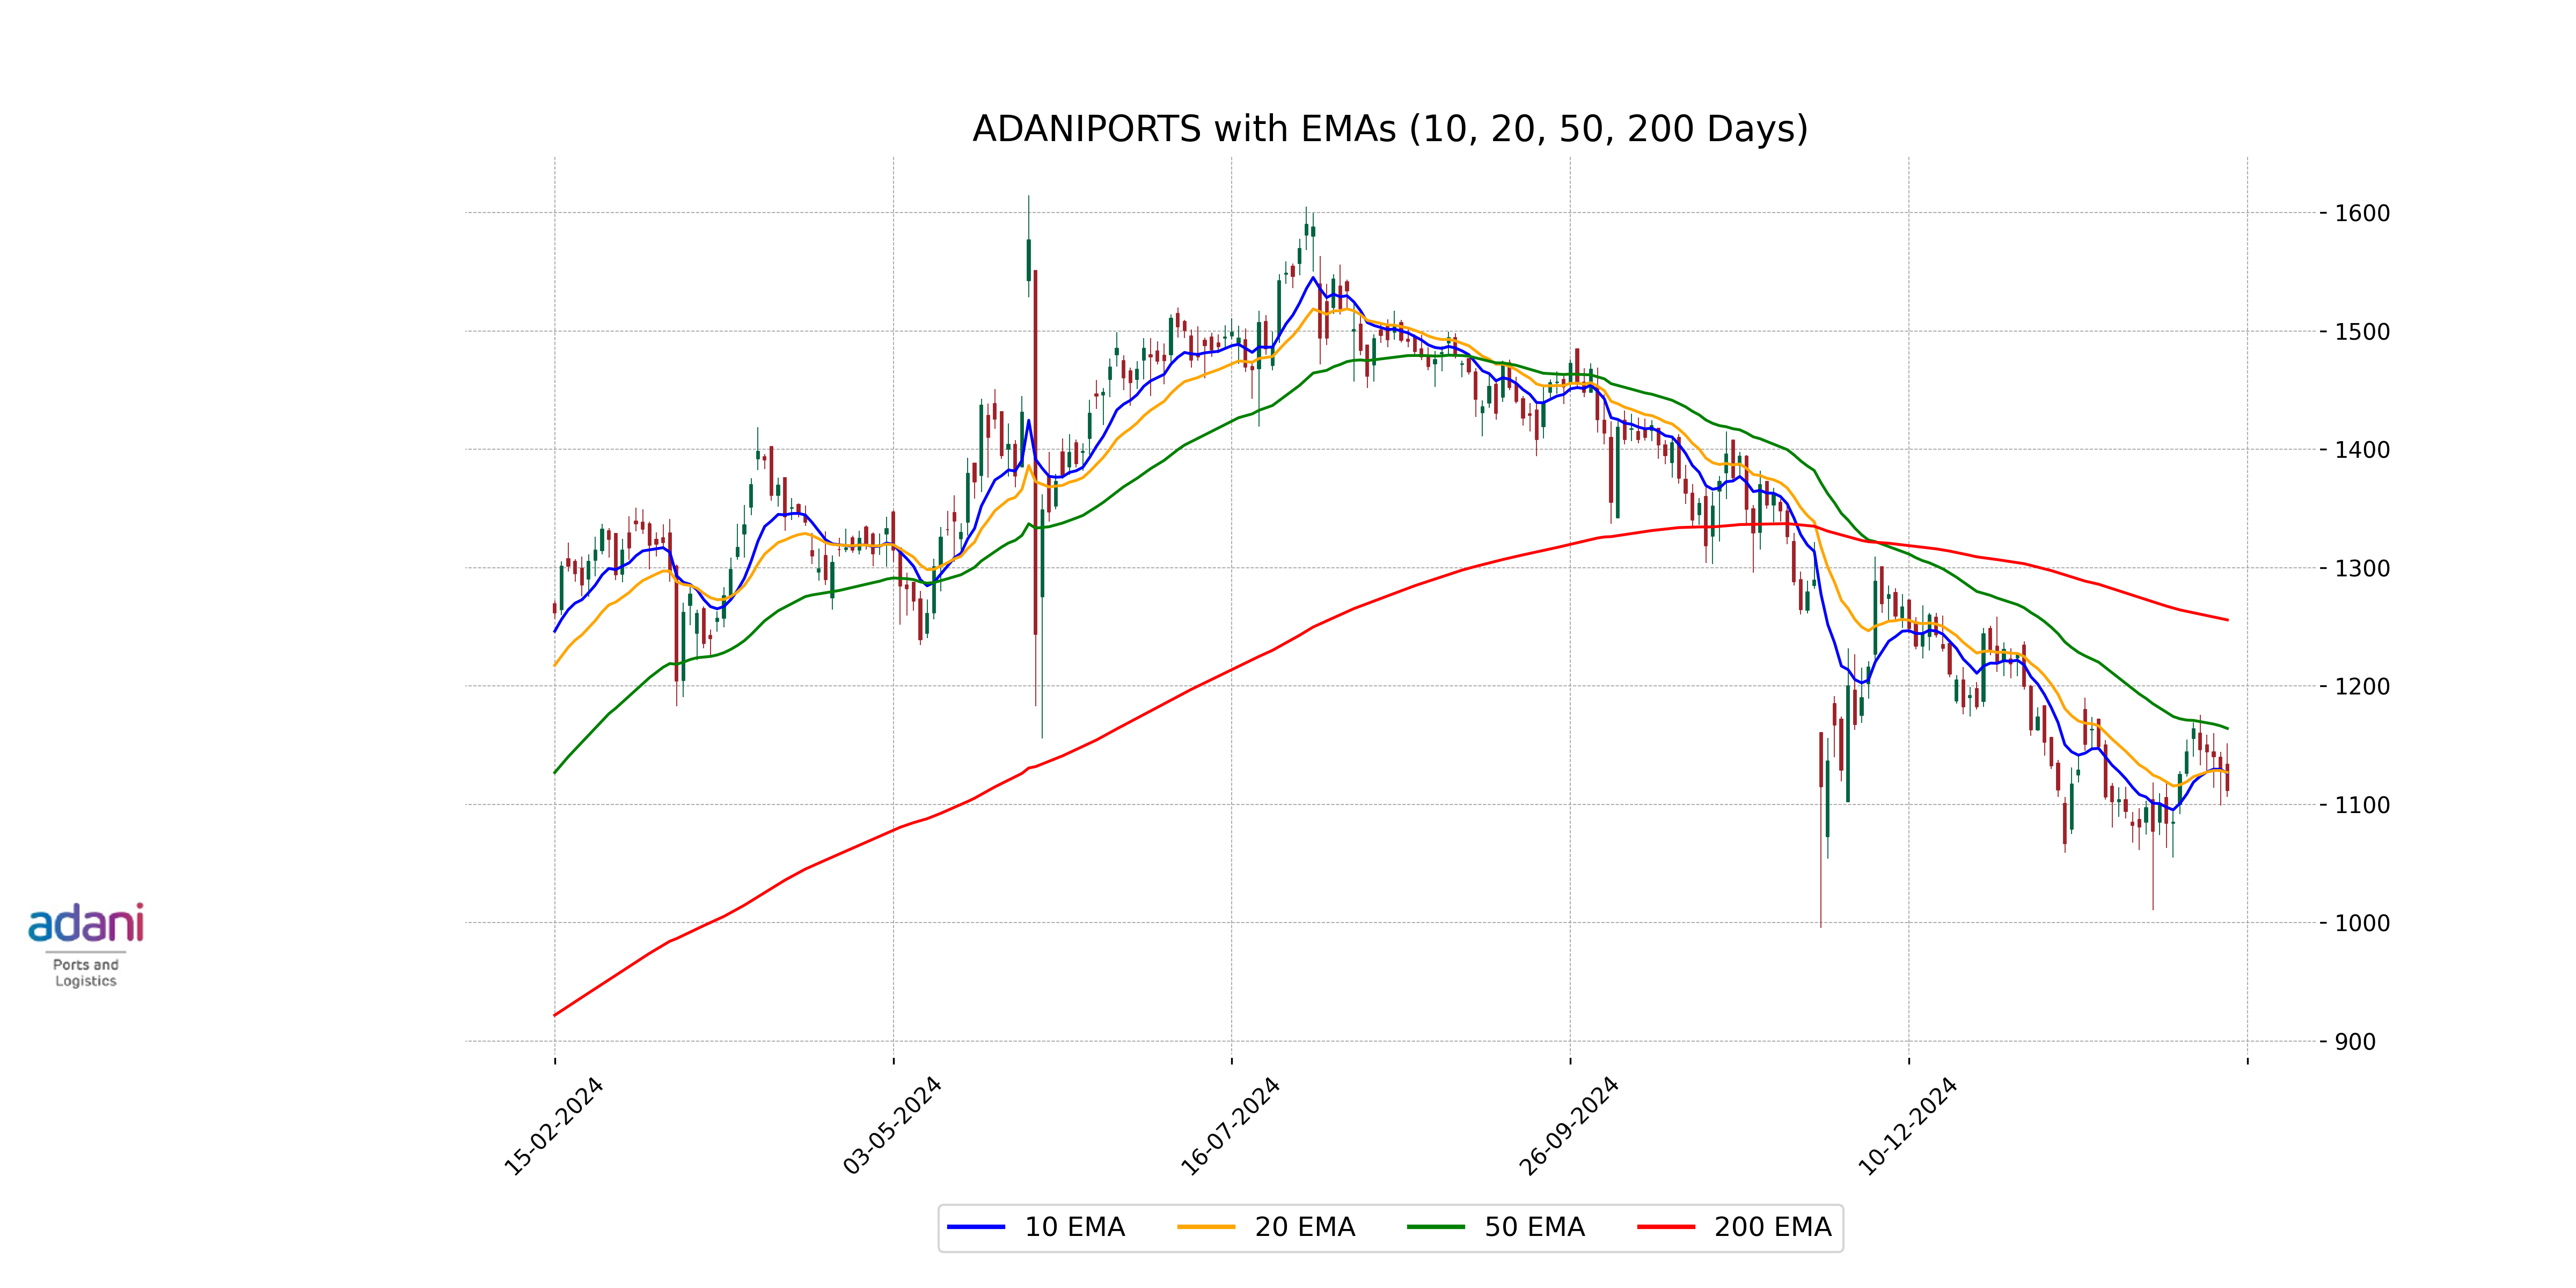
Relationship with Key Moving Averages
Adani Ports is currently trading below its 50-day and 200-day exponential moving averages (EMAs), which are 1164.13 and 1255.86, respectively. This suggests a bearish trend as the stock's closing price is 1111.55, also below the 10-day and 20-day EMAs, indicating potential short-term weakness.
Moving Averages Trend (MACD)
**Adani Ports - MACD Analysis:** The current MACD value for Adani Ports is -6.50, indicating a bearish trend as it is below the MACD Signal line, which is at -12.67. This suggests that the stock might be experiencing downward momentum in the short term.

RSI Analysis
Adani Ports has an RSI of 44.92, which suggests it is in the neutral range, neither overbought nor oversold. This indicates potential stability in its current price level, with no immediate signs of significant upward or downward momentum.
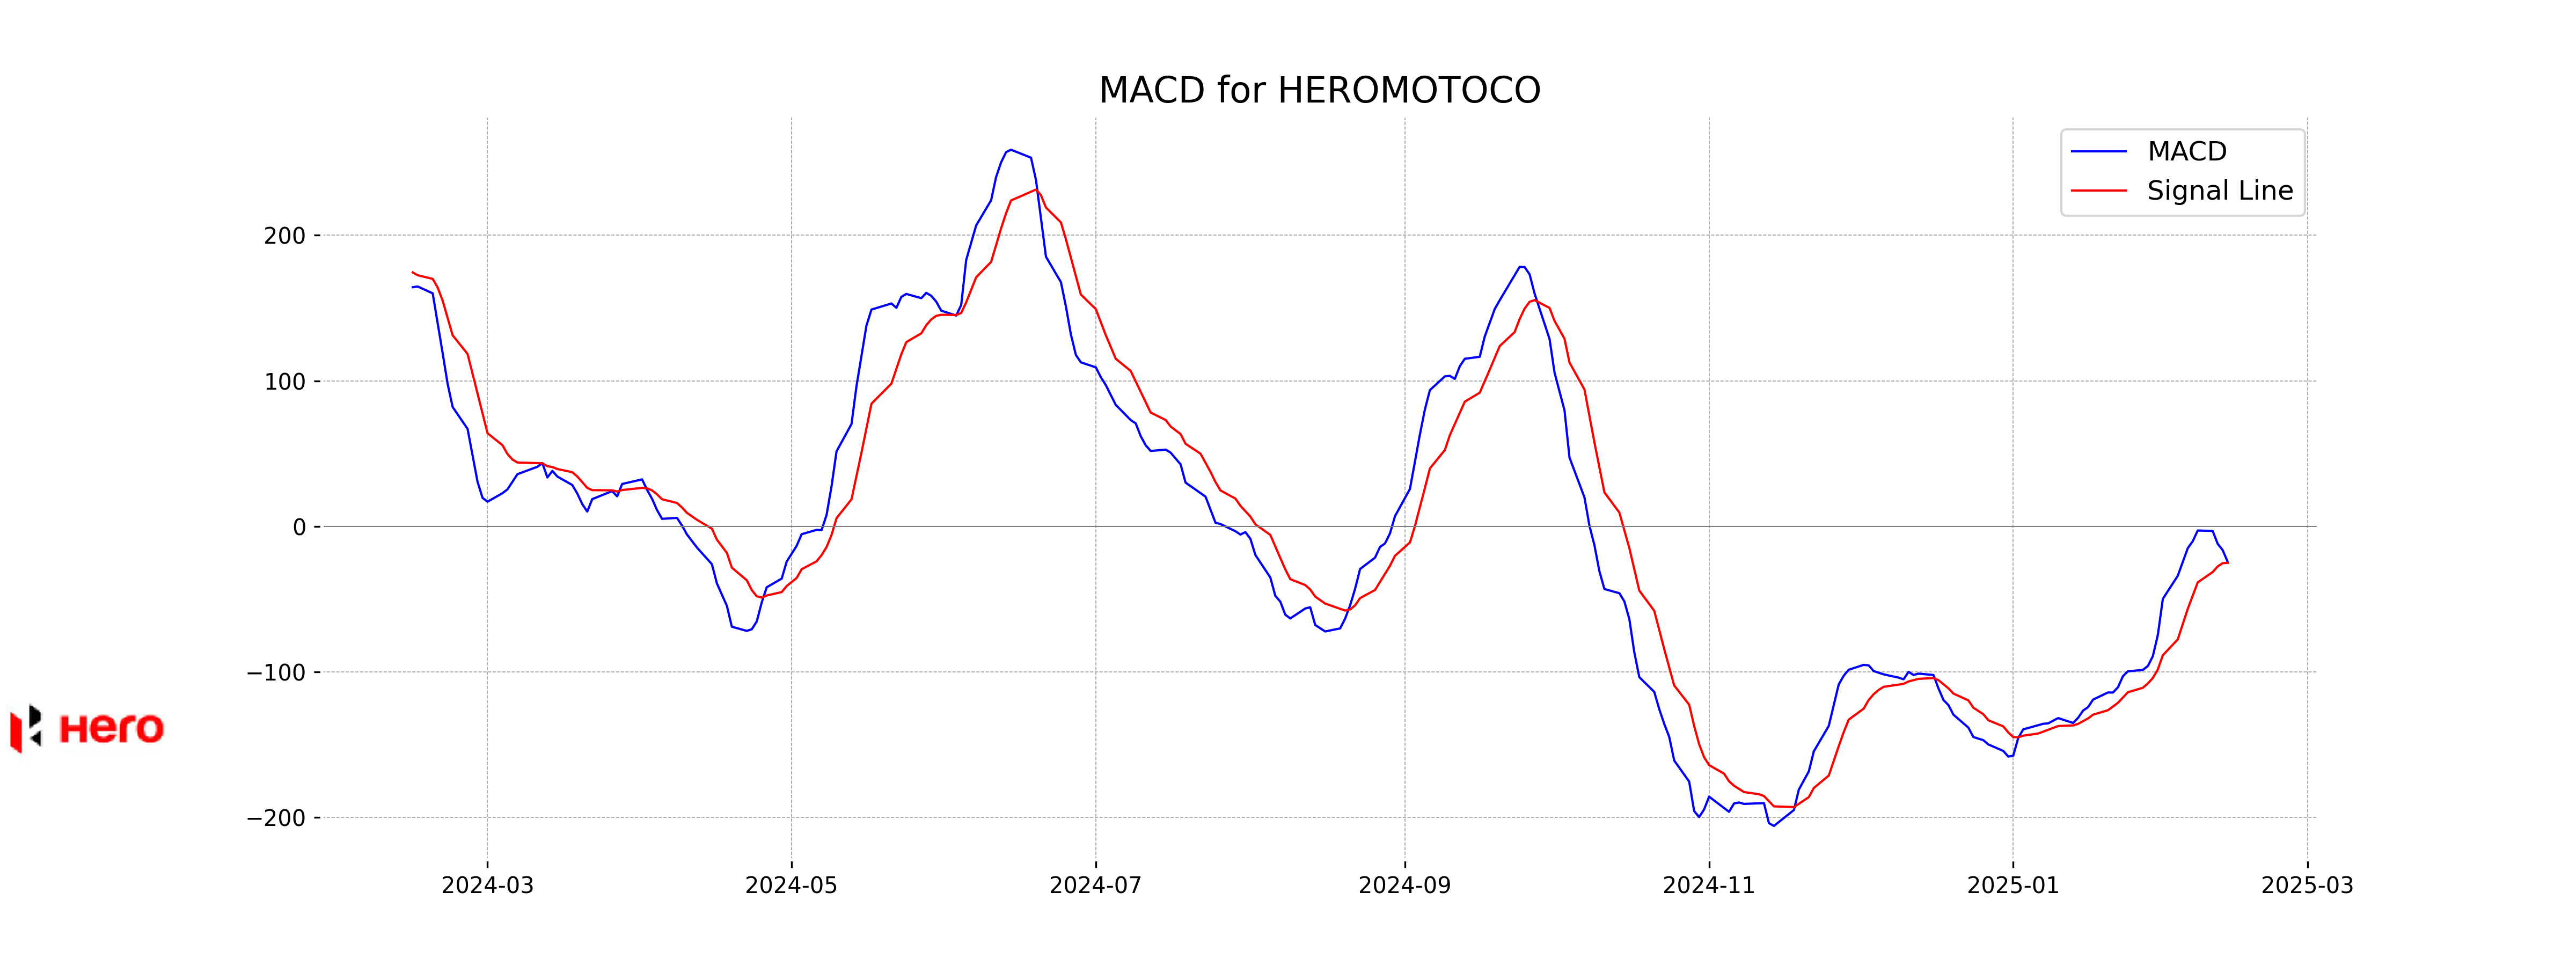
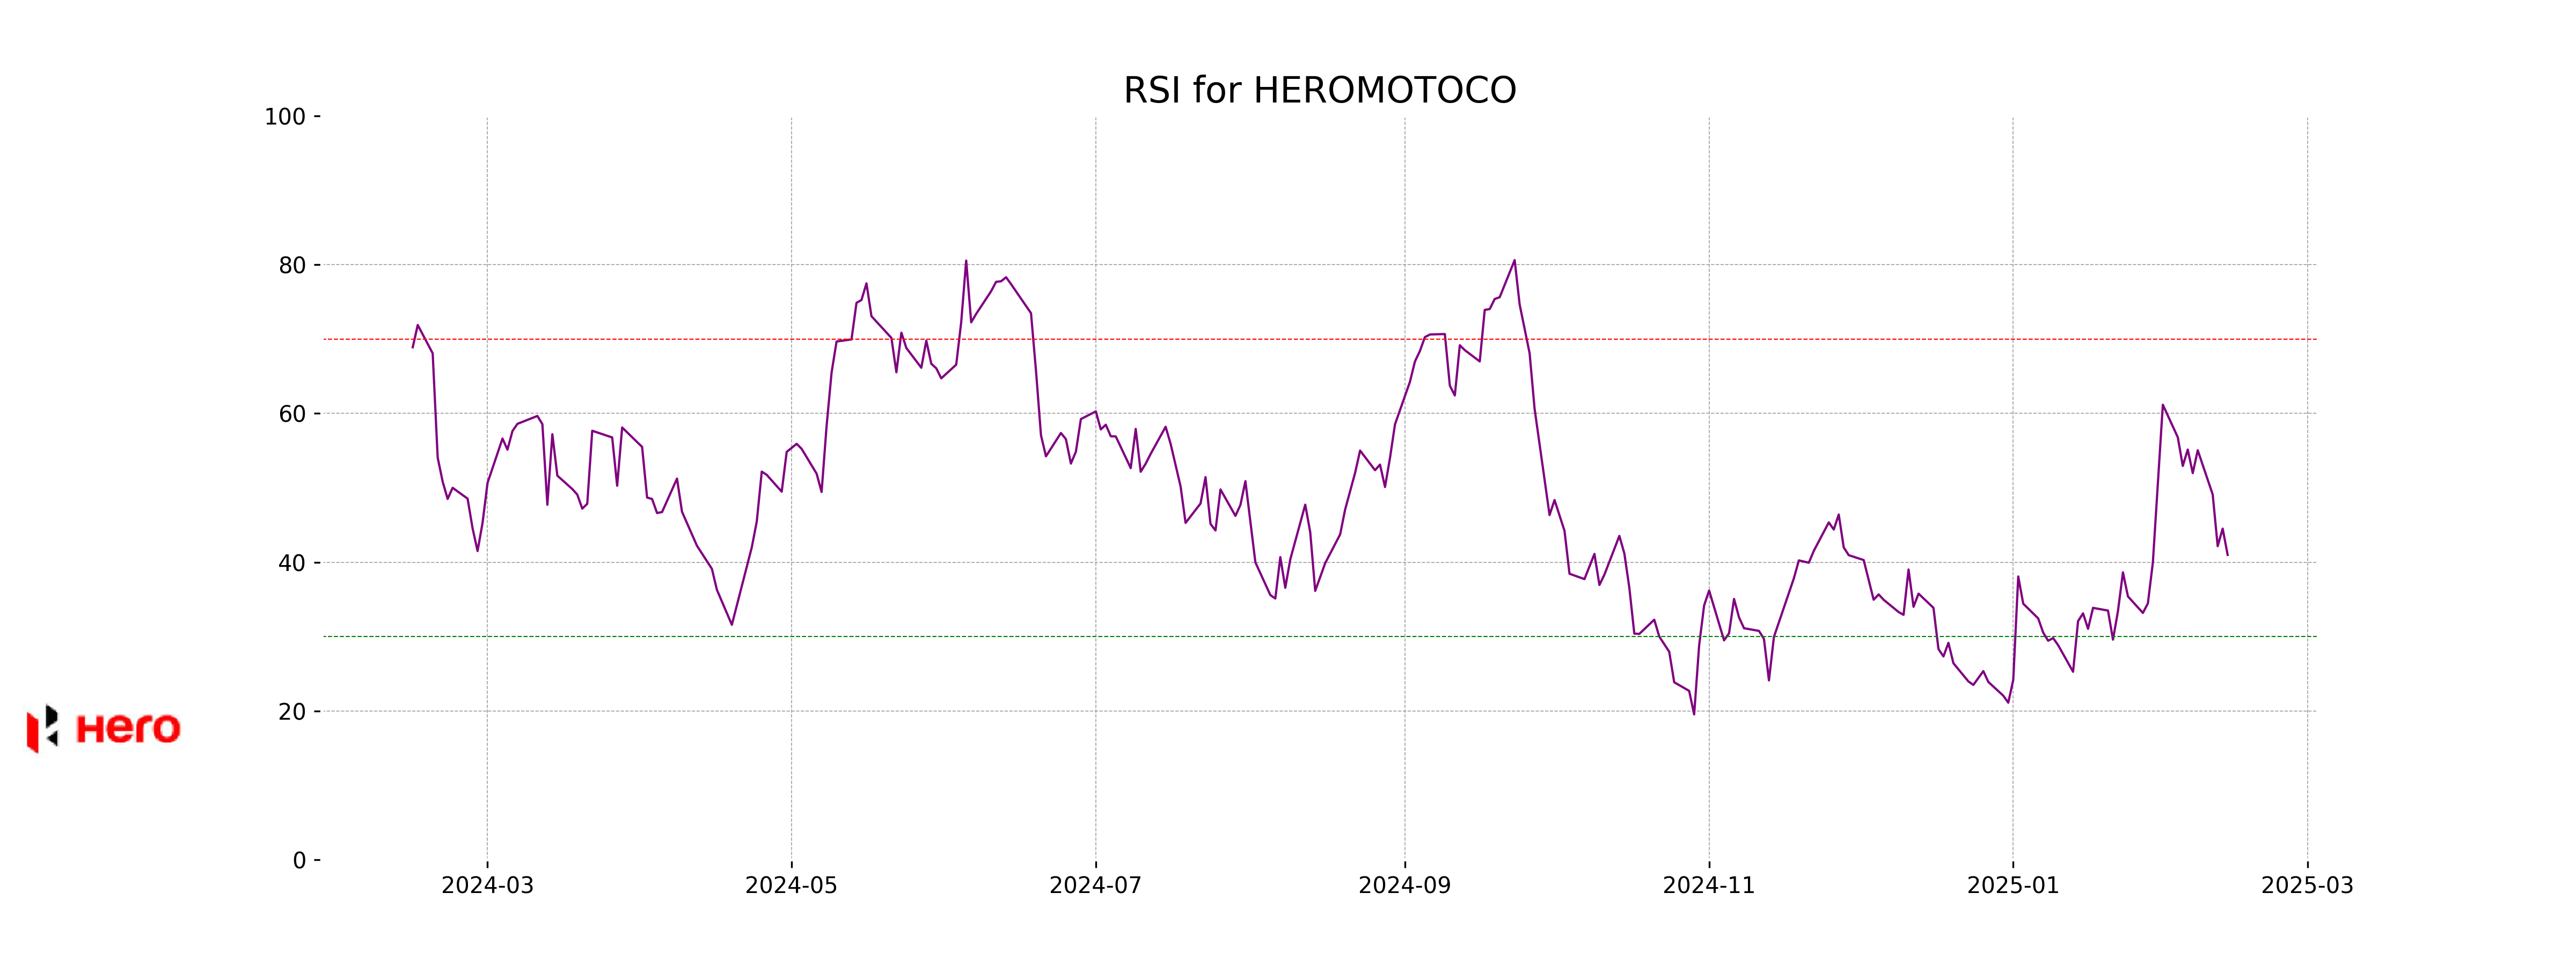
Analysis for Hero MotoCorp - February 13, 2025
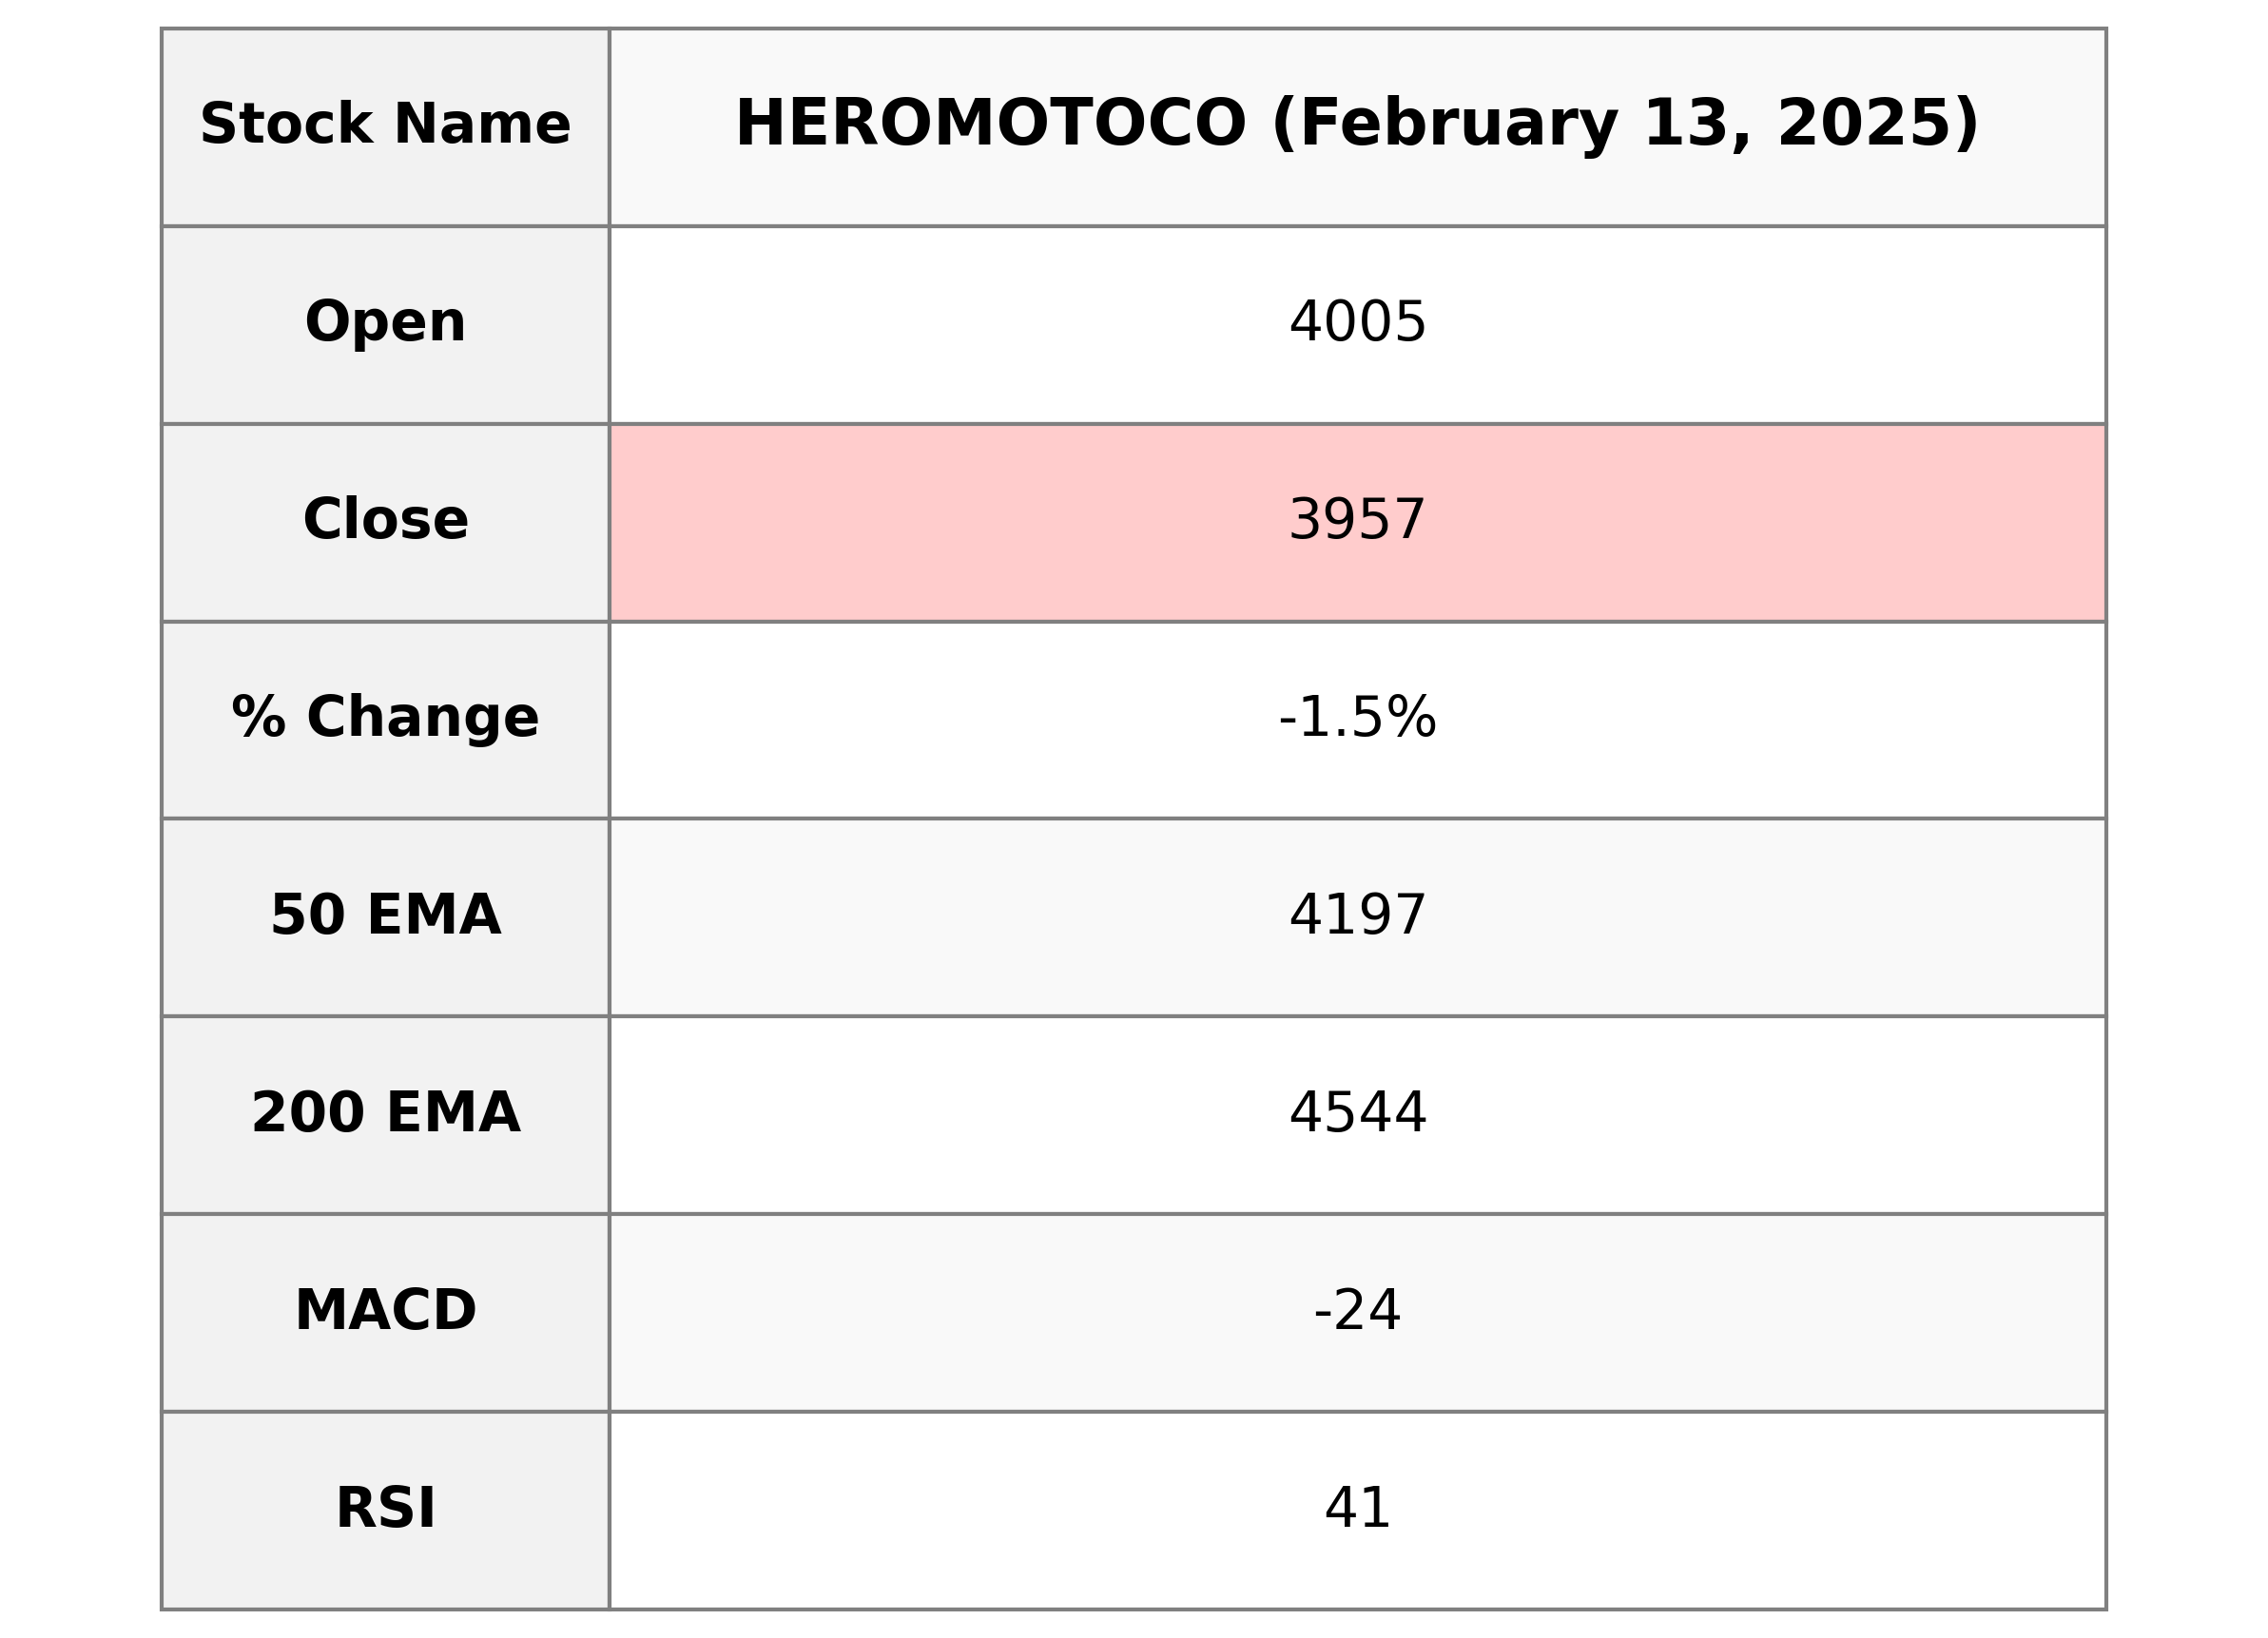
**Hero MotoCorp** experienced a decline in stock performance, with its closing price at 3956.55 compared to the previous close of 4015.75, reflecting a decreased percentage change of -1.47%. The stock remains below its 10-day and 50-day EMAs, and its RSI indicates a relatively weak momentum at 40.99. The MACD is slightly negative, suggesting bearish sentiment, while the company's market cap stands at 791.35 billion INR.
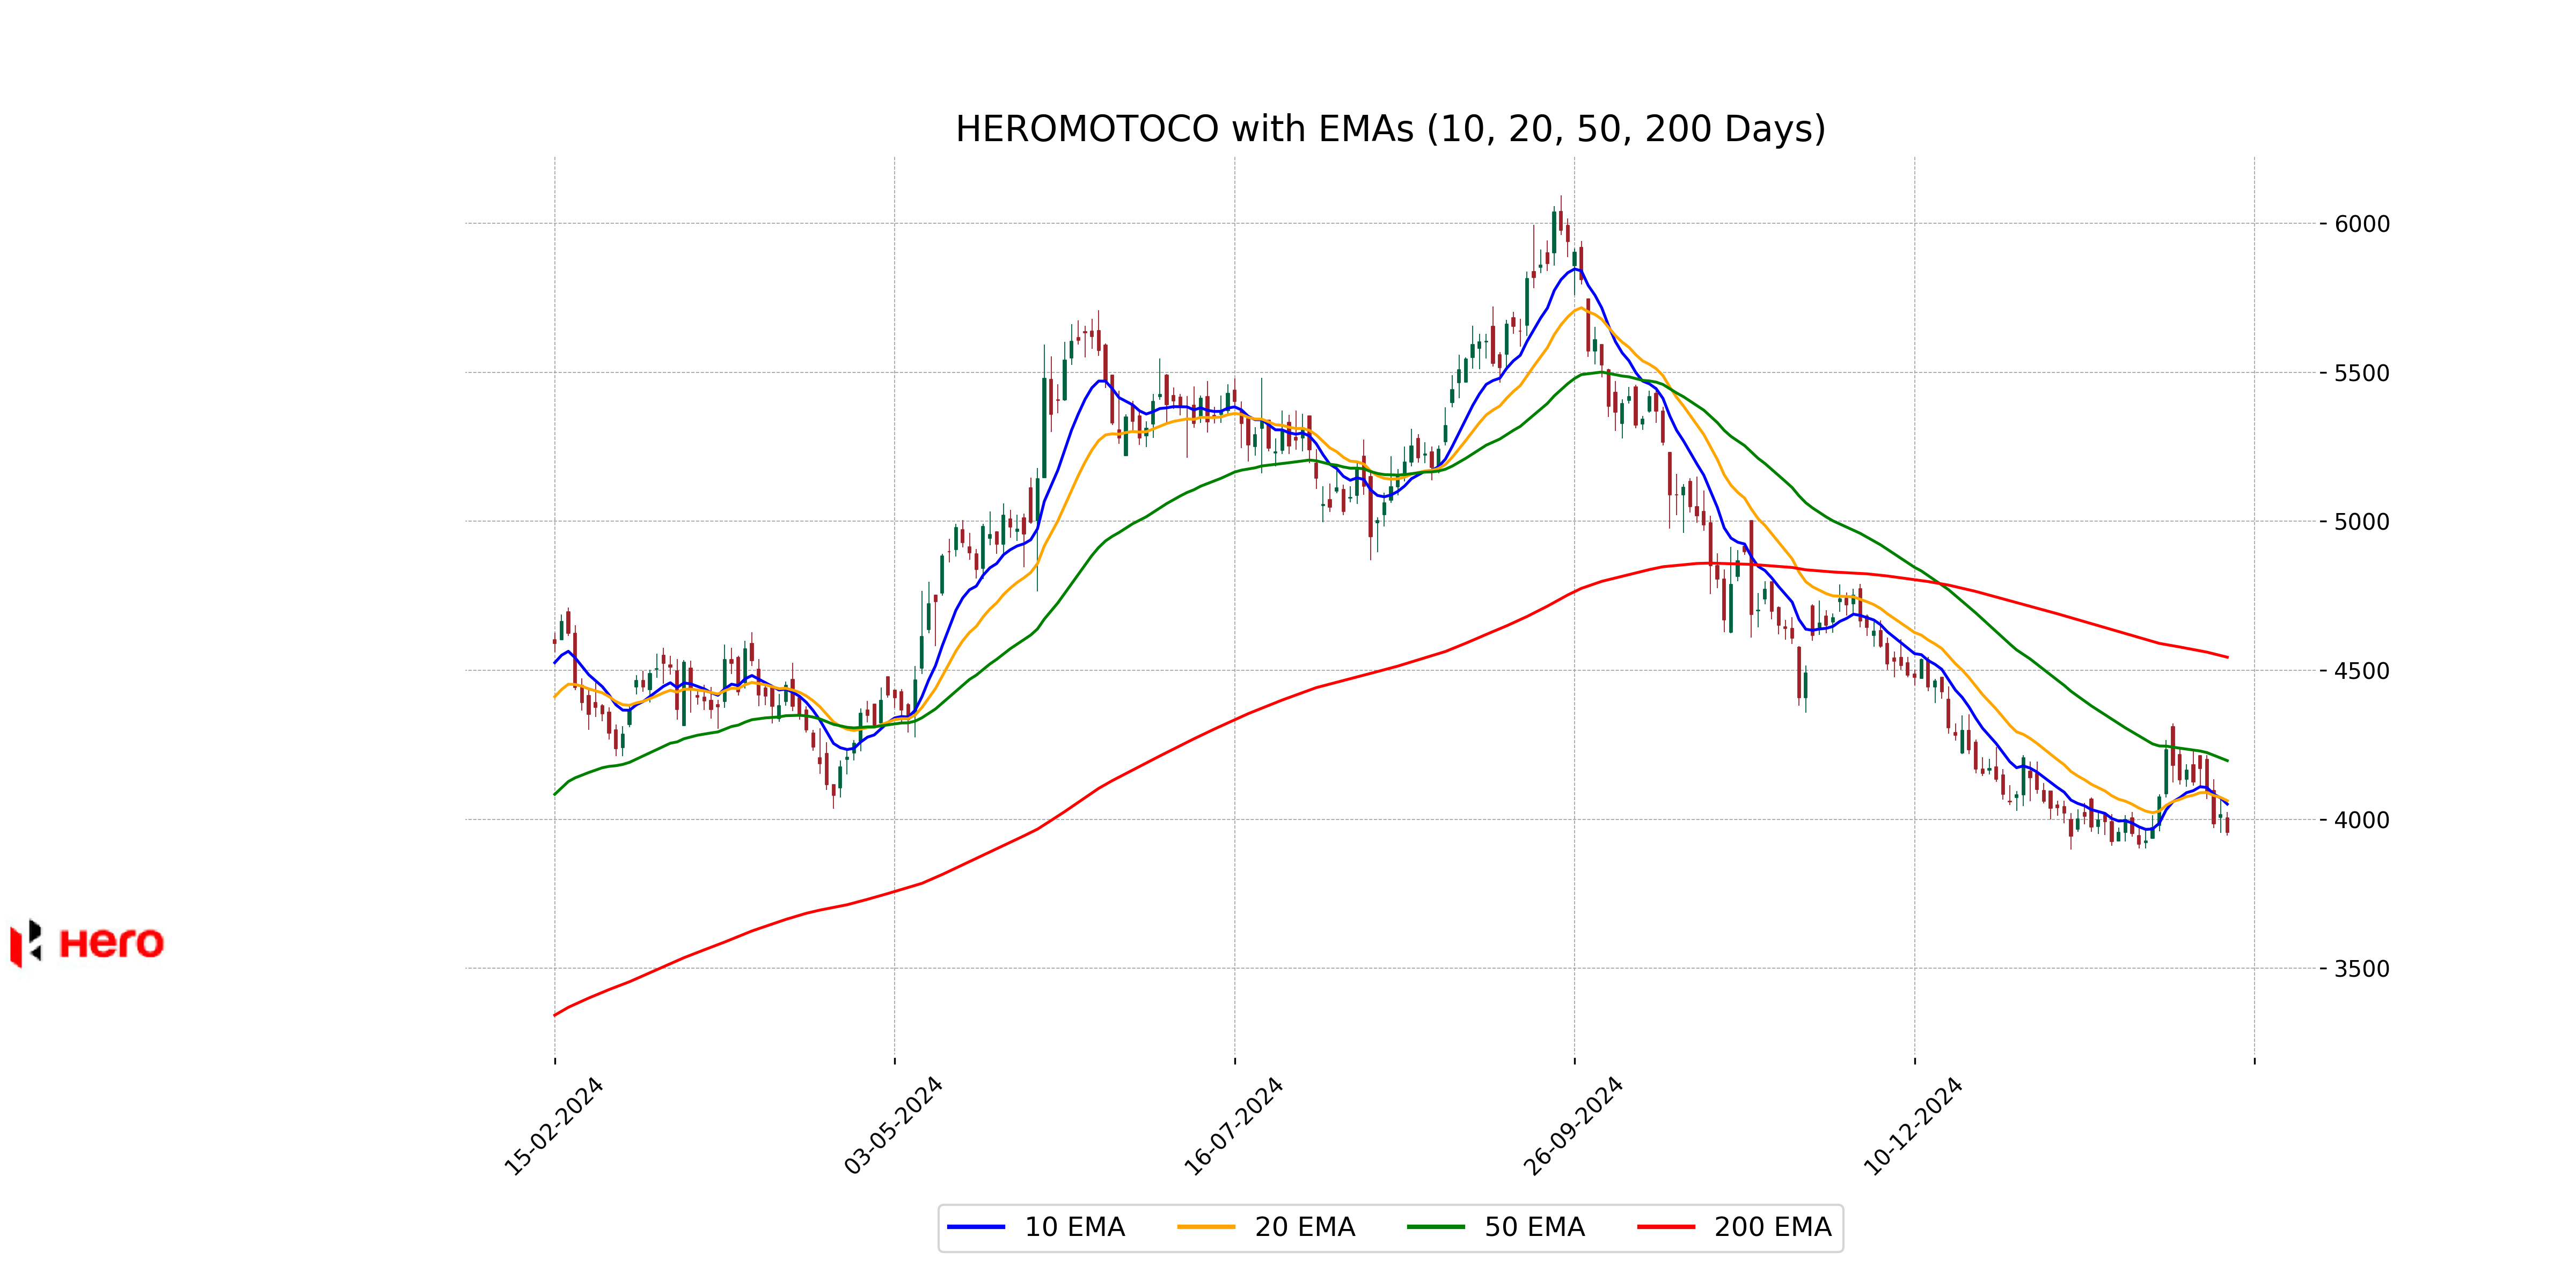
Relationship with Key Moving Averages
The current close price of Hero MotoCorp is below the 10-day EMA of 4051.18, indicating short-term weakness. It is also below the 50-day and 200-day EMAs of 4197.12 and 4544.18, respectively, suggesting a bearish trend in both medium and long-term perspectives.
Moving Averages Trend (MACD)
Hero MotoCorp is currently exhibiting a bearish trend as indicated by the MACD value of -24.29, which is below the signal line at -25.08. This suggests that the stock may continue to face downward pressure in the near term.
RSI Analysis
Hero MotoCorp's current RSI is 40.99, which suggests that the stock is approaching oversold territory. An RSI below 30 generally indicates that the stock is oversold, while any value below 50 can imply that the stock is experiencing bearish momentum. Investors might consider monitoring the stock for potential buying opportunities if the RSI continues to decrease further.
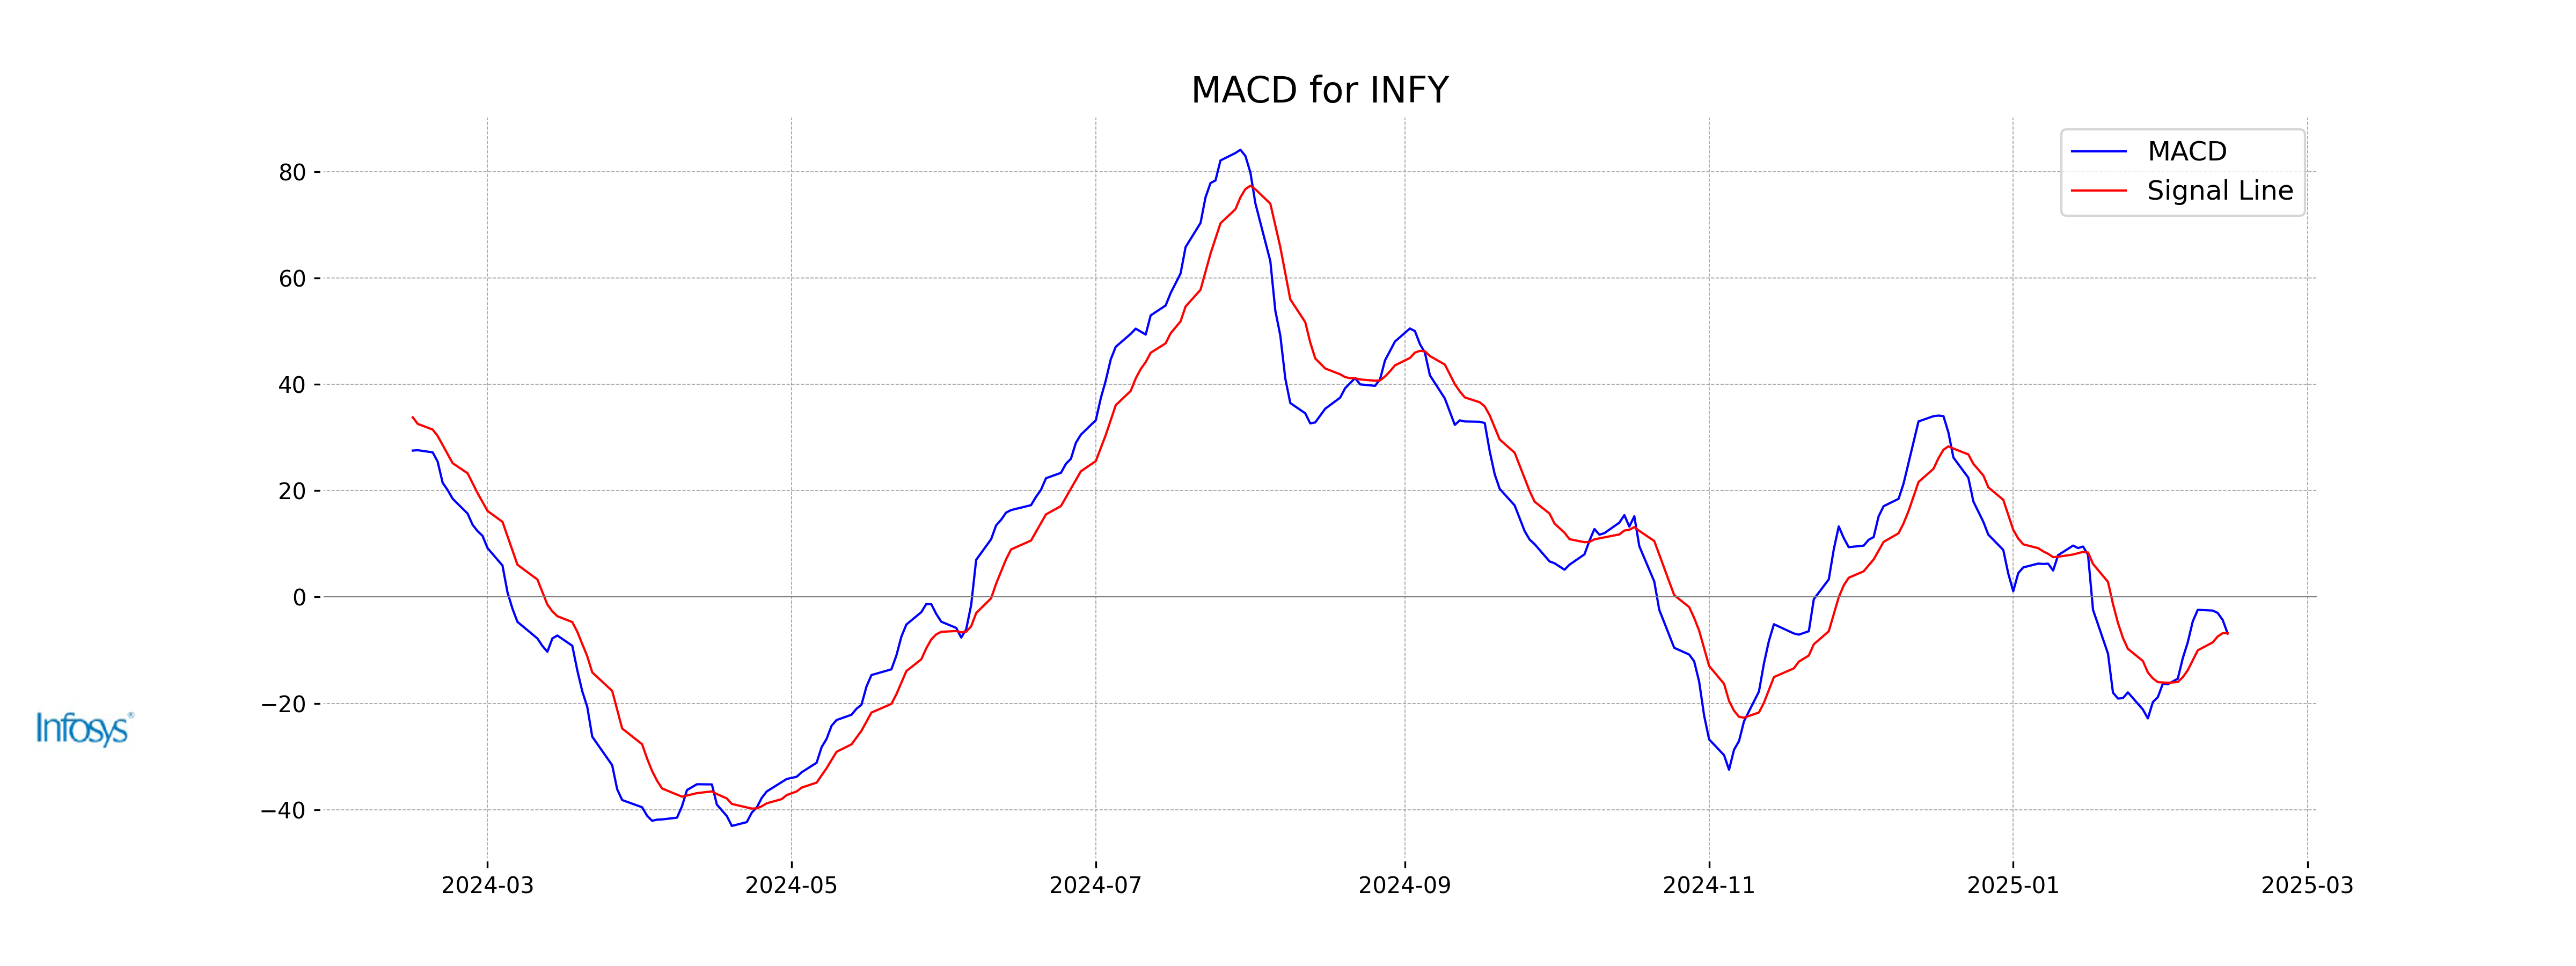
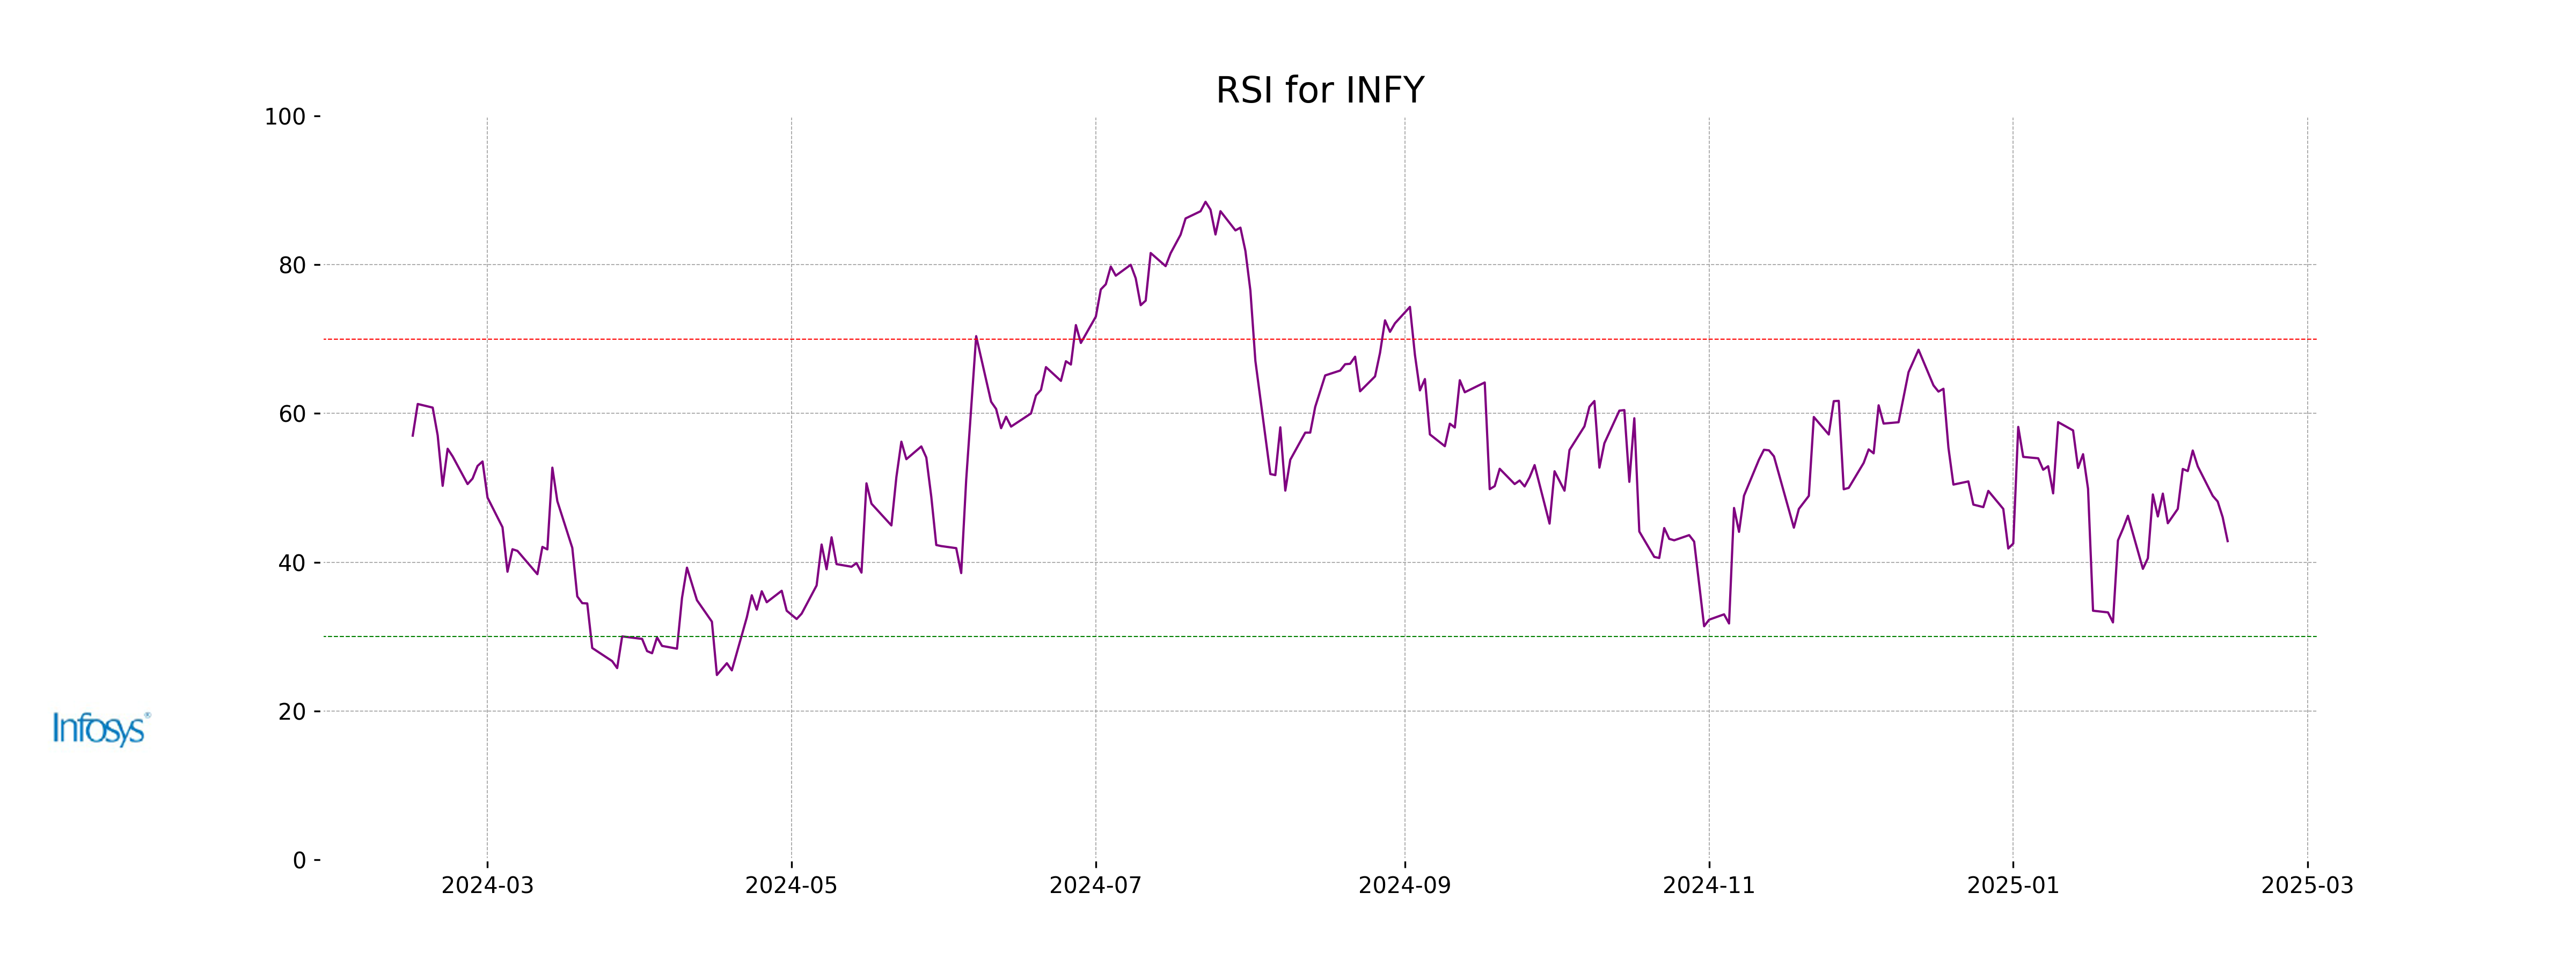
Analysis for Infosys - February 13, 2025
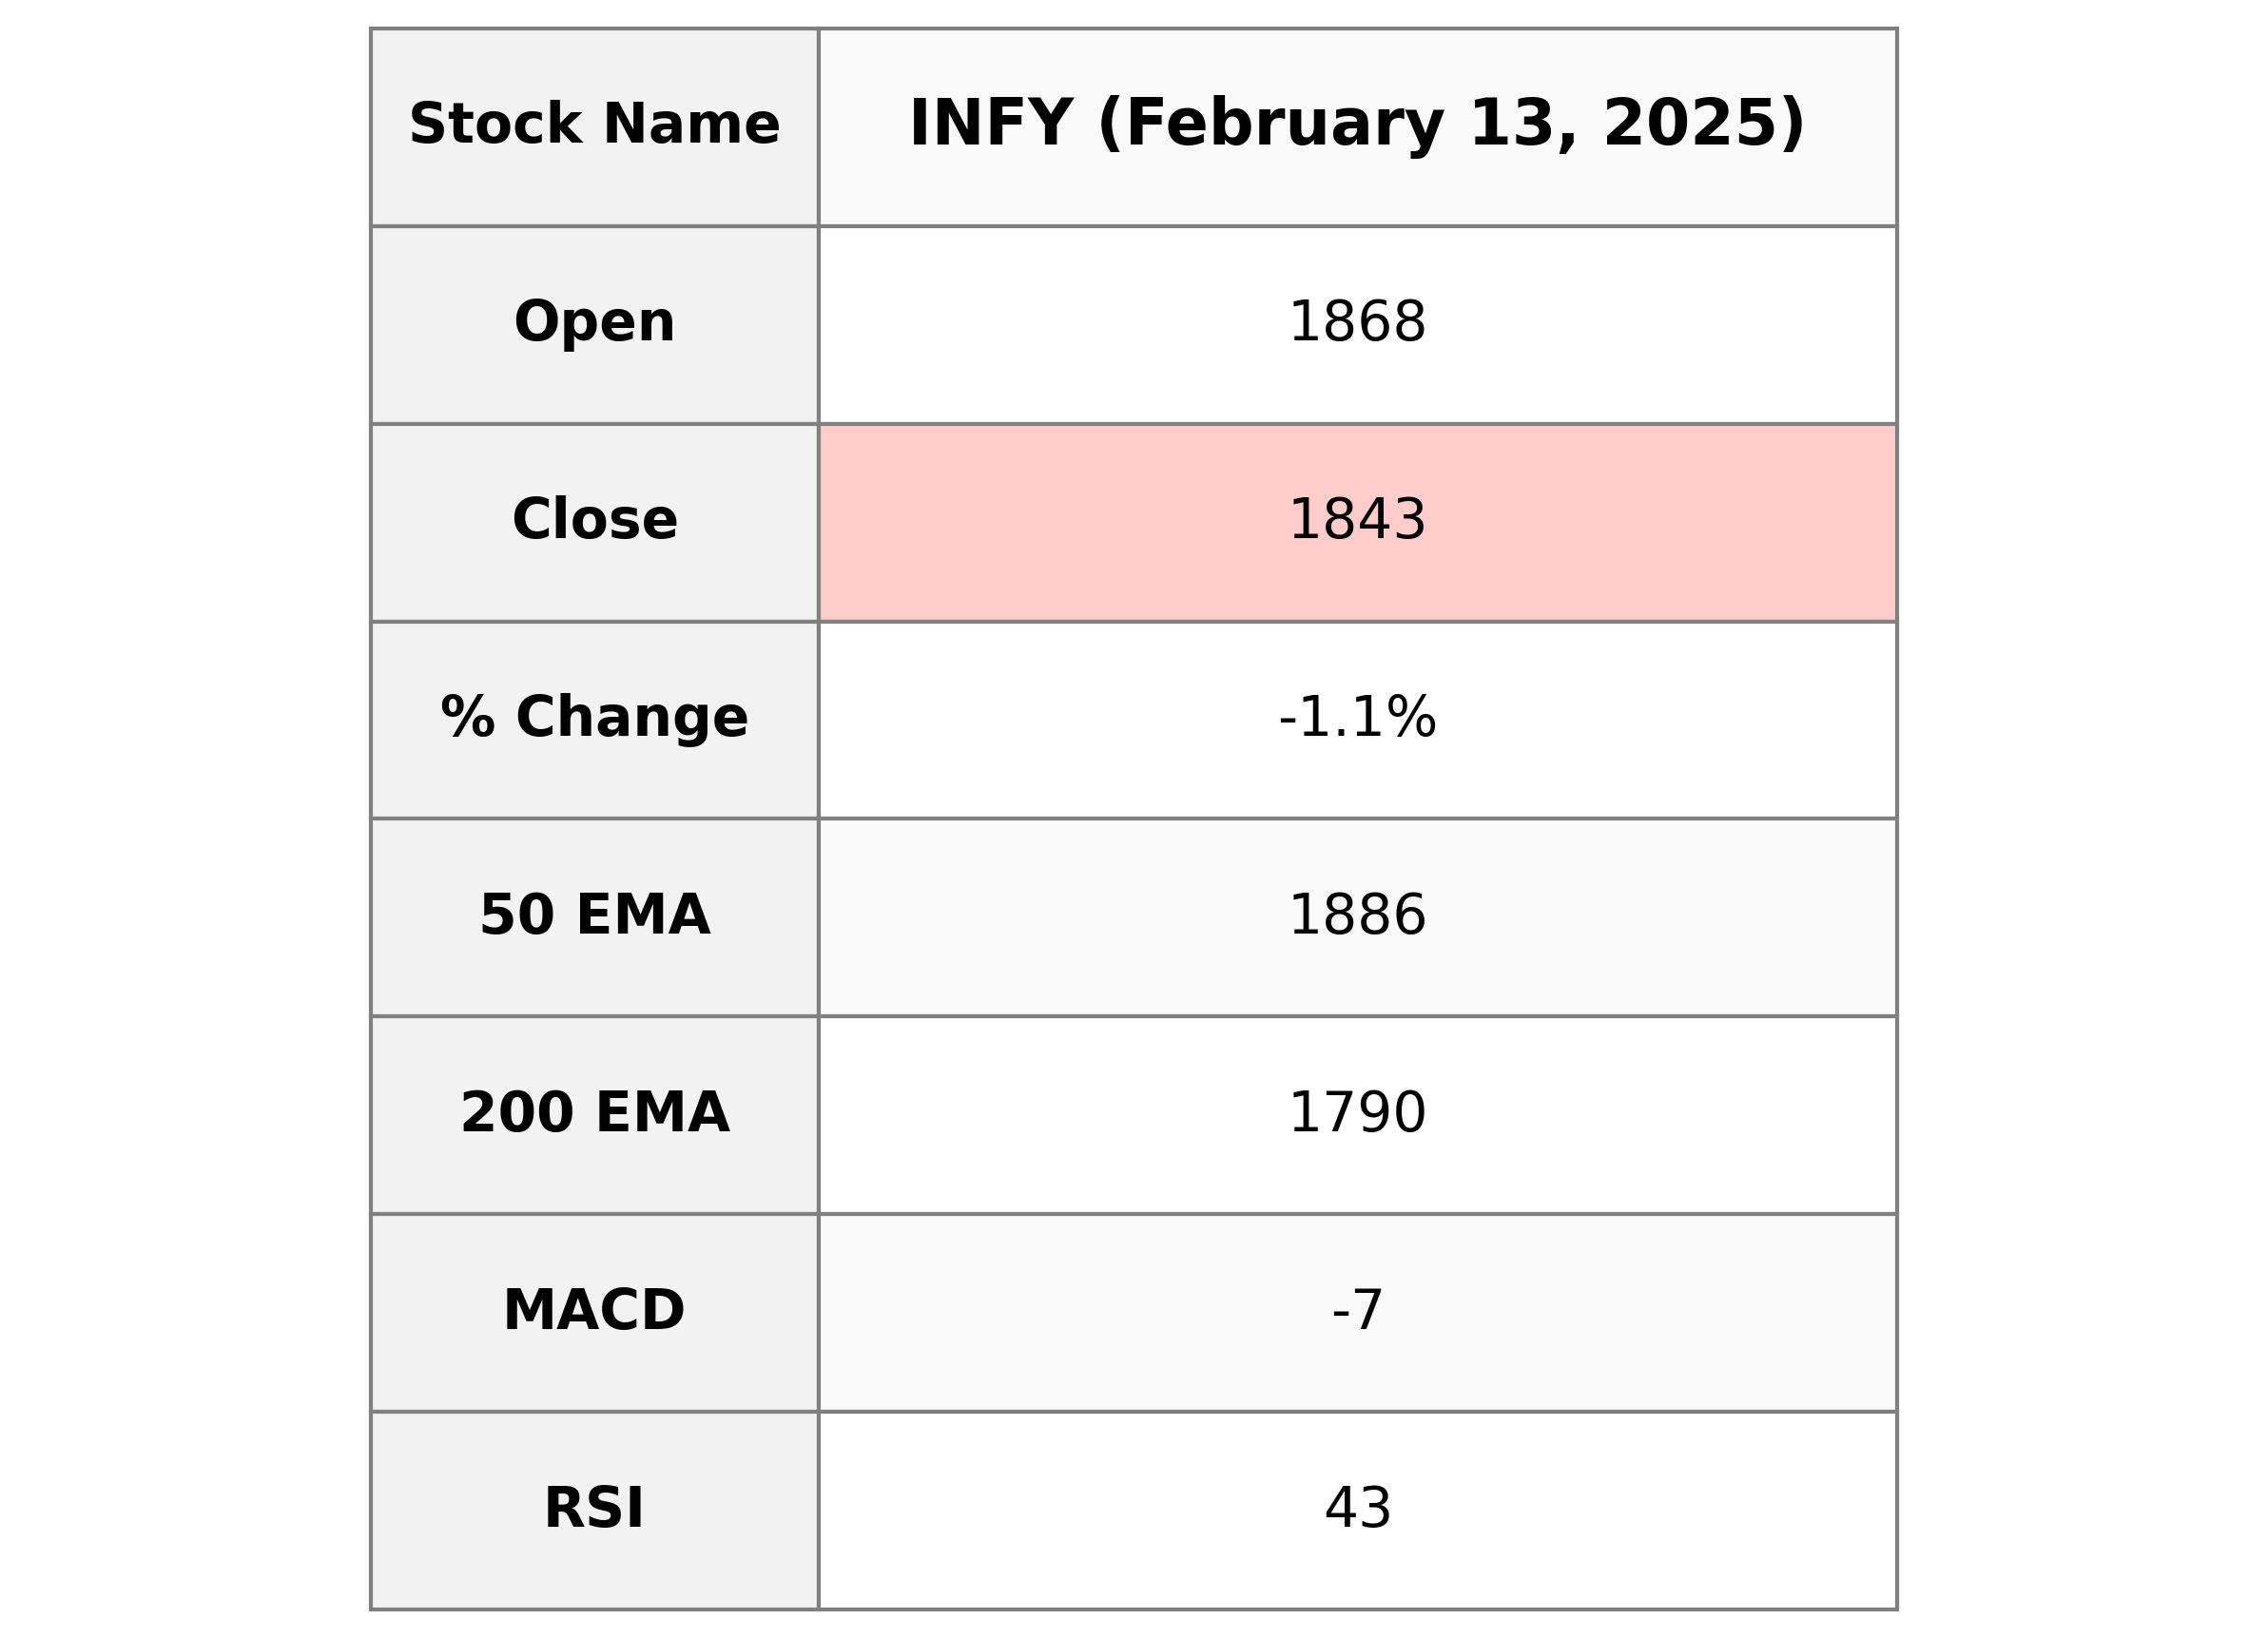
Infosys experienced a decline in stock price, closing at 1843.25 with a decrease of 1.07% from the previous close. The trading volume was notable at over 5.2 million shares. The stock is part of the Technology sector and operates within the Information Technology Services industry in India.
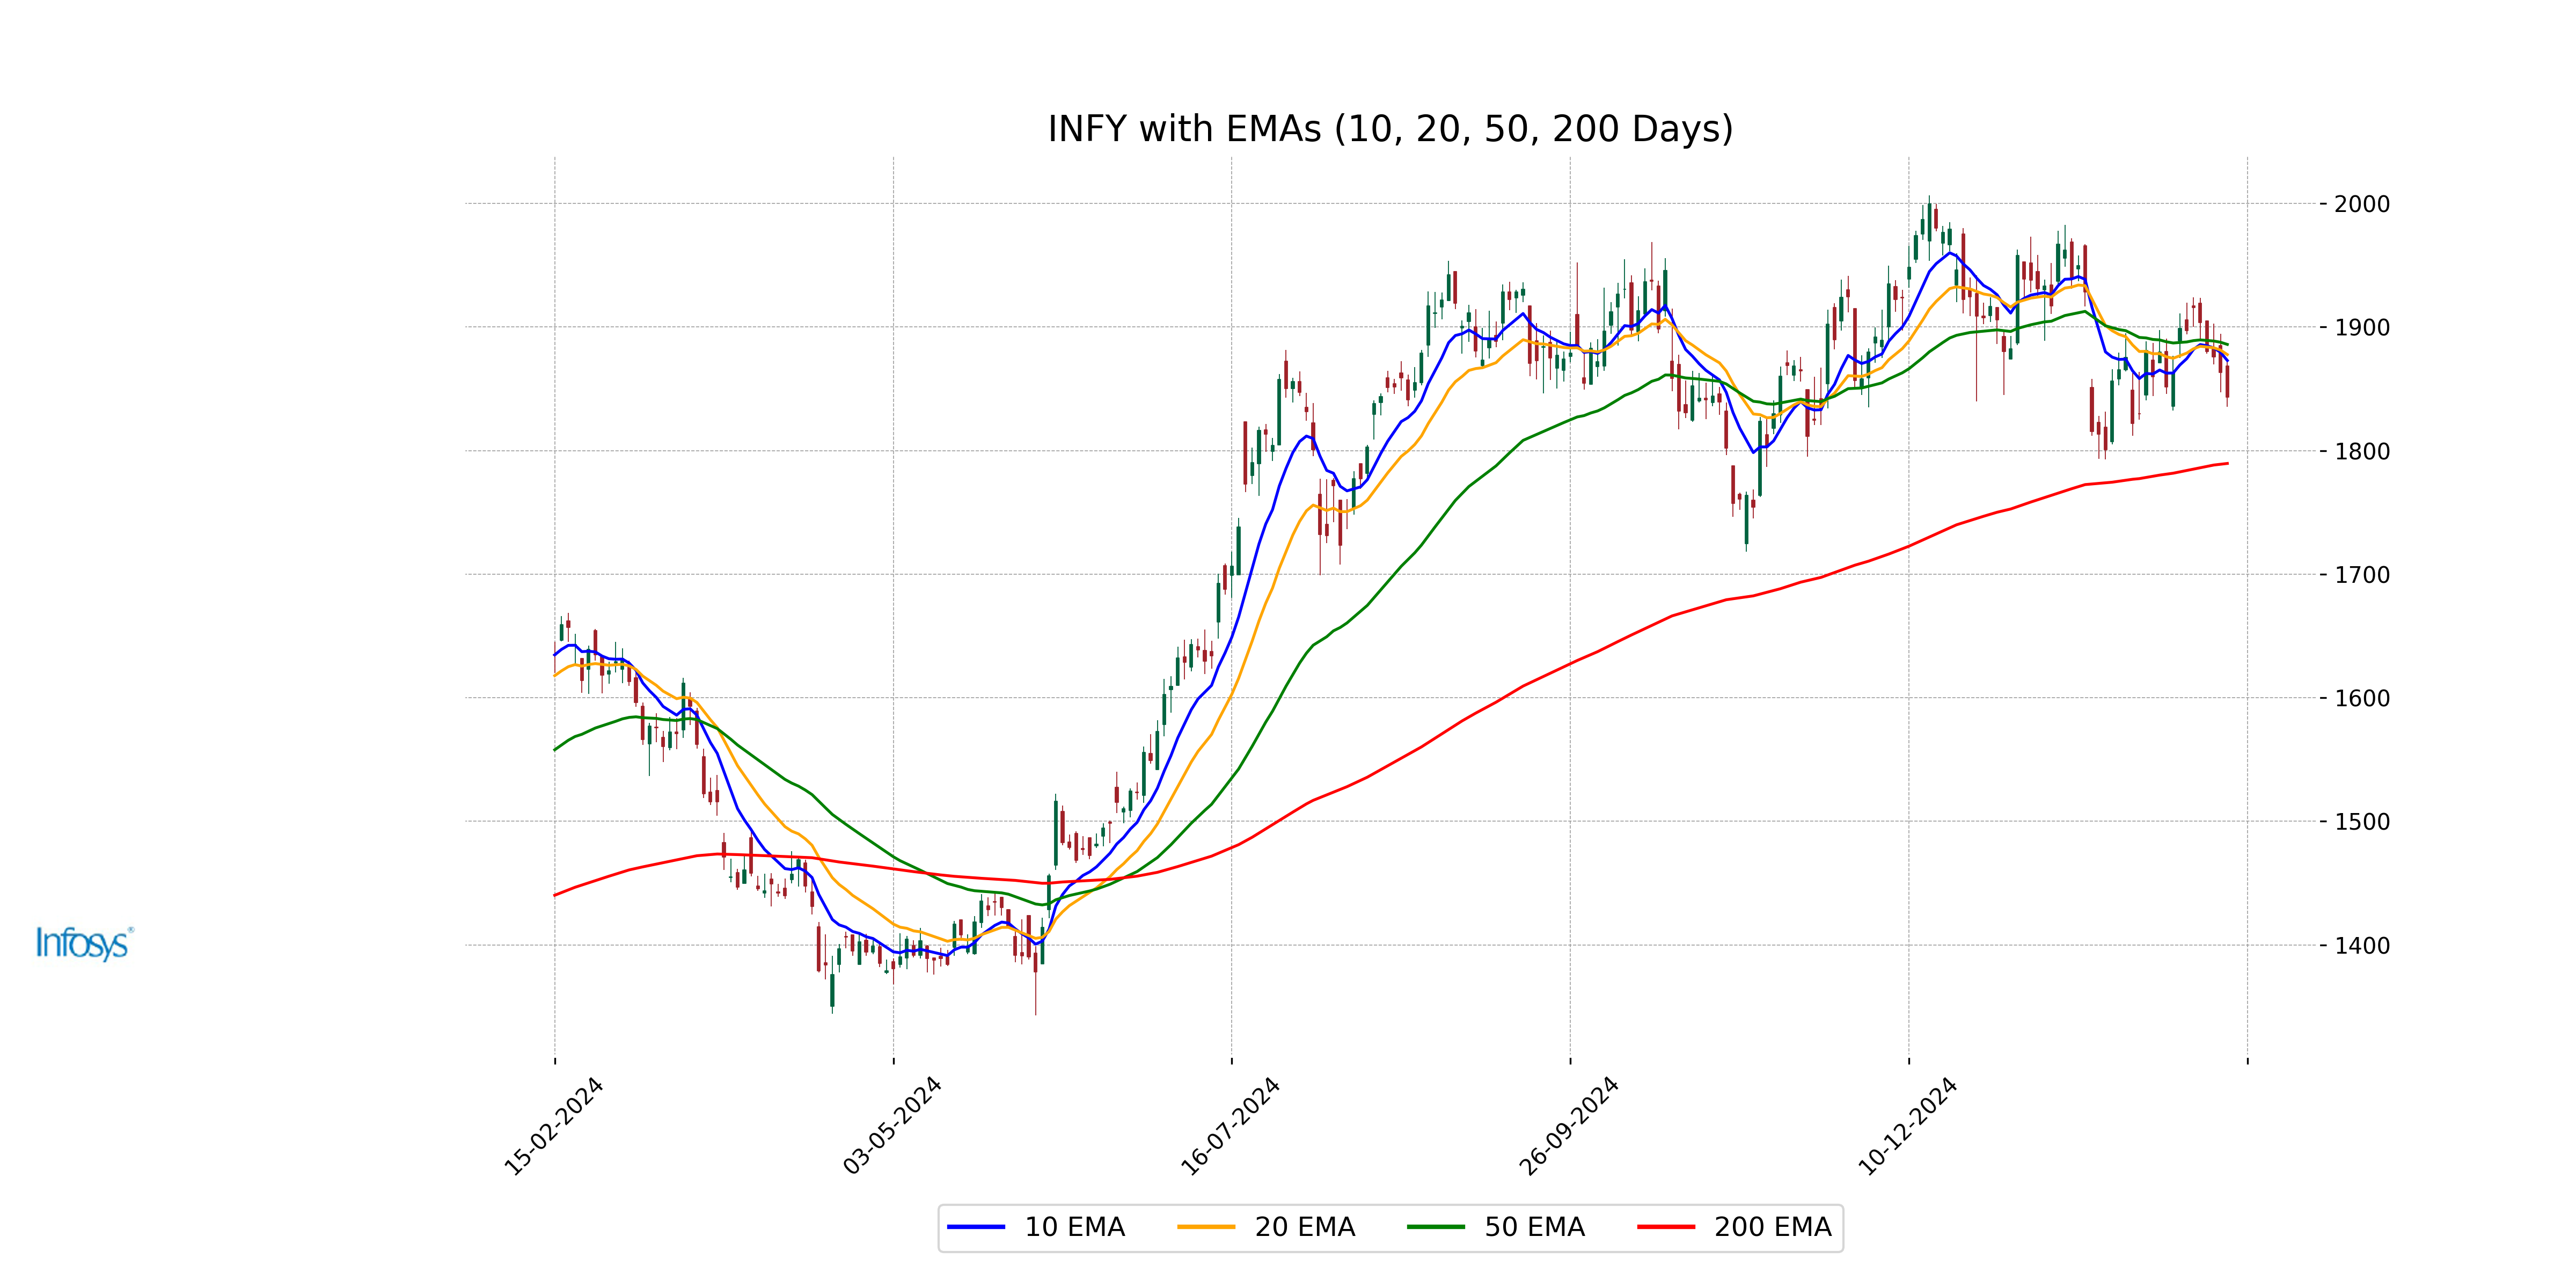
Relationship with Key Moving Averages
The closing price of Infosys at 1843.25 is below its 50-day EMA of 1885.96 and its 10-day EMA of 1872.93, indicating a potential bearish trend. However, the price remains above the 200-day EMA of 1789.62, suggesting a longer-term bullish outlook.
Moving Averages Trend (MACD)
Infosys's MACD is currently at -6.87, which is slightly below the MACD Signal of -6.82, indicating a bearish movement. This suggests that the stock might be experiencing downward momentum.
RSI Analysis
Infosys has an RSI of 42.84, which indicates that it is in a neutral to slightly oversold territory. This suggests there is a mild downward pressure in the stock price, but it's not yet in an oversold condition that typically suggests a buy opportunity. Investors might wait for further confirmation before making decisions.
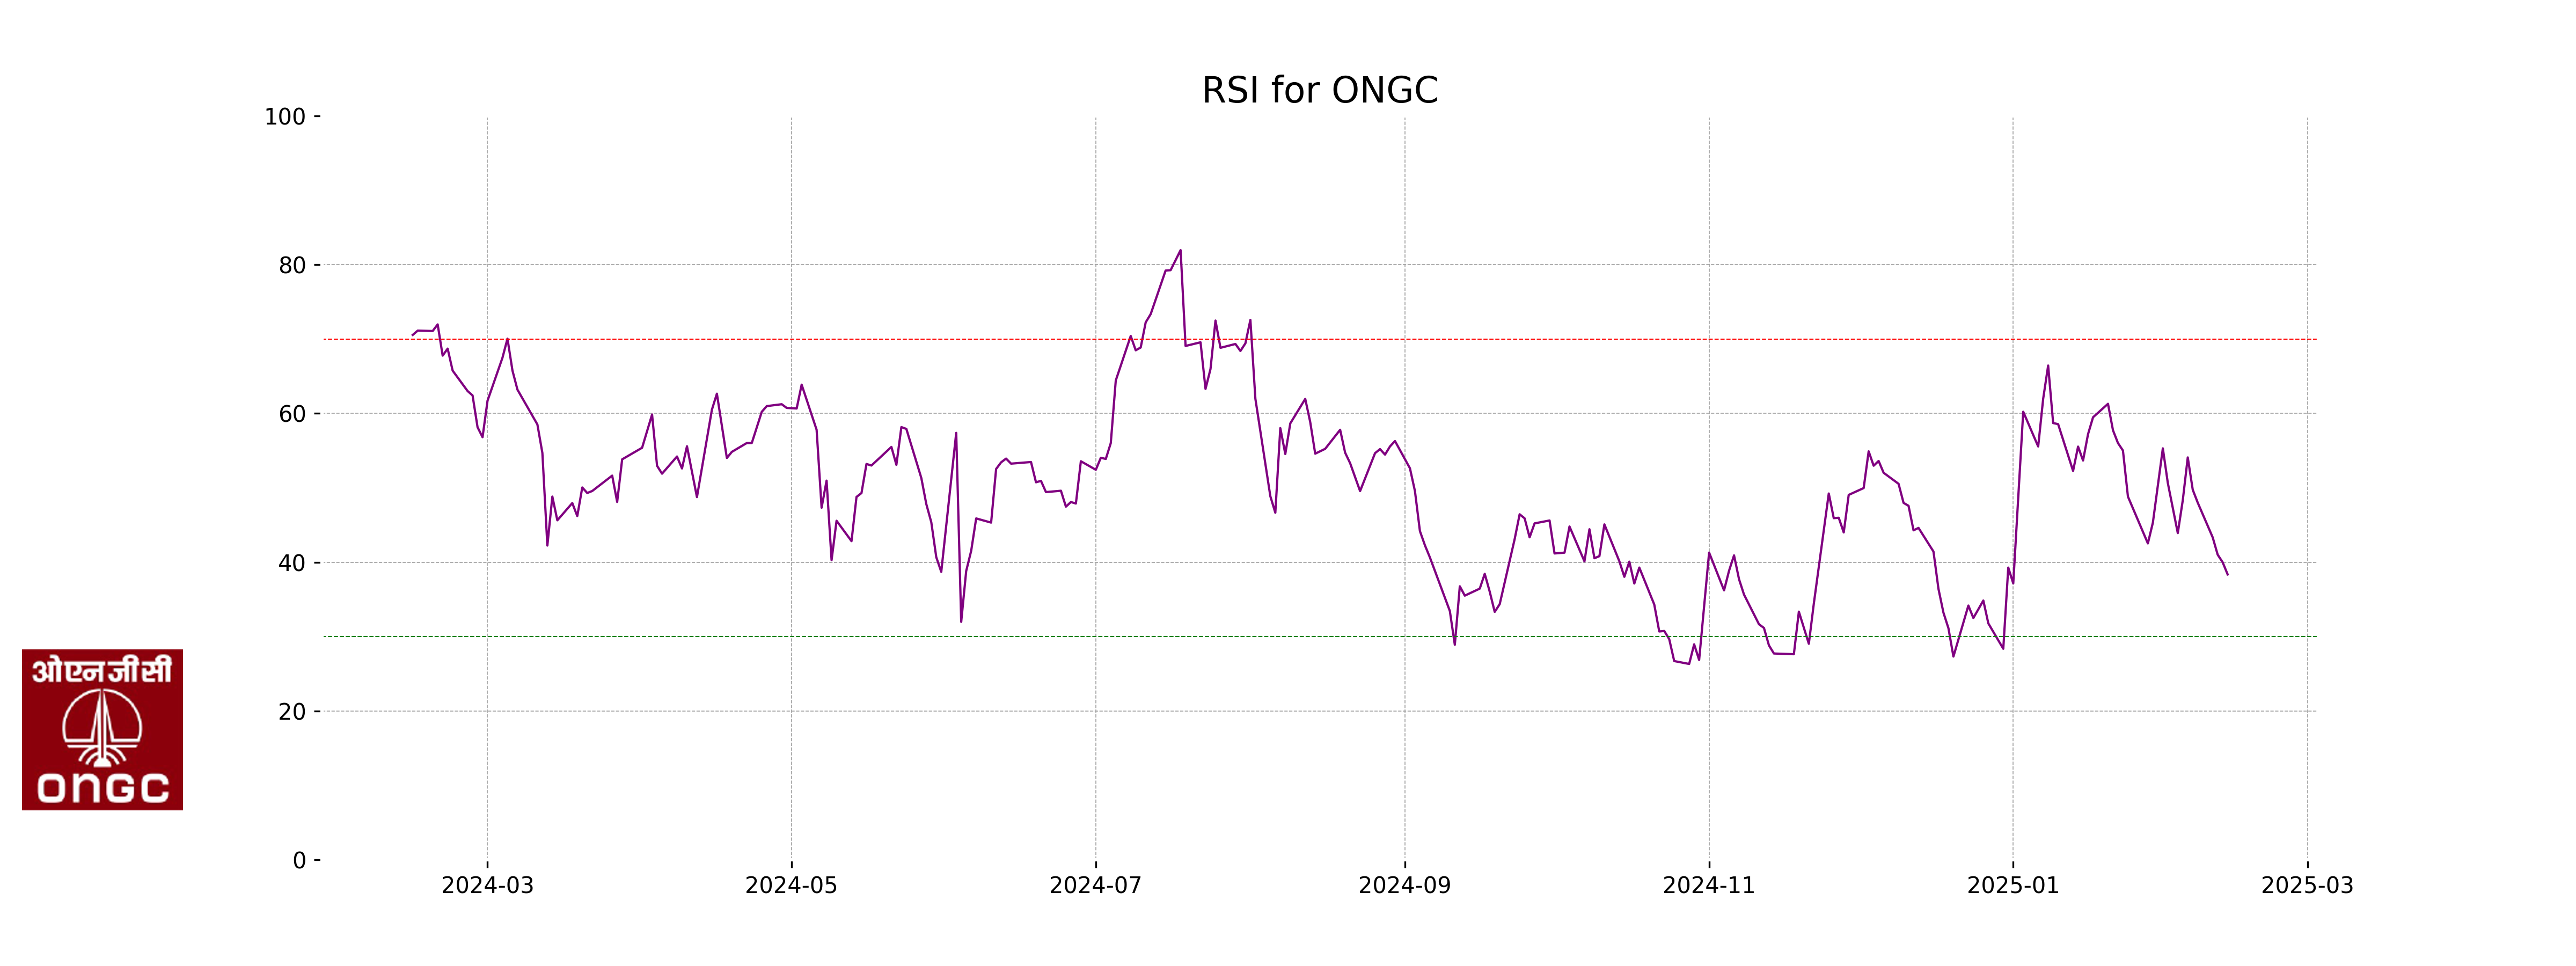
Analysis for ONGC - February 13, 2025
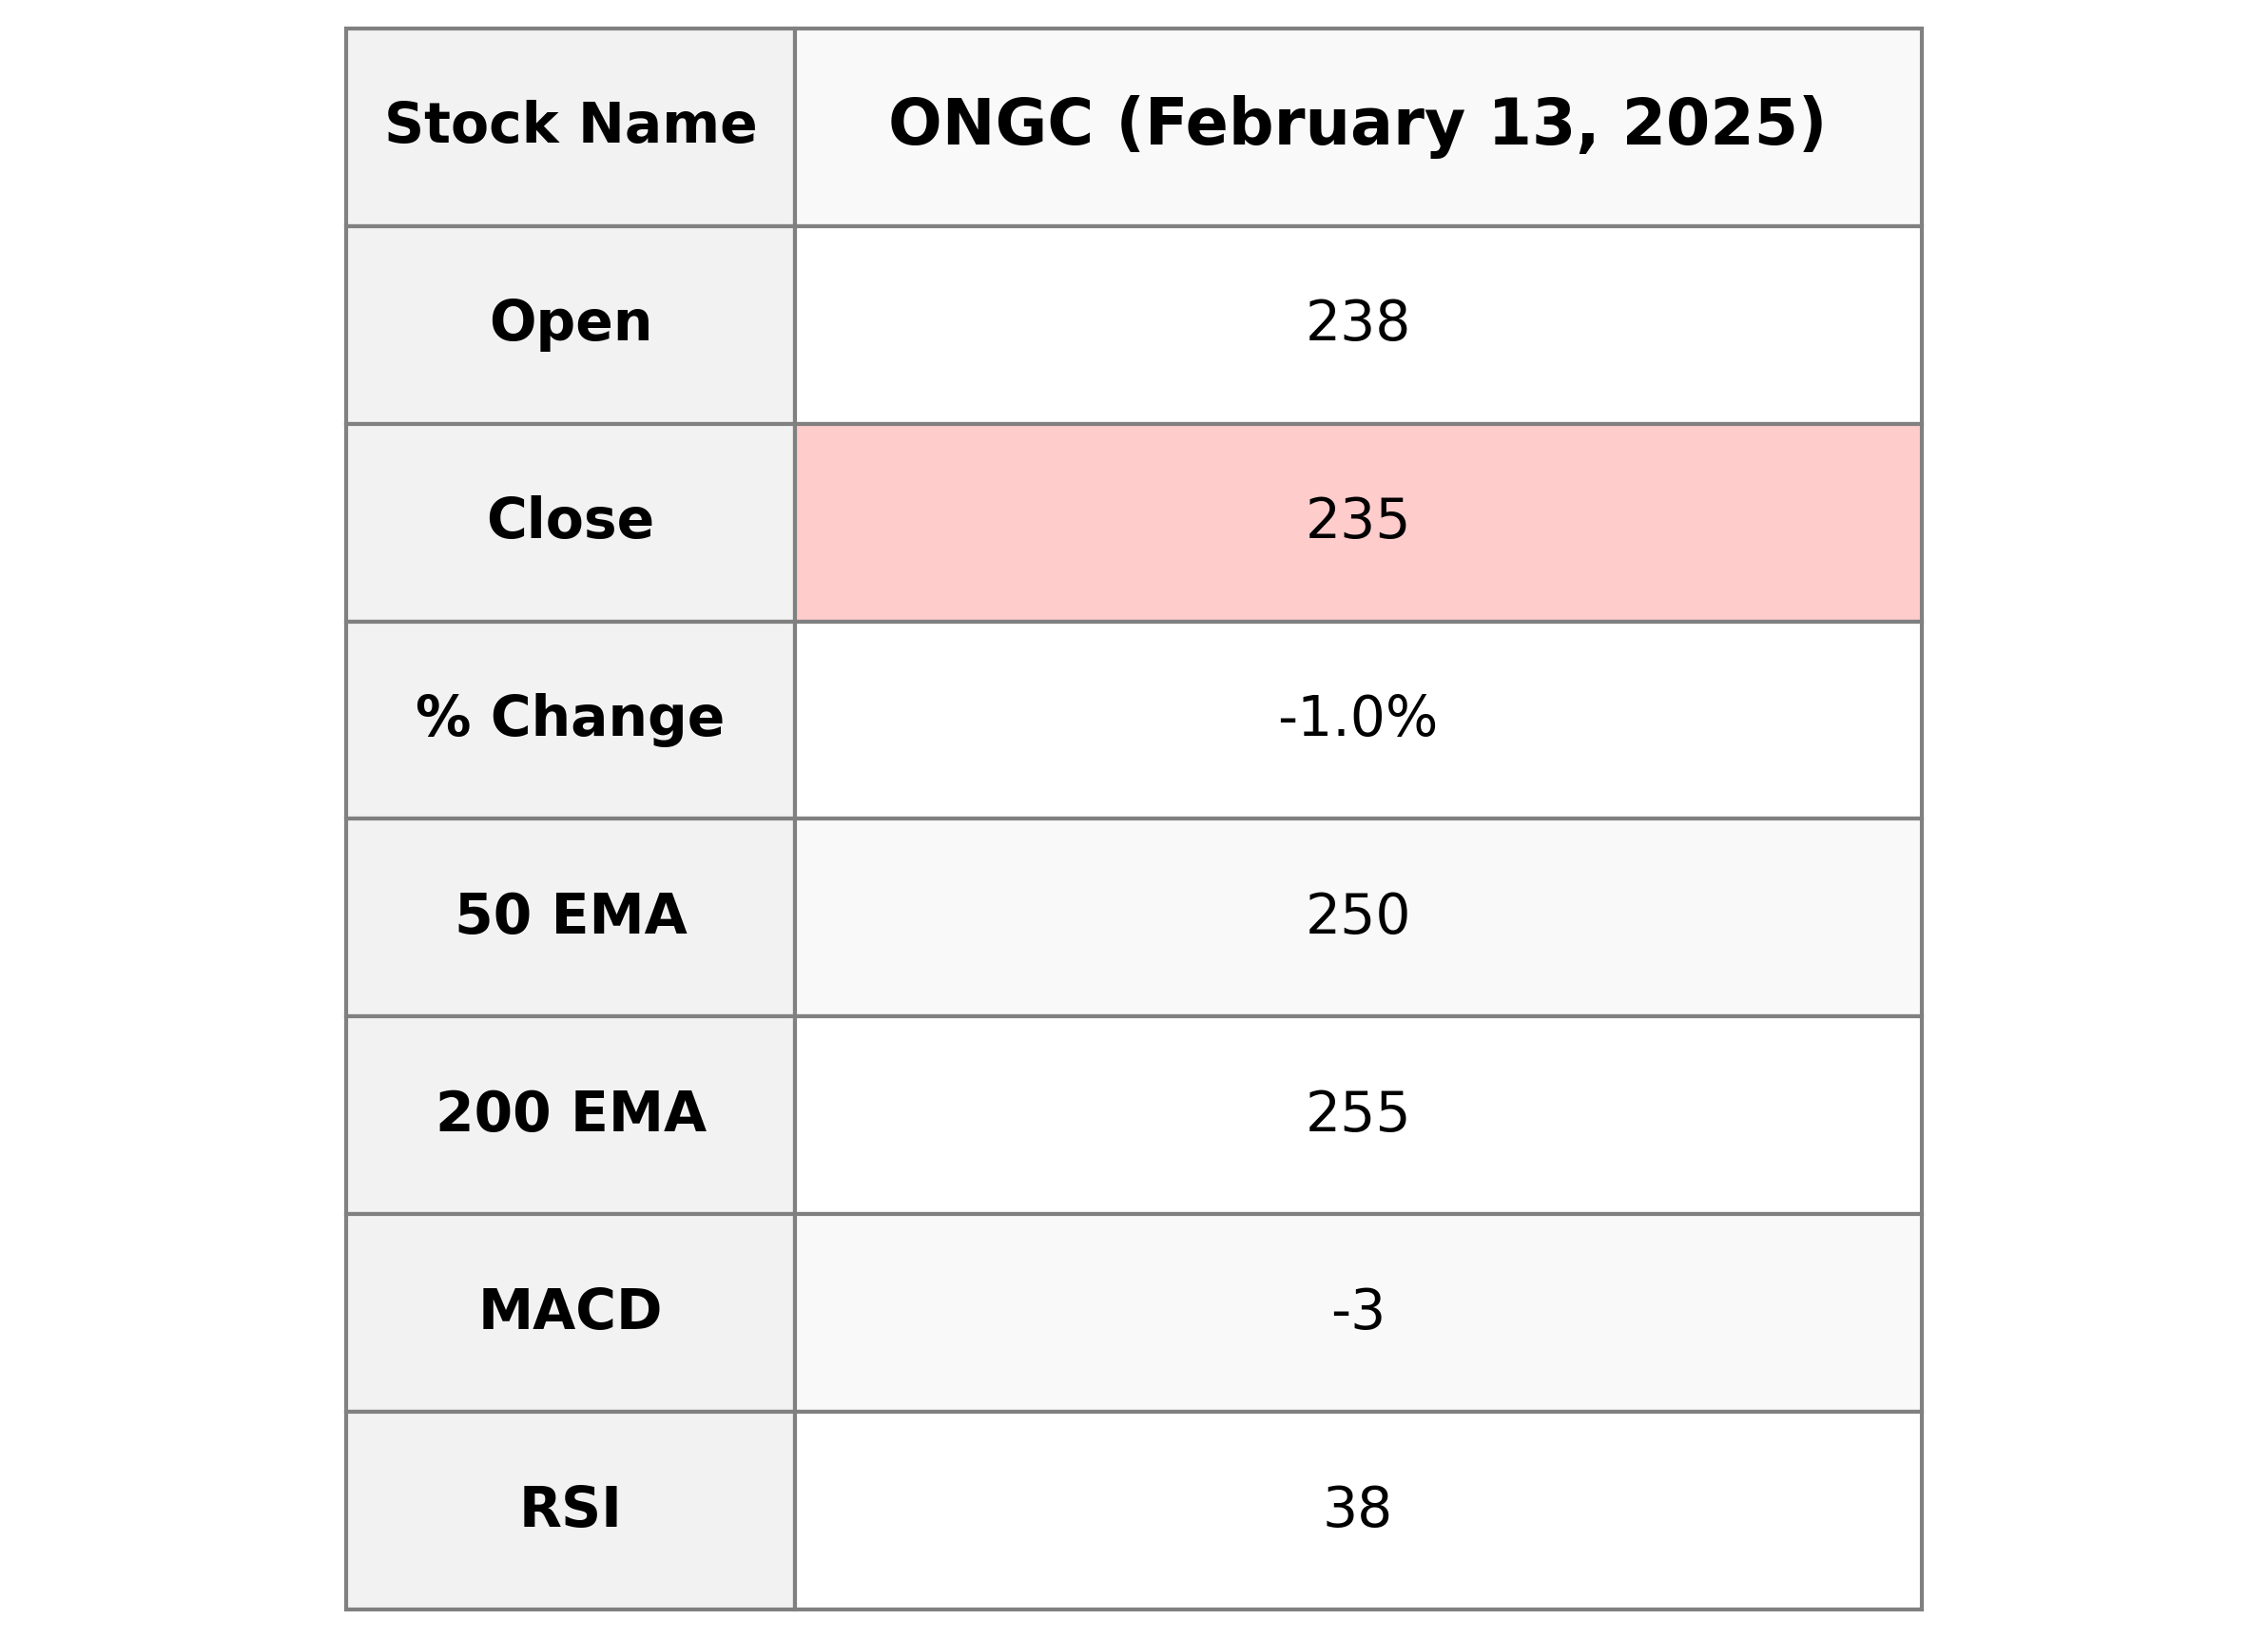
### ONGC Performance The stock of ONGC opened at 238.5 and closed at 234.95, marking a decline of approximately 1.03% from the previous close. The stock demonstrates a bearish trend with crucial indicators like RSI at 38.36 and MACD at -3.04, both indicating potential overselling or downward pressure in the current market conditions. With a PE ratio of 7.58, ONGC is part of the Energy sector, specifically within the Oil & Gas Integrated industry in India.
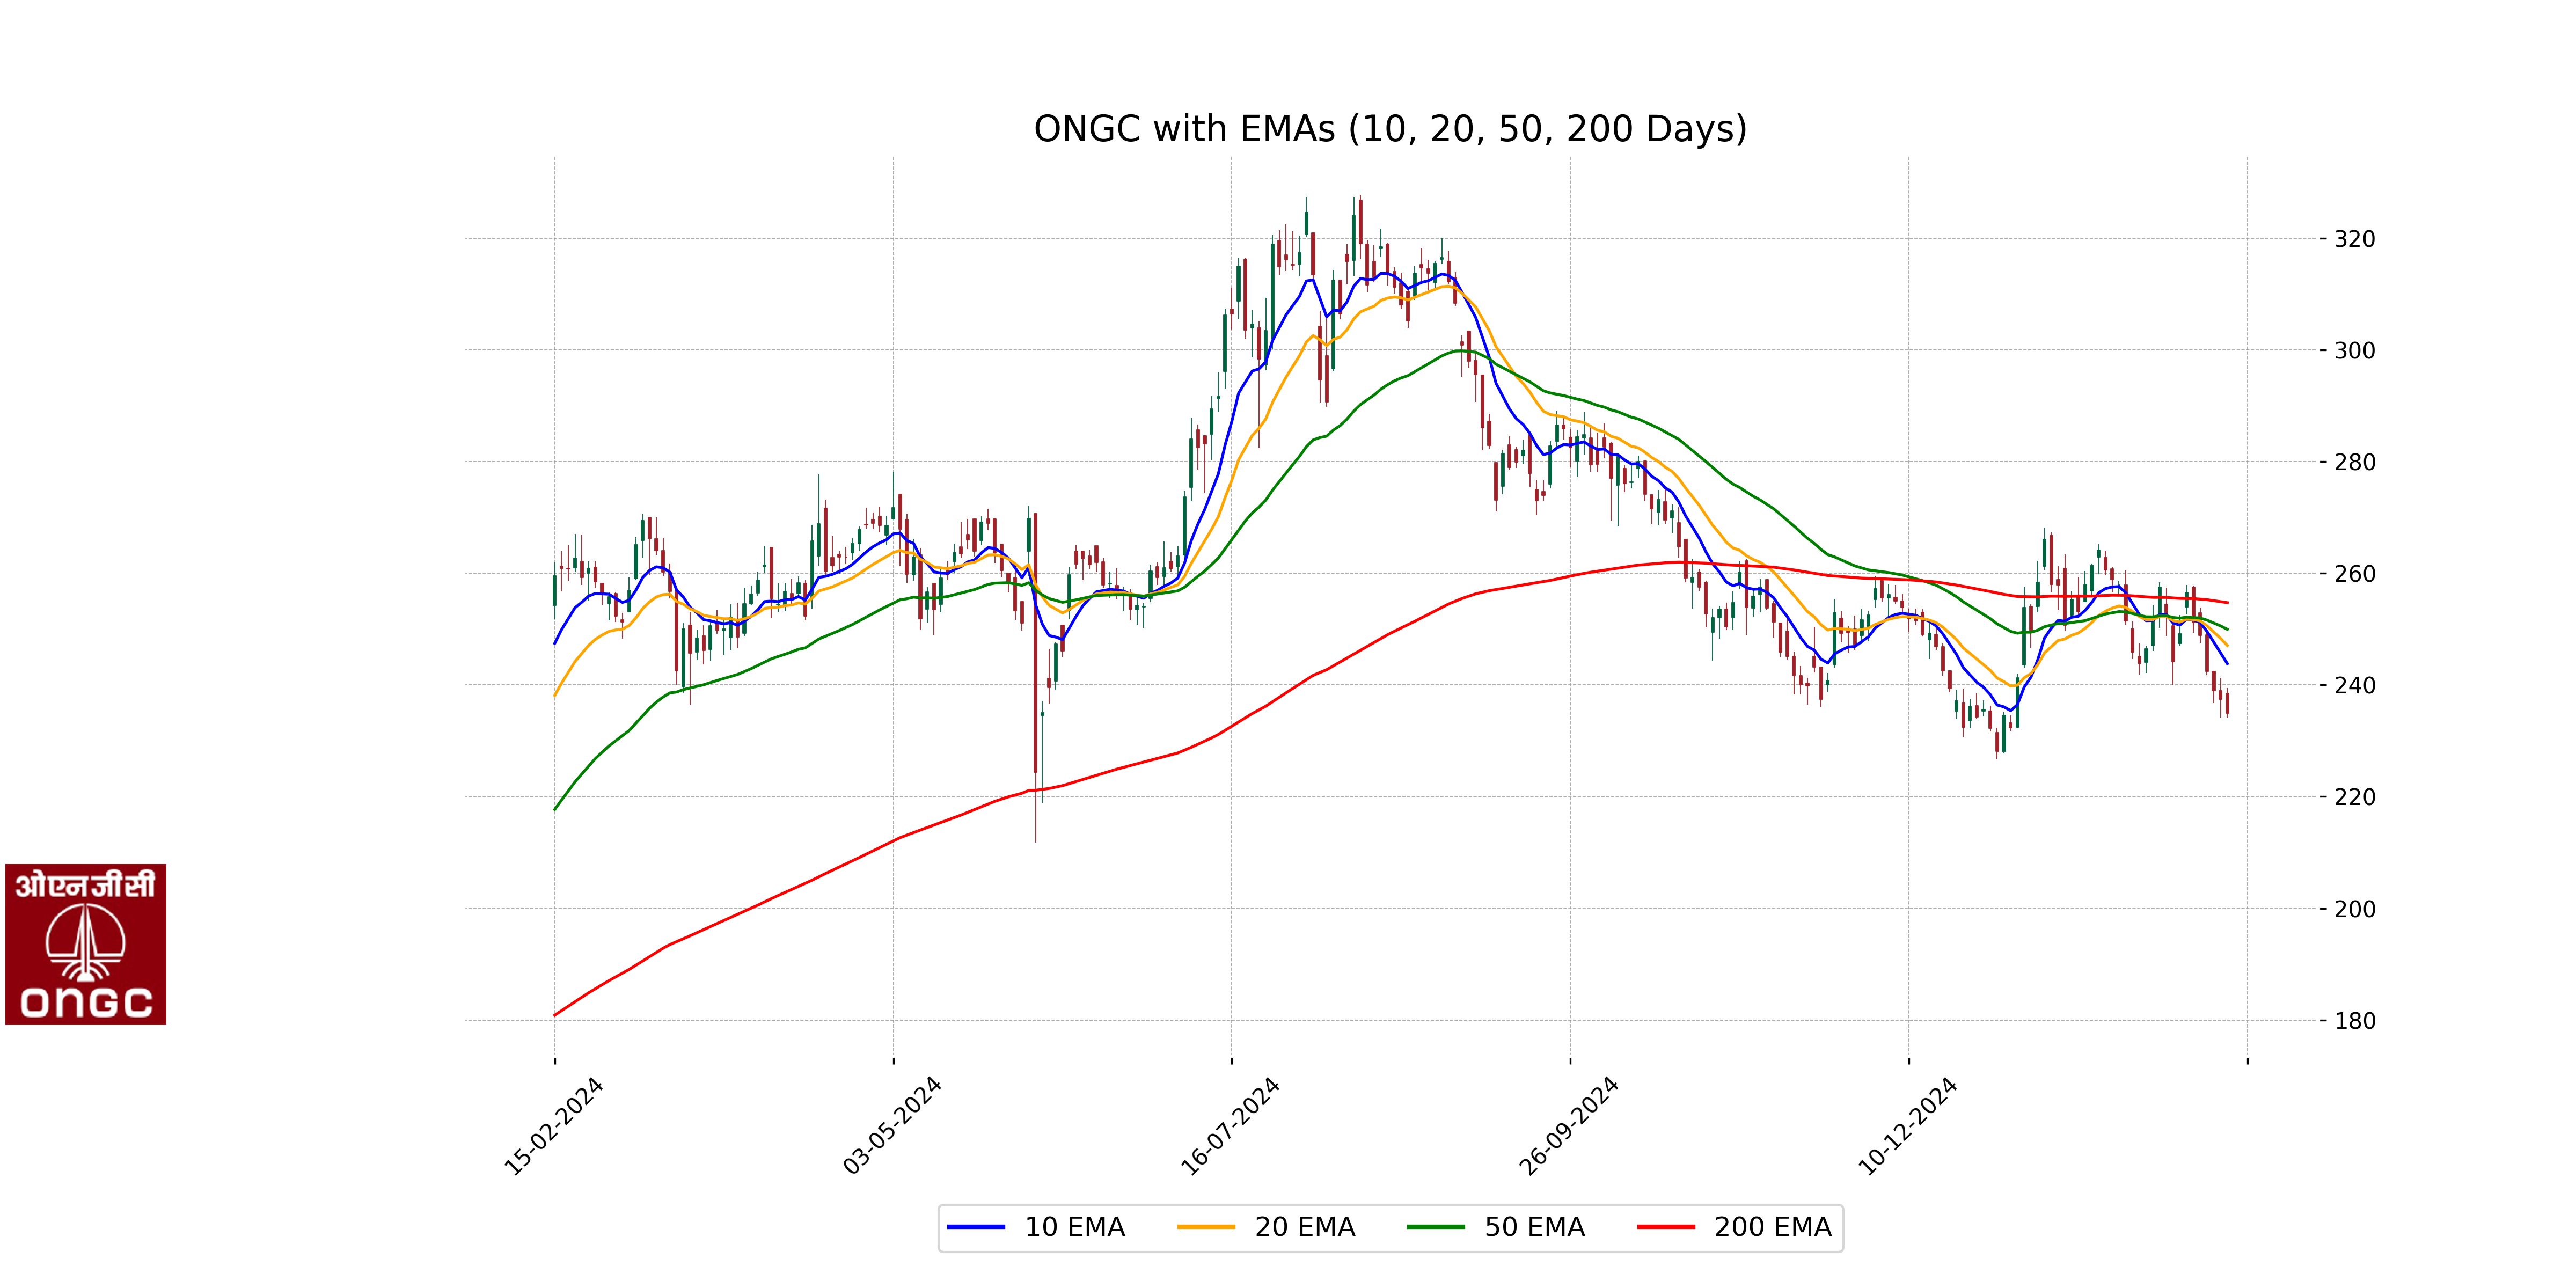
Relationship with Key Moving Averages
The closing price of ONGC at 234.95 is below its 50 EMA at 249.96 and 200 EMA at 254.73, indicating a bearish trend. Furthermore, it's also below the 10 EMA at 243.81 and 20 EMA at 247.06, suggesting short-term downward pressure in the price movement.
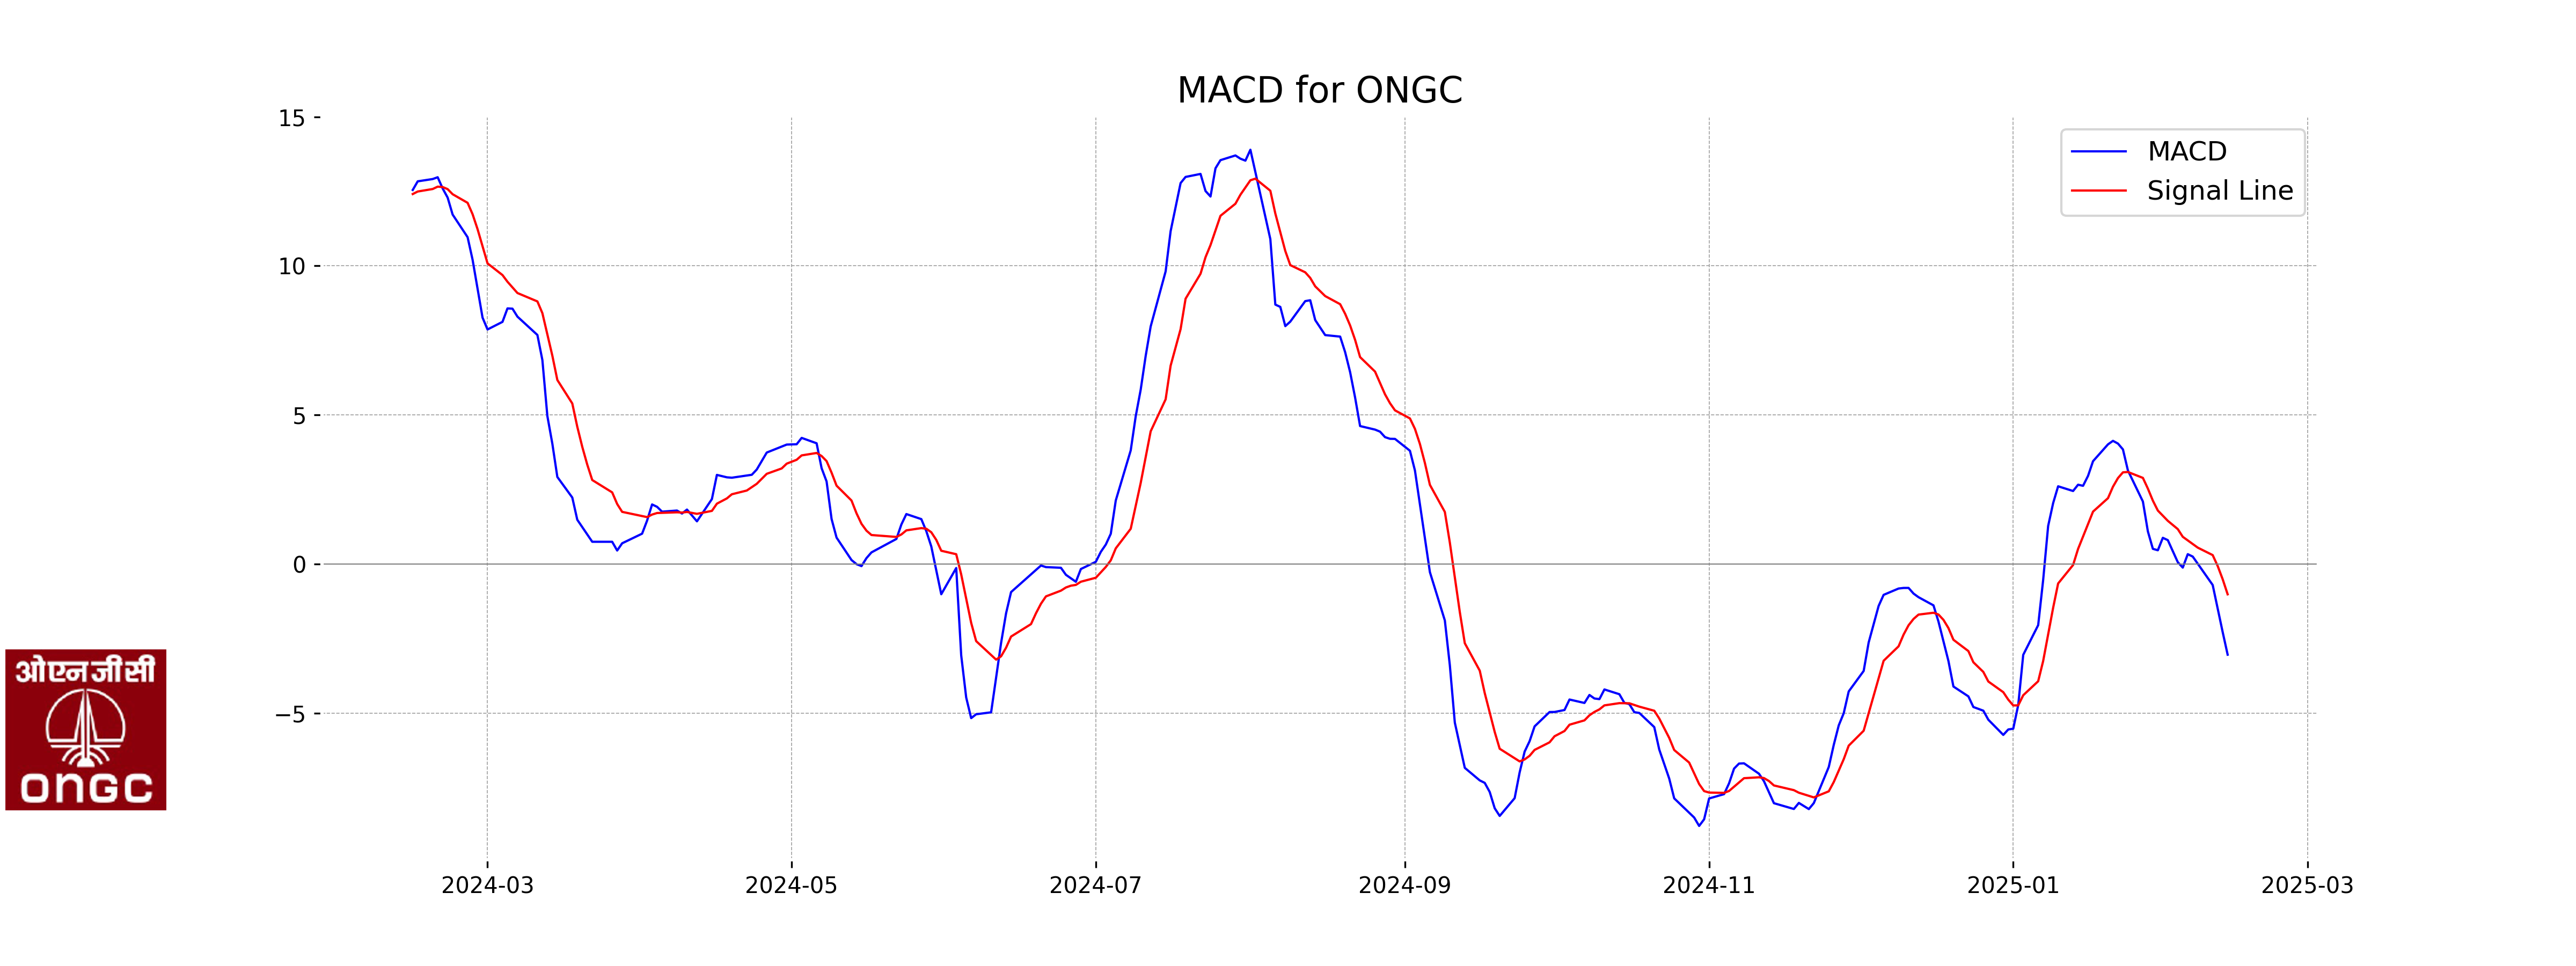
Moving Averages Trend (MACD)
The MACD for ONGC indicates a bearish trend, with a MACD value of -3.0424 compared to the MACD Signal of -1.0167. This suggests increasing selling pressure.
RSI Analysis
**RSI Analysis for ONGC:** The RSI value for ONGC is 38.36, indicating that the stock is approaching oversold territory. This suggests some potential for upside movement if the selling pressure eases, but caution is advised as it may signal a bearish momentum.