NSE Nifty 50 Top losers: What are the 5 Biggest Stock losers Today April 15, 2025
In this article, we will explore the technical indicators of some of the low-performing stocks on the Indian stock market, including HINDUNILVR, and ITC.
By looking at these stocks through the lens of key technical factors, we aim to better understand their price movements, trends, and potential future performance.
Analysis for Hindustan Unilever - April 15, 2025
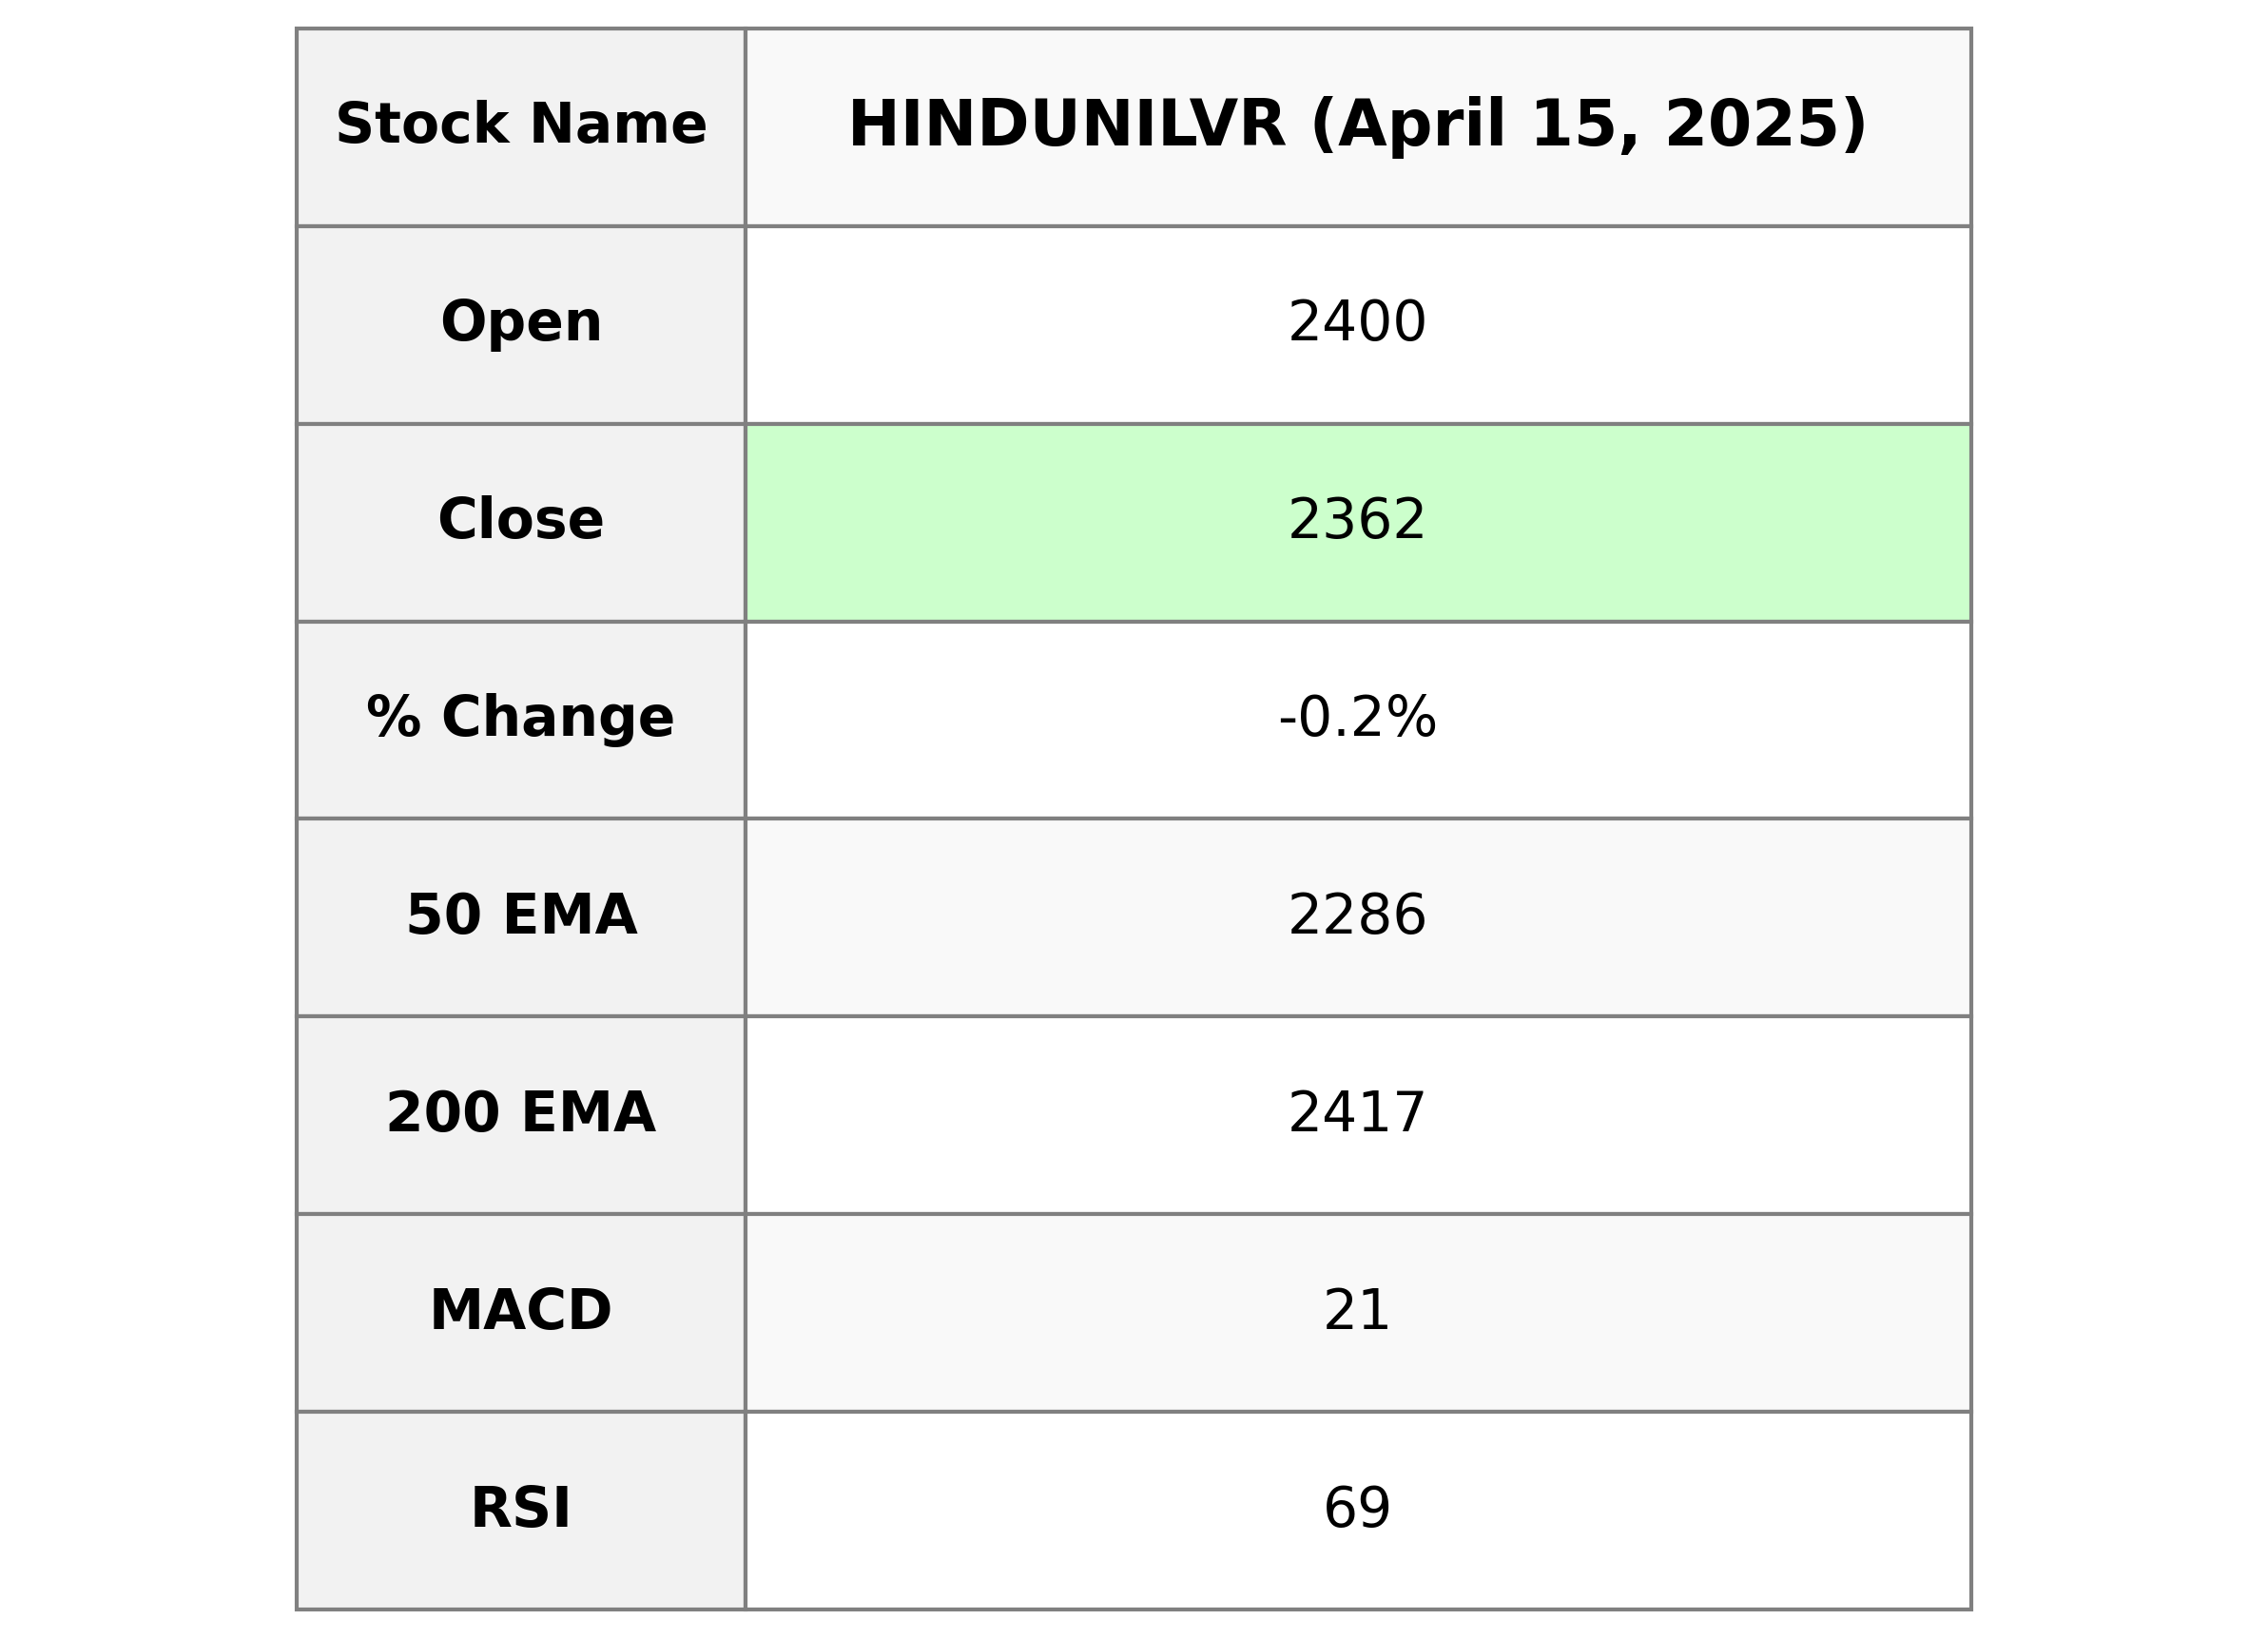
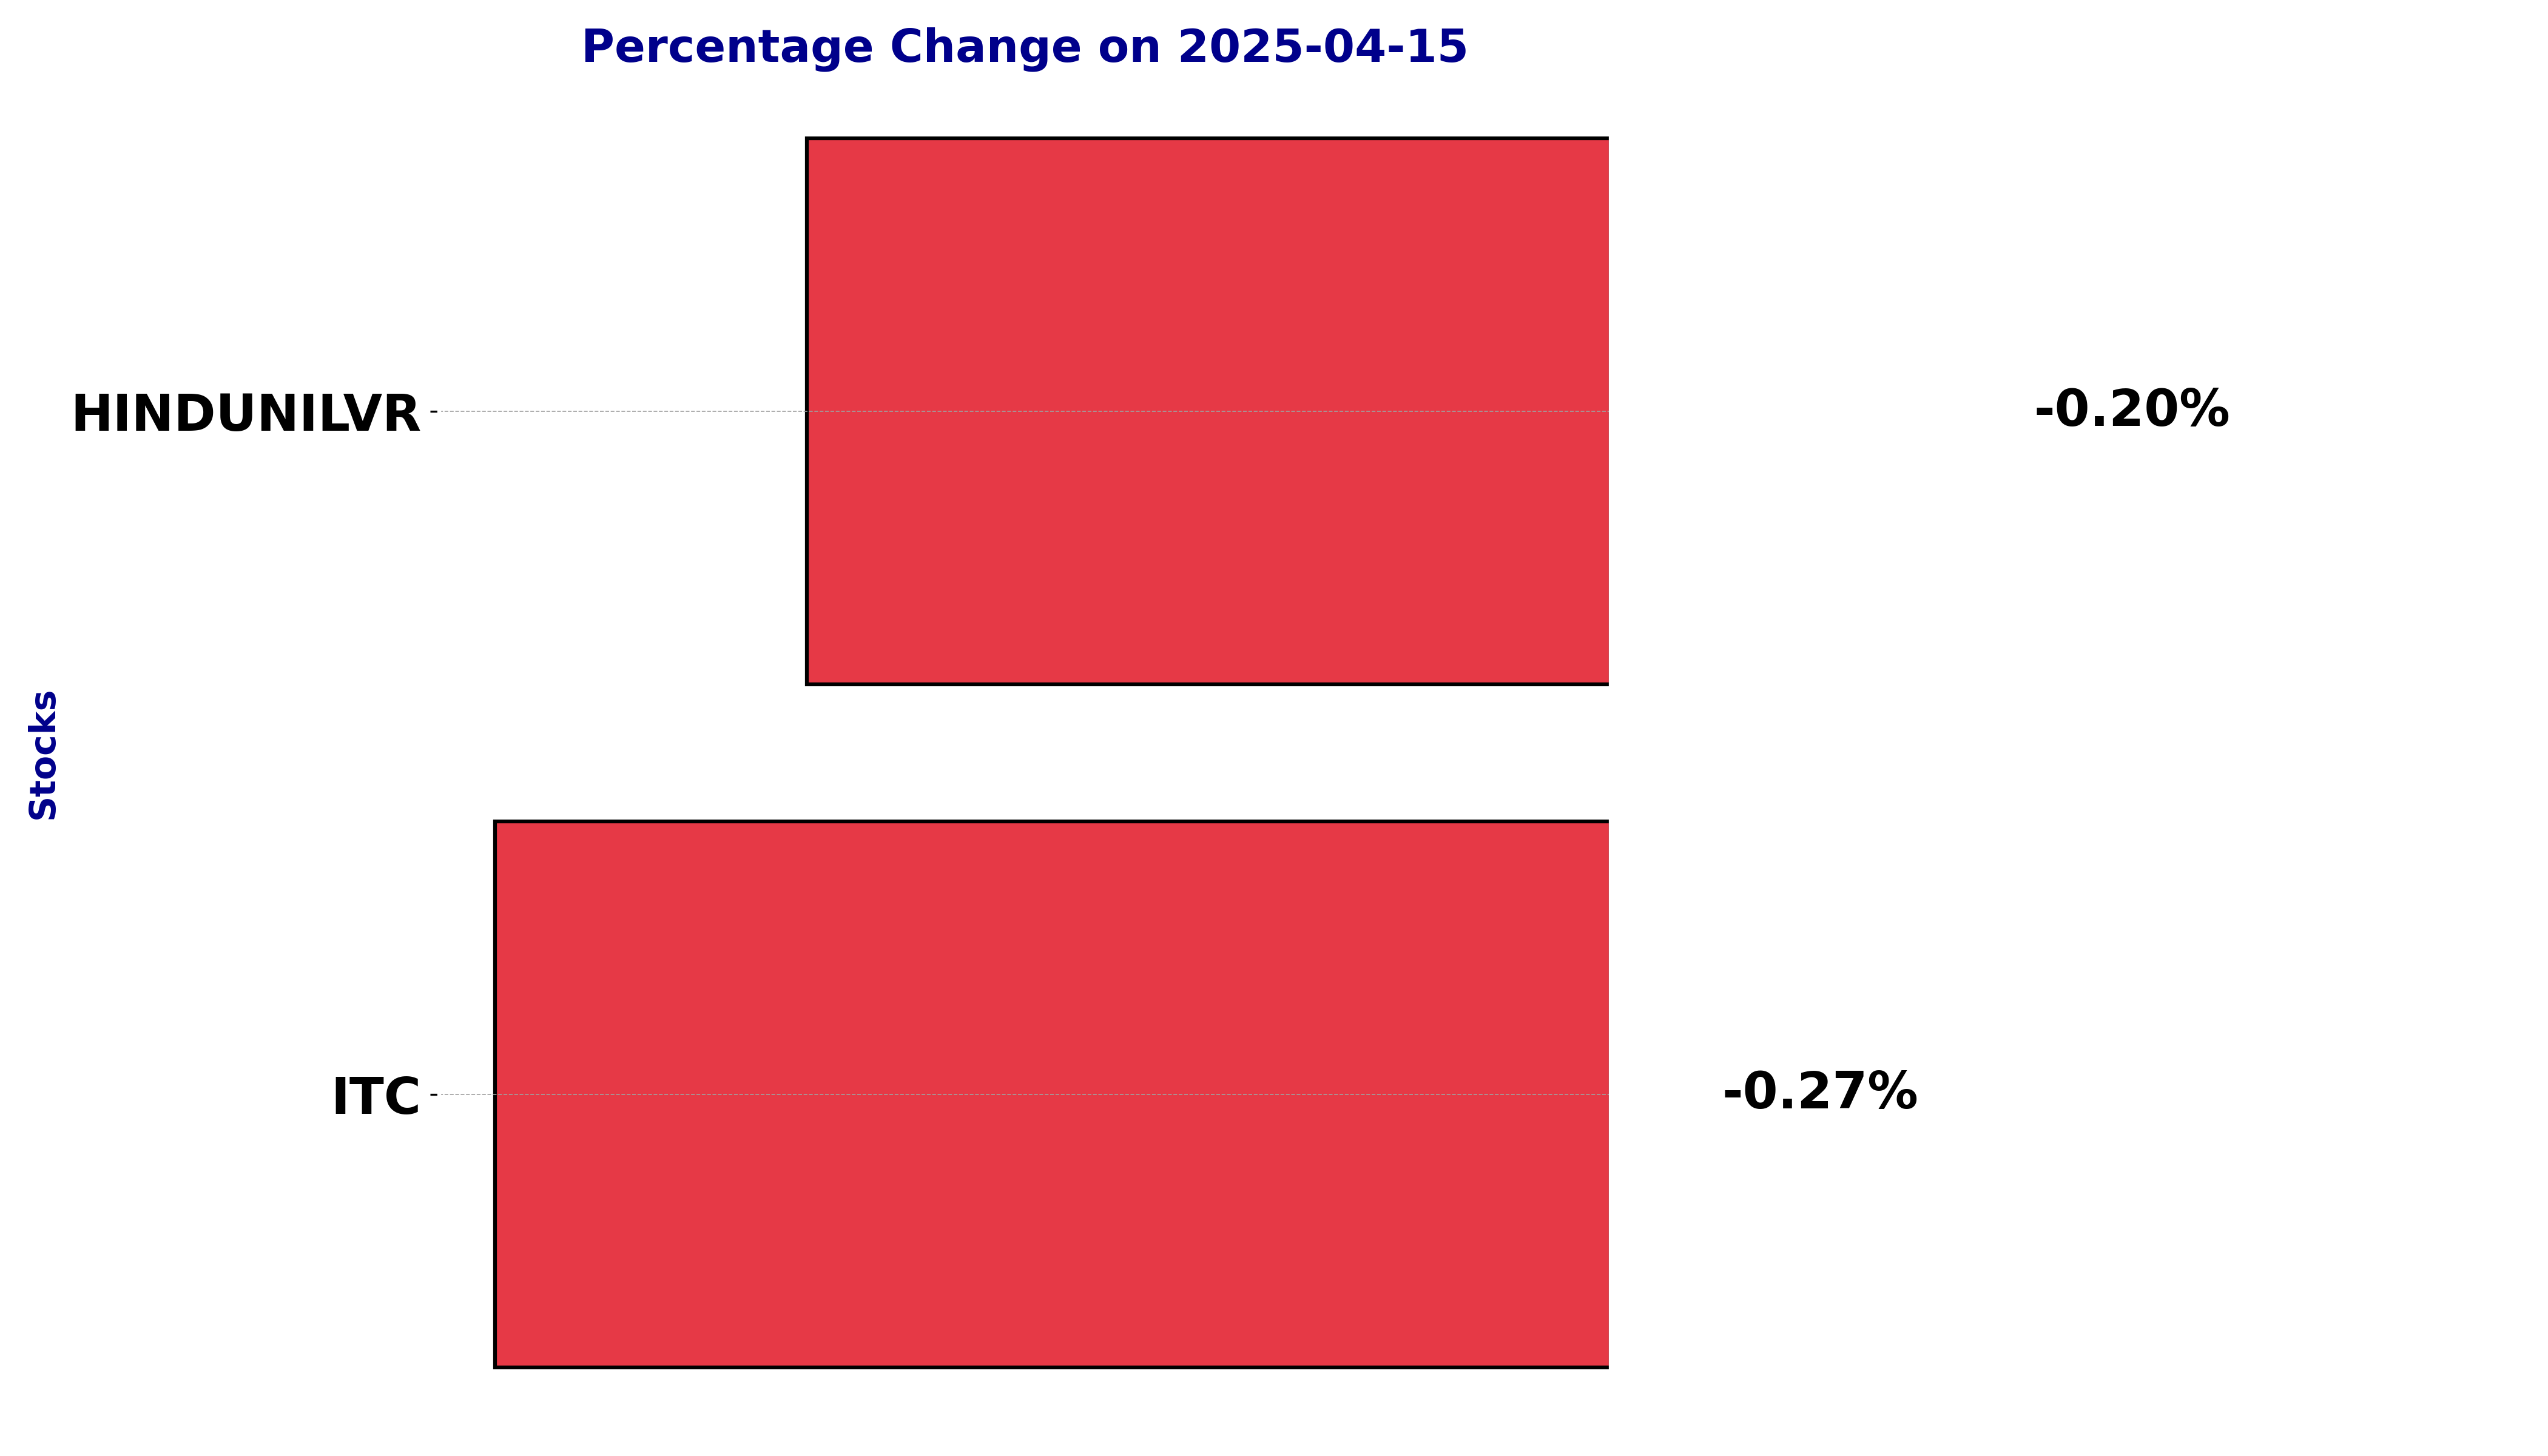
Hindustan Unilever is a prominent player in the Consumer Defensive sector, specializing in Household & Personal Products in India. With a slight negative change in its daily percentage change (-0.20%) and points change (-4.65) from the previous close, the stock closed at 2361.5. Despite short-term fluctuations, the company demonstrates financial health with a substantial market cap of approximately 5.55 trillion and robust metrics such as a PE Ratio of 51.71 and an EPS of 45.67. The RSI value suggests that the stock is nearing overbought levels, indicating strong investor interest.
Relationship with Key Moving Averages
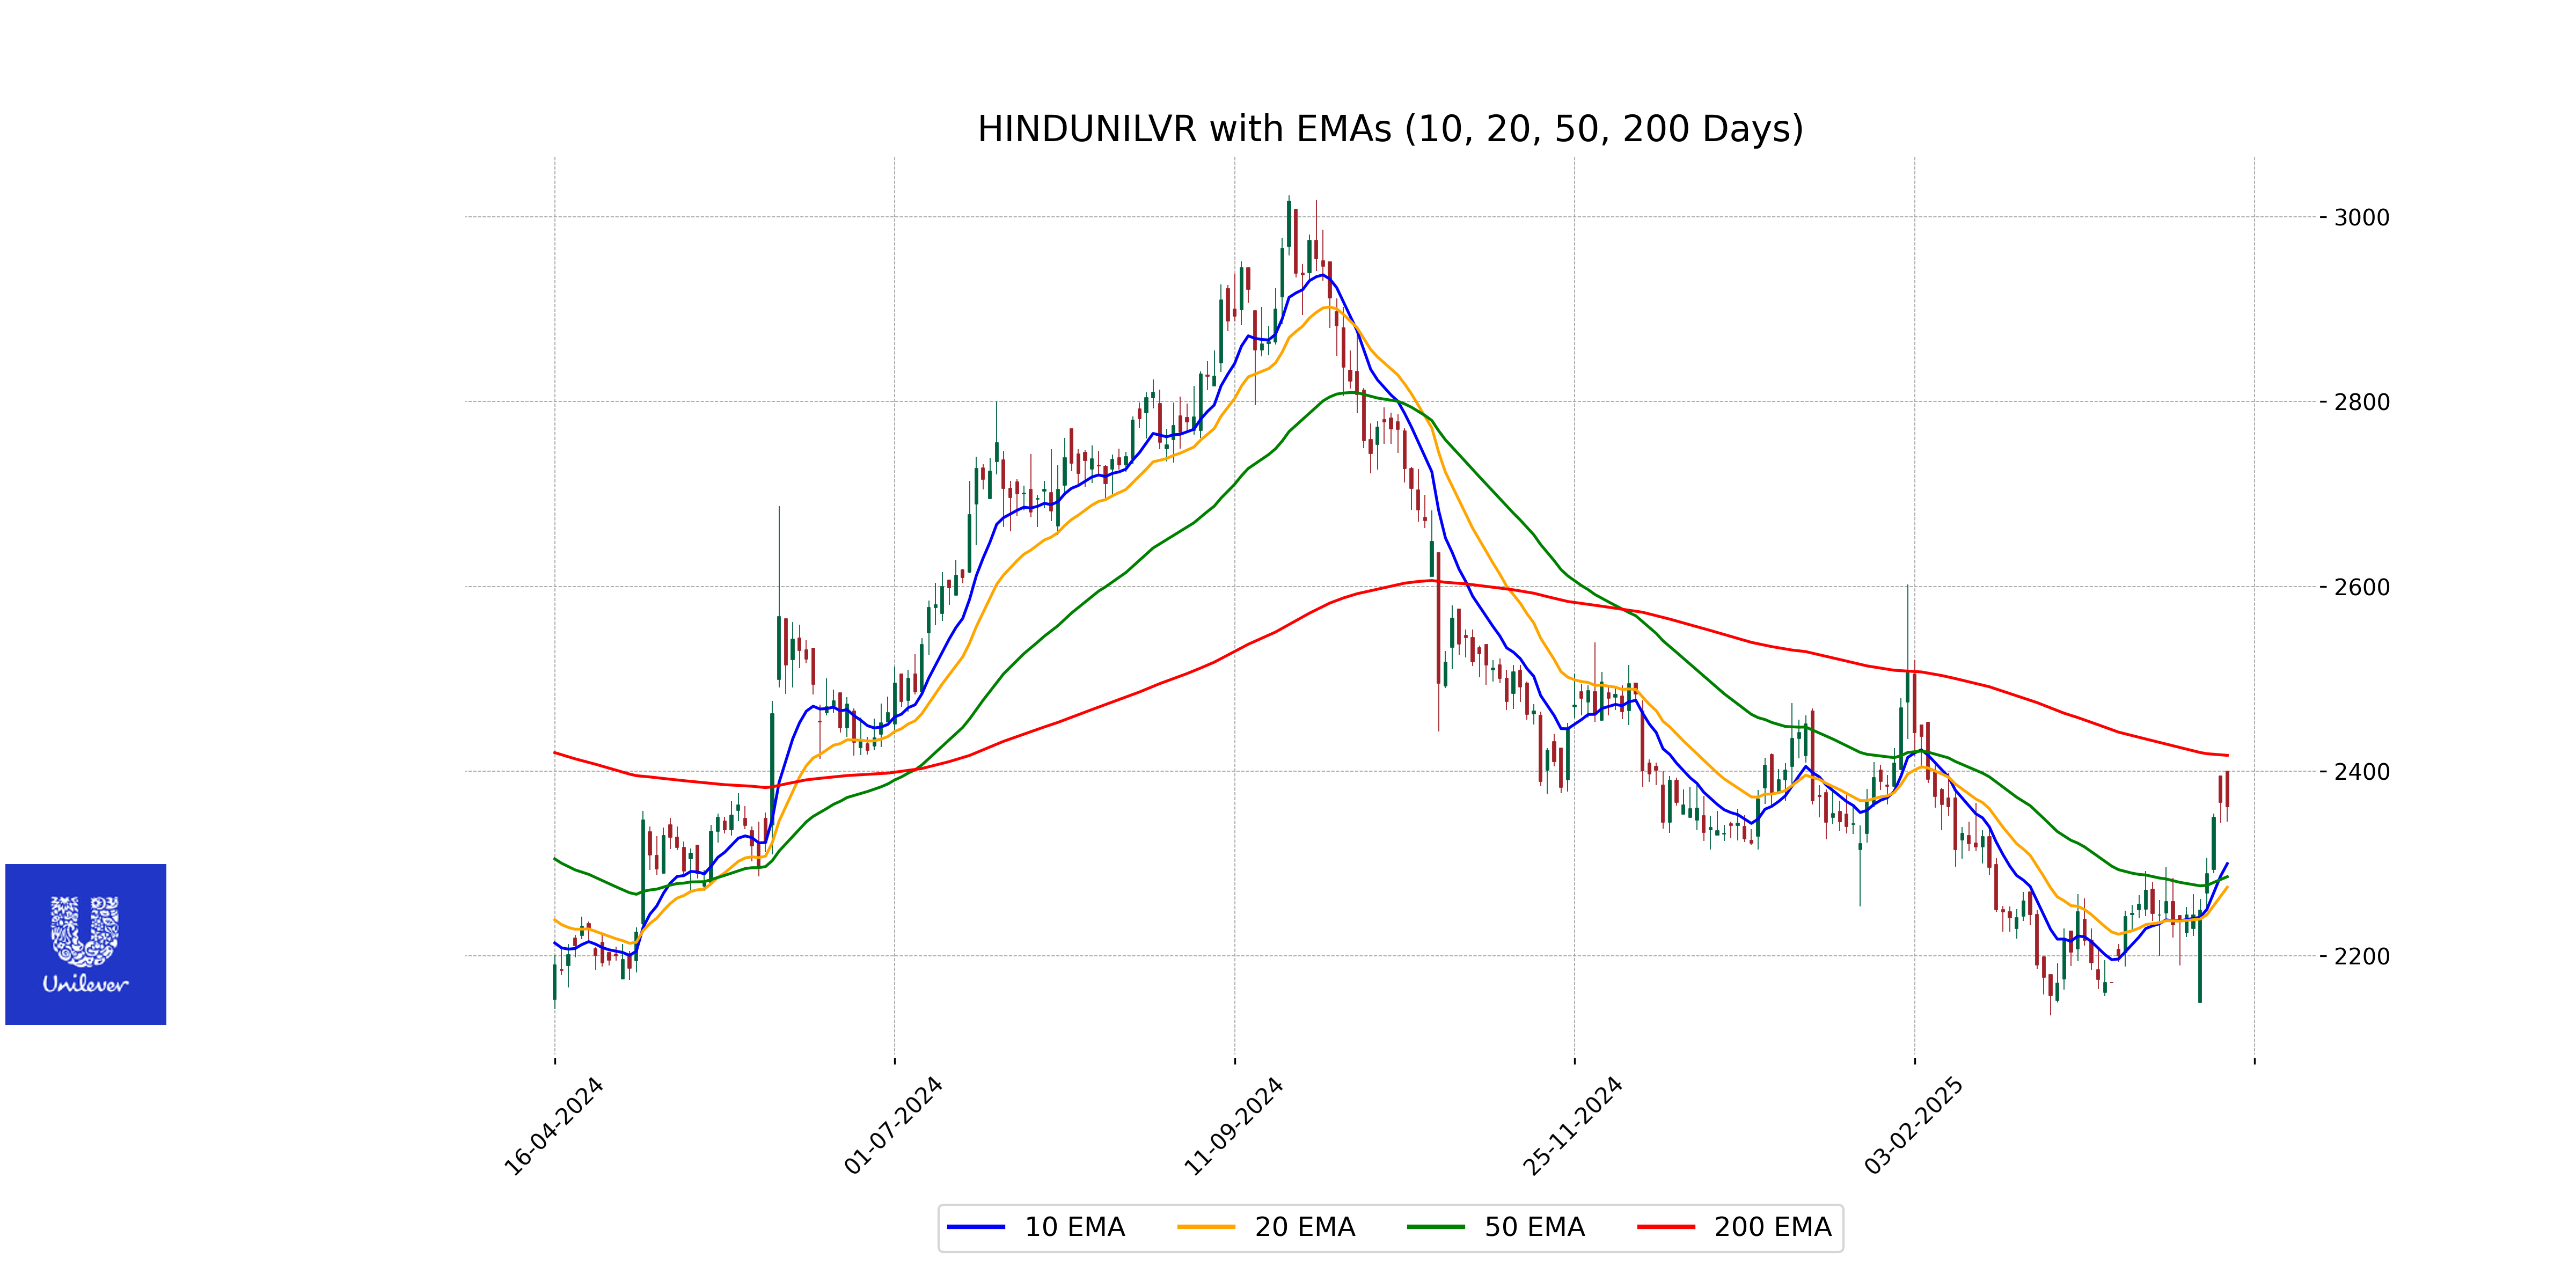
Hindustan Unilever's current stock price is trading below the 200 EMA, indicating a potential bearish trend in the longer timeframe. However, the close price is above both the 50 EMA and the 10 EMA, suggesting a short-term recovery or support level.
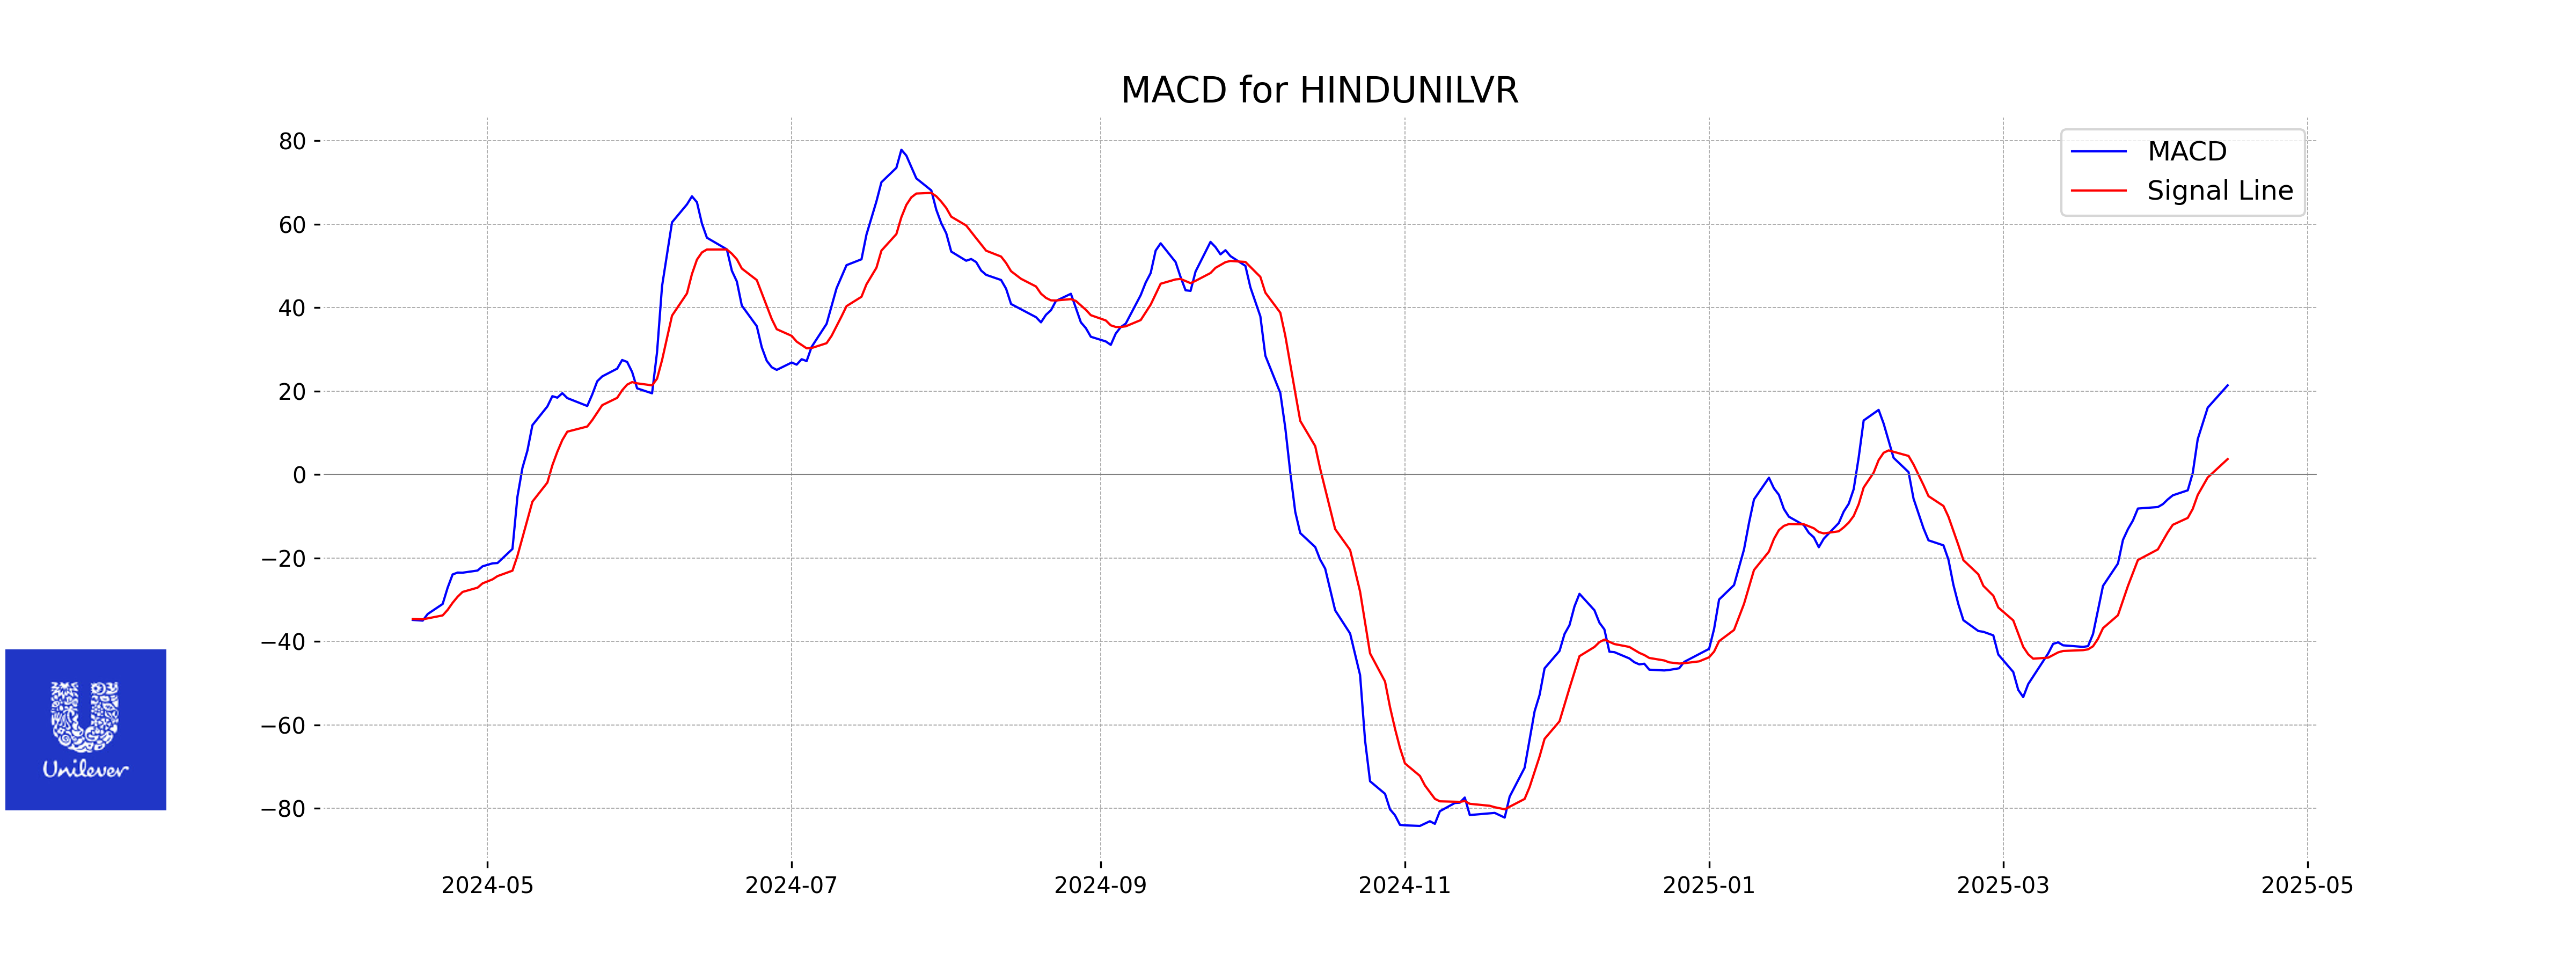
Moving Averages Trend (MACD)
Hindustan Unilever's MACD indicator shows a value of 21.408, which is significantly higher than the MACD Signal of 3.736. This suggests that the stock may currently be experiencing bullish momentum, indicating potential upward price movement.
RSI Analysis
Hindustan Unilever currently has an RSI of 68.68, indicating that it is approaching the overbought territory, which typically starts above 70. This suggests that the stock might be experiencing strong bullish momentum, but investors should be cautious of potential pullbacks if the RSI continues to rise.

Analysis for ITC - April 15, 2025
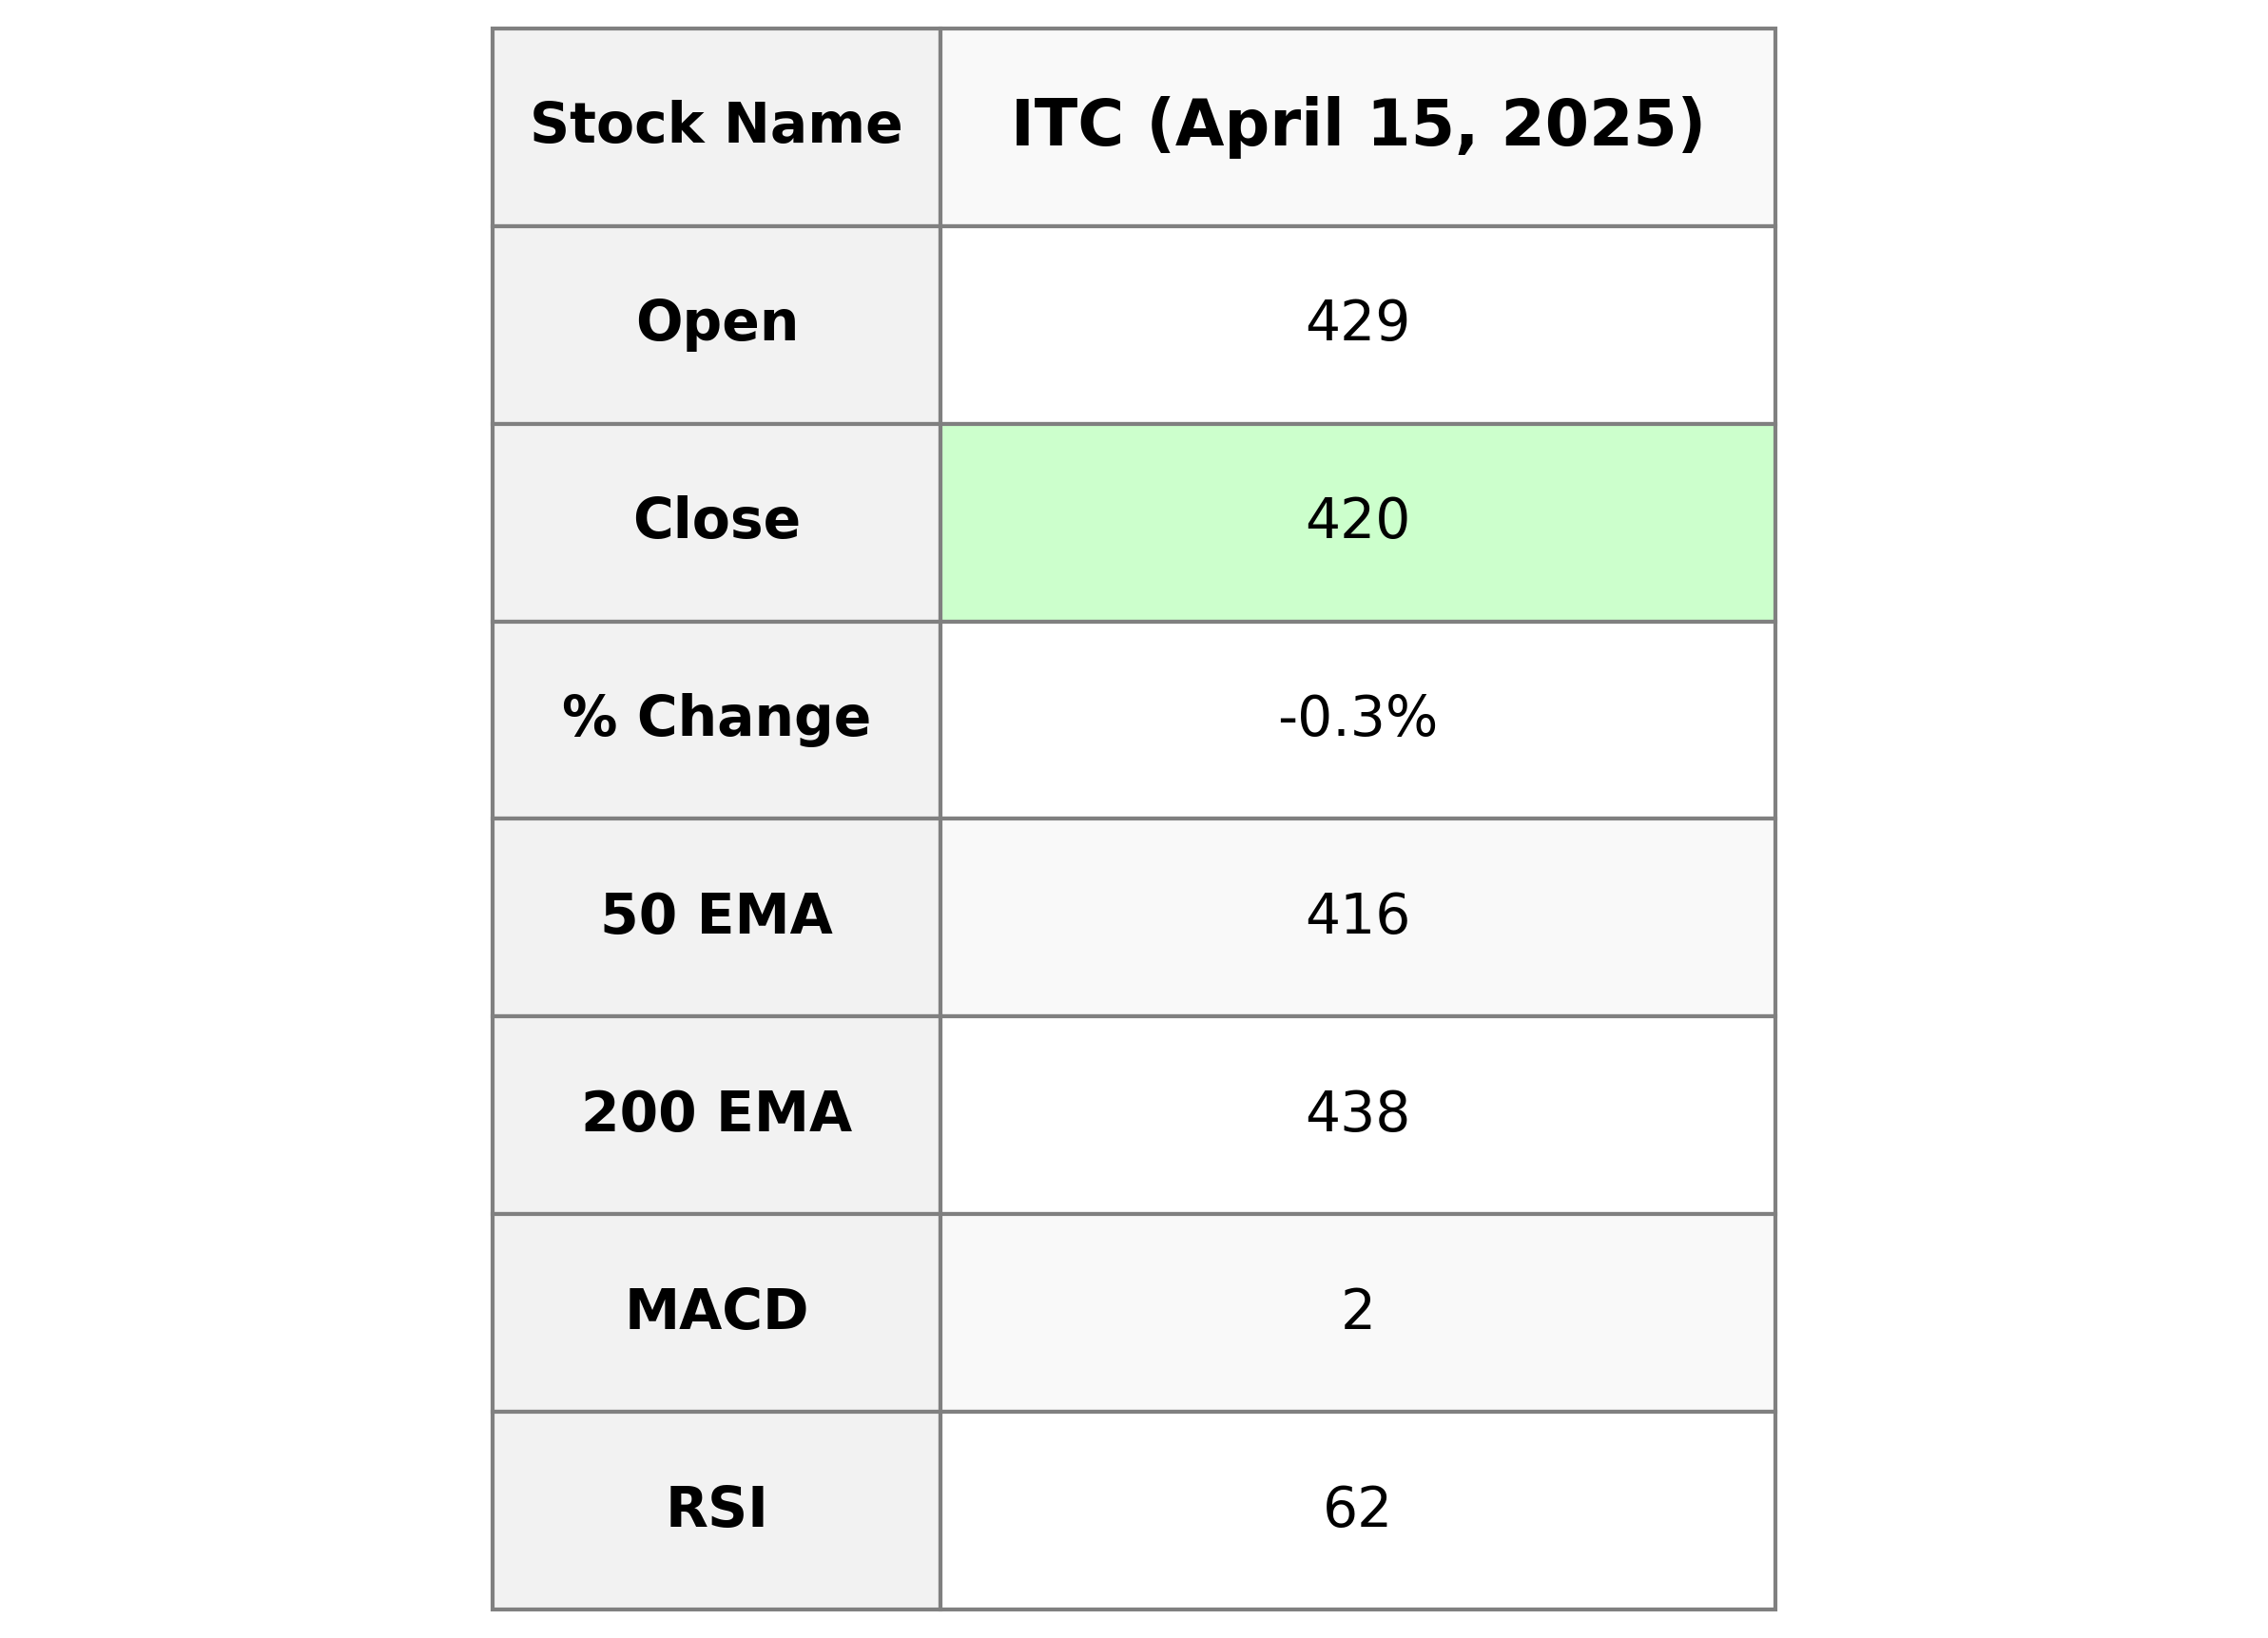
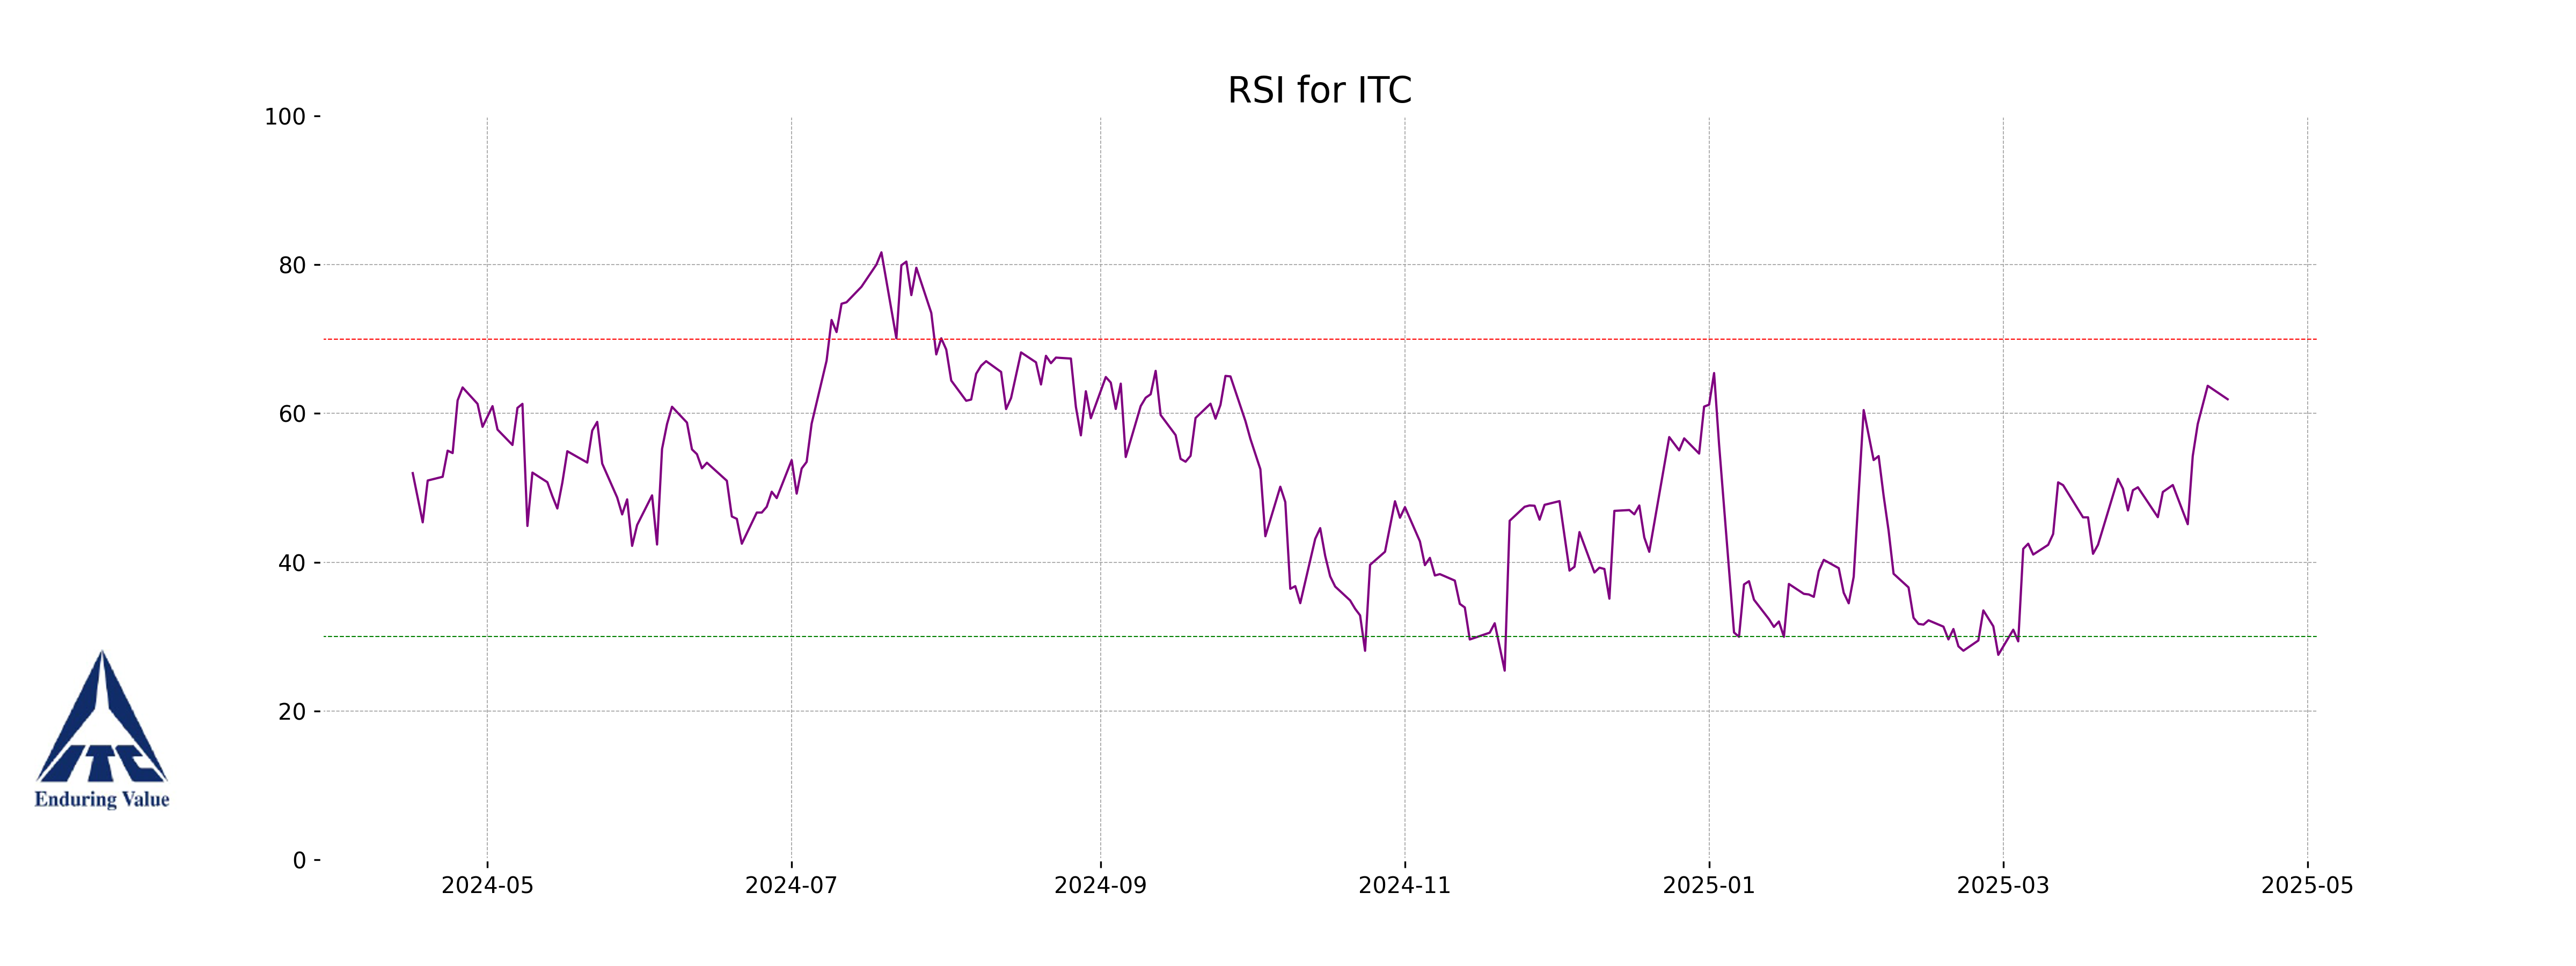
ITC Performance: ITC showed a slight decline with a close of 420.40, a 0.27% decrease from its previous close. Despite a drop in the stock price, the RSI at 61.91 indicates a moderately strong momentum in the market. The company holds a significant market cap of approximately 5.26 trillion, classified under the Consumer Defensive sector within the Tobacco industry in India.
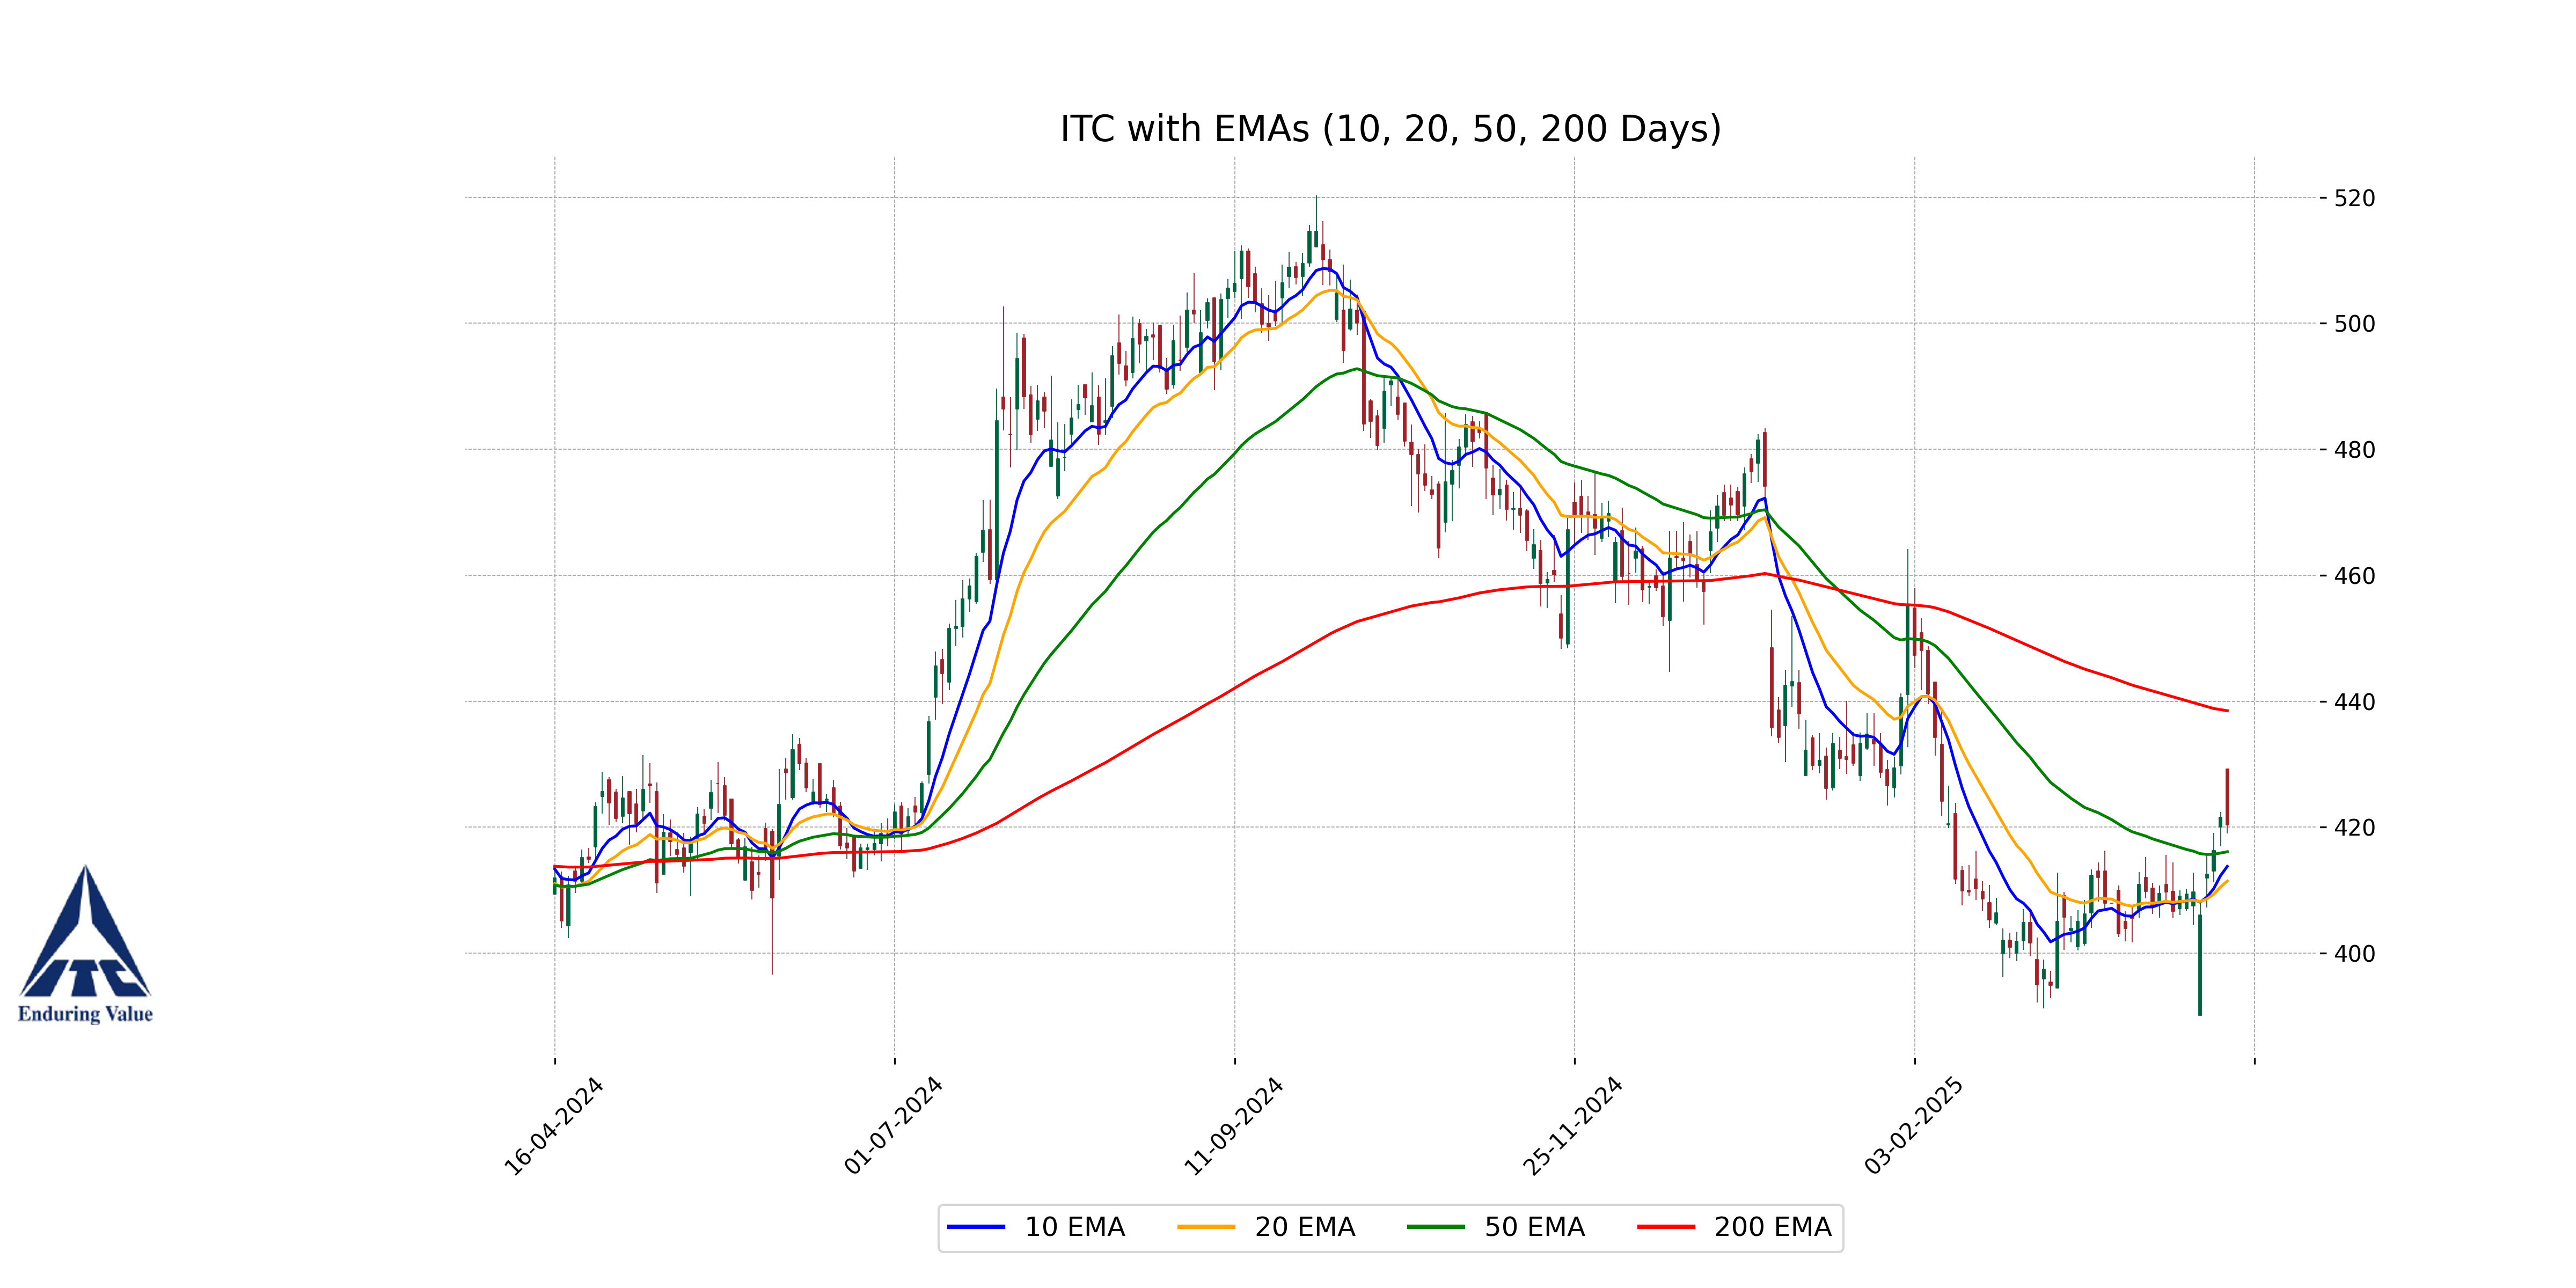
Relationship with Key Moving Averages
ITC's closing price of 420.40 is above its 50-EMA of 416.10, indicating potential bullish momentum in the short term. However, it remains below the 200-EMA of 438.49, suggesting a cautious outlook in the longer term. The relationship indicates that ITC is performing well in the short term but has not yet overcome longer-term resistance.
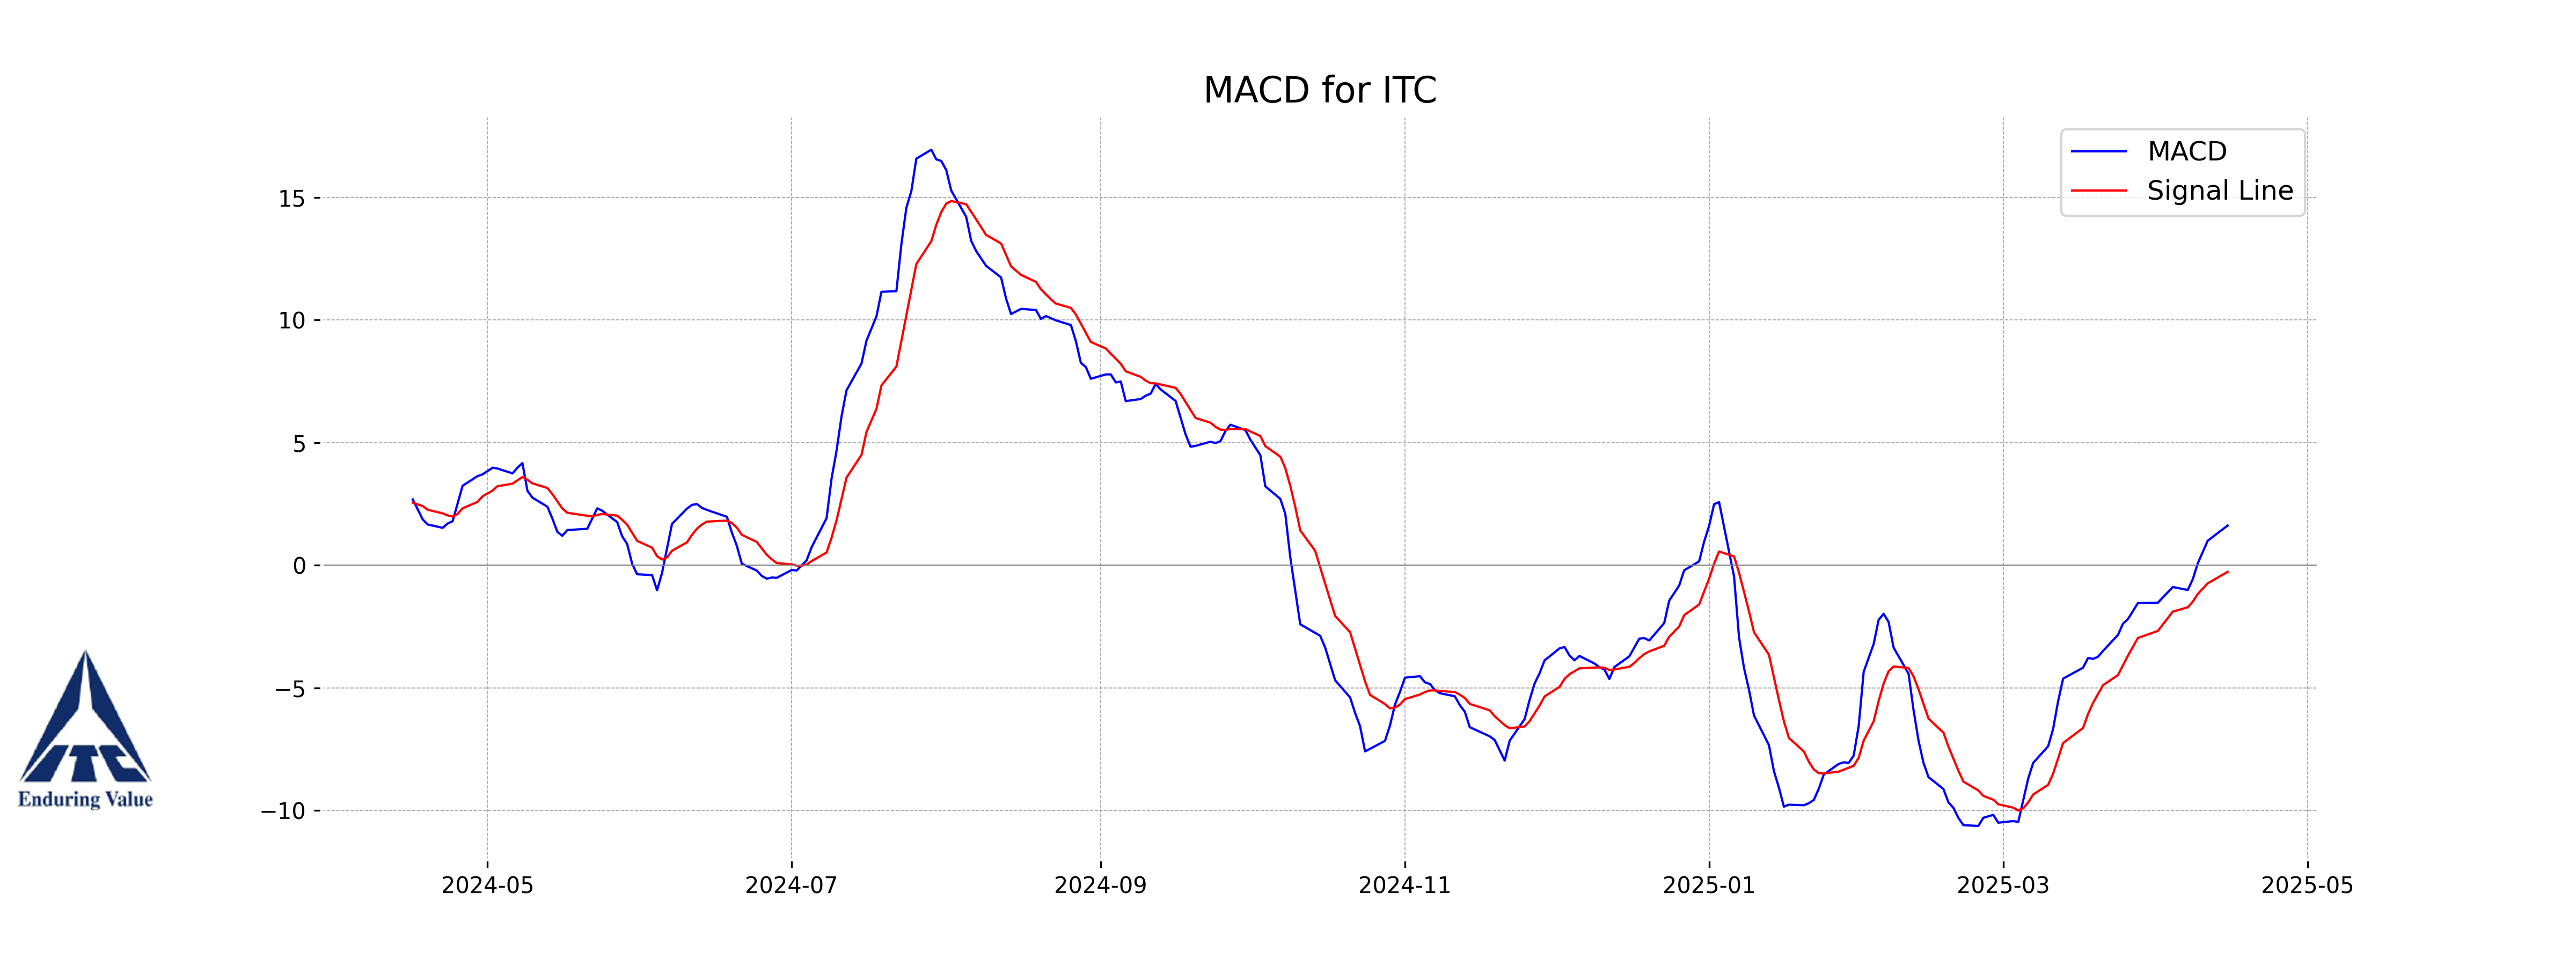
Moving Averages Trend (MACD)
The MACD for ITC is positive at 1.62, which suggests a potential bullish trend as it is above the MACD Signal line of -0.27. This indicates upward momentum in the stock's price movement.
RSI Analysis
The RSI (Relative Strength Index) for ITC is 61.91, suggesting that the stock is neither overbought nor oversold, but it's approaching the higher end of the neutral zone. This indicates a moderately strong momentum, but investors should be cautious of potential reversal or overbought conditions if RSI continues to rise beyond 70.