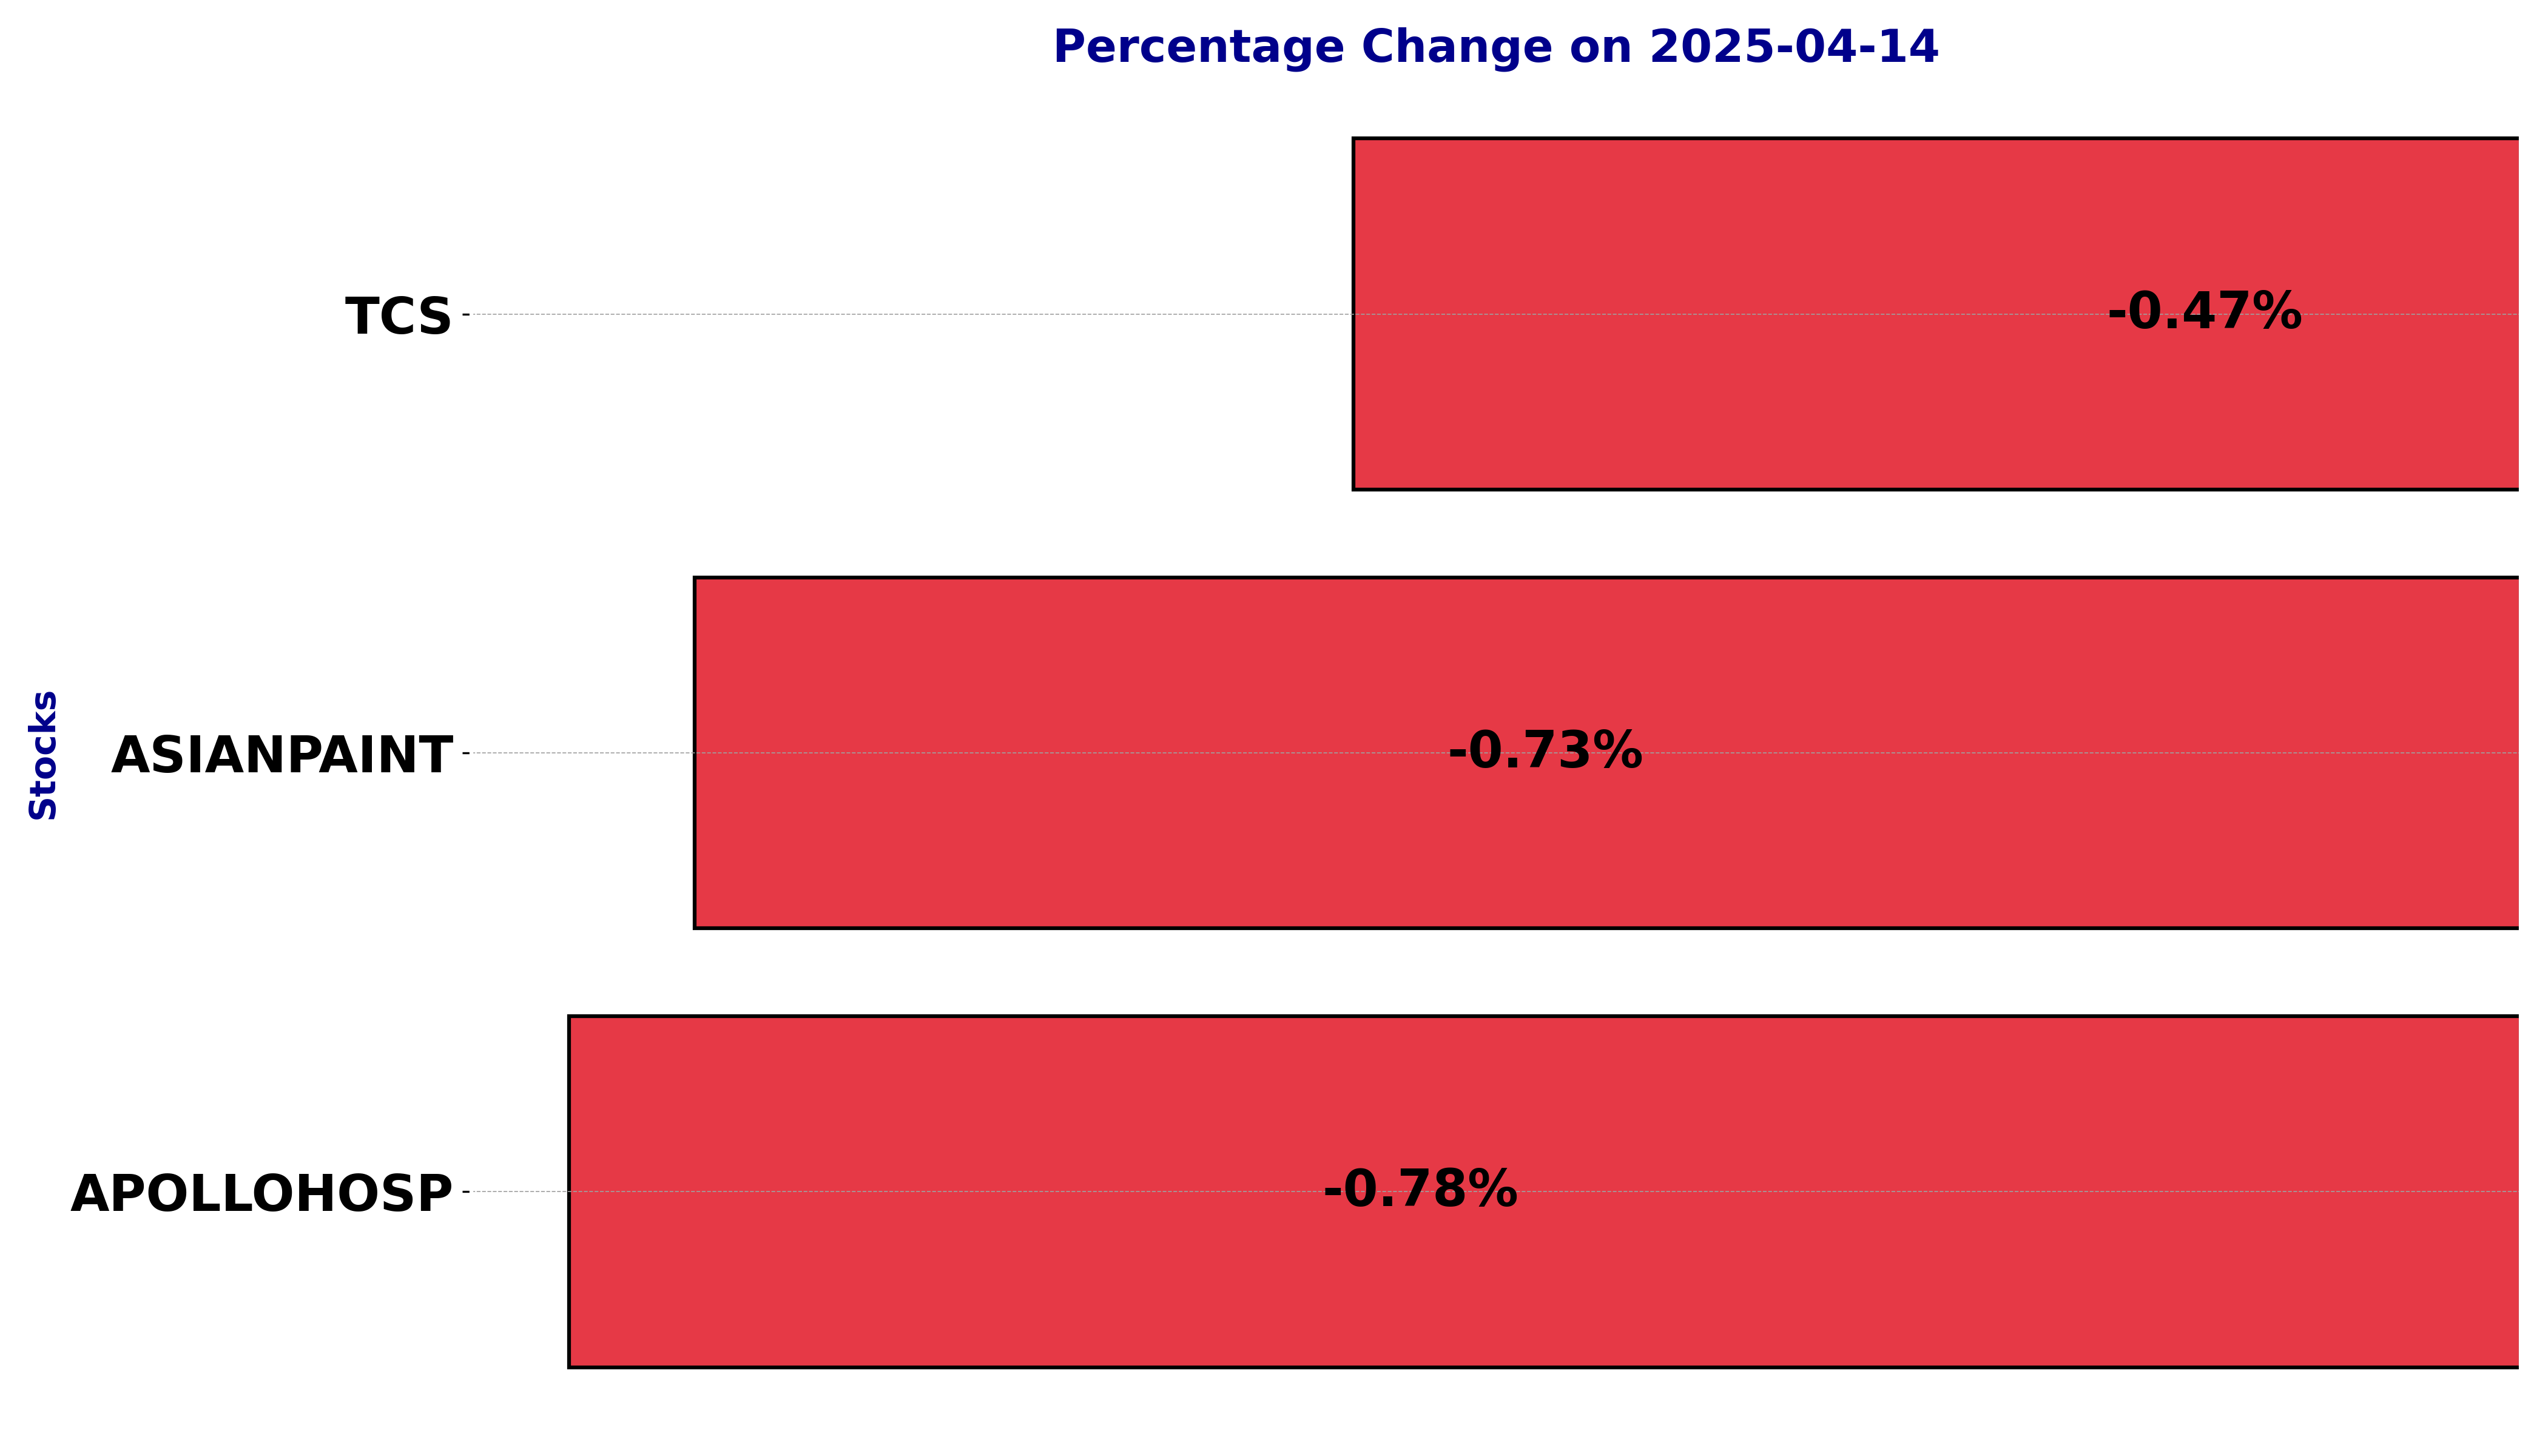
NSE Nifty 50 Top losers: What are the 5 Biggest Stock losers Today April 14, 2025
In this article, we will explore the technical indicators of some of the low-performing stocks on the Indian stock market, including APOLLOHOSP, ASIANPAINT, and TCS.
By looking at these stocks through the lens of key technical factors, we aim to better understand their price movements, trends, and potential future performance.
Analysis for Apollo Hospital - April 14, 2025
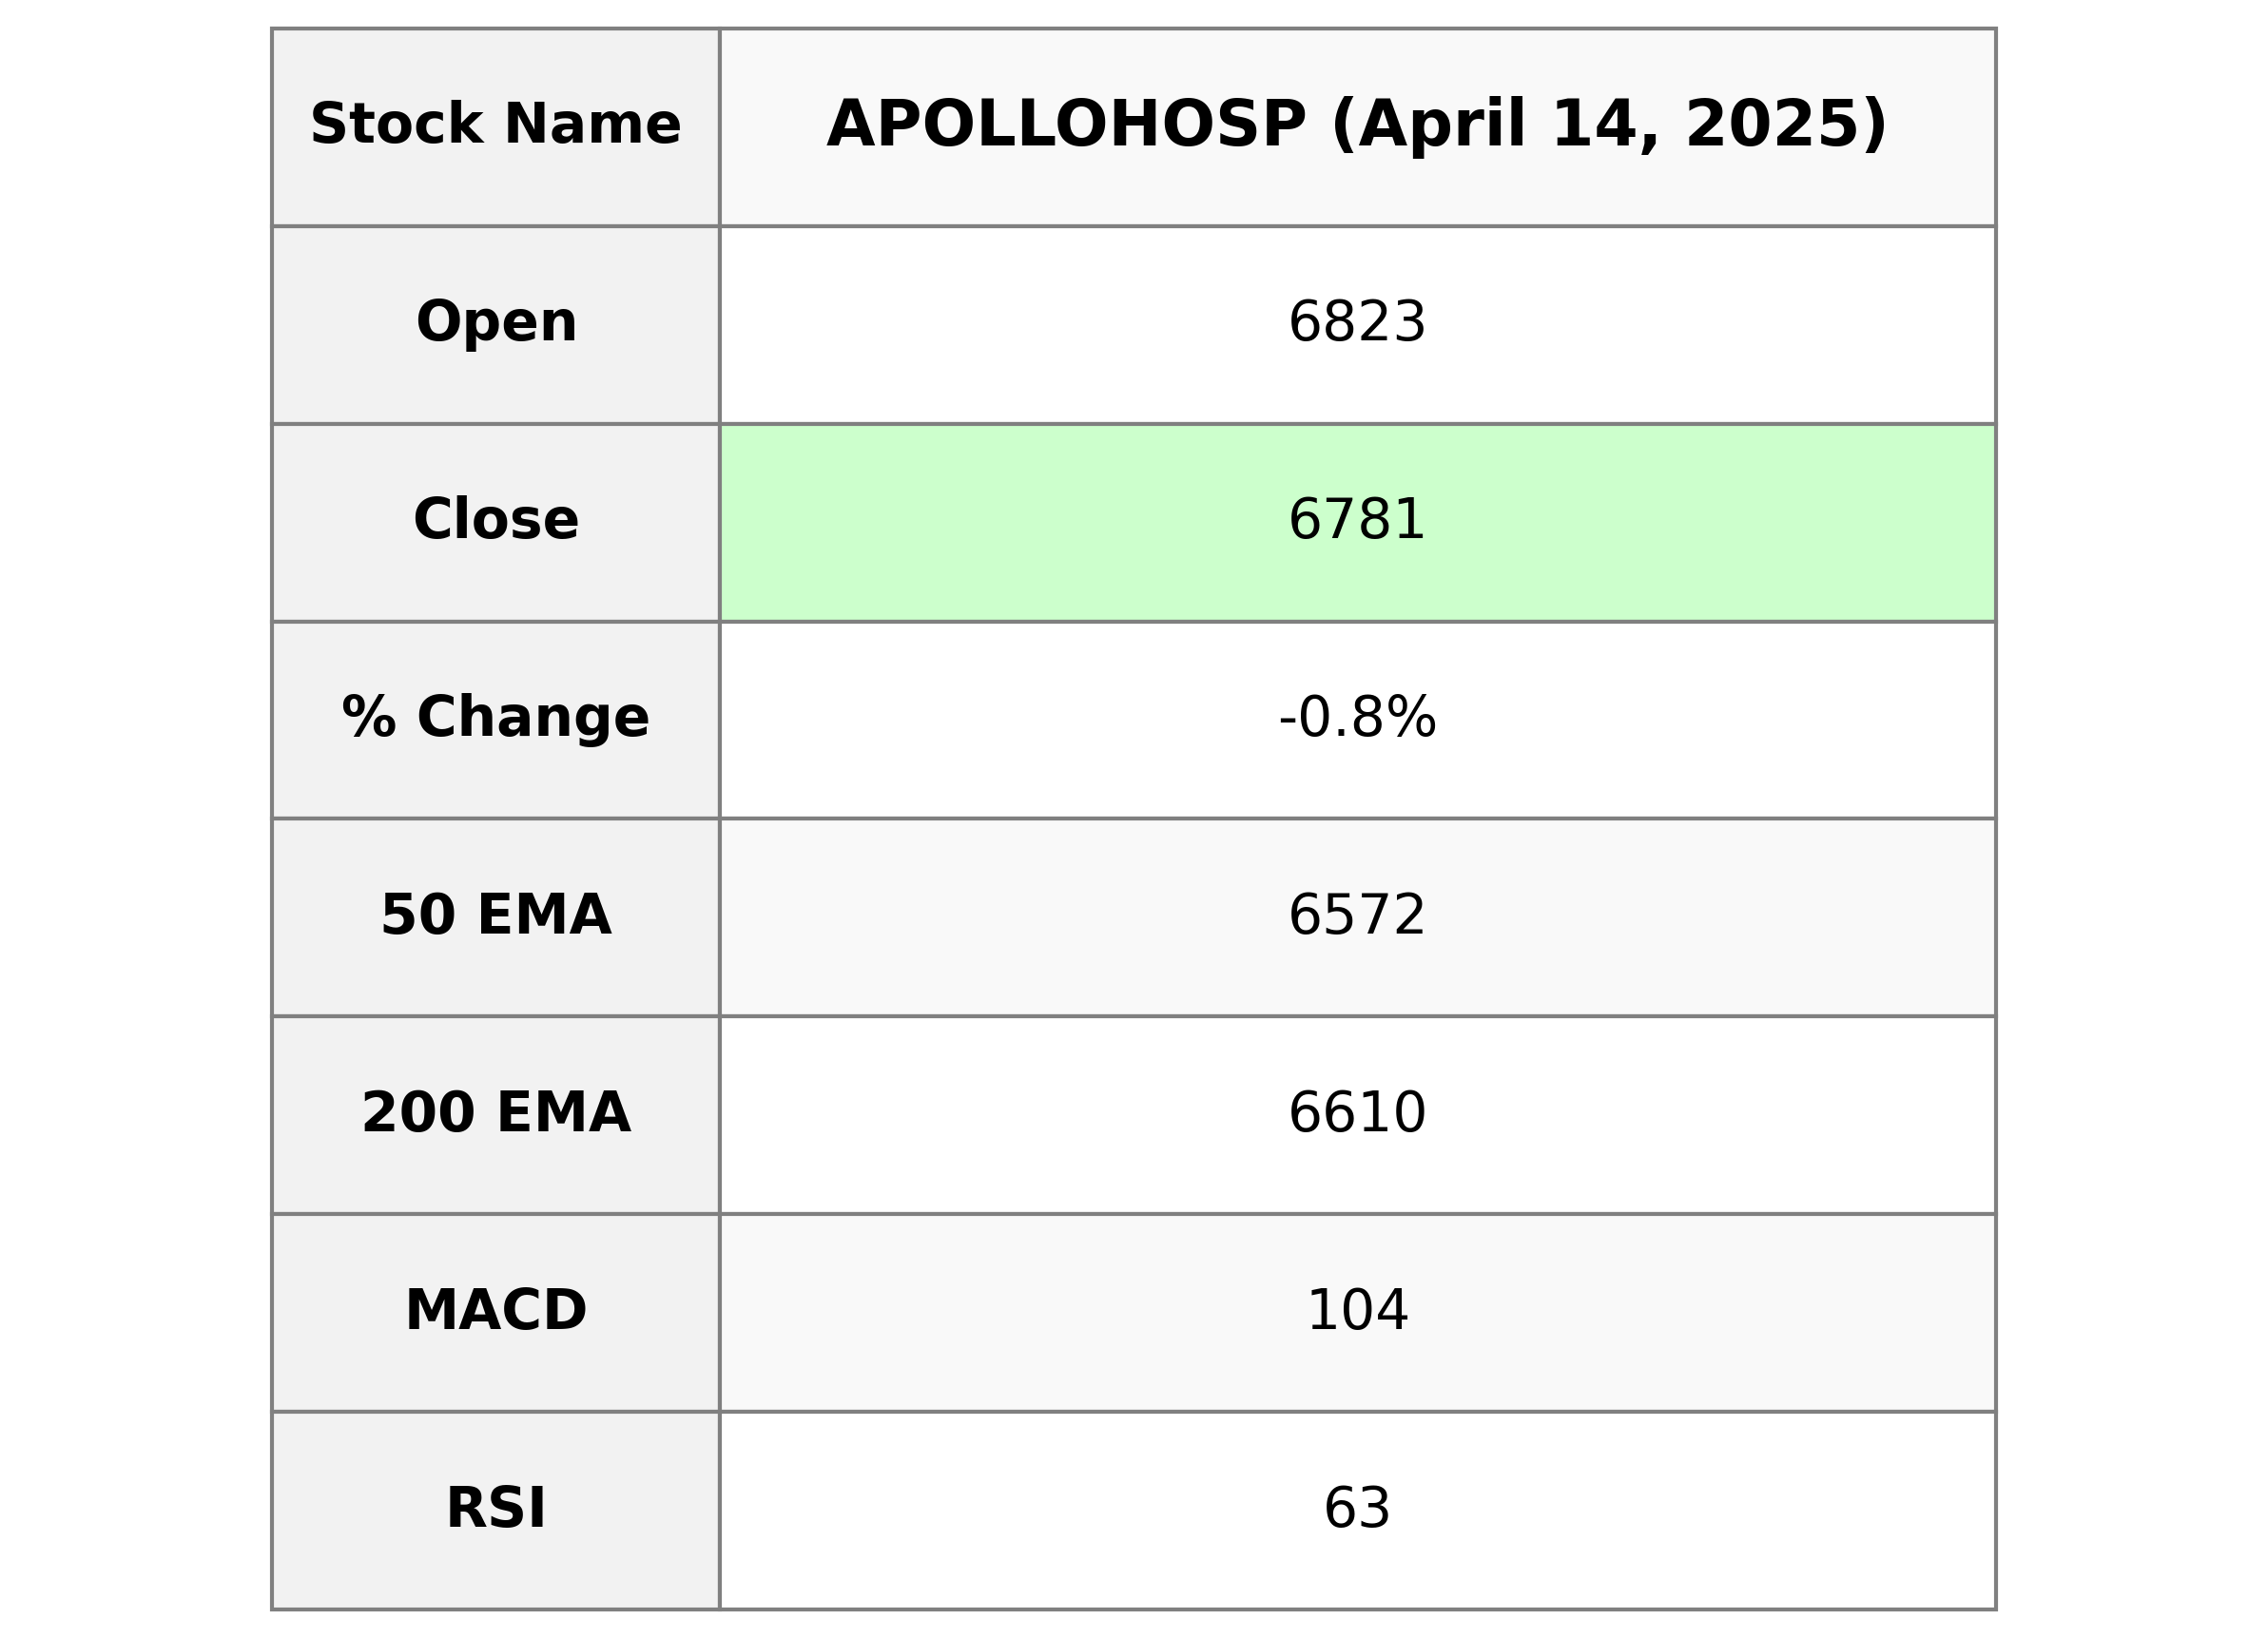
Apollo Hospital had a slight decline in its stock performance with a close of 6780.95, down by 0.78% from the previous close. The stock is trading above its 50-day and 200-day EMA but below the 10-day and 20-day EMA, indicating mixed short-term momentum. The RSI is healthy at 63, signaling the stock isn't currently overbought or oversold.
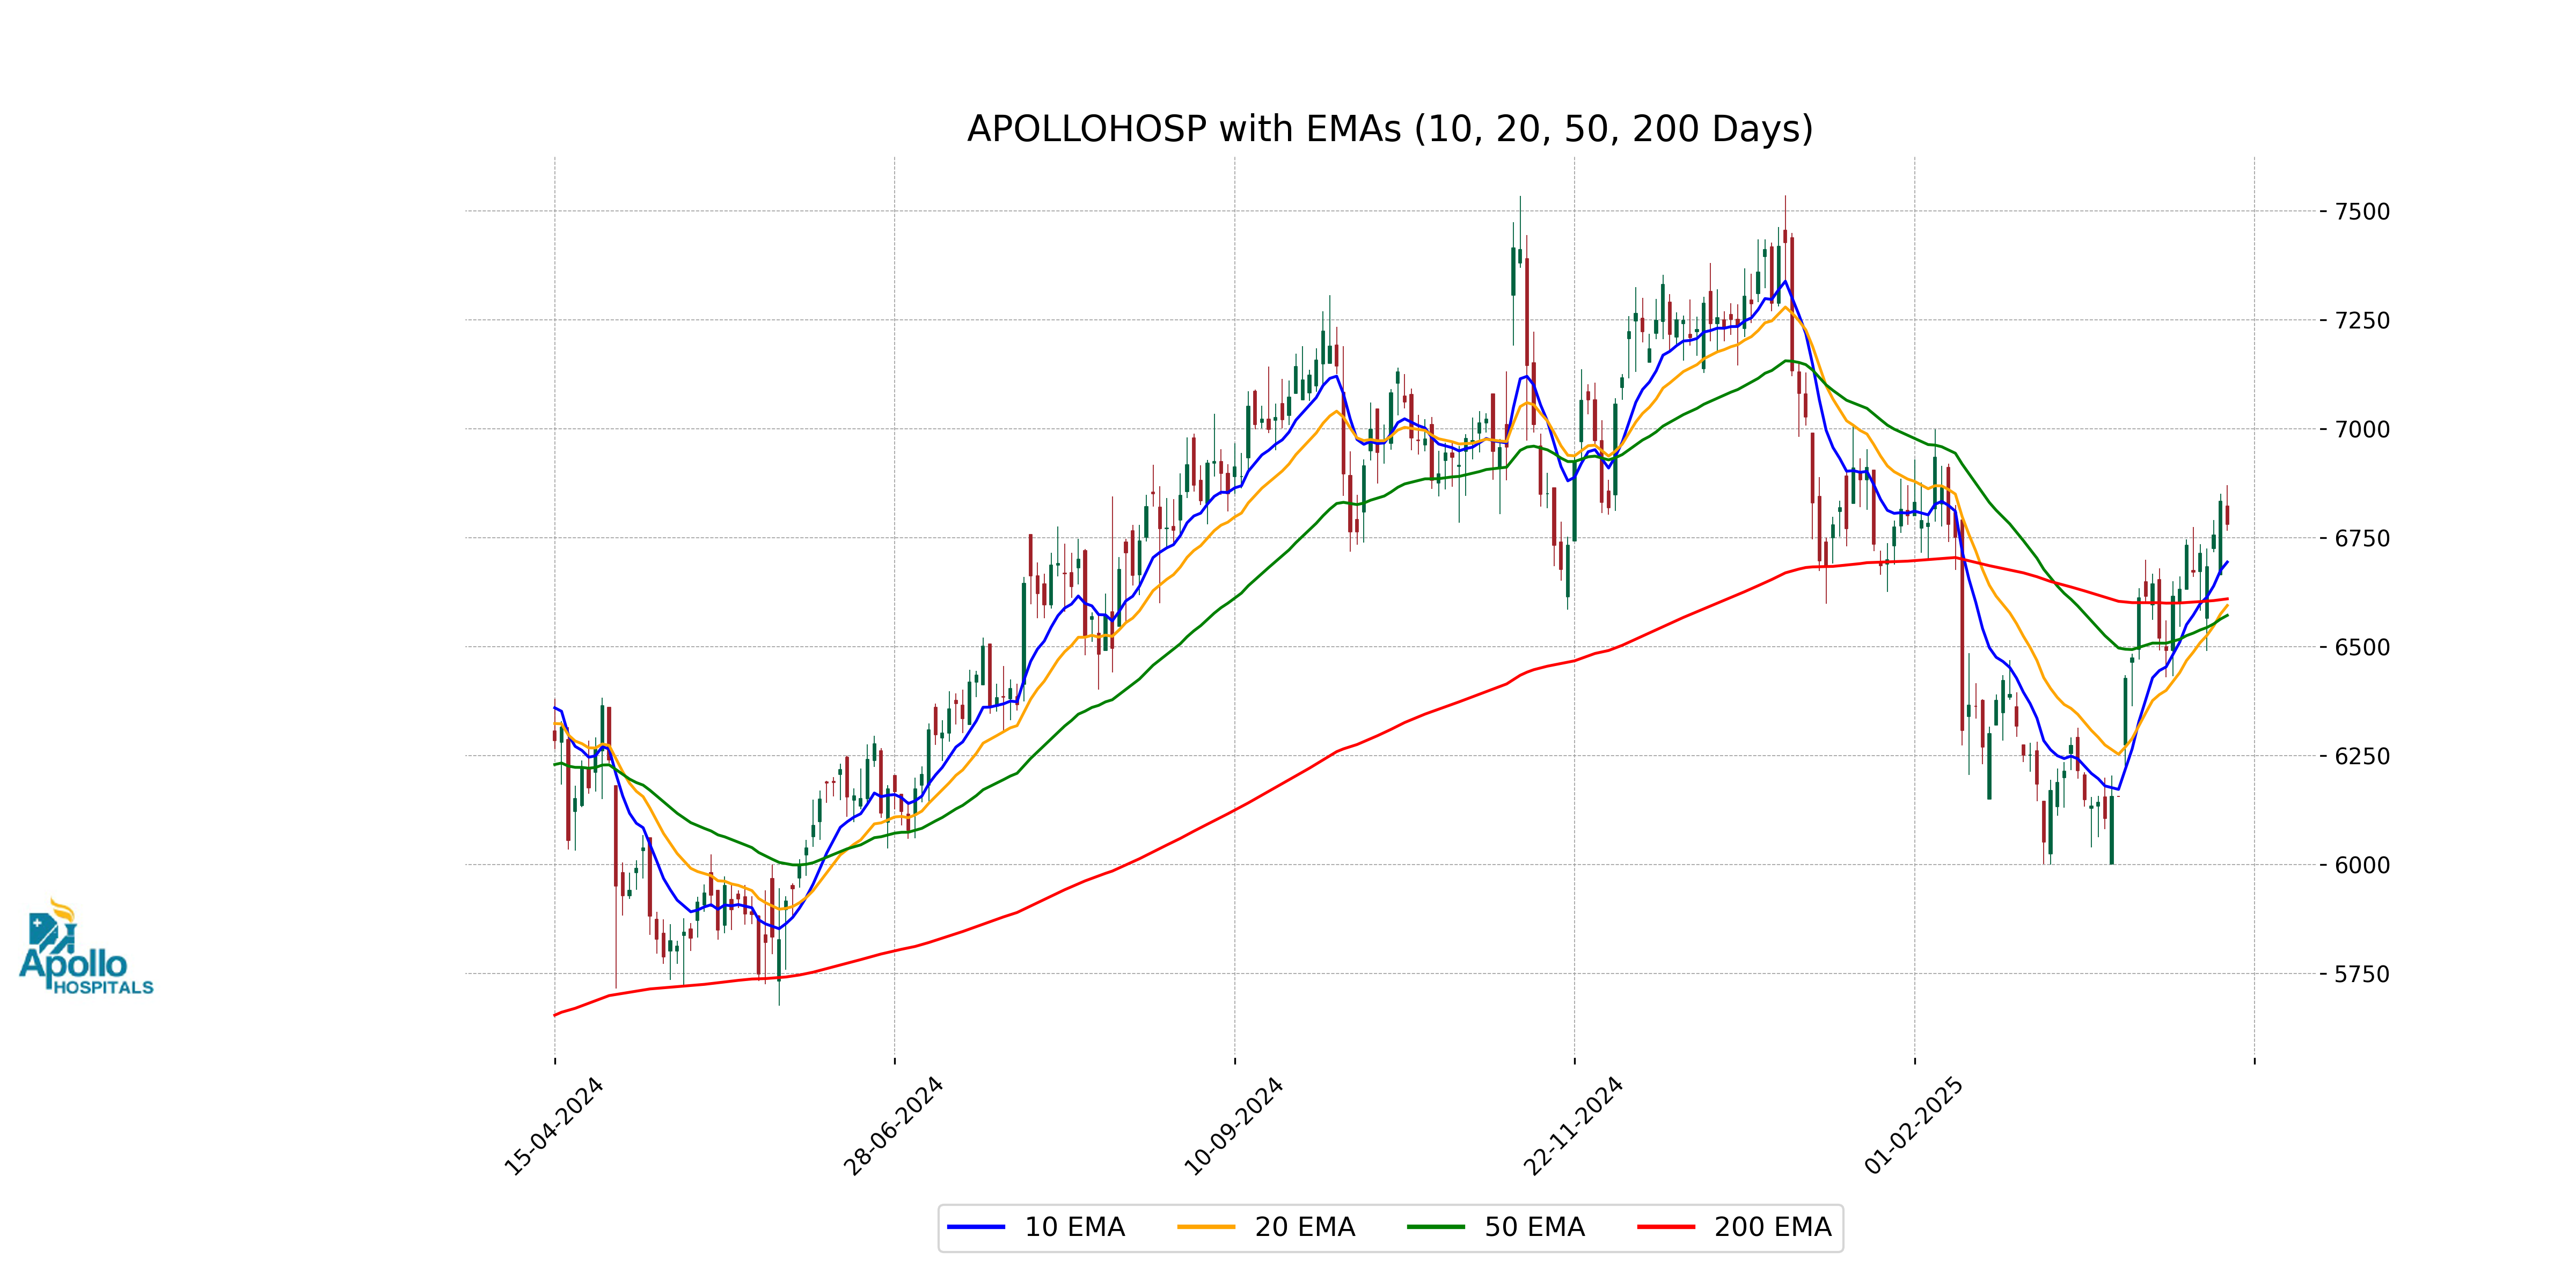
Relationship with Key Moving Averages
Apollo Hospital's current closing price of 6780.95 is above the 50-day EMA of 6571.96 and the 200-day EMA of 6609.80, indicating a bullish trend over these periods. However, it is below the 10-day EMA of 6694.26, suggesting a short-term downward correction.
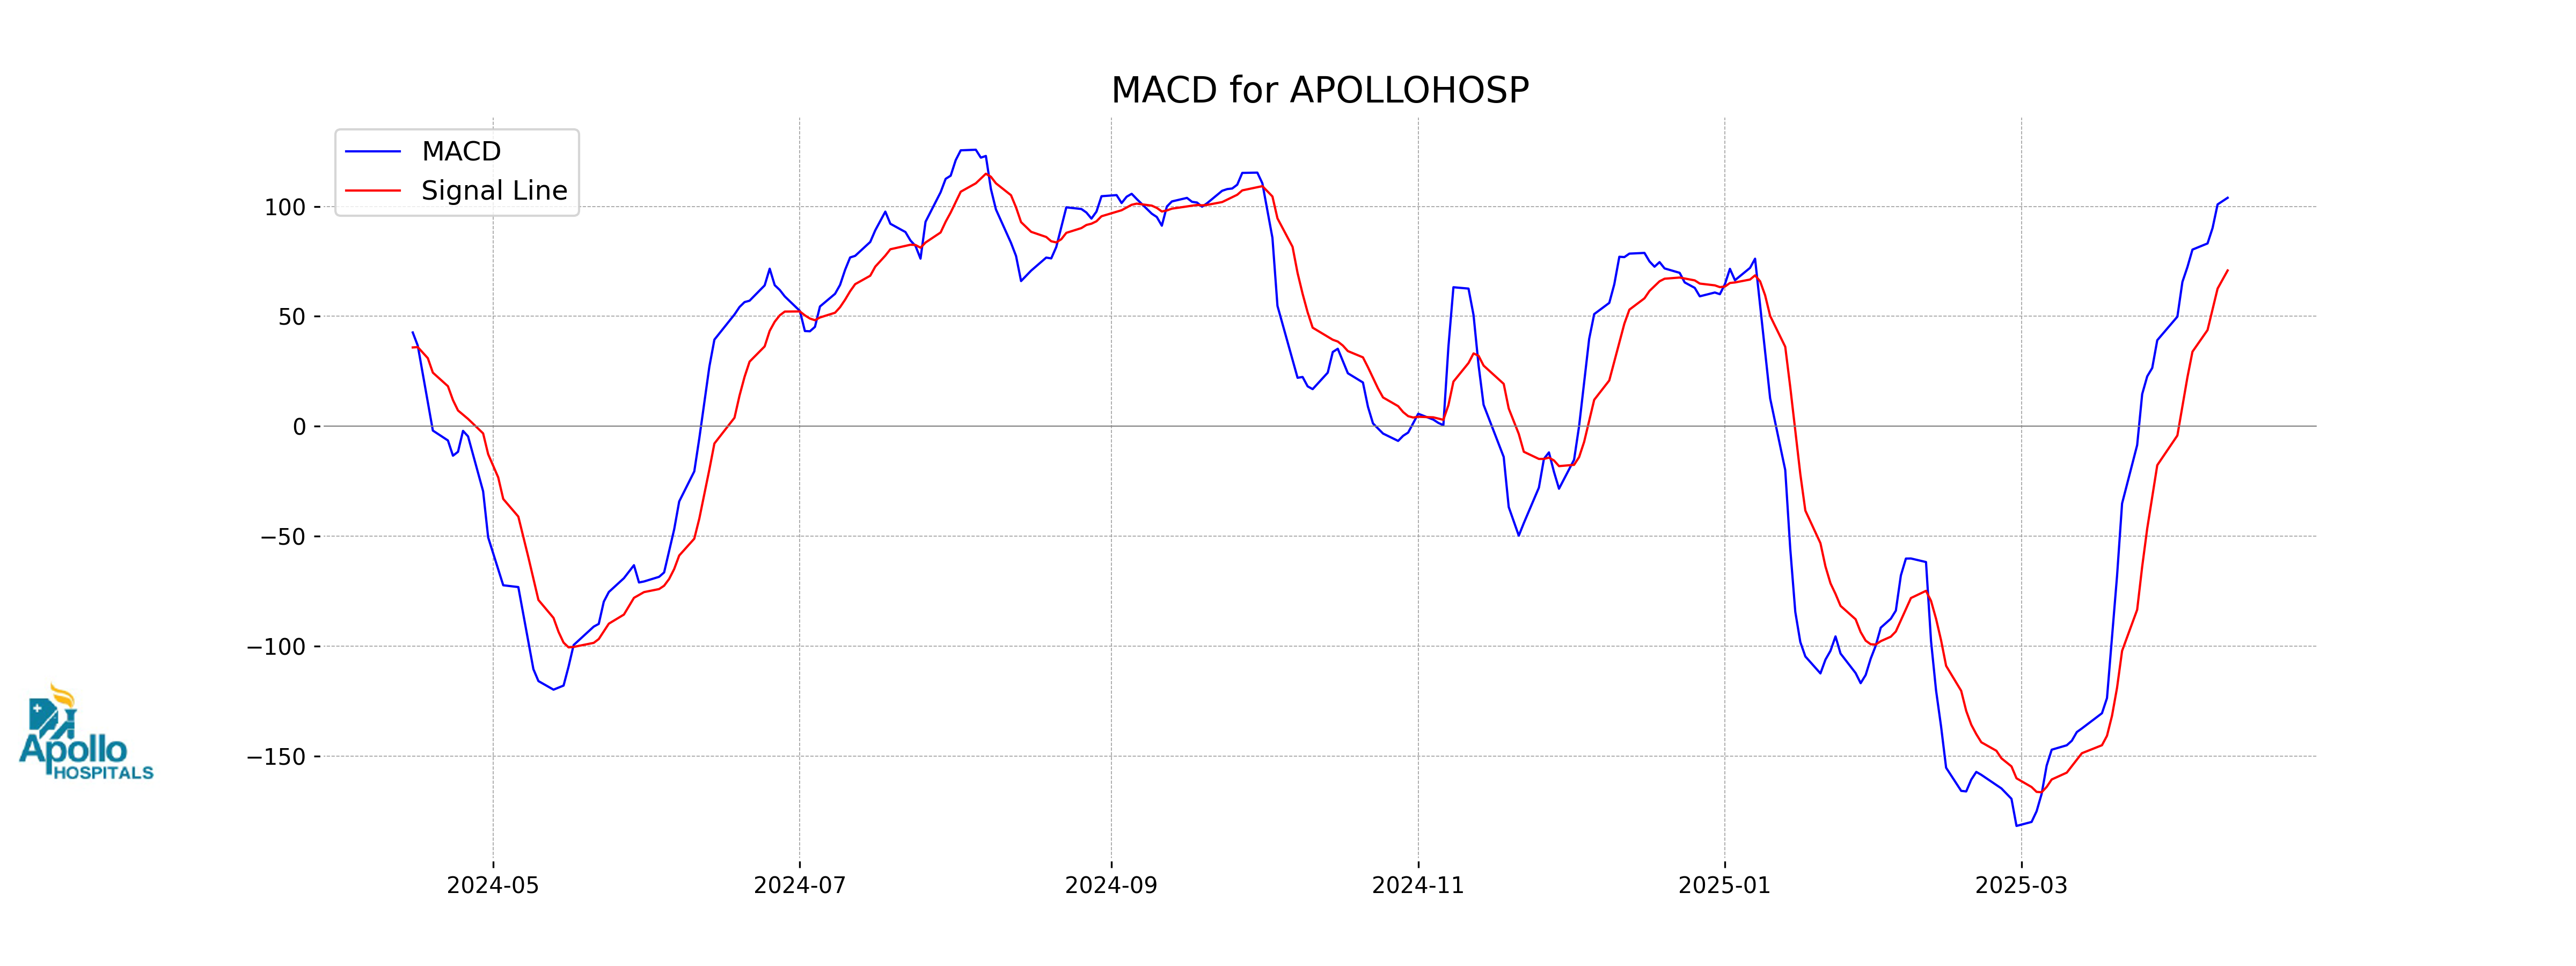
Moving Averages Trend (MACD)
MACD Analysis for Apollo Hospital: The MACD for Apollo Hospital is 103.93, which is above the MACD Signal line of 70.89, indicating a bullish trend in the market momentum. This suggests that the recent price movements have been positive, and there may be potential for further upward movement in the stock price.
RSI Analysis
The RSI (Relative Strength Index) for Apollo Hospital is 62.99, which indicates a moderately strong position. Generally, an RSI above 70 suggests an overbought condition, while below 30 suggests oversold. As Apollo Hospital's RSI is positioned around 63, it signifies some bullish momentum but not at an extreme level.

Analysis for Asian Paints - April 14, 2025
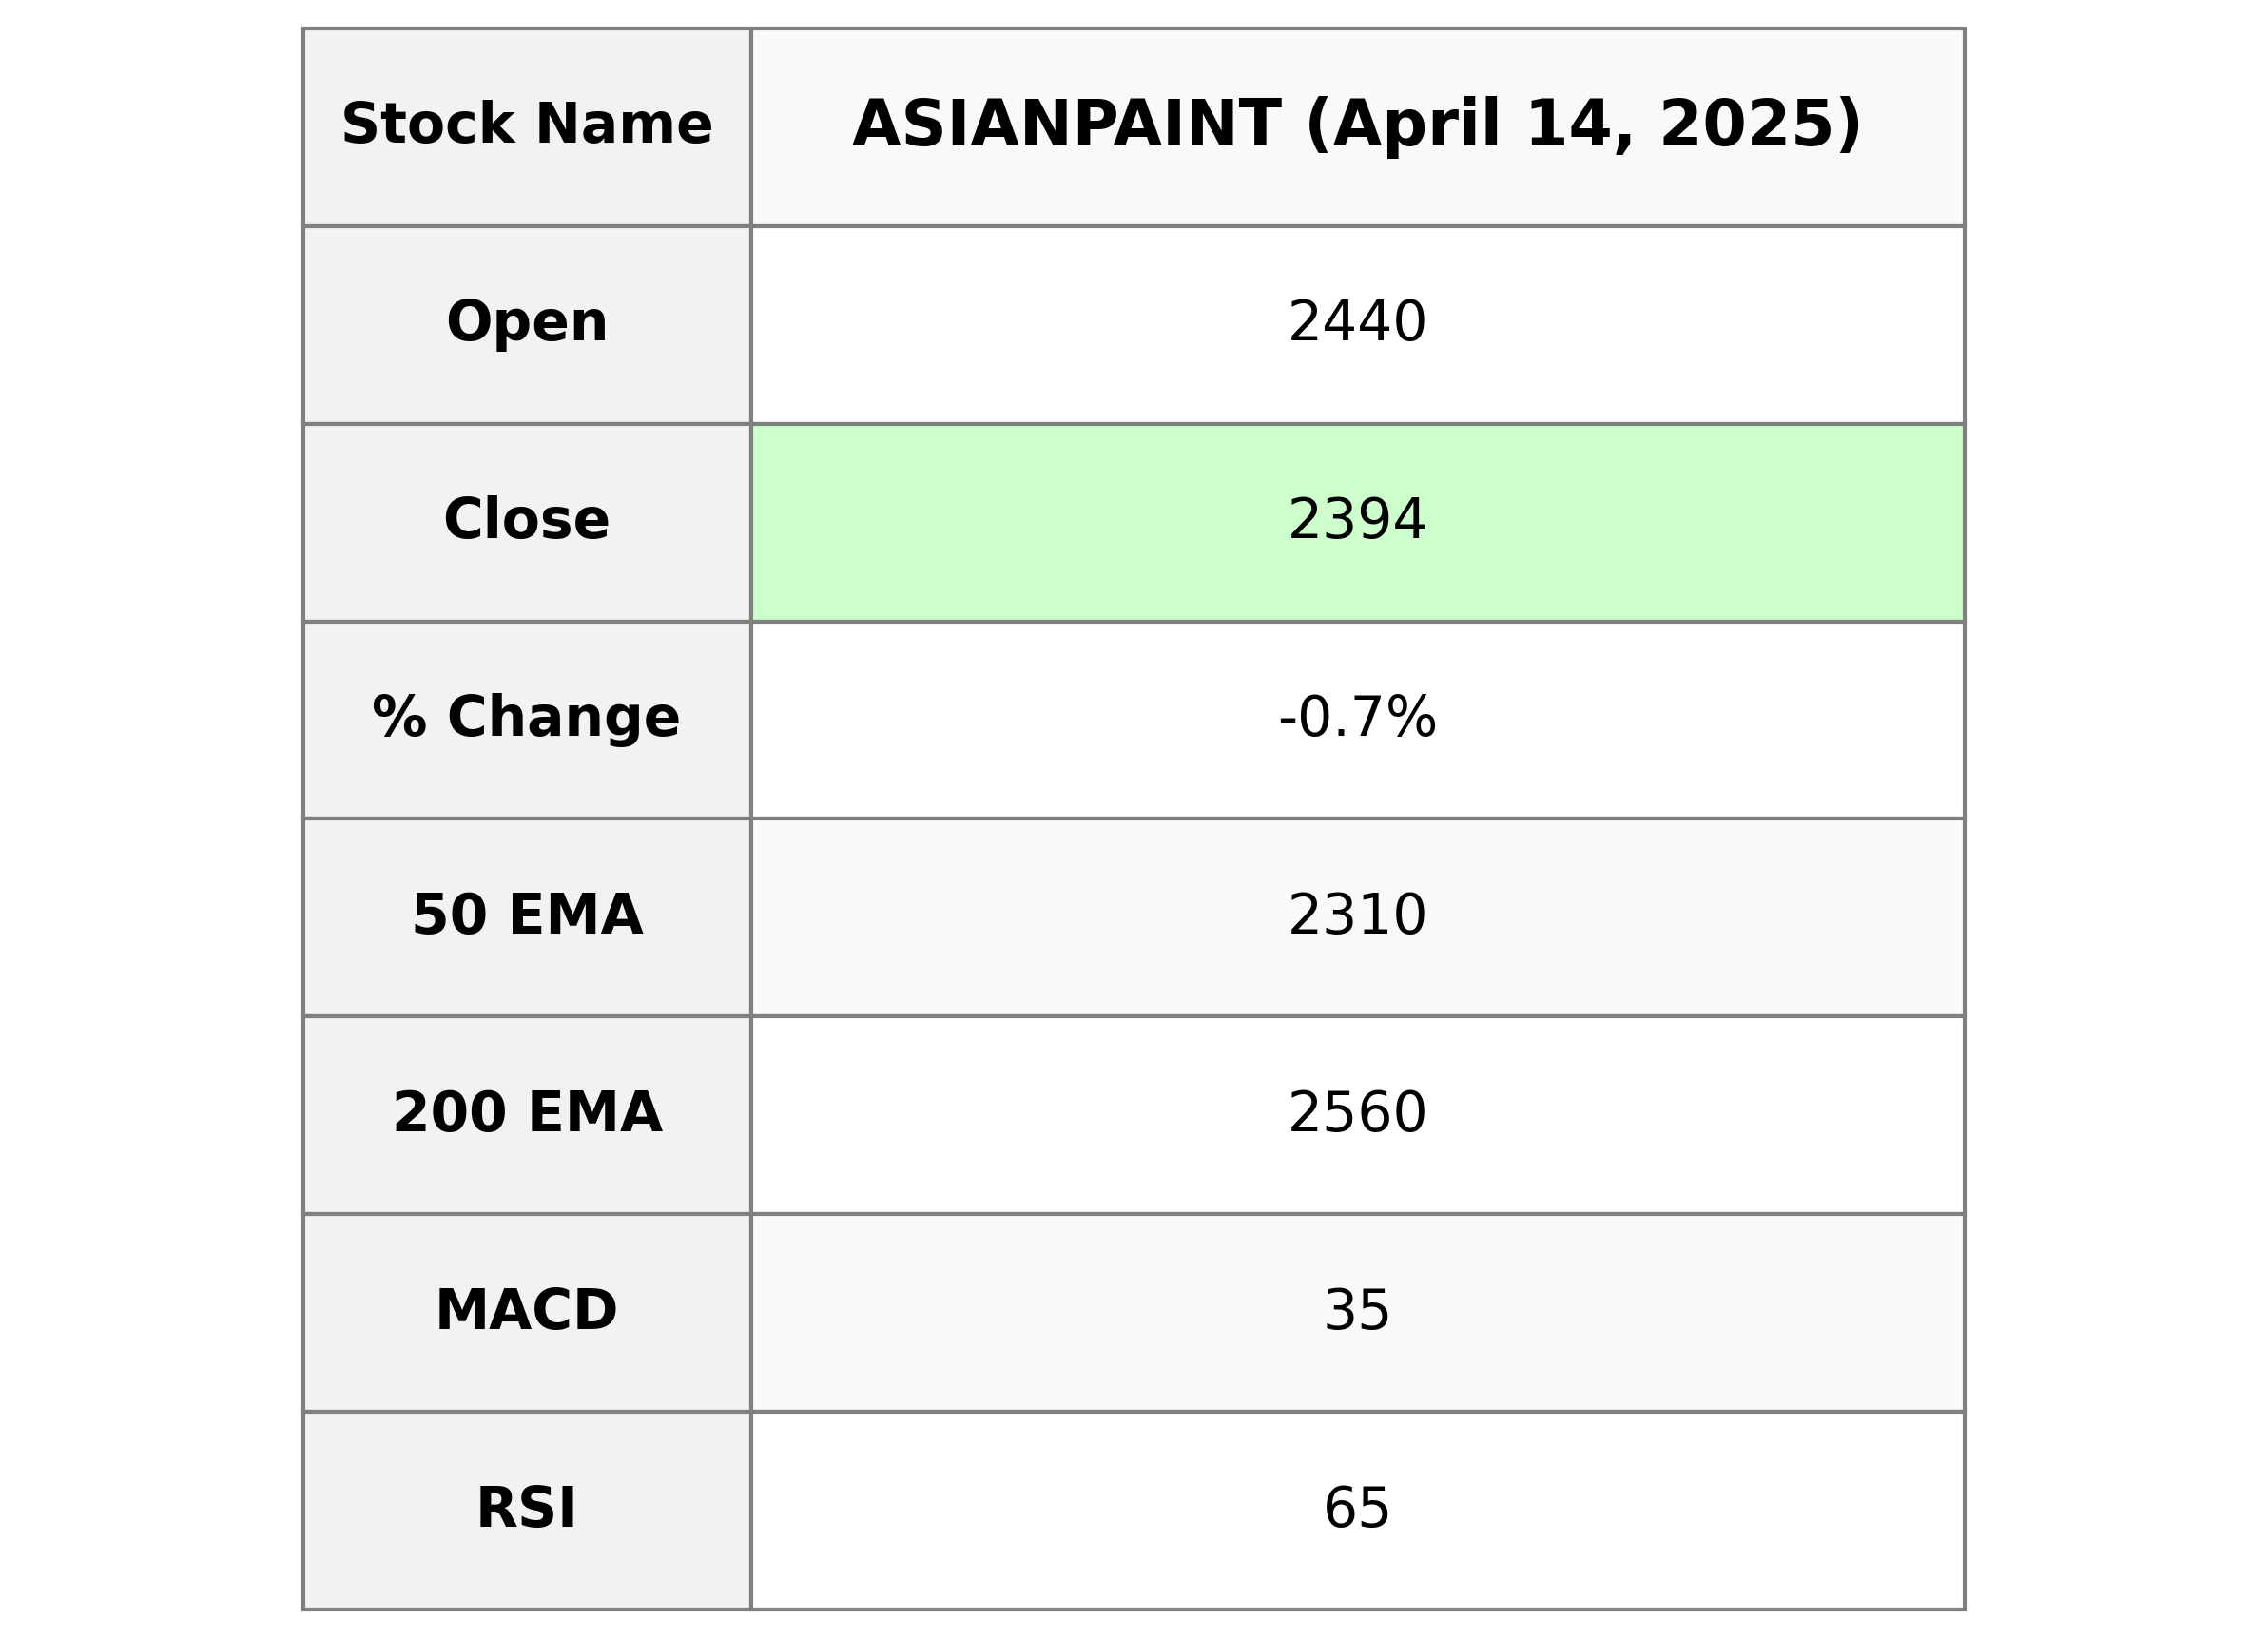
Asian Paints experienced a slight decline in its stock price, closing at 2393.60, which represents a -0.73% change from the previous close. Despite a healthy RSI of 64.56 indicating strong momentum, the stock is trading below its 200-day EMA, suggesting potential bearishness in the longer term. With a significant market cap and a high P/E ratio, Asian Paints remains a key player in the Basic Materials sector within the Specialty Chemicals industry in India.
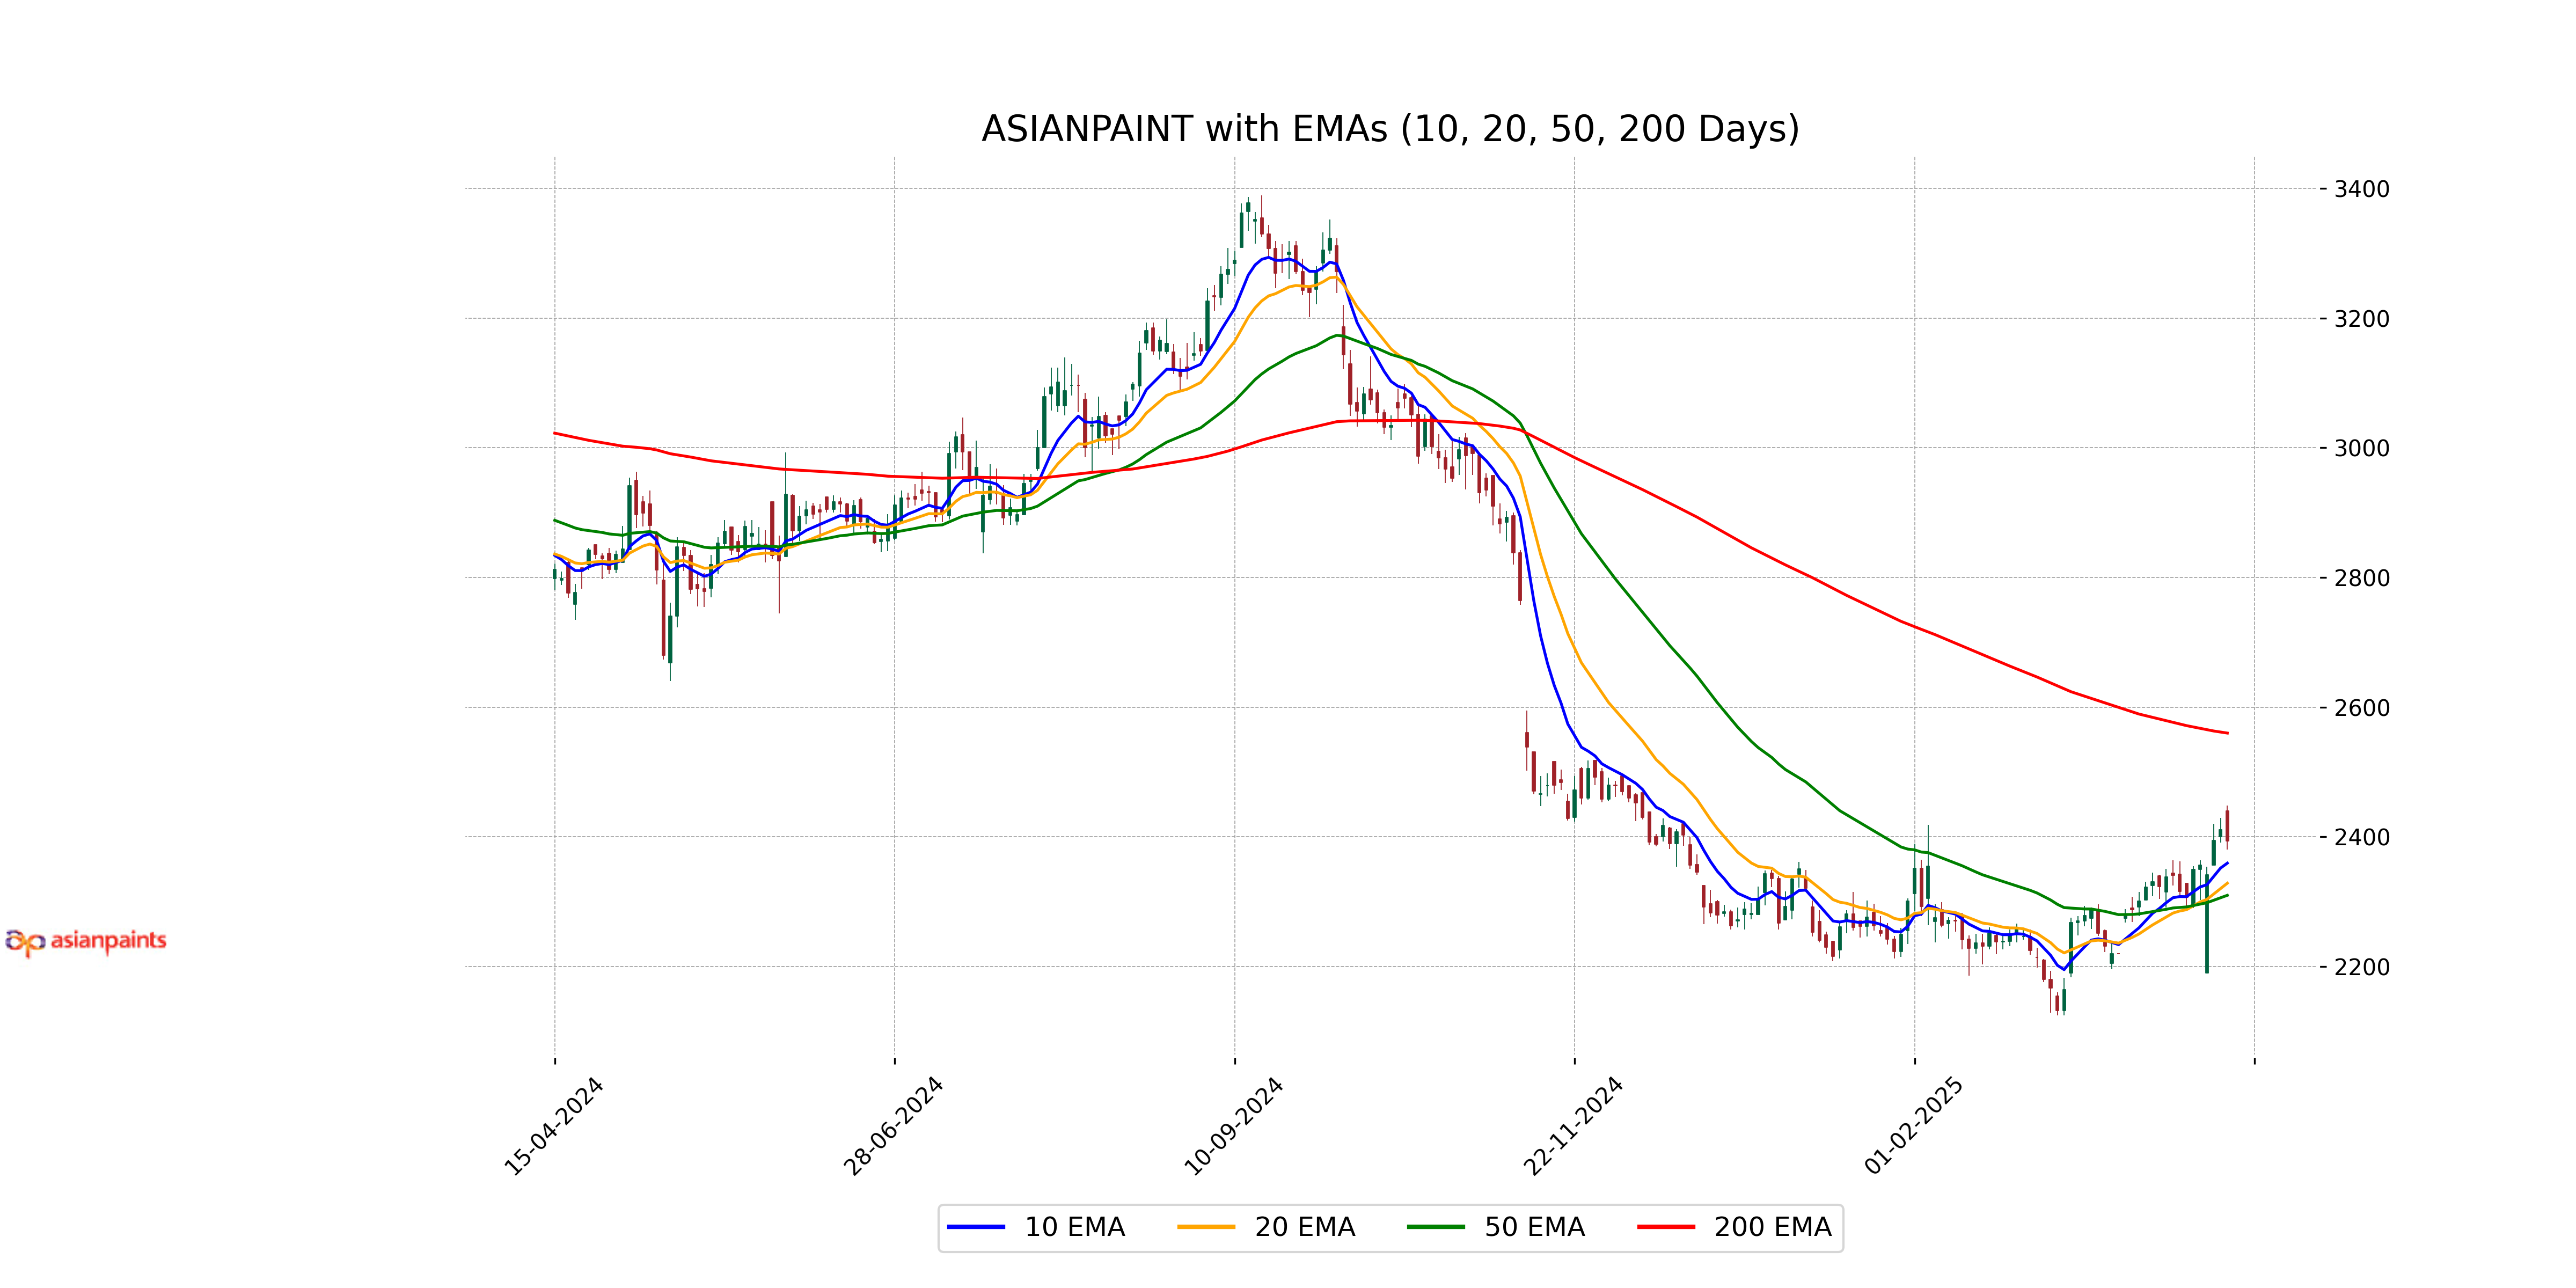
Relationship with Key Moving Averages
Asian Paints is currently trading below its 200-day EMA of 2559.91, indicating potential bearish longer-term sentiment. However, it is trading above both its 50-day EMA of 2309.66 and its 20-day EMA of 2328.31, showing resilience in the shorter to mid-term. The stock has also exceeded its 10-day EMA of 2359.26, suggesting a possible short-term upward momentum.
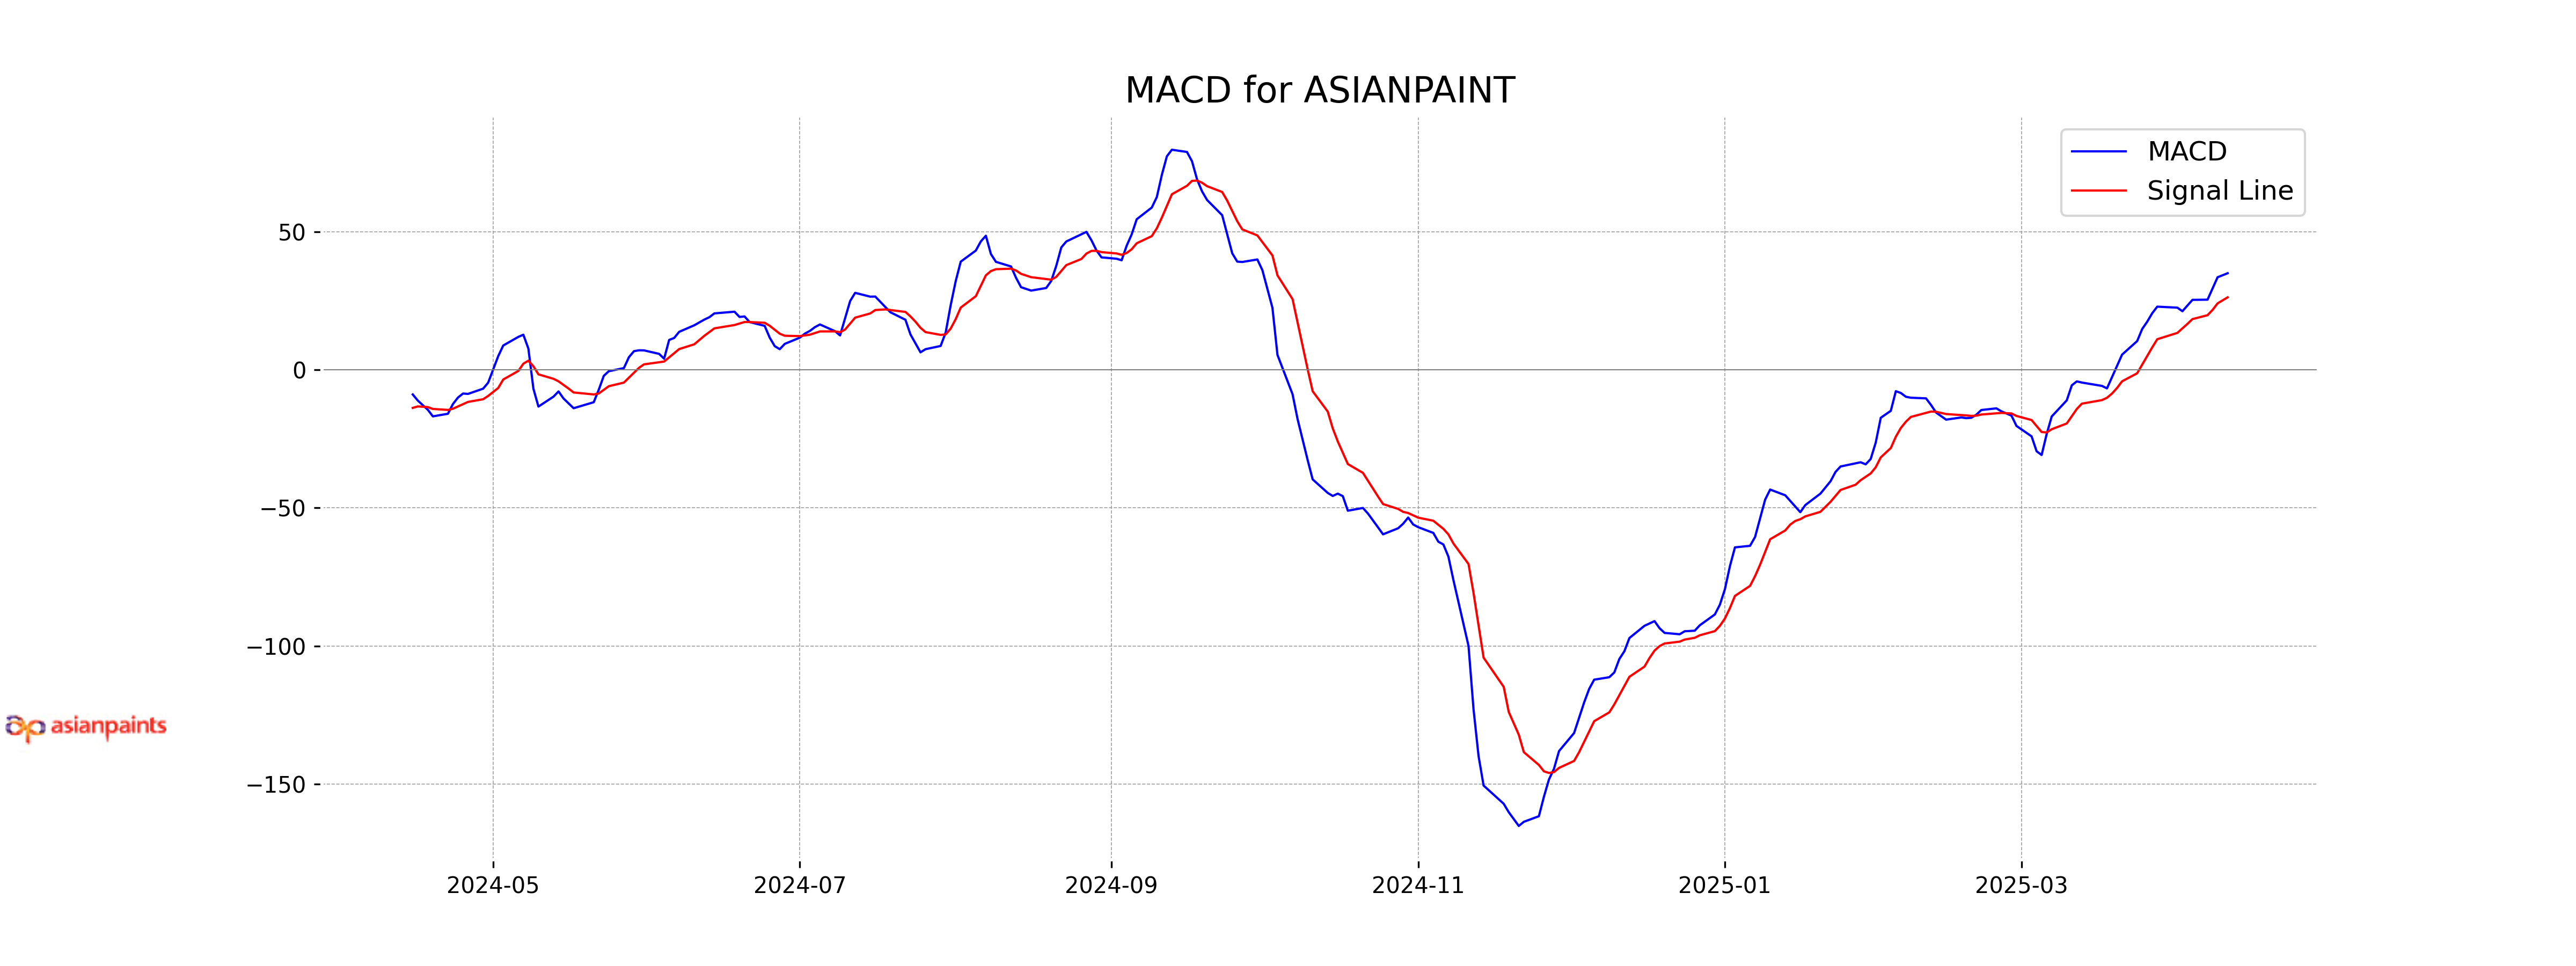
Moving Averages Trend (MACD)
Asian Paints' MACD value of 35.00 is above the MACD Signal of 26.27, suggesting a bullish trend in the stock's price momentum. This could indicate a potential buying opportunity if the upward momentum continues.
RSI Analysis
RSI Analysis for Asian Paints: The RSI (Relative Strength Index) for Asian Paints is at 64.56, suggesting that the stock is approaching overbought territory but is not yet overbought. Typically, an RSI above 70 indicates that a stock is overbought, while an RSI below 30 indicates it is oversold.

Analysis for TCS - April 14, 2025
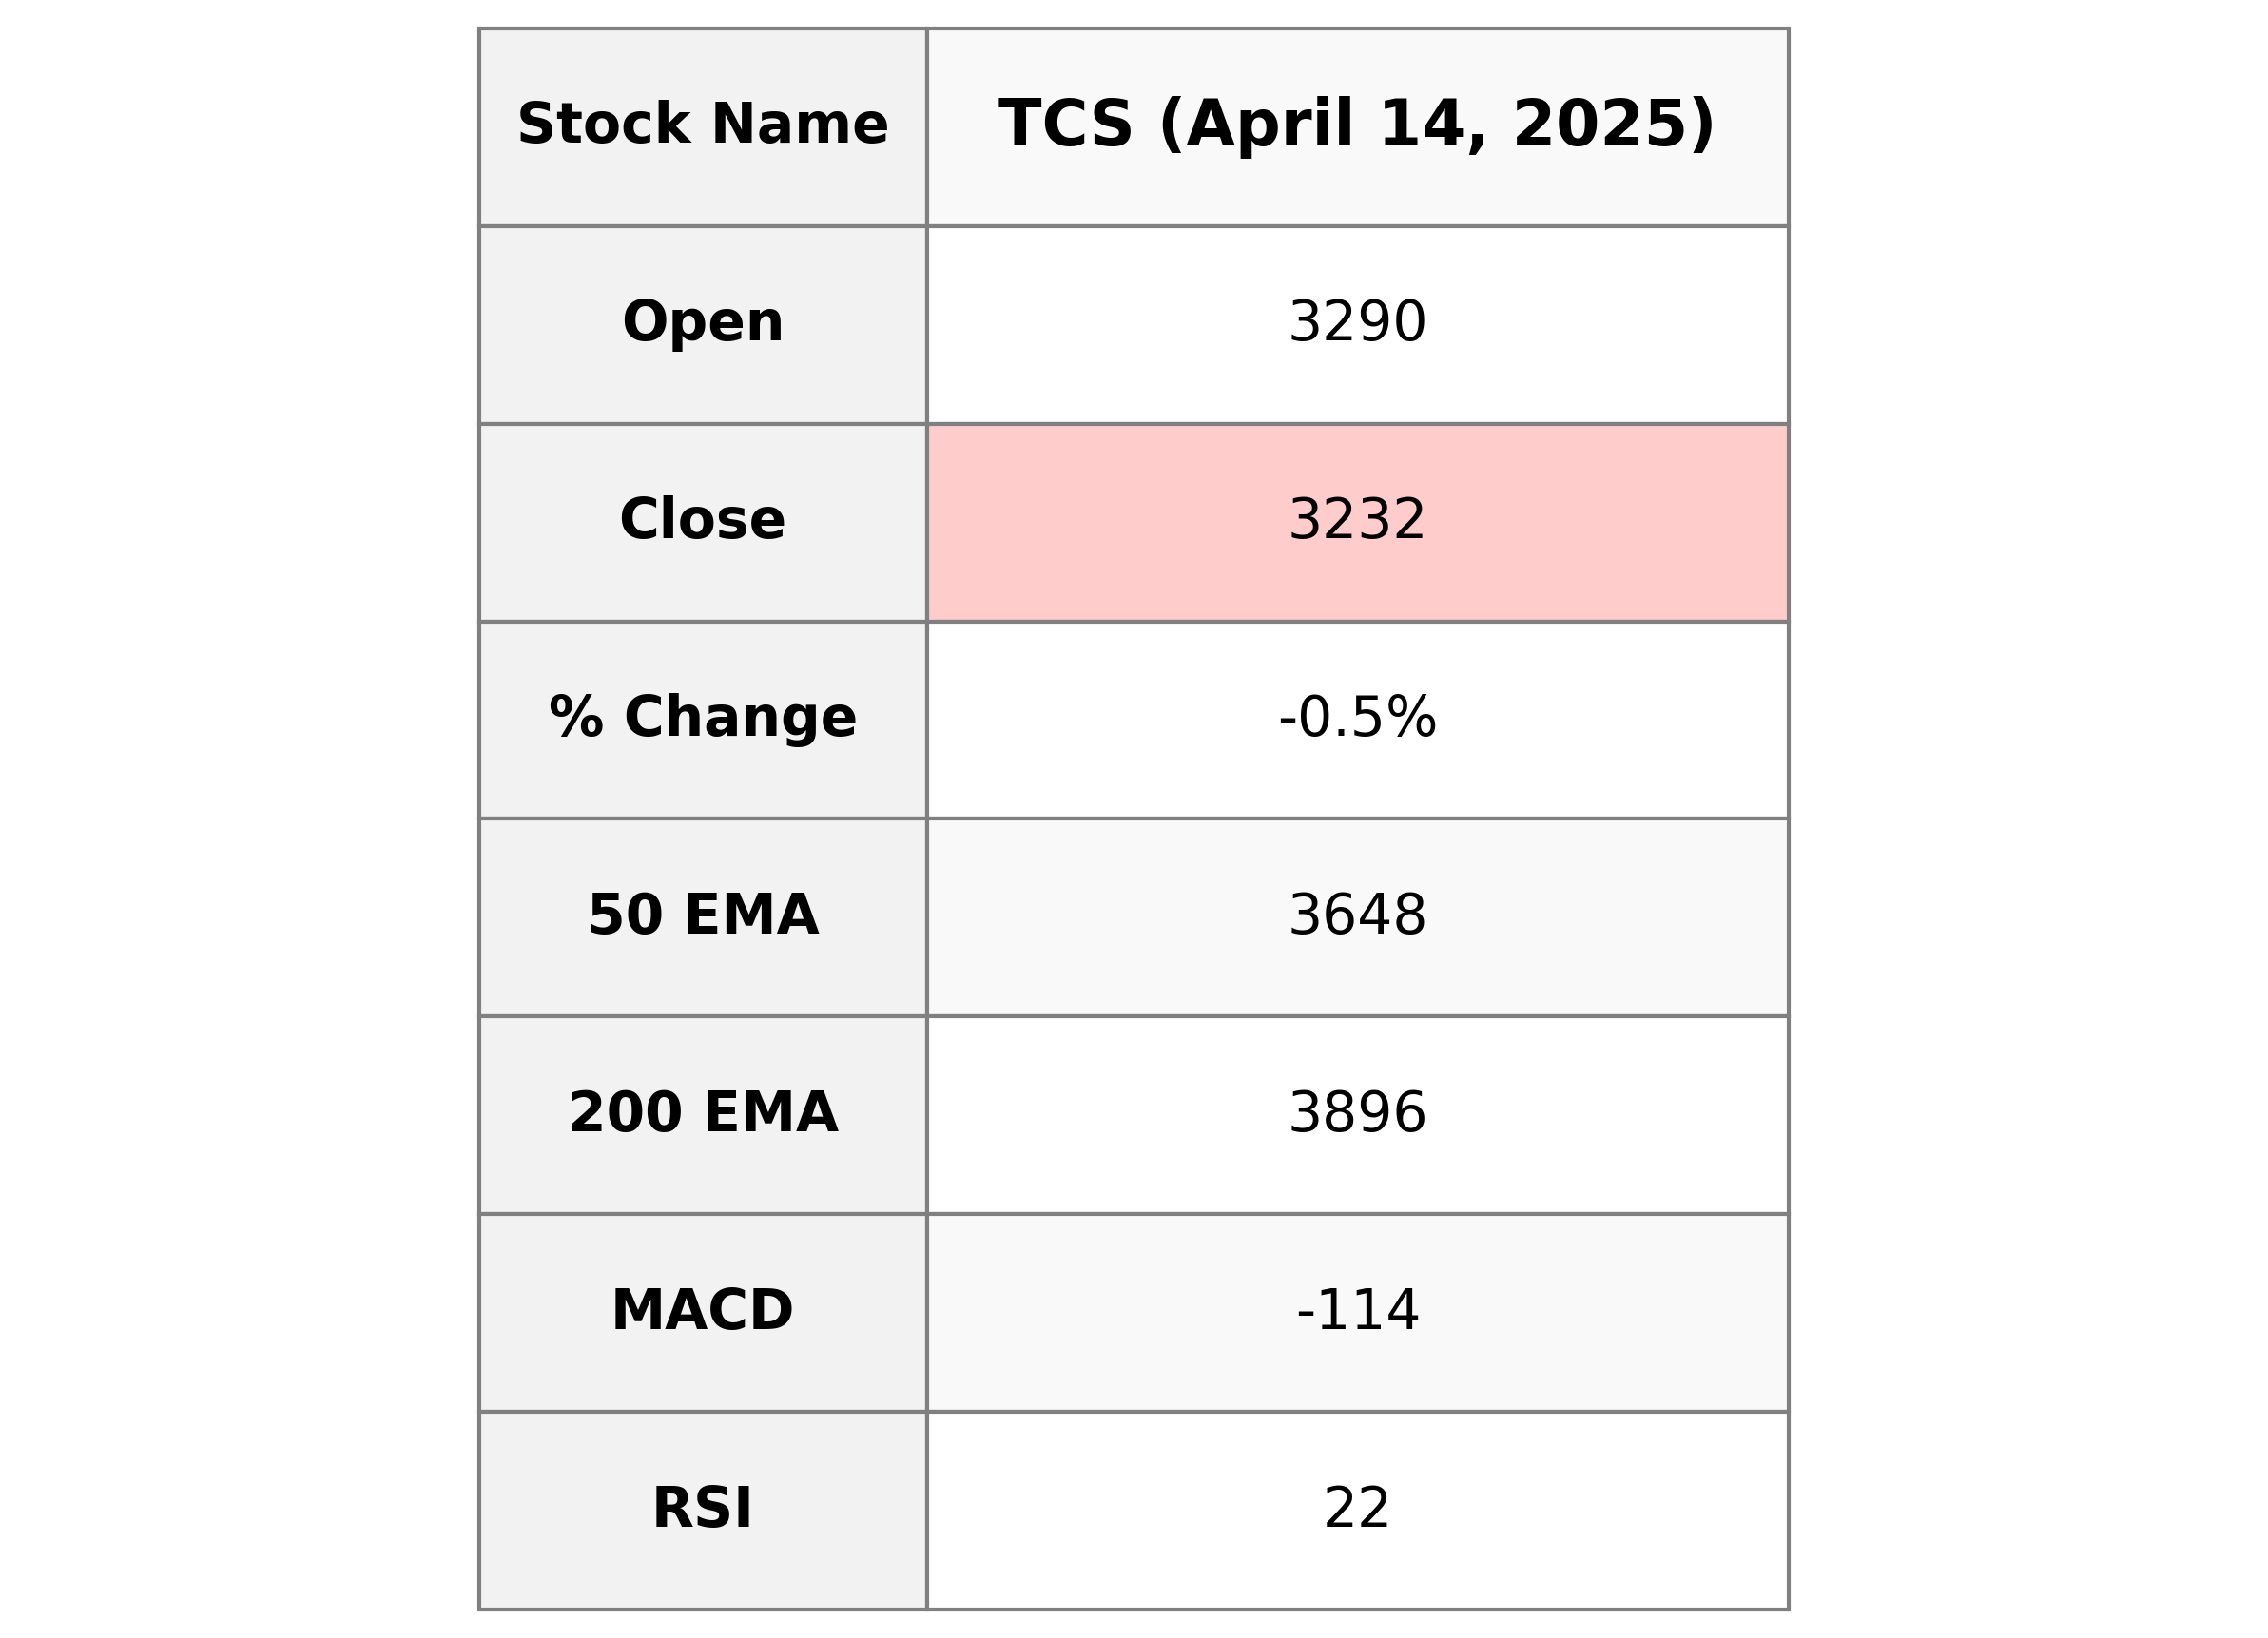
TCS Performance: TCS experienced a slight decline in stock performance on the reported day, with its close price at 3231.5, down 0.47% from the previous close. The volume of shares traded was around 7.1 million. Key technical indicators like the RSI (22.49) suggest that the stock might be in an oversold territory. Despite this, the company maintains a robust market cap of over $117 billion, highlighting its strong presence in the technology sector.
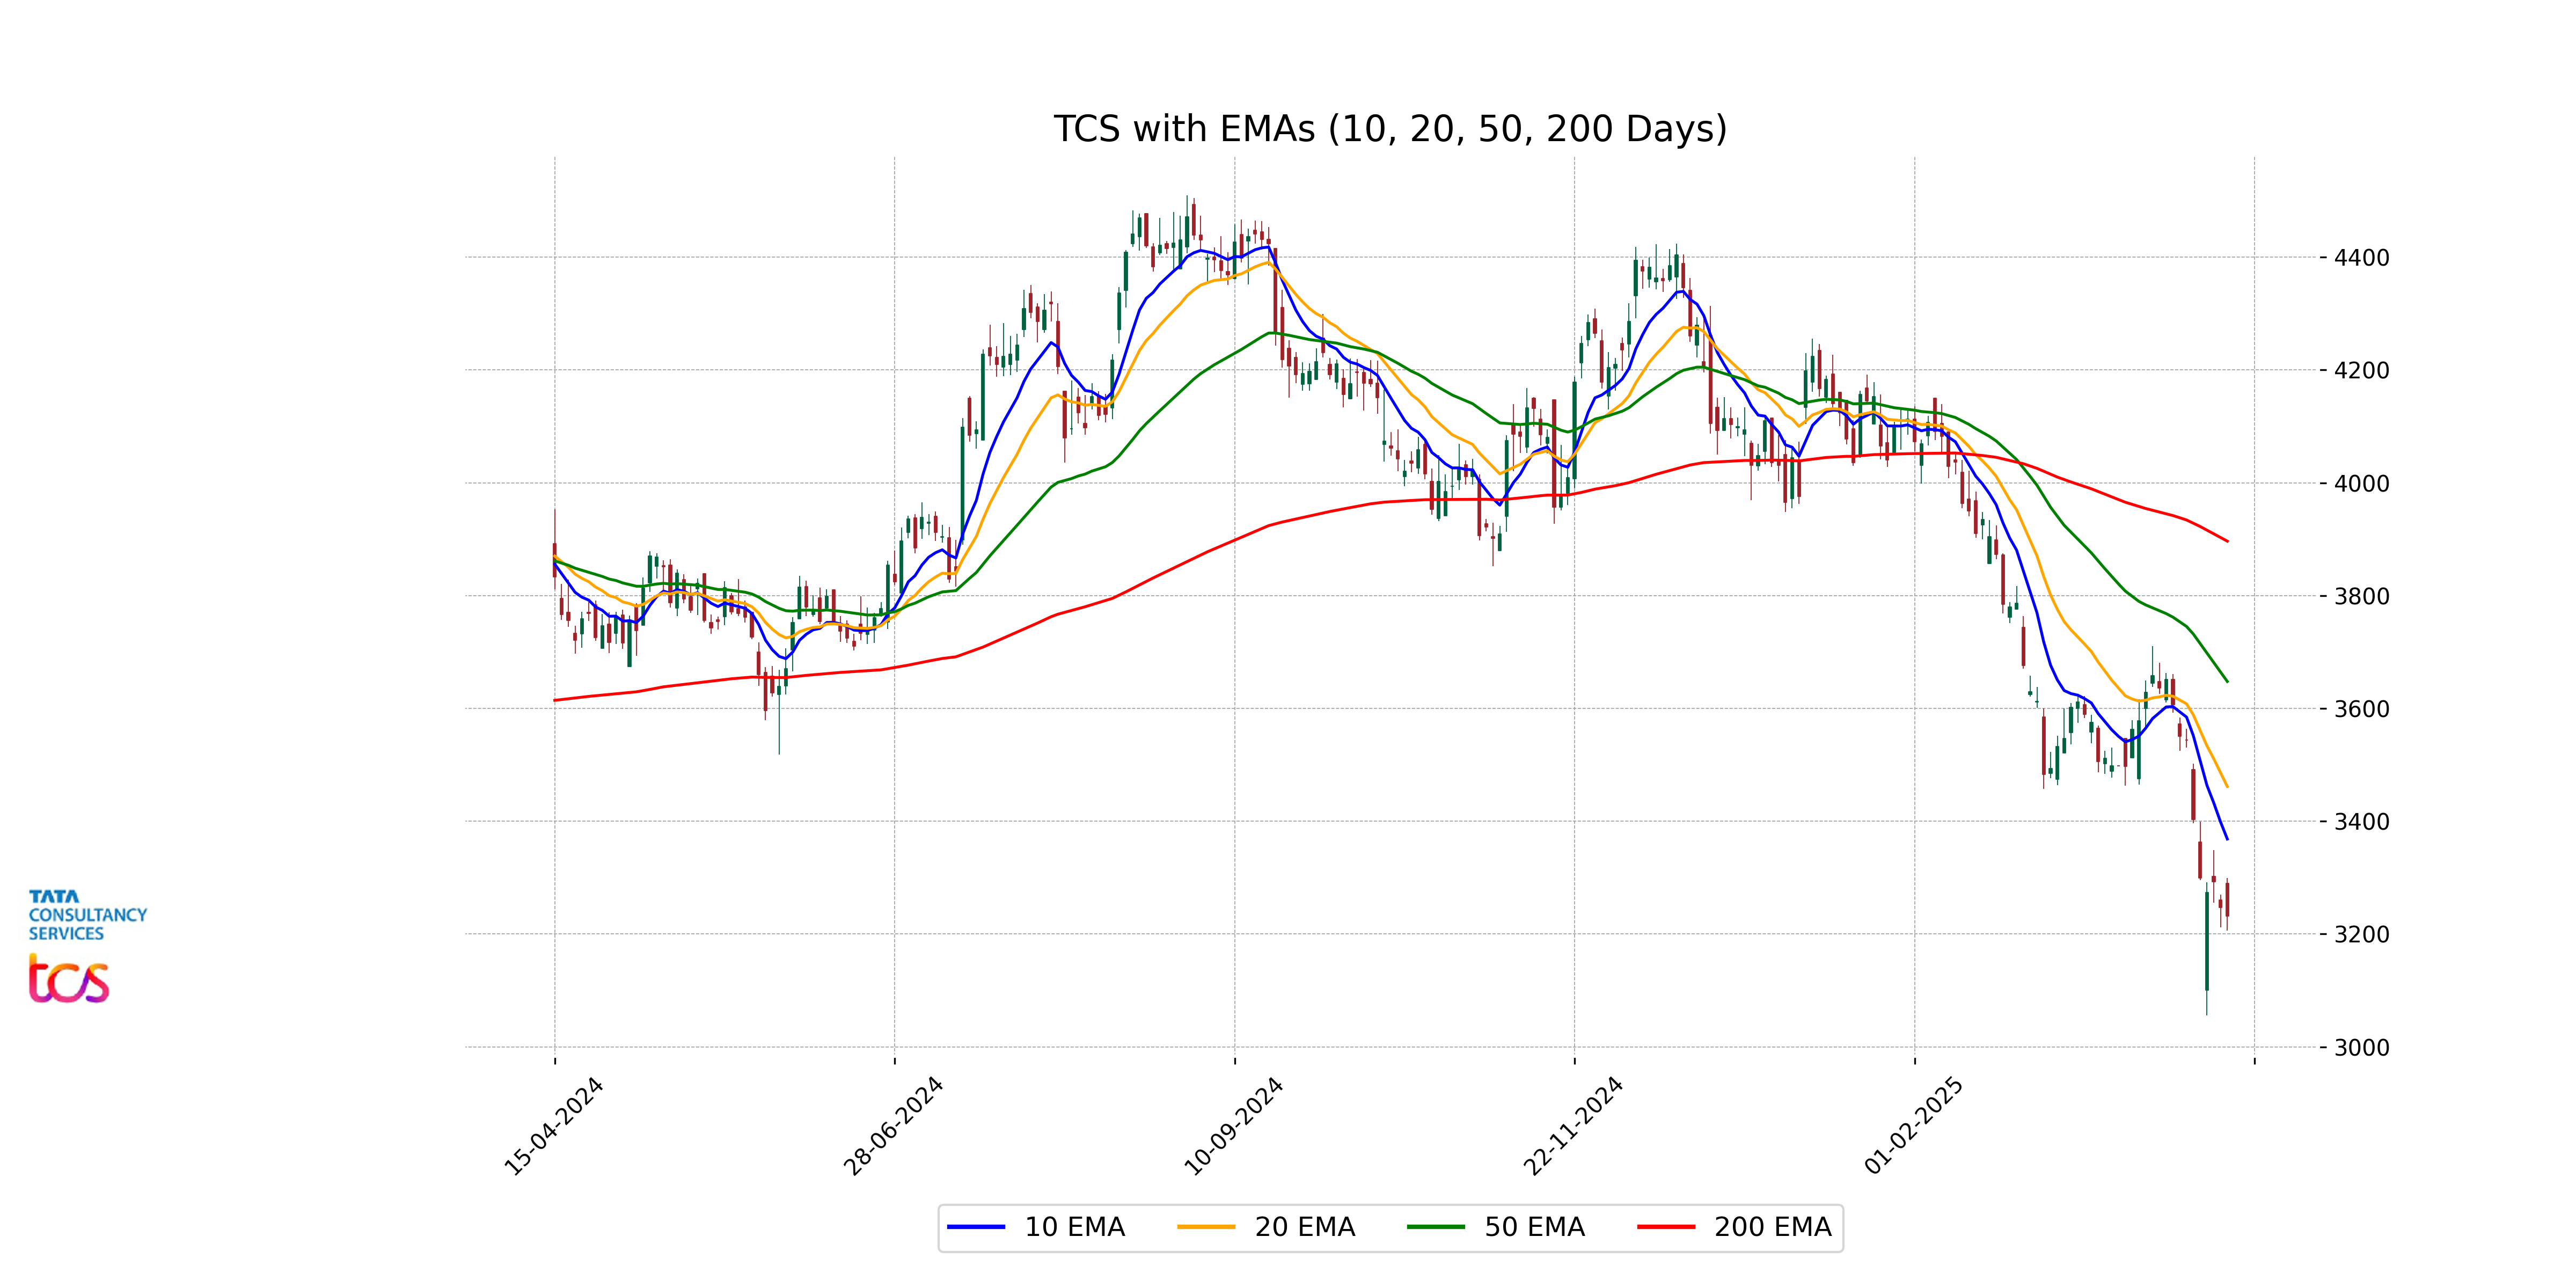
Relationship with Key Moving Averages
TCS traded below its key moving averages, including the 50-day EMA of 3647.66 and the 200-day EMA of 3896.48, indicating bearish momentum. The 10-day EMA of 3368.37 and 20-day EMA of 3461.41 also suggest recent downward pressure compared to the closing price of 3231.5.
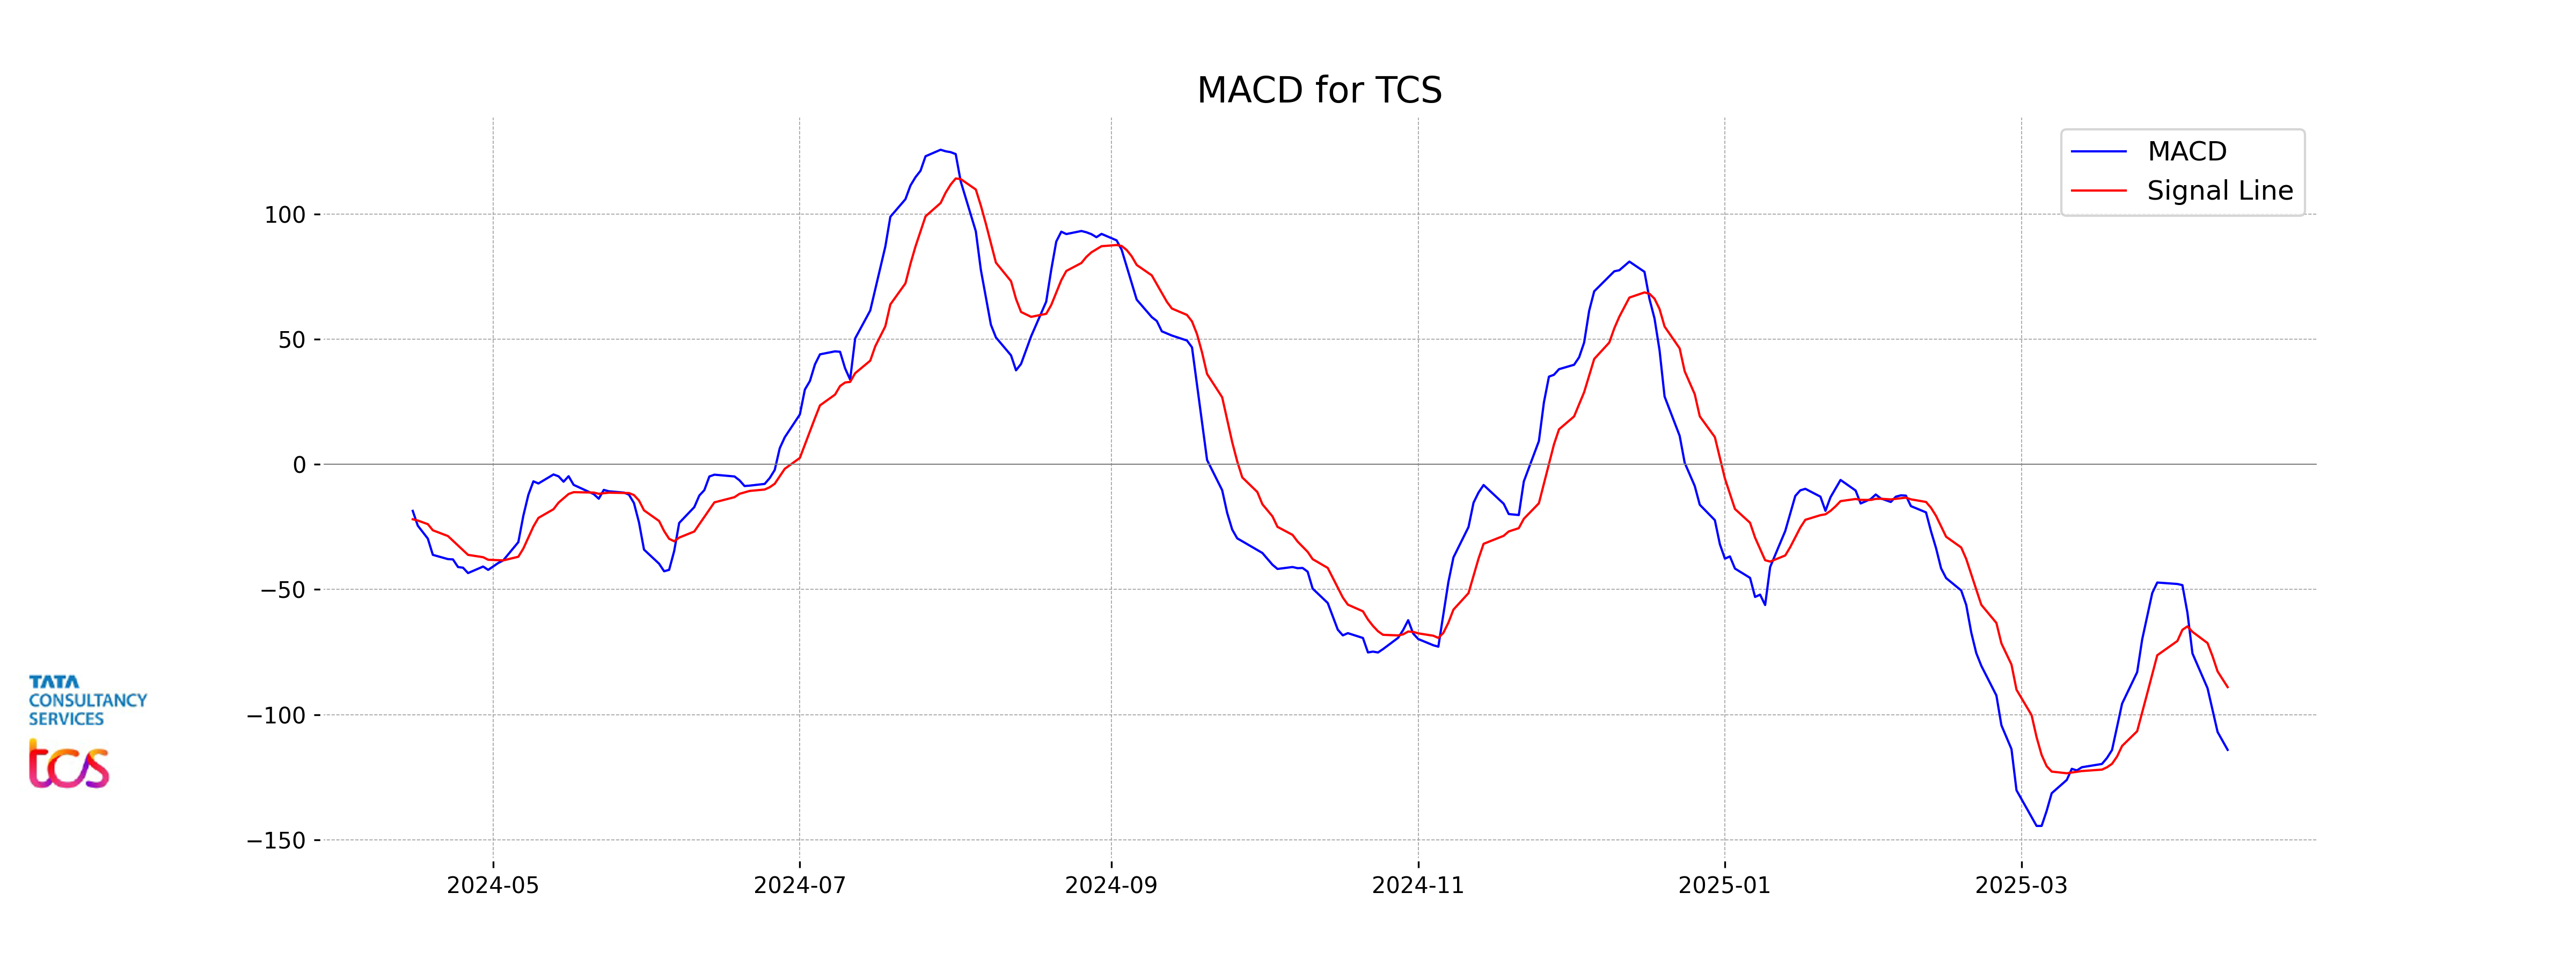
Moving Averages Trend (MACD)
Tata Consultancy Services (TCS) shows a bearish trend with the MACD indicating a negative value of -114.06, which is below the MACD Signal of -88.99. This suggests a bearish momentum as the MACD line is diverging from the signal line, indicating that the stock may continue to experience downward pressure.
RSI Analysis
The RSI for TCS is 22.49, which suggests that the stock is currently in the oversold territory. Typically, an RSI value below 30 indicates that the stock may be undervalued and could be a potential buying opportunity for investors. However, it is important to consider other indicators and market conditions before making any investment decisions.
