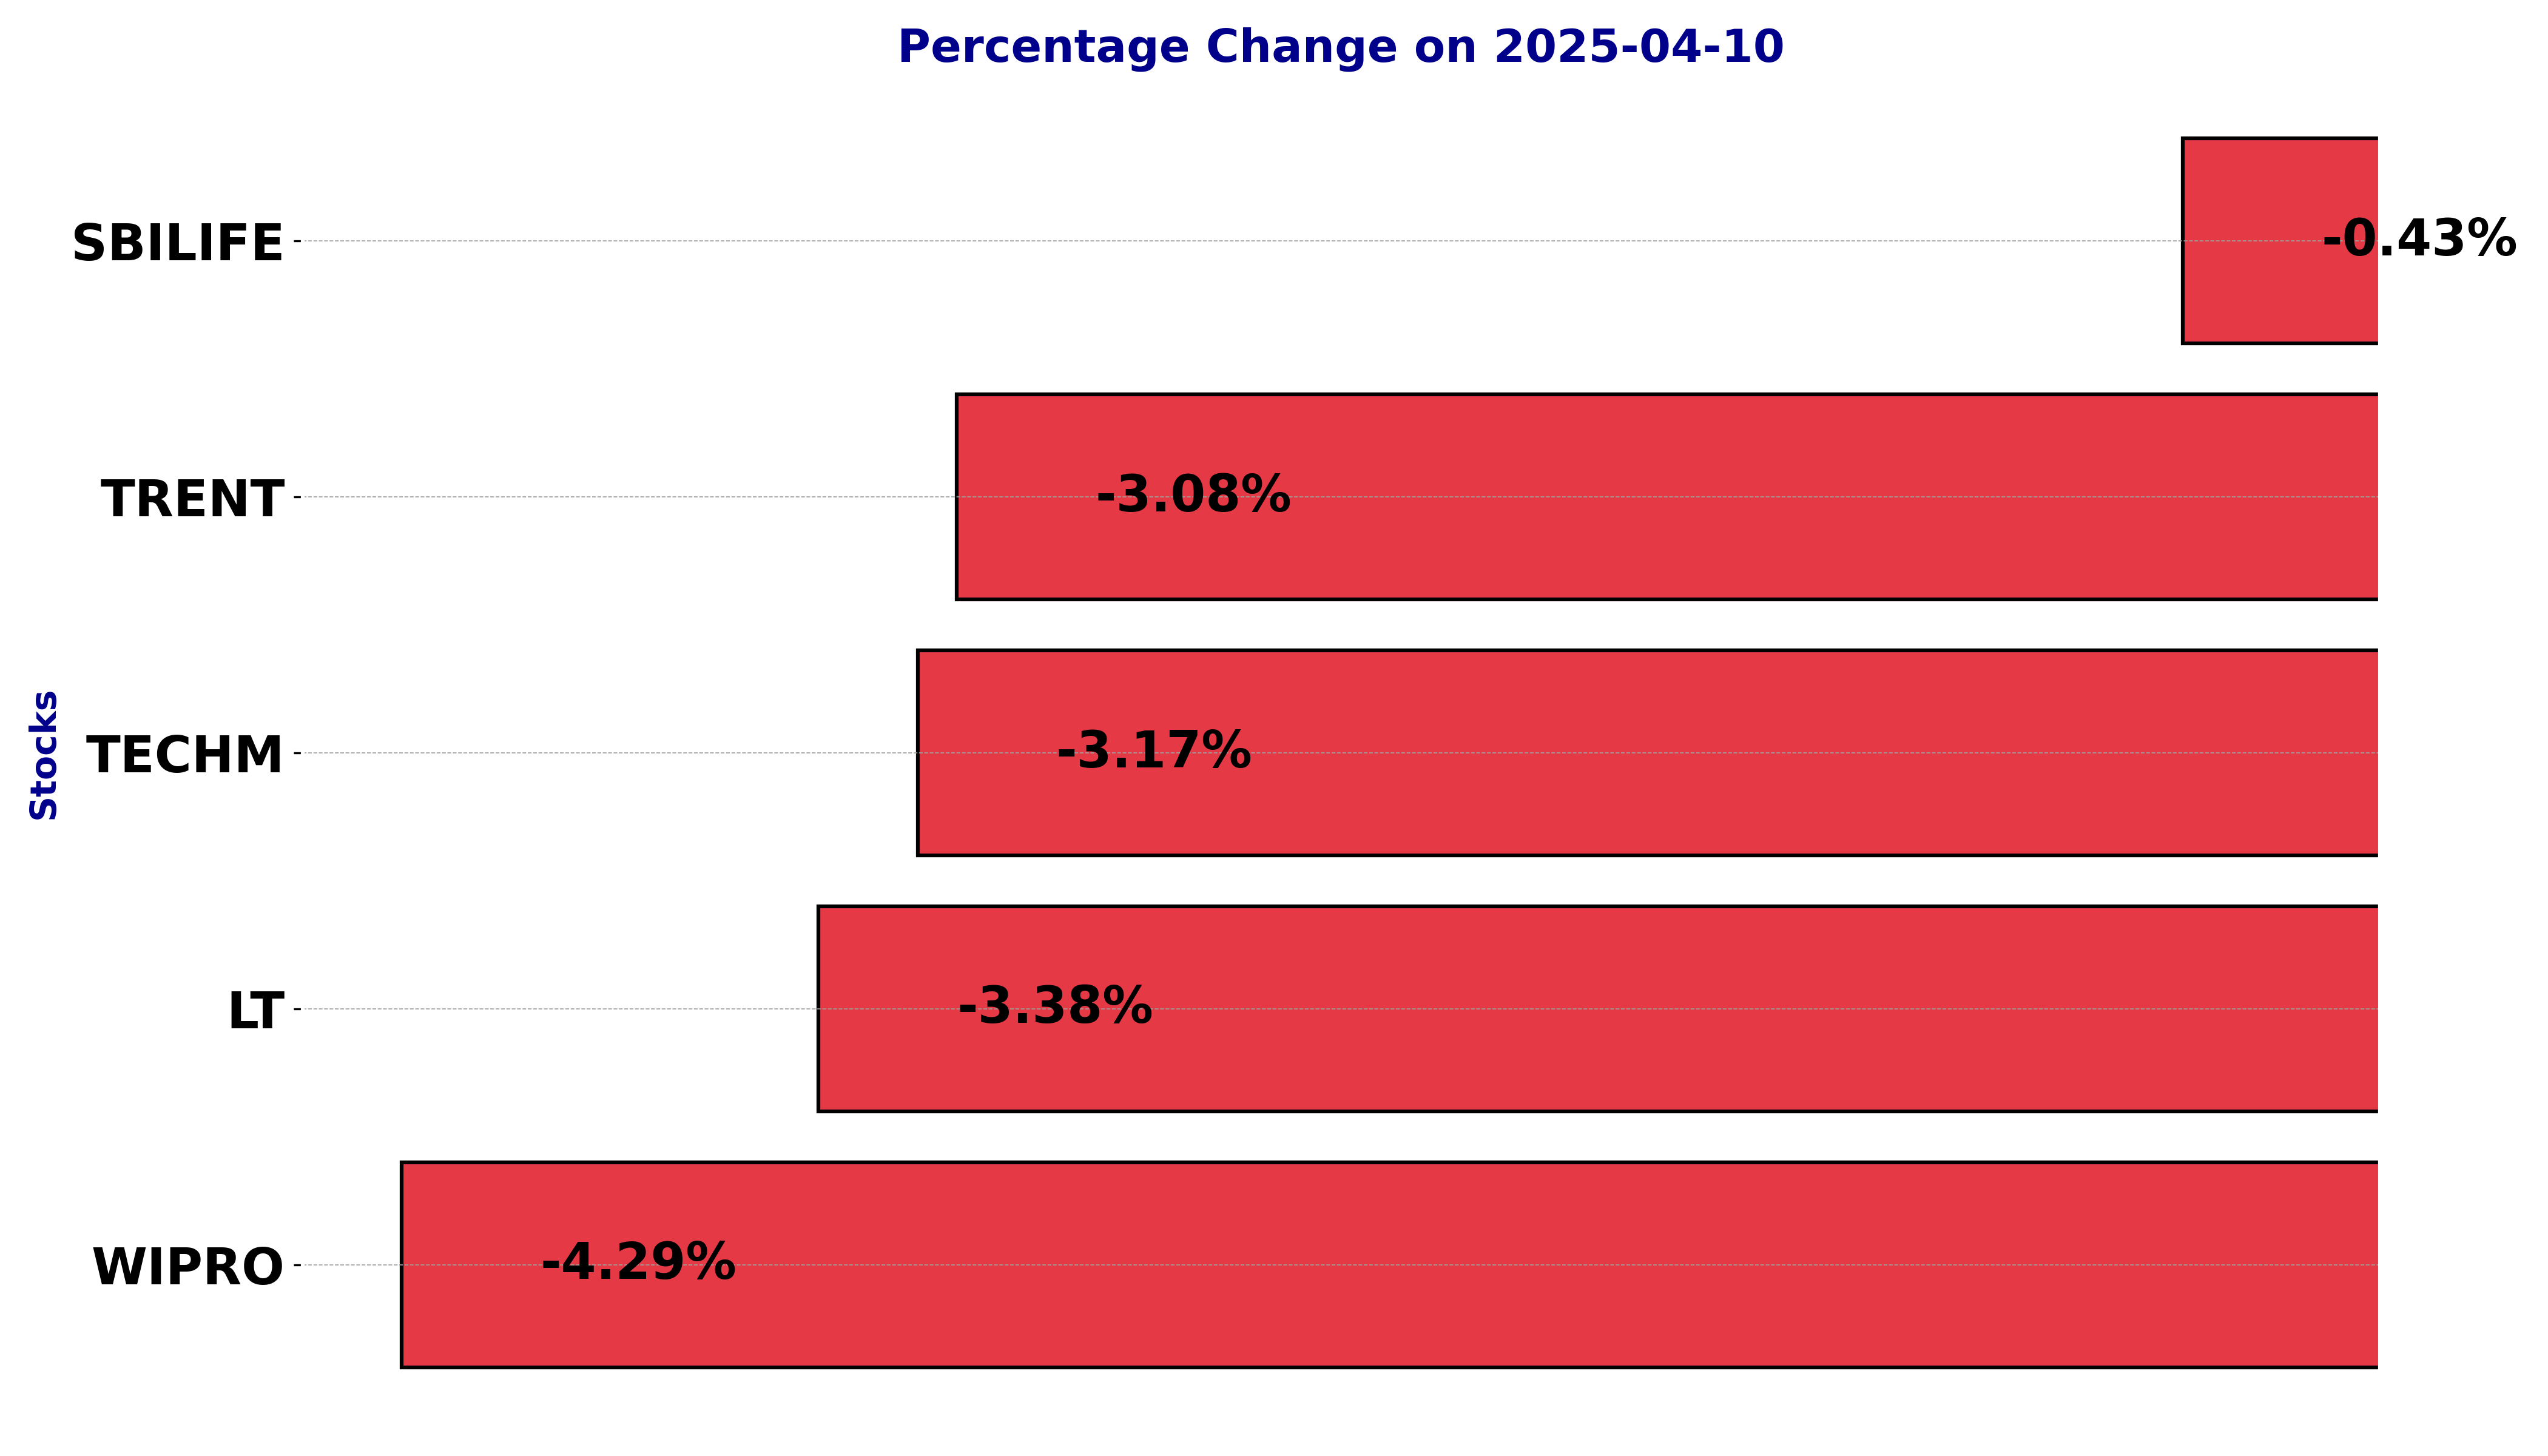
NSE Nifty 50 Top losers: What are the 5 Biggest Stock losers Today April 10, 2025
In this article, we will explore the technical indicators of some of the low-performing stocks on the Indian stock market, including LT, SBILIFE, TECHM, TRENT, and WIPRO.
By looking at these stocks through the lens of key technical factors, we aim to better understand their price movements, trends, and potential future performance.
Analysis for HCL Technologies - April 10, 2025
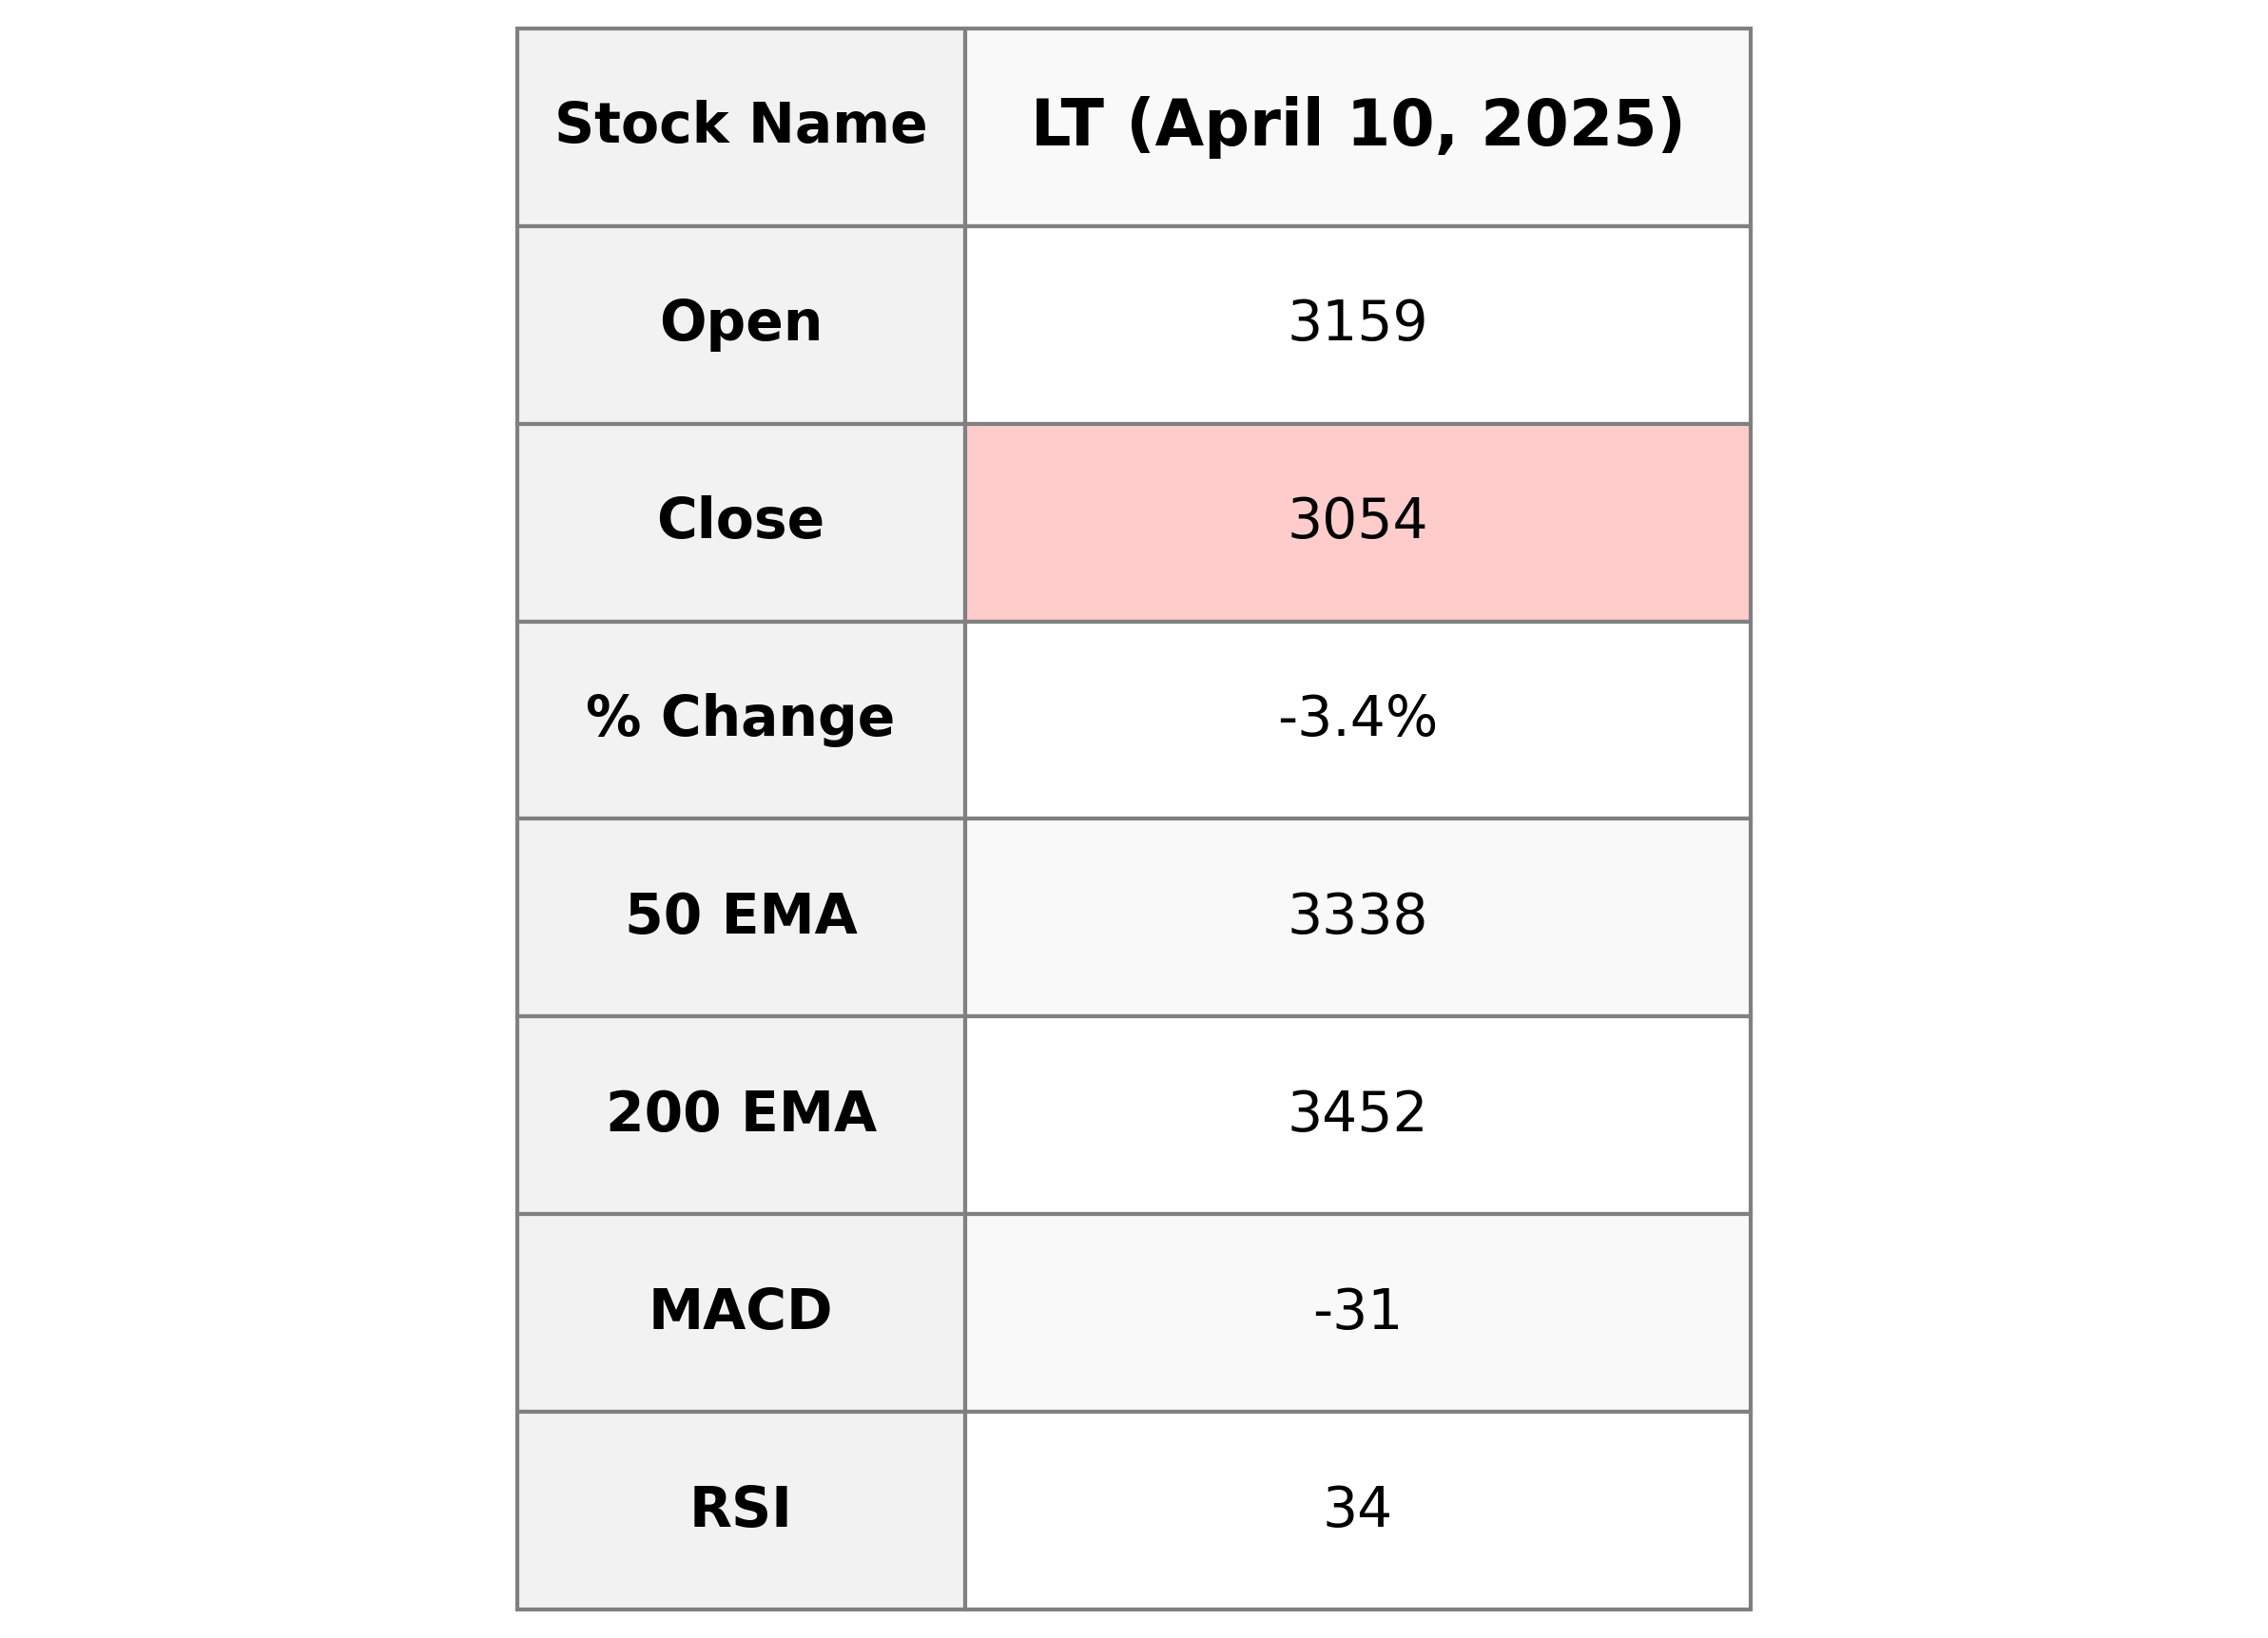
HCL Technologies Performance Analysis HCL Technologies experienced a notable decline with its closing price at 3054.15 compared to the previous close of 3161.10, marking a percentage change of -3.38%. The stock is under pressure, as indicated by the RSI of 34.25 suggesting it is approaching oversold territory. The MACD is below the signal line with a negative value, signaling potential bearish momentum. Despite the downturn, the company maintains a strong market cap of 4200 billion INR and operates in the Industrials sector, specifically in Engineering & Construction in India.
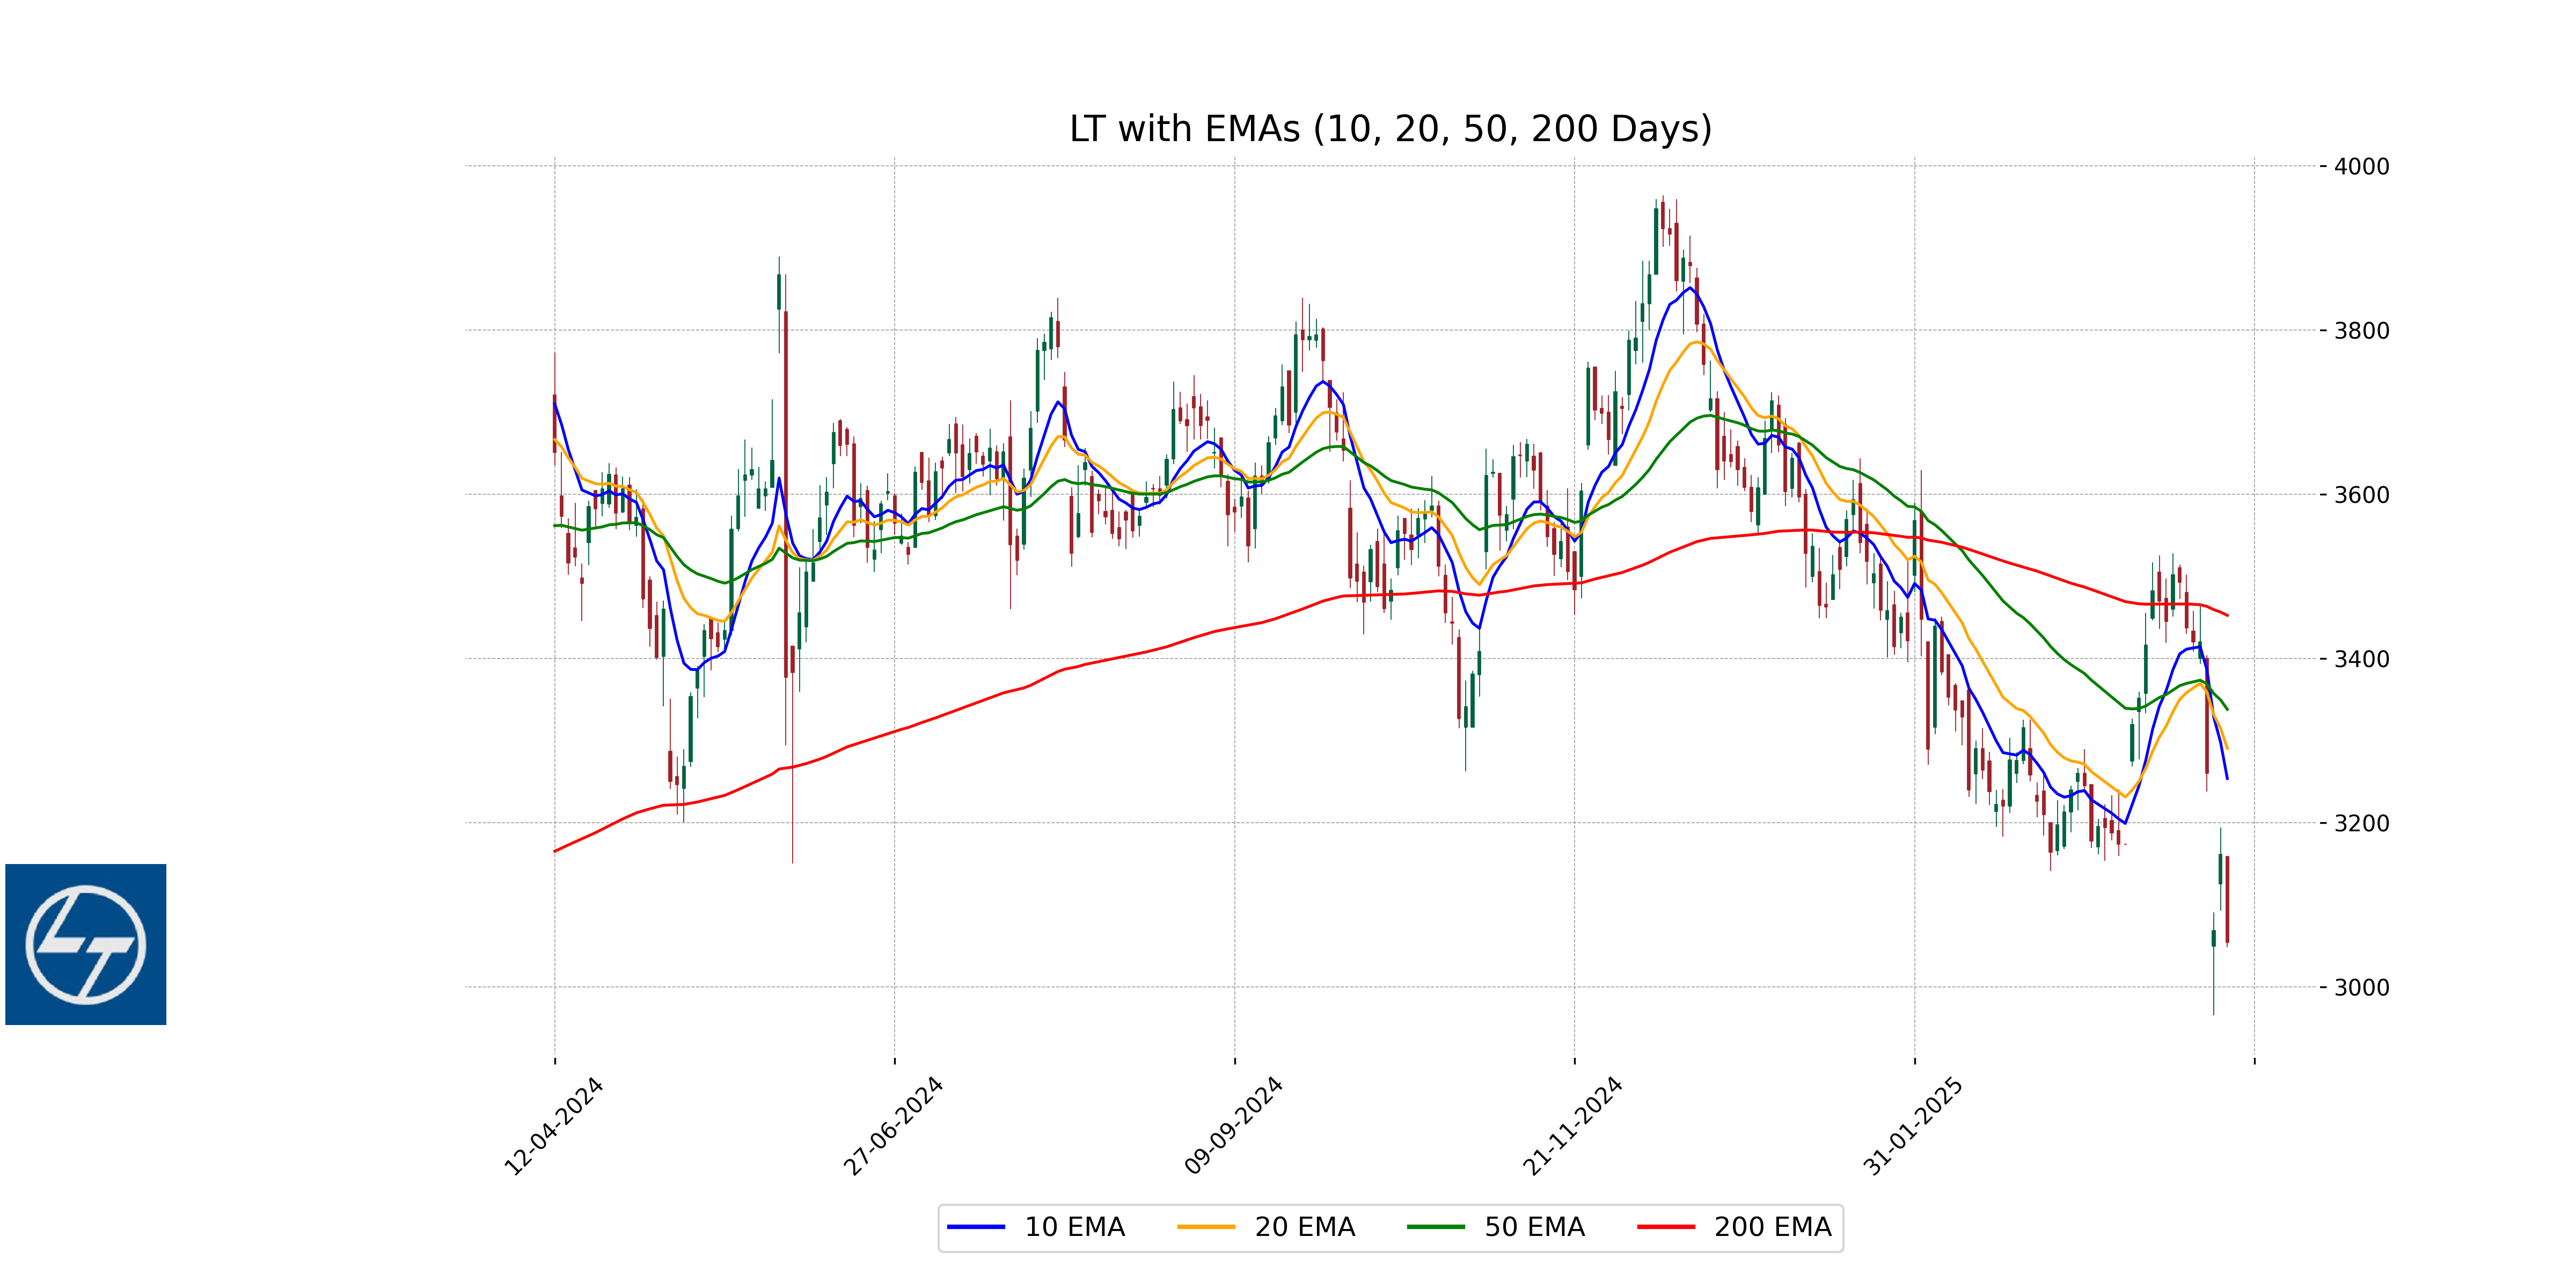
Relationship with Key Moving Averages
Larsen & Toubro is currently trading below its key moving averages, as its latest closing price of 3054.15 is below the 10 EMA (3253.59), 20 EMA (3290.23), 50 EMA (3337.78), and 200 EMA (3452.22). This indicates a bearish trend relative to these averages.
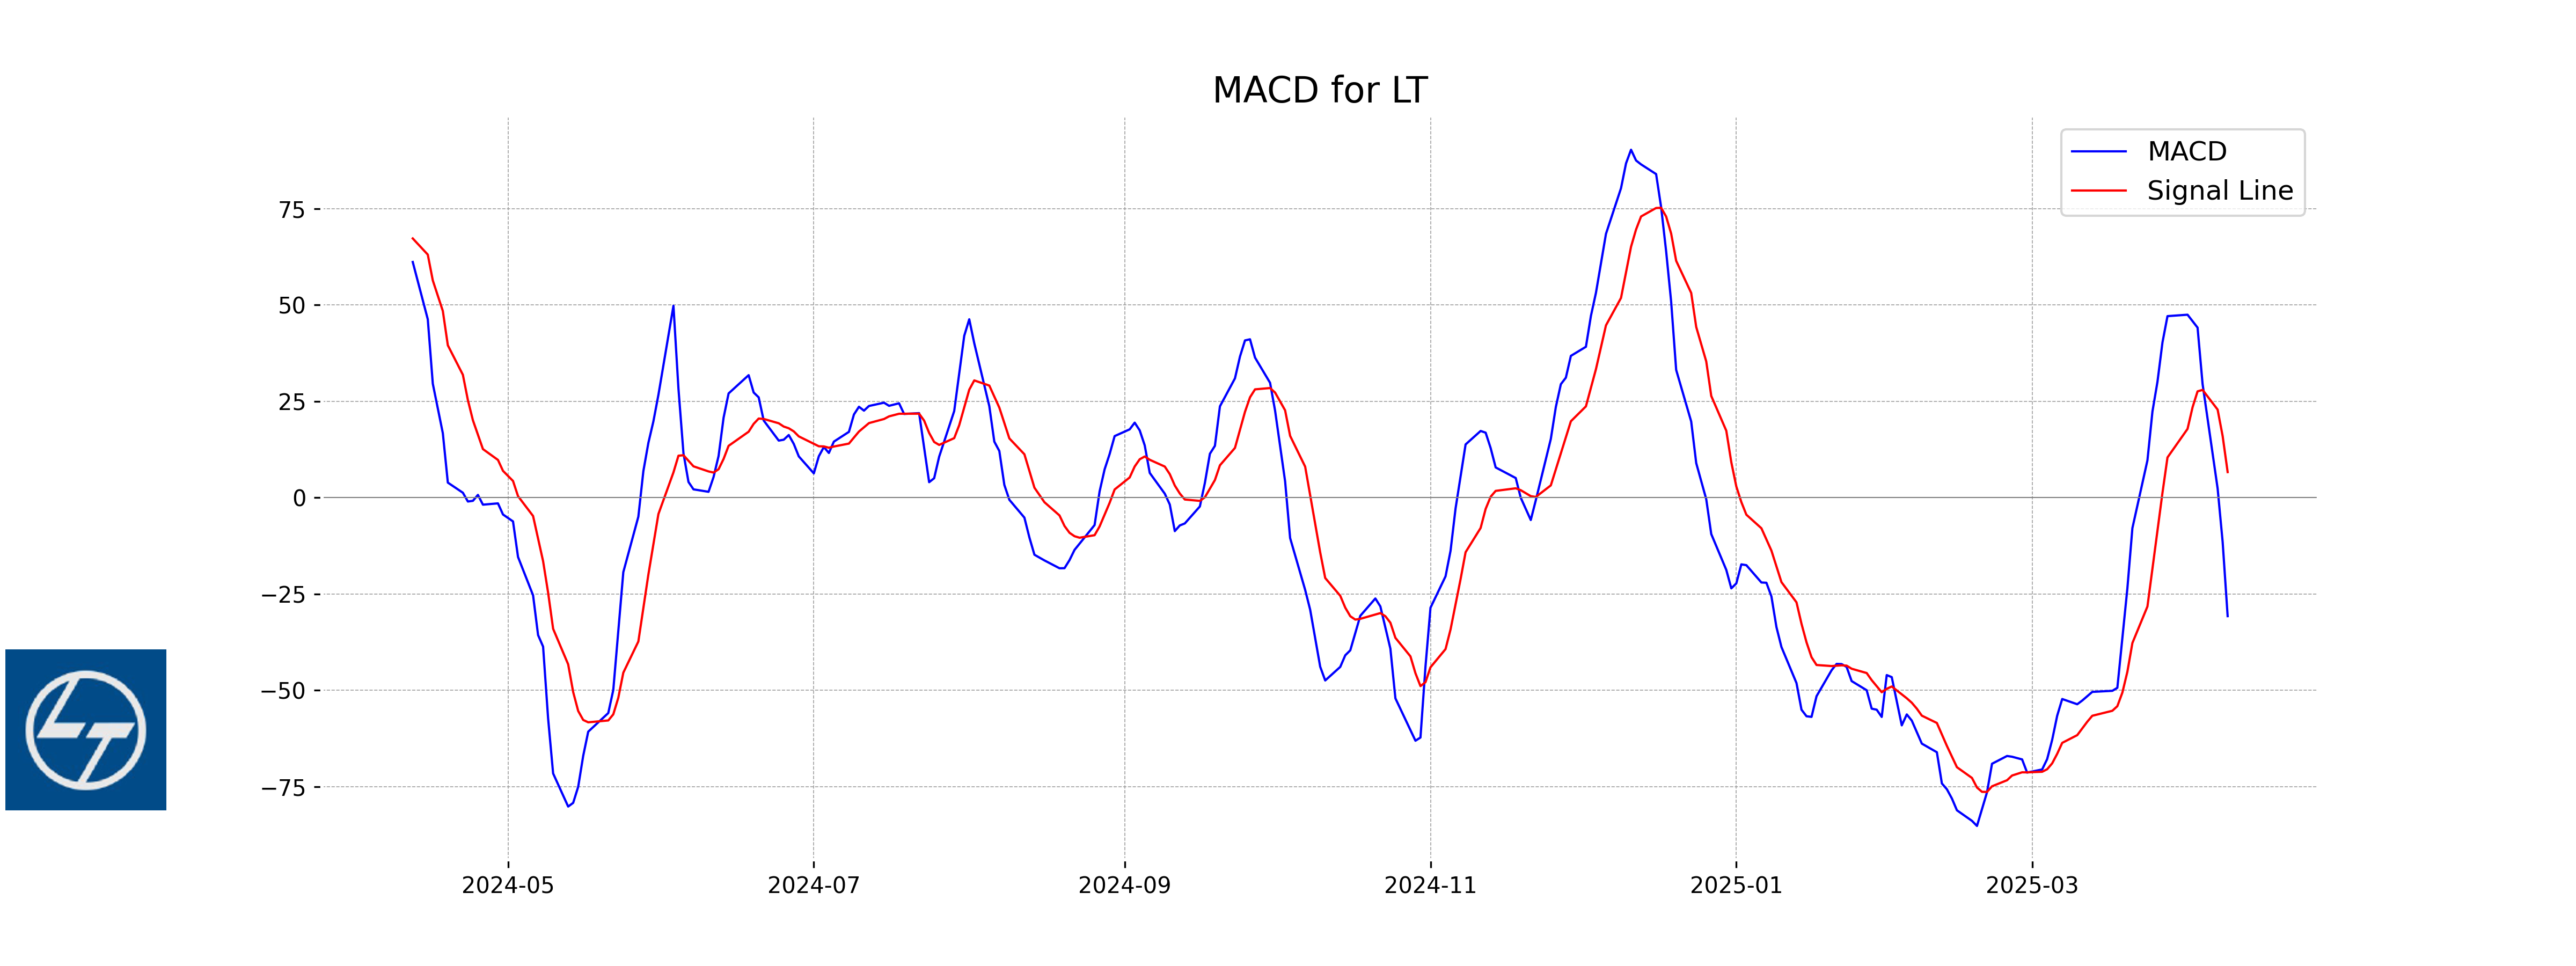
Moving Averages Trend (MACD)
The MACD for Larsen & Toubro (LT.NS) is -30.73, indicating a bearish signal as it is below the MACD Signal line of 6.65. This suggests a downward momentum in the stock's price. While this analysis is specific to Larsen & Toubro and not applicable to HCL Technologies, it highlights a potential caution for investors in stocks with similar MACD patterns.
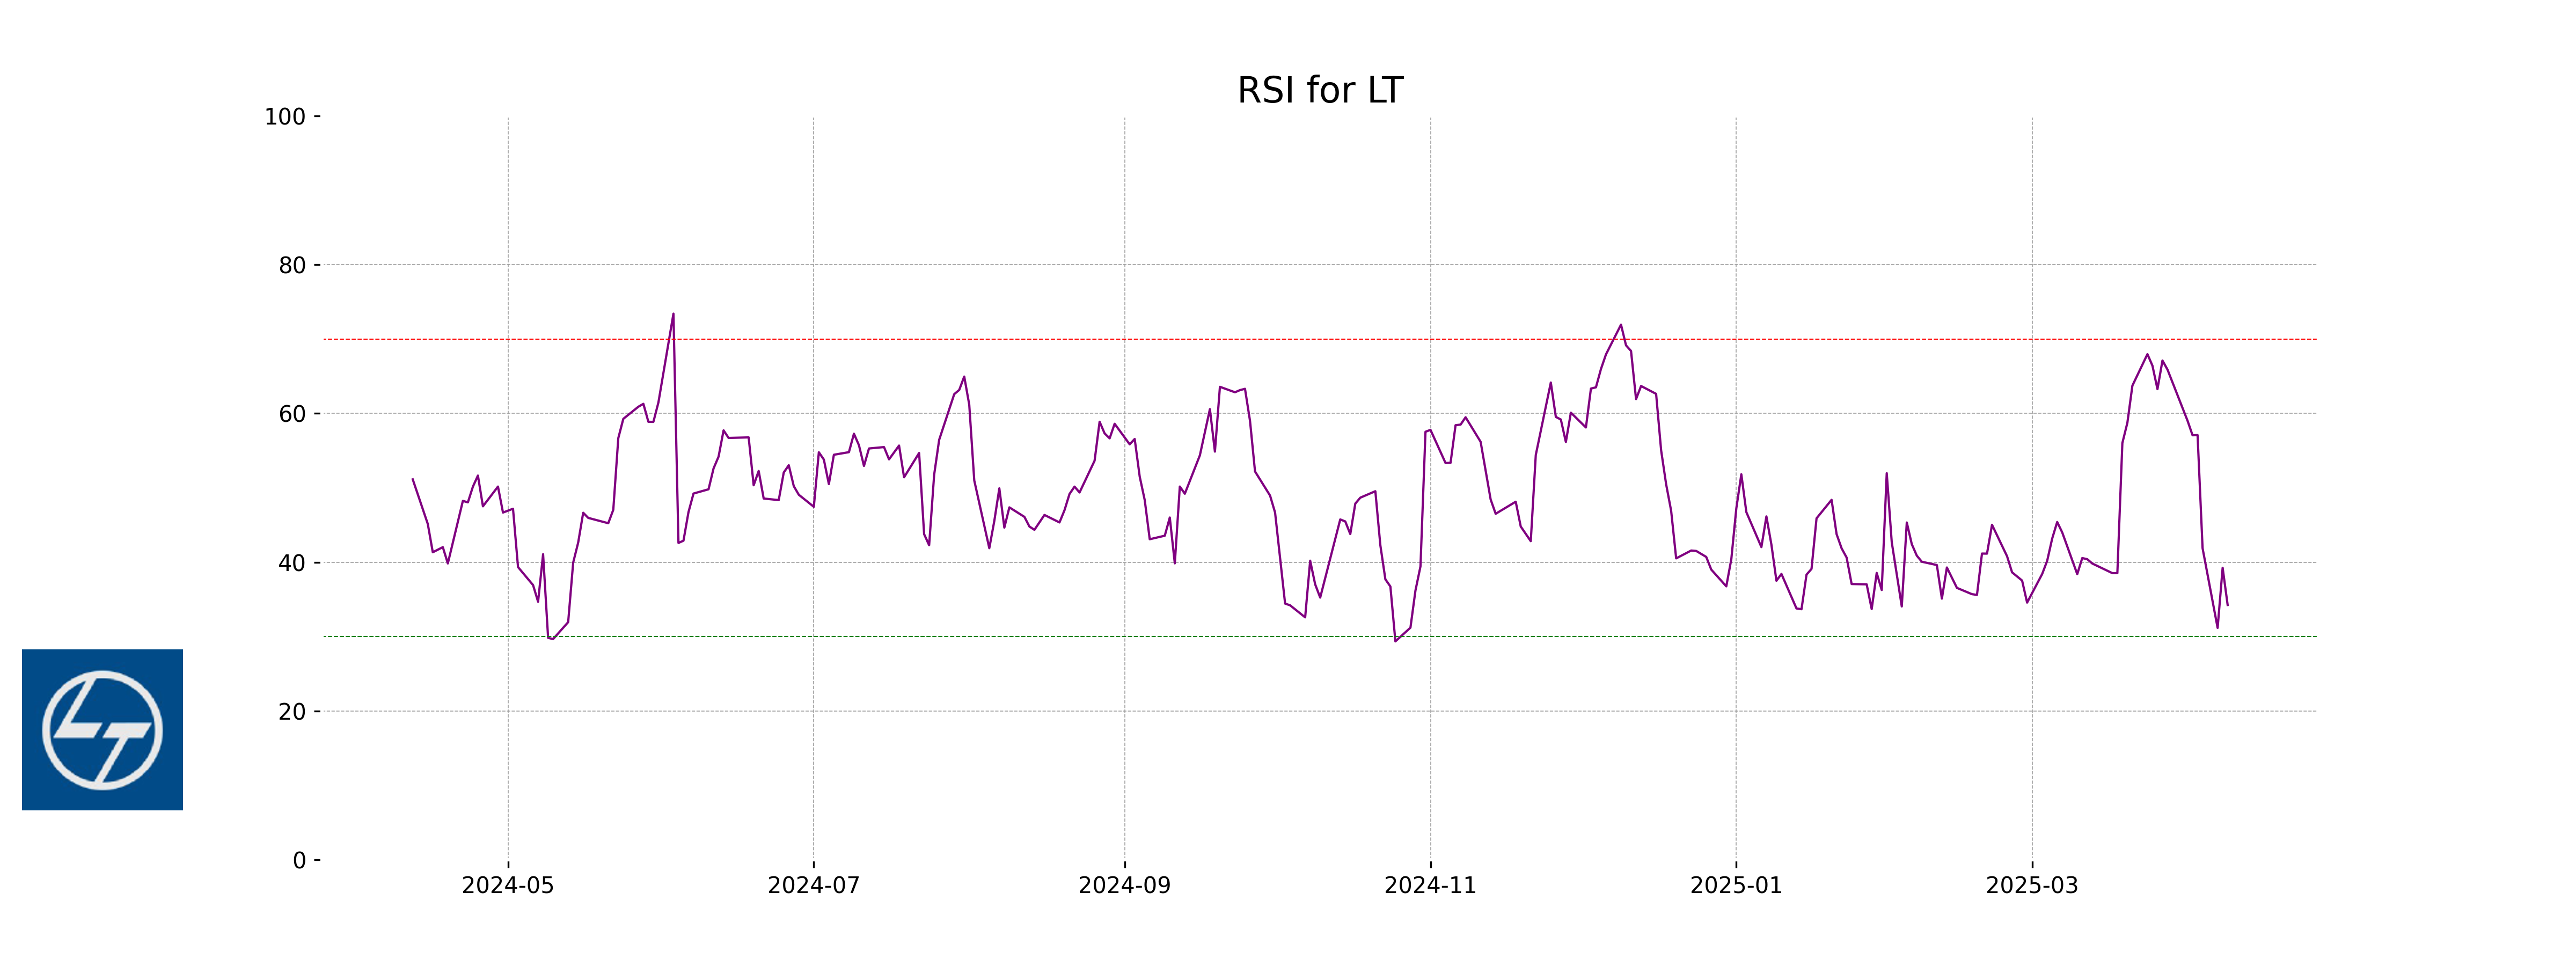
RSI Analysis
HCL Technologies exhibits a Relative Strength Index (RSI) of 34.25, indicating that the stock is approaching the oversold territory. This suggests potential for a price reversal if the trend continues, as values below 30 are typically considered oversold.
Analysis for SBI Life - April 10, 2025

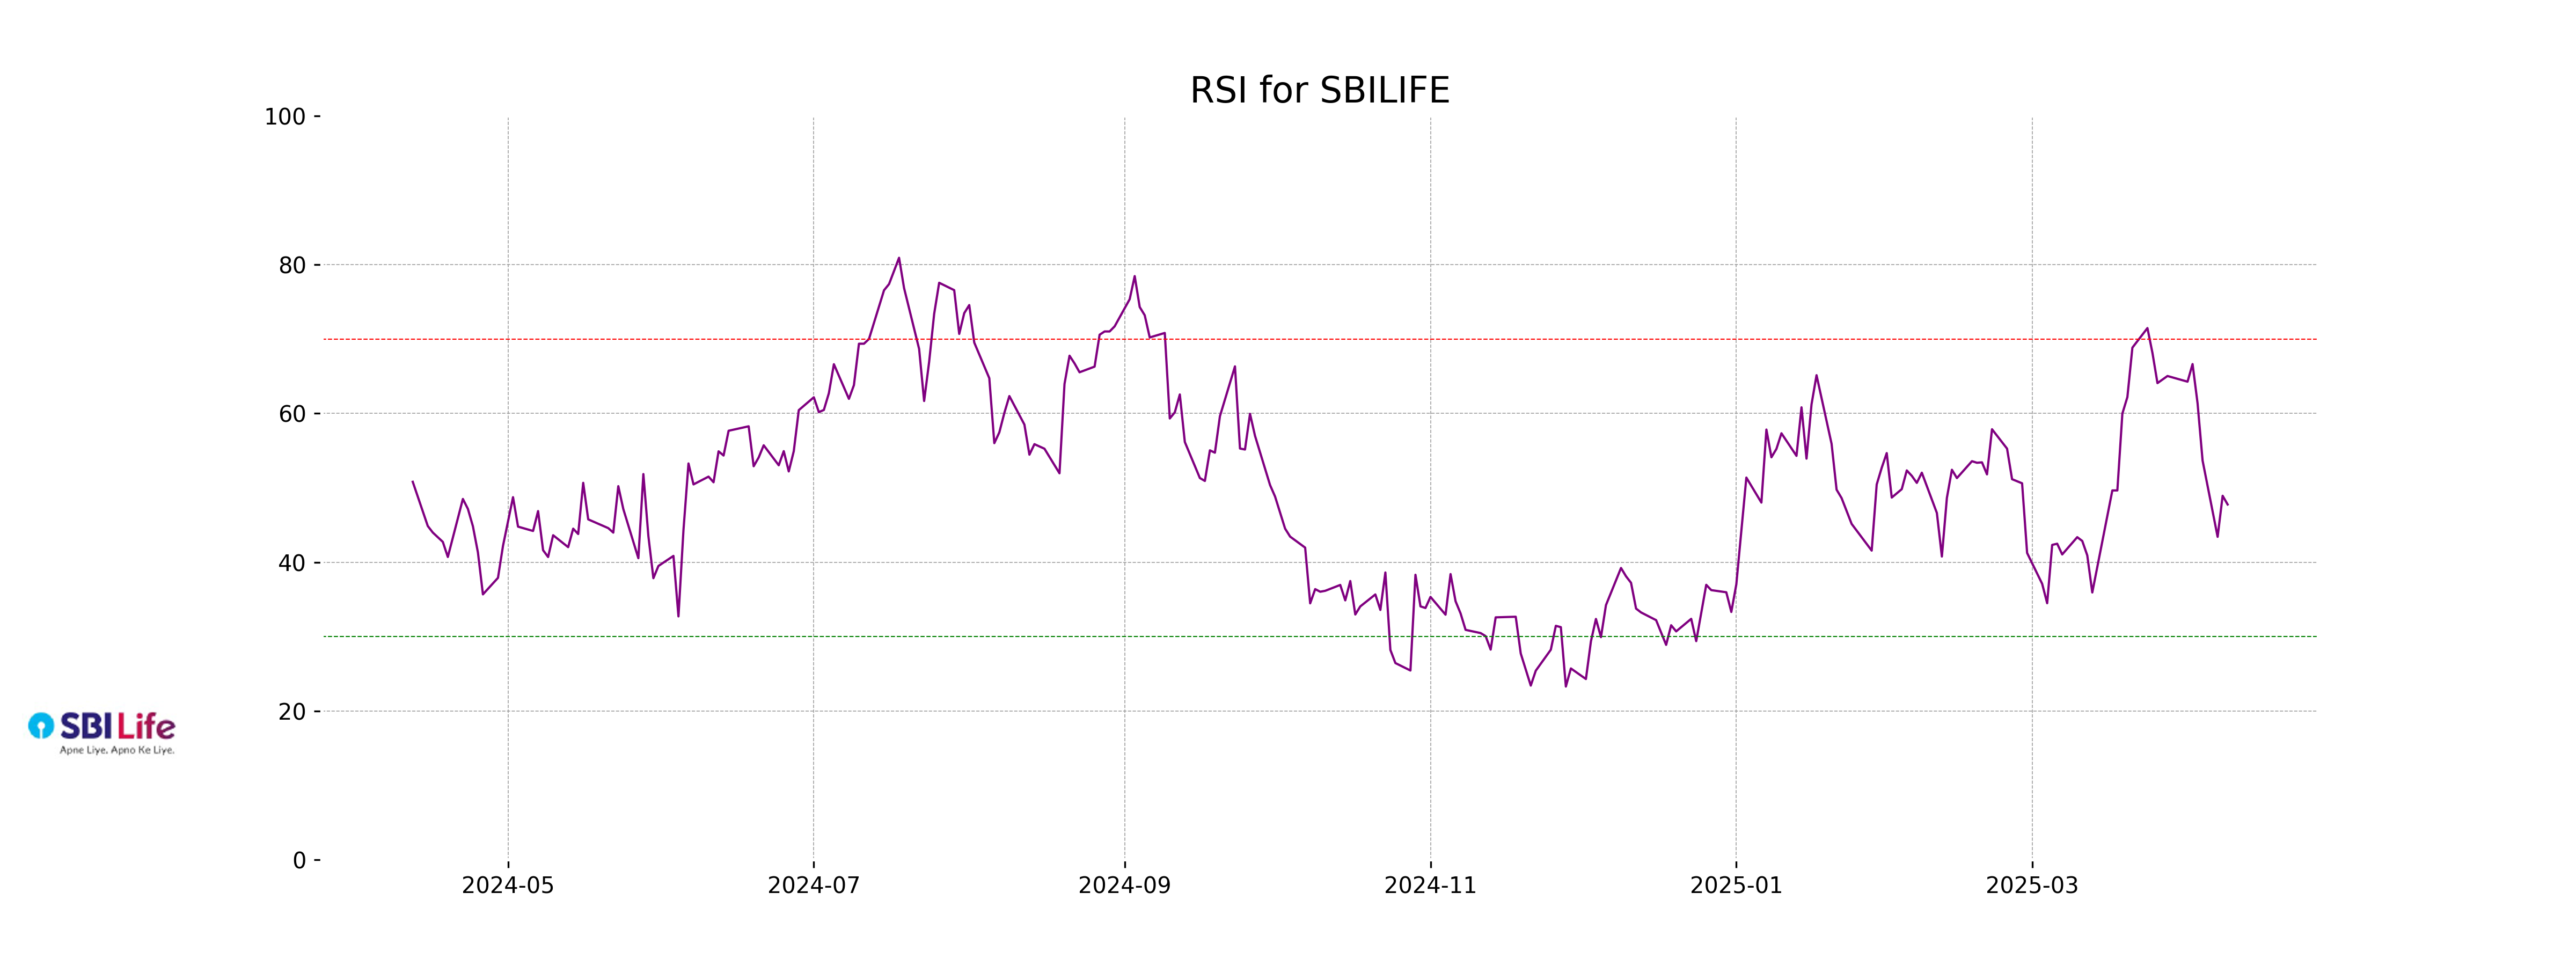
SBI Life Performance: SBI Life closed at 1481.65, down 0.43% from the previous close, with a volume of 1,047,950 shares. The stock is trading below its 50 EMA of 1483.00 and its 200 EMA of 1514.35, indicating a possible downtrend. The RSI is at 47.76, suggesting the stock is neither overbought nor oversold, while the MACD signals a bearish outlook.
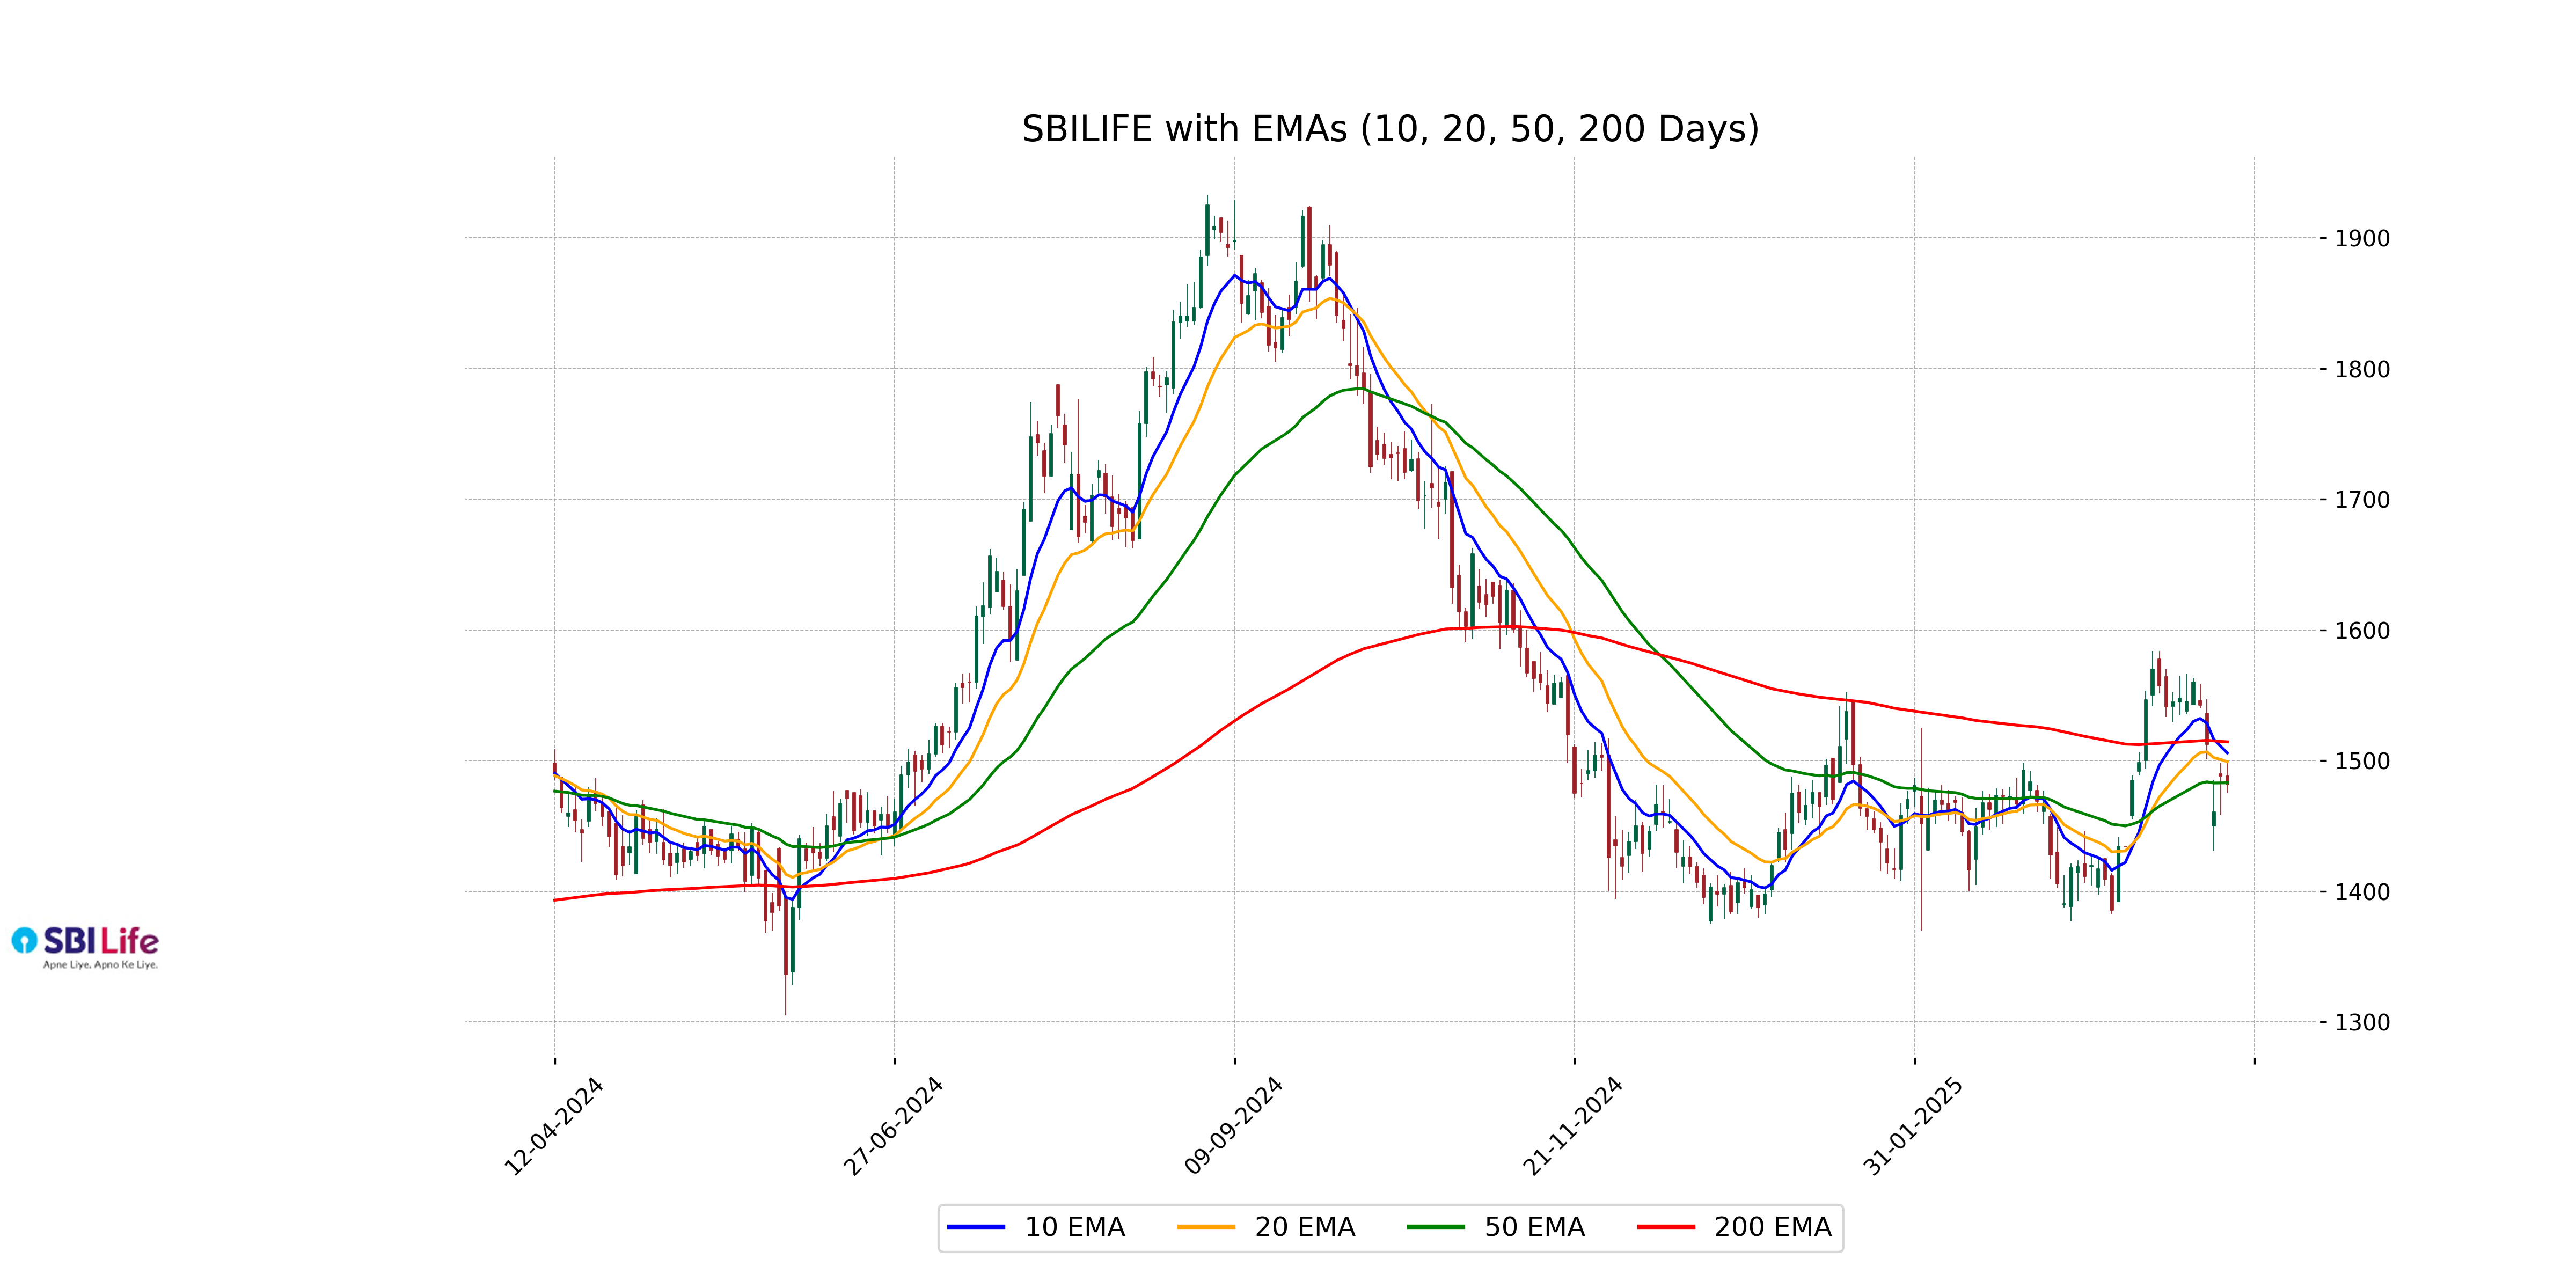
Relationship with Key Moving Averages
SBI Life closed at 1481.65, slightly below its 50-day EMA of 1483.00, indicating minor short-term bearishness. It remains below the 200-day EMA of 1514.35, suggesting overall longer-term bearish pressure, while also trading under its 10-day and 20-day EMAs, reinforcing the recent downtrend.
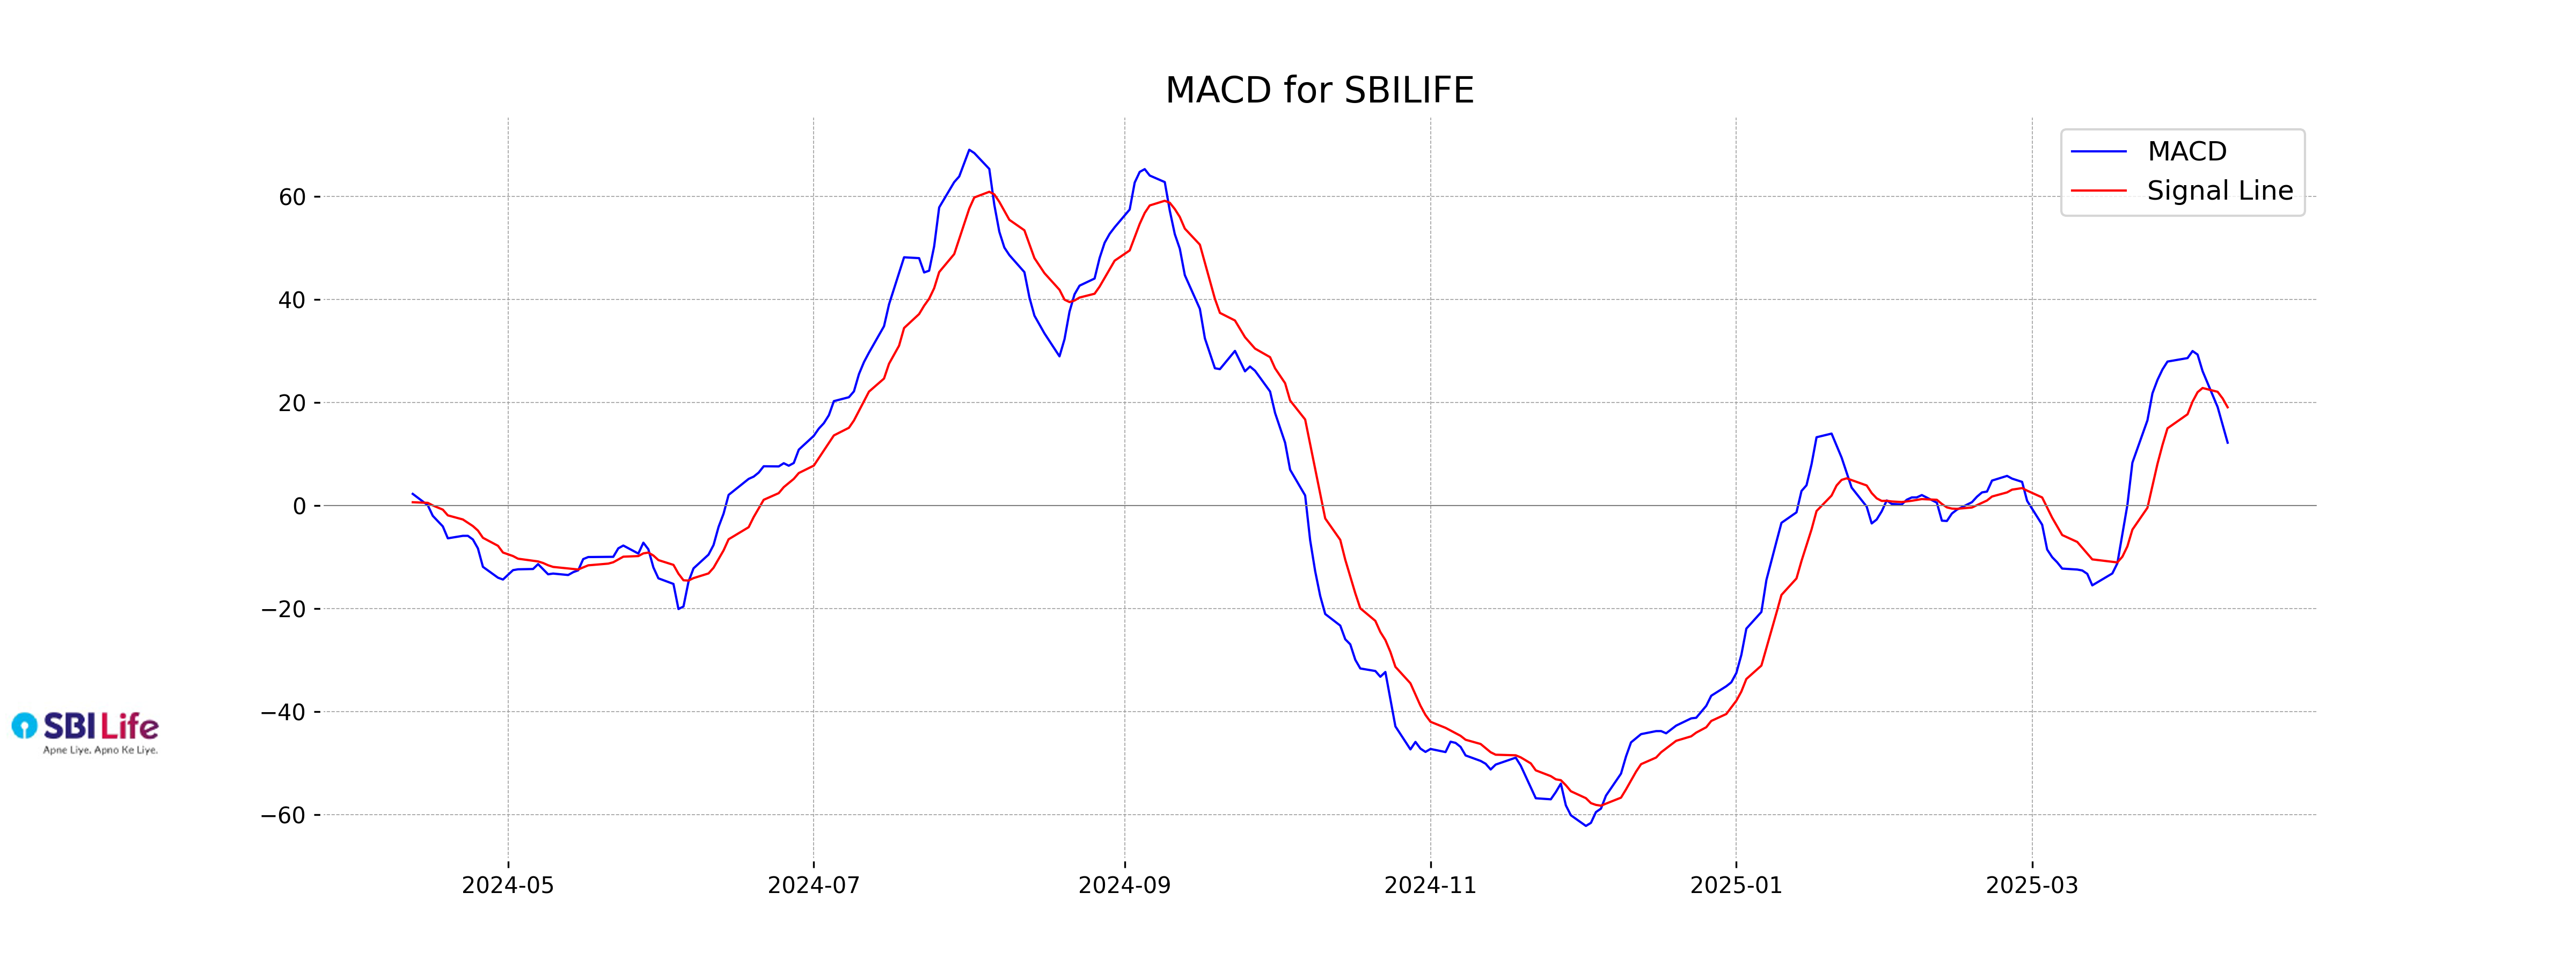
Moving Averages Trend (MACD)
The MACD analysis for SBI Life indicates a bearish sentiment as the MACD line (12.19) is below the MACD Signal line (19.06). This divergence suggests a potential downward momentum in the stock's price unless there's a reversal in the trend.
RSI Analysis
The RSI (Relative Strength Index) for SBI Life is 47.76, indicating a neutral momentum, as it's near the midpoint of 50. This suggests that the stock is neither in an overbought nor oversold condition, hence traders might want to wait for further trend confirmation before taking new positions.
Analysis for Tech Mahindra - April 10, 2025
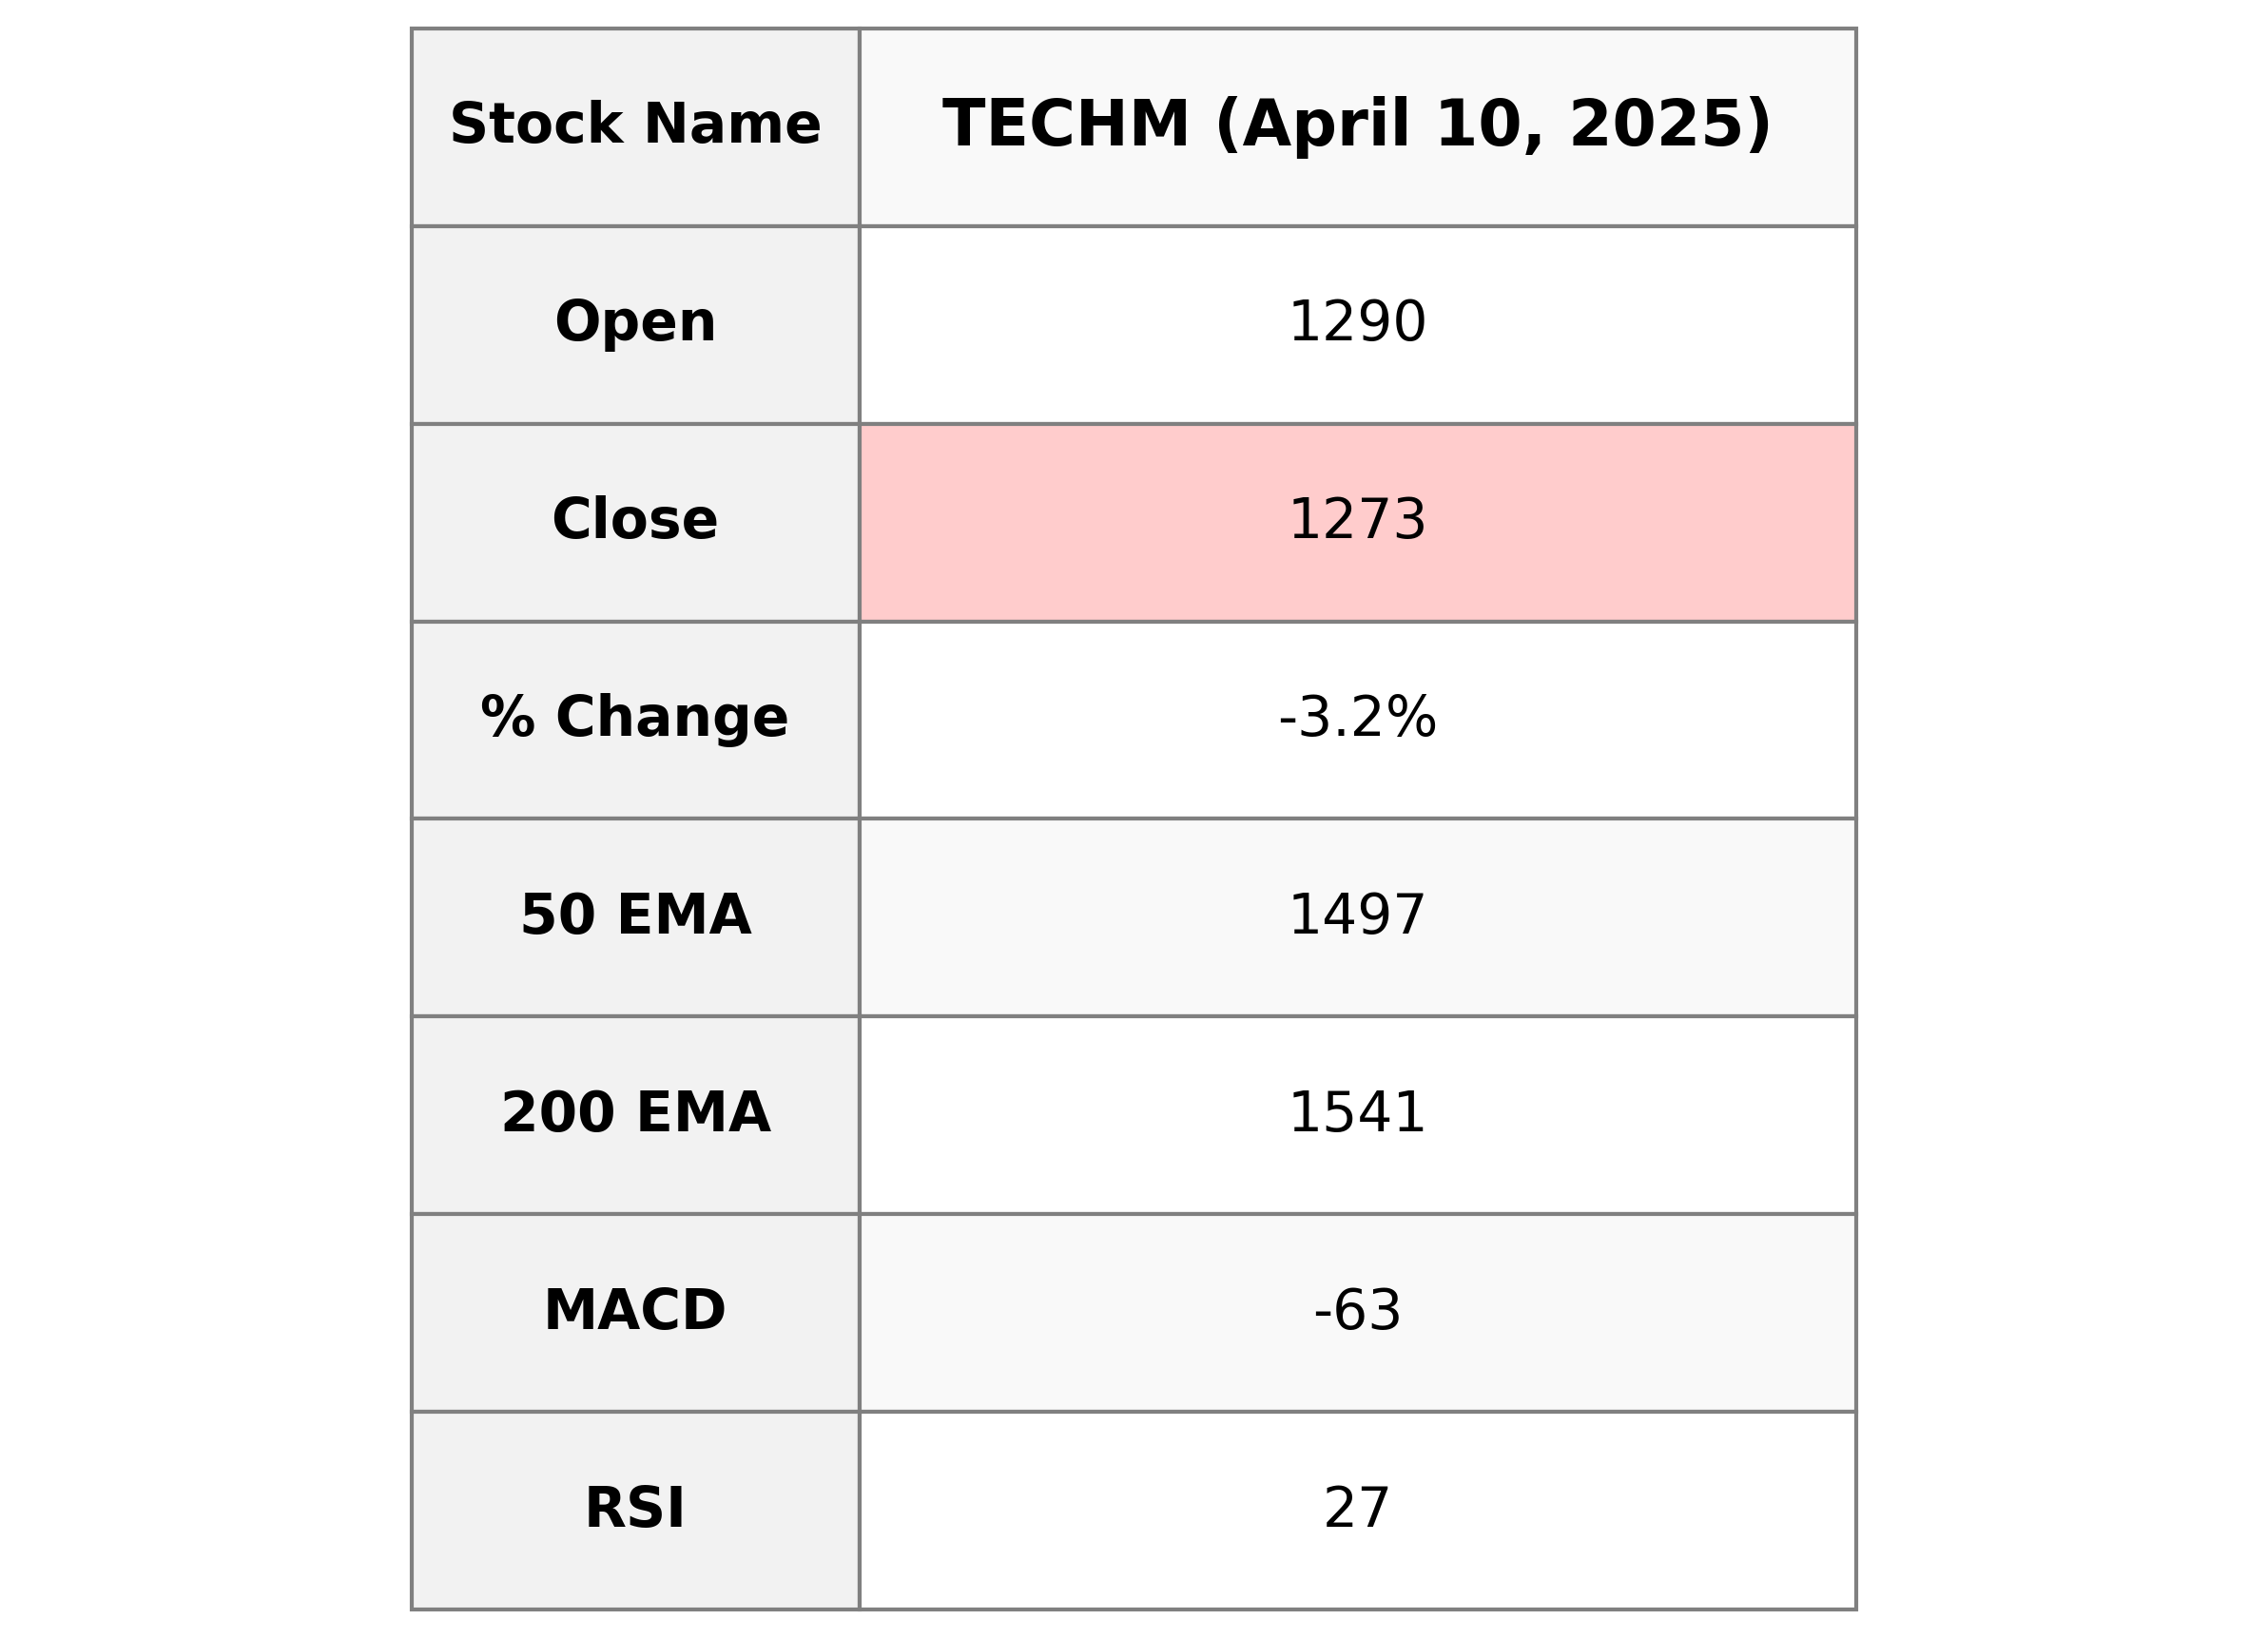
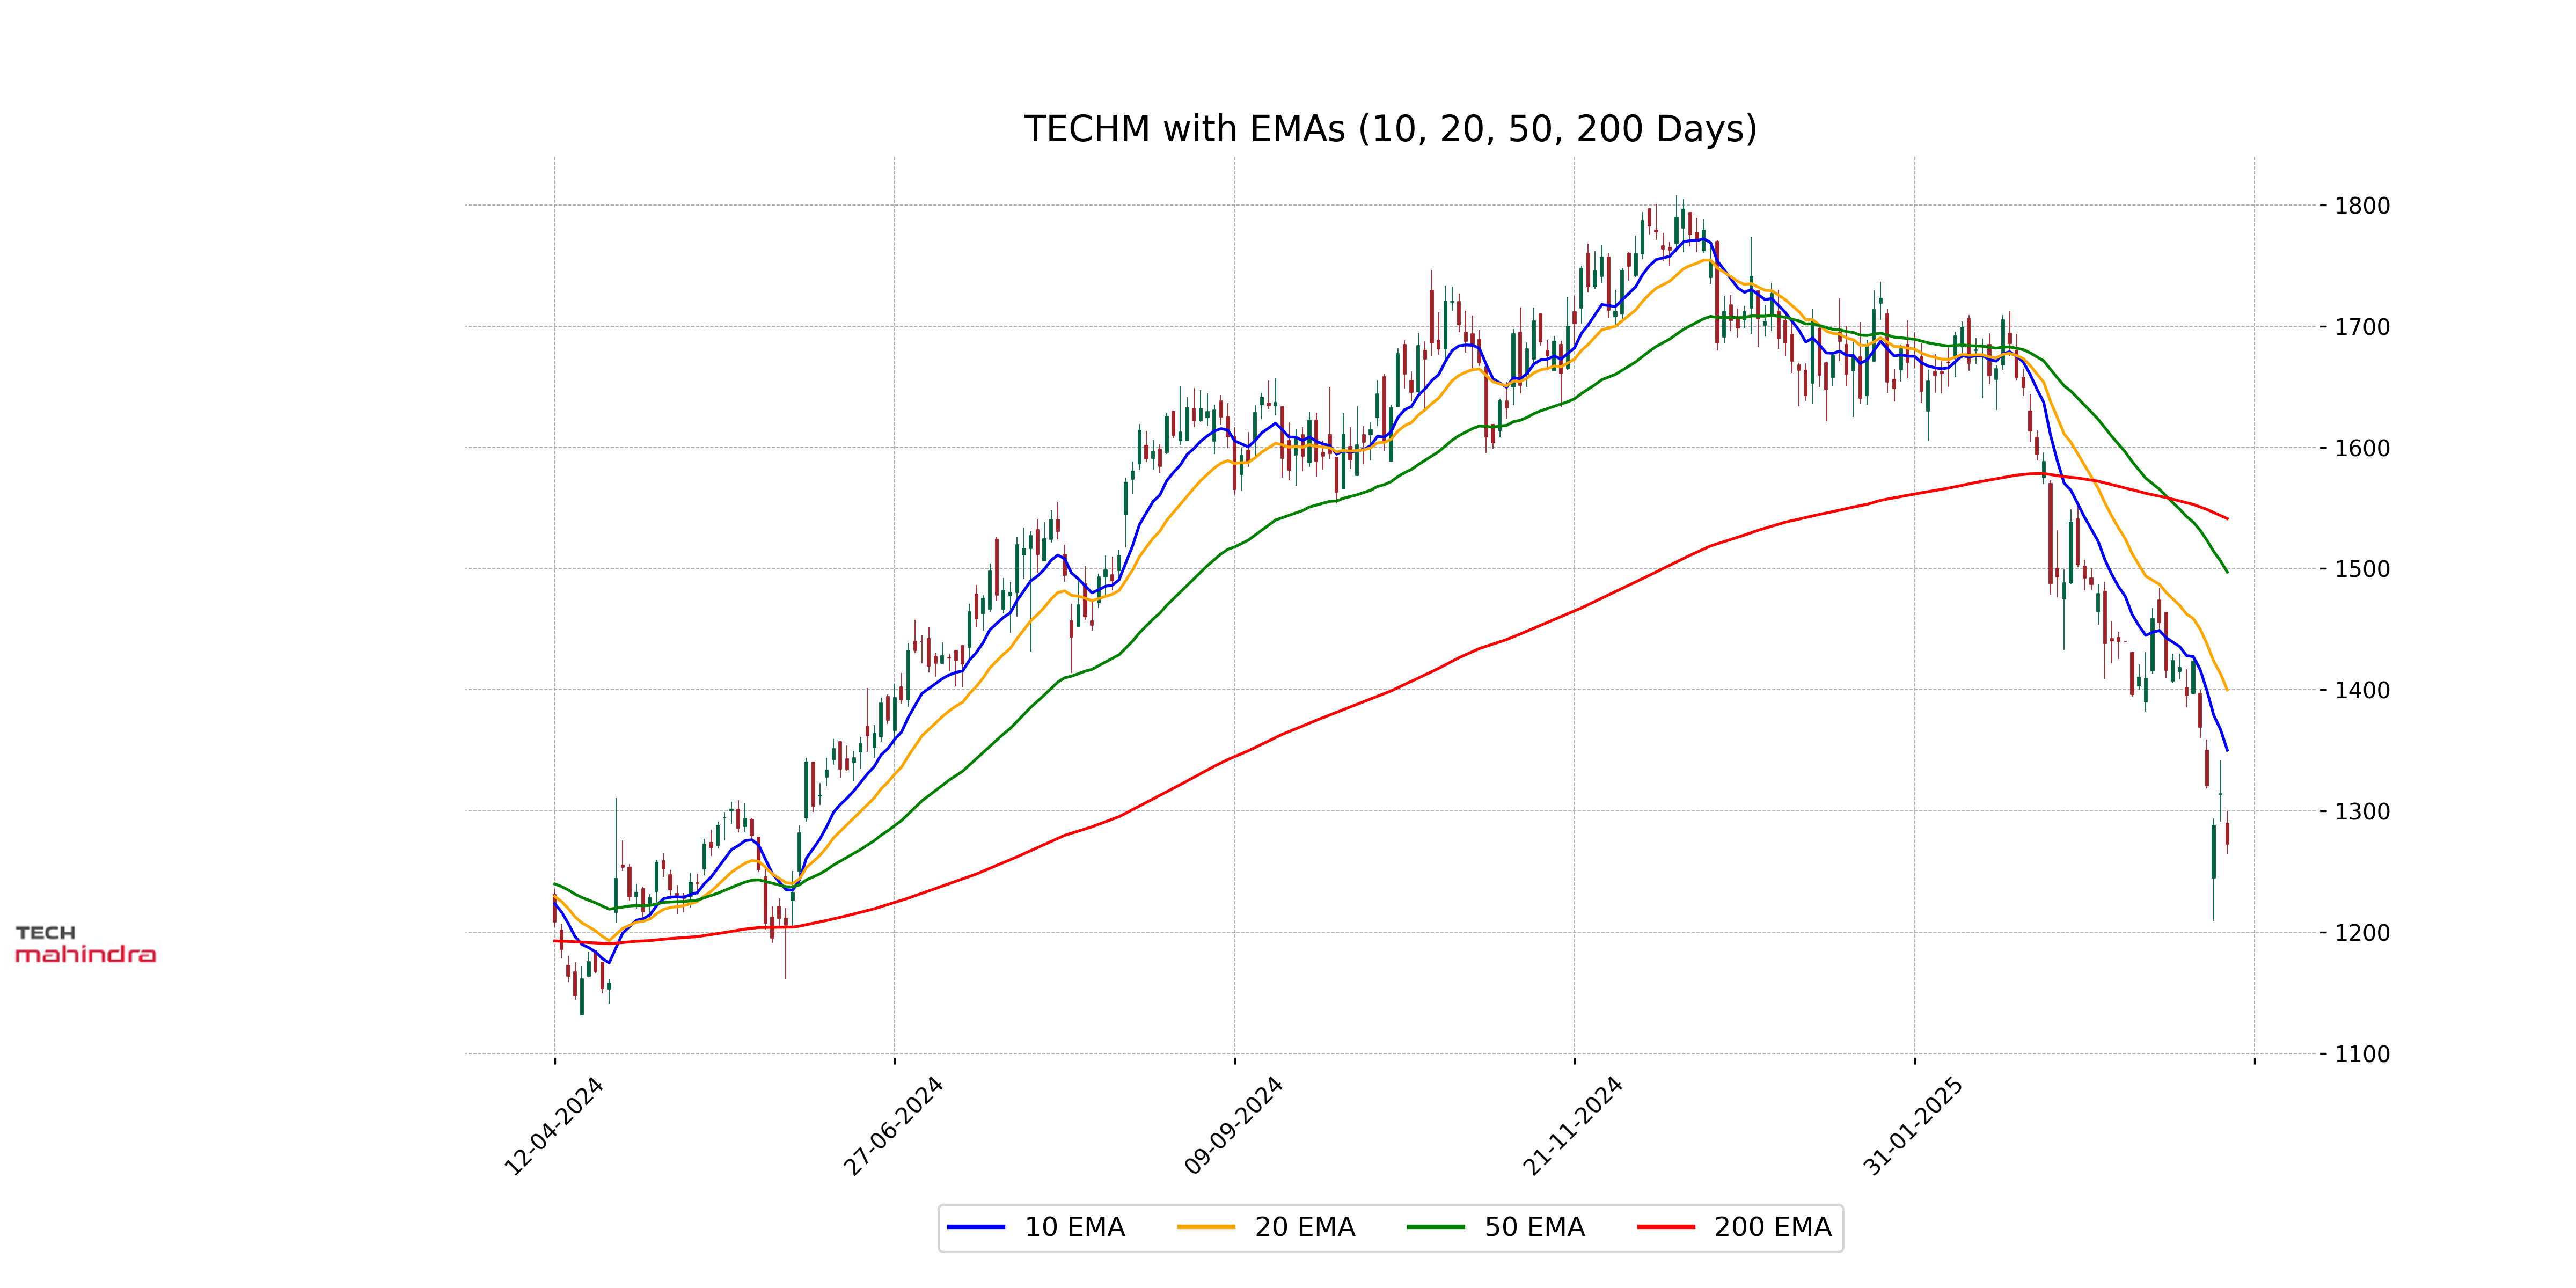
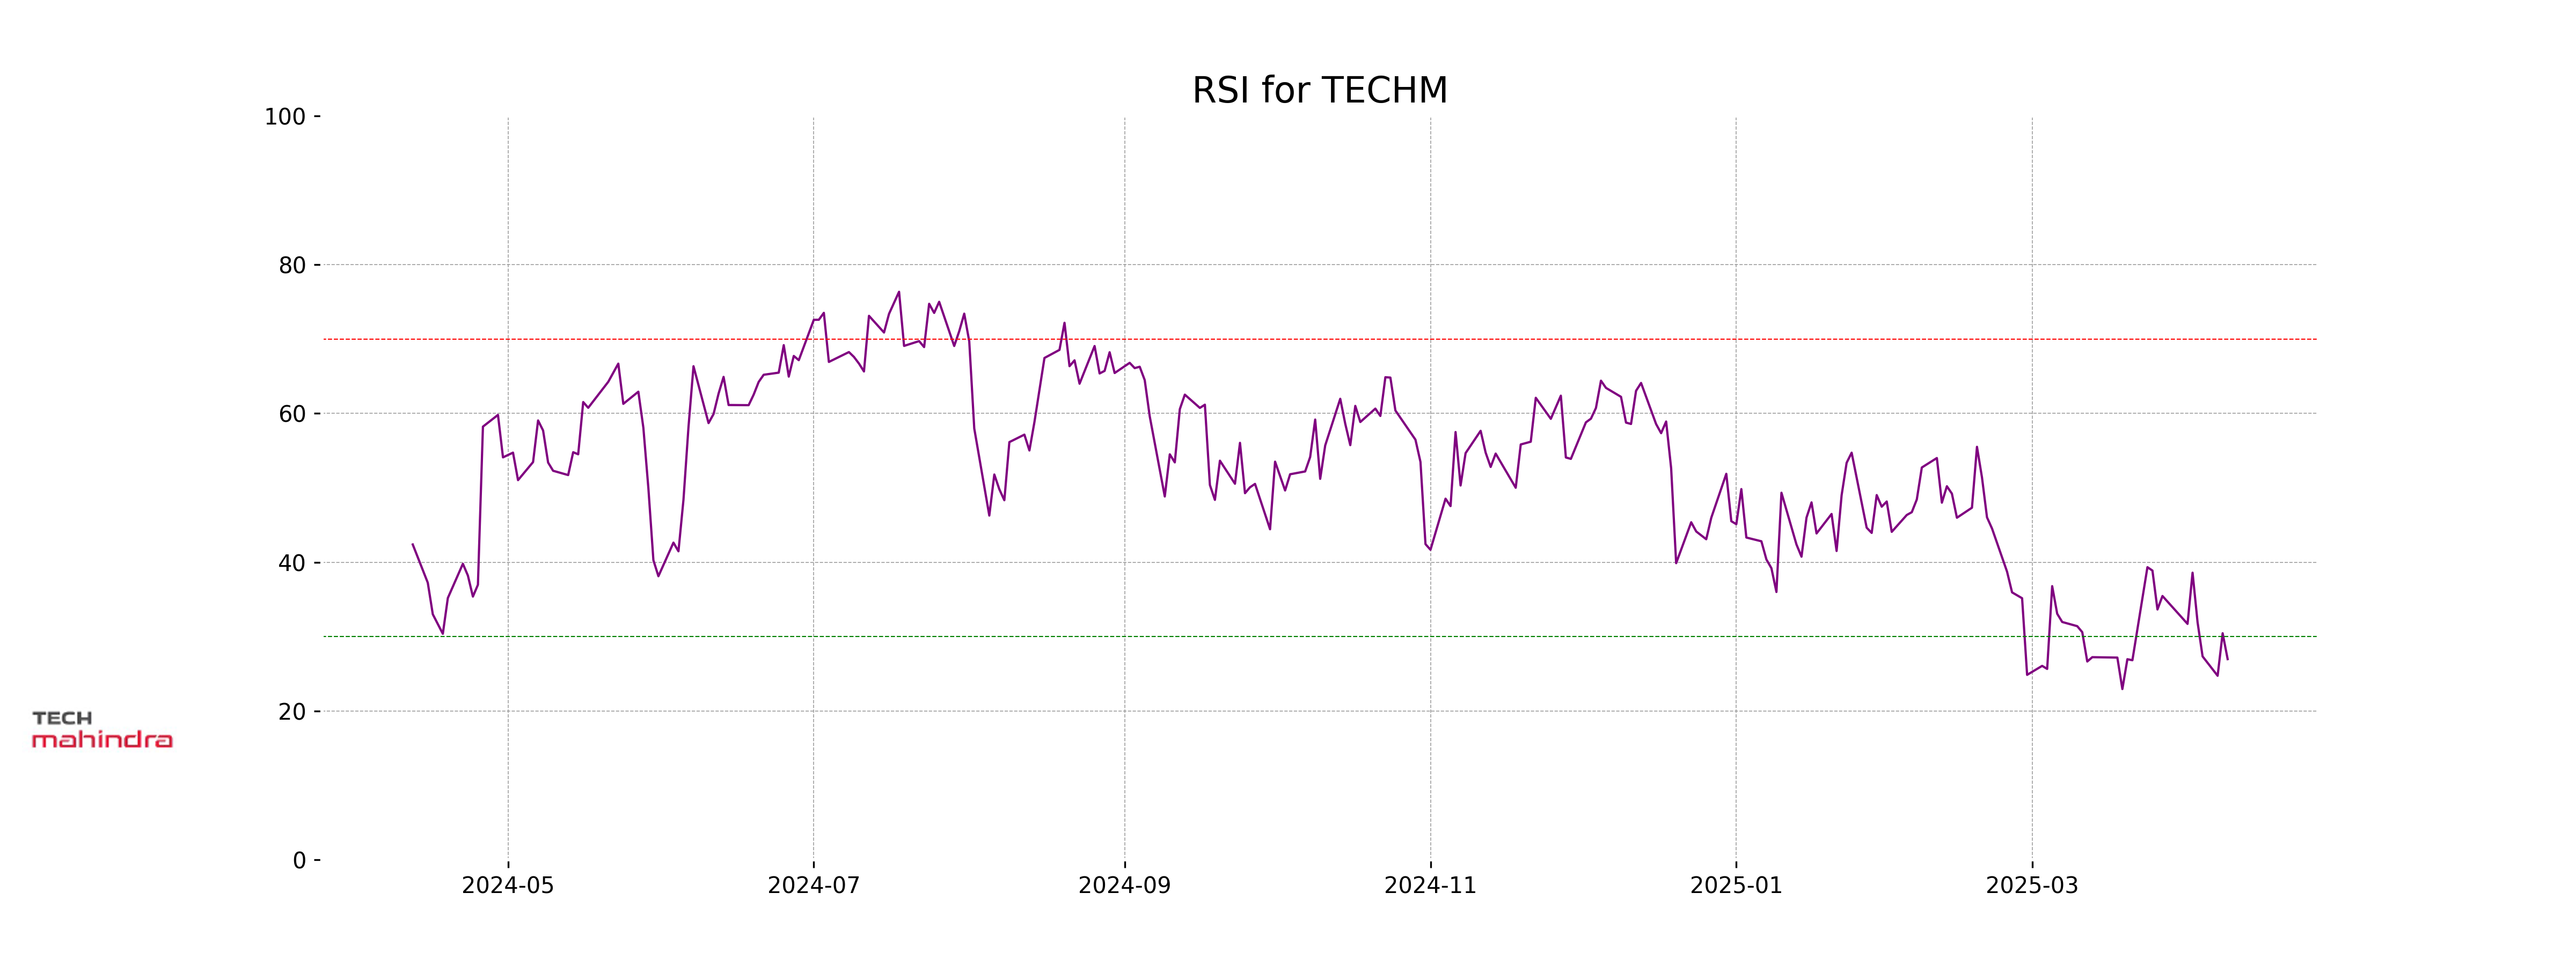
Tech Mahindra Tech Mahindra's stock closed at 1,272.75, a decrease of 3.17% from the previous close of 1,314.40. It has been experiencing bearish momentum, indicated by a low RSI of 26.97 and a negative MACD, which suggests the stock is in oversold territory. In the broader context, the stock is performing below its 50-day and 200-day EMAs.
Relationship with Key Moving Averages
The current close price of 1272.75 is below the key moving averages for Tech Mahindra, indicating potential bearish sentiment. Specifically, the close is below the 10 EMA (1350.15), 20 EMA (1399.85), 50 EMA (1497.15), and 200 EMA (1541.18), suggesting a downward trend relative to these averages.
Moving Averages Trend (MACD)
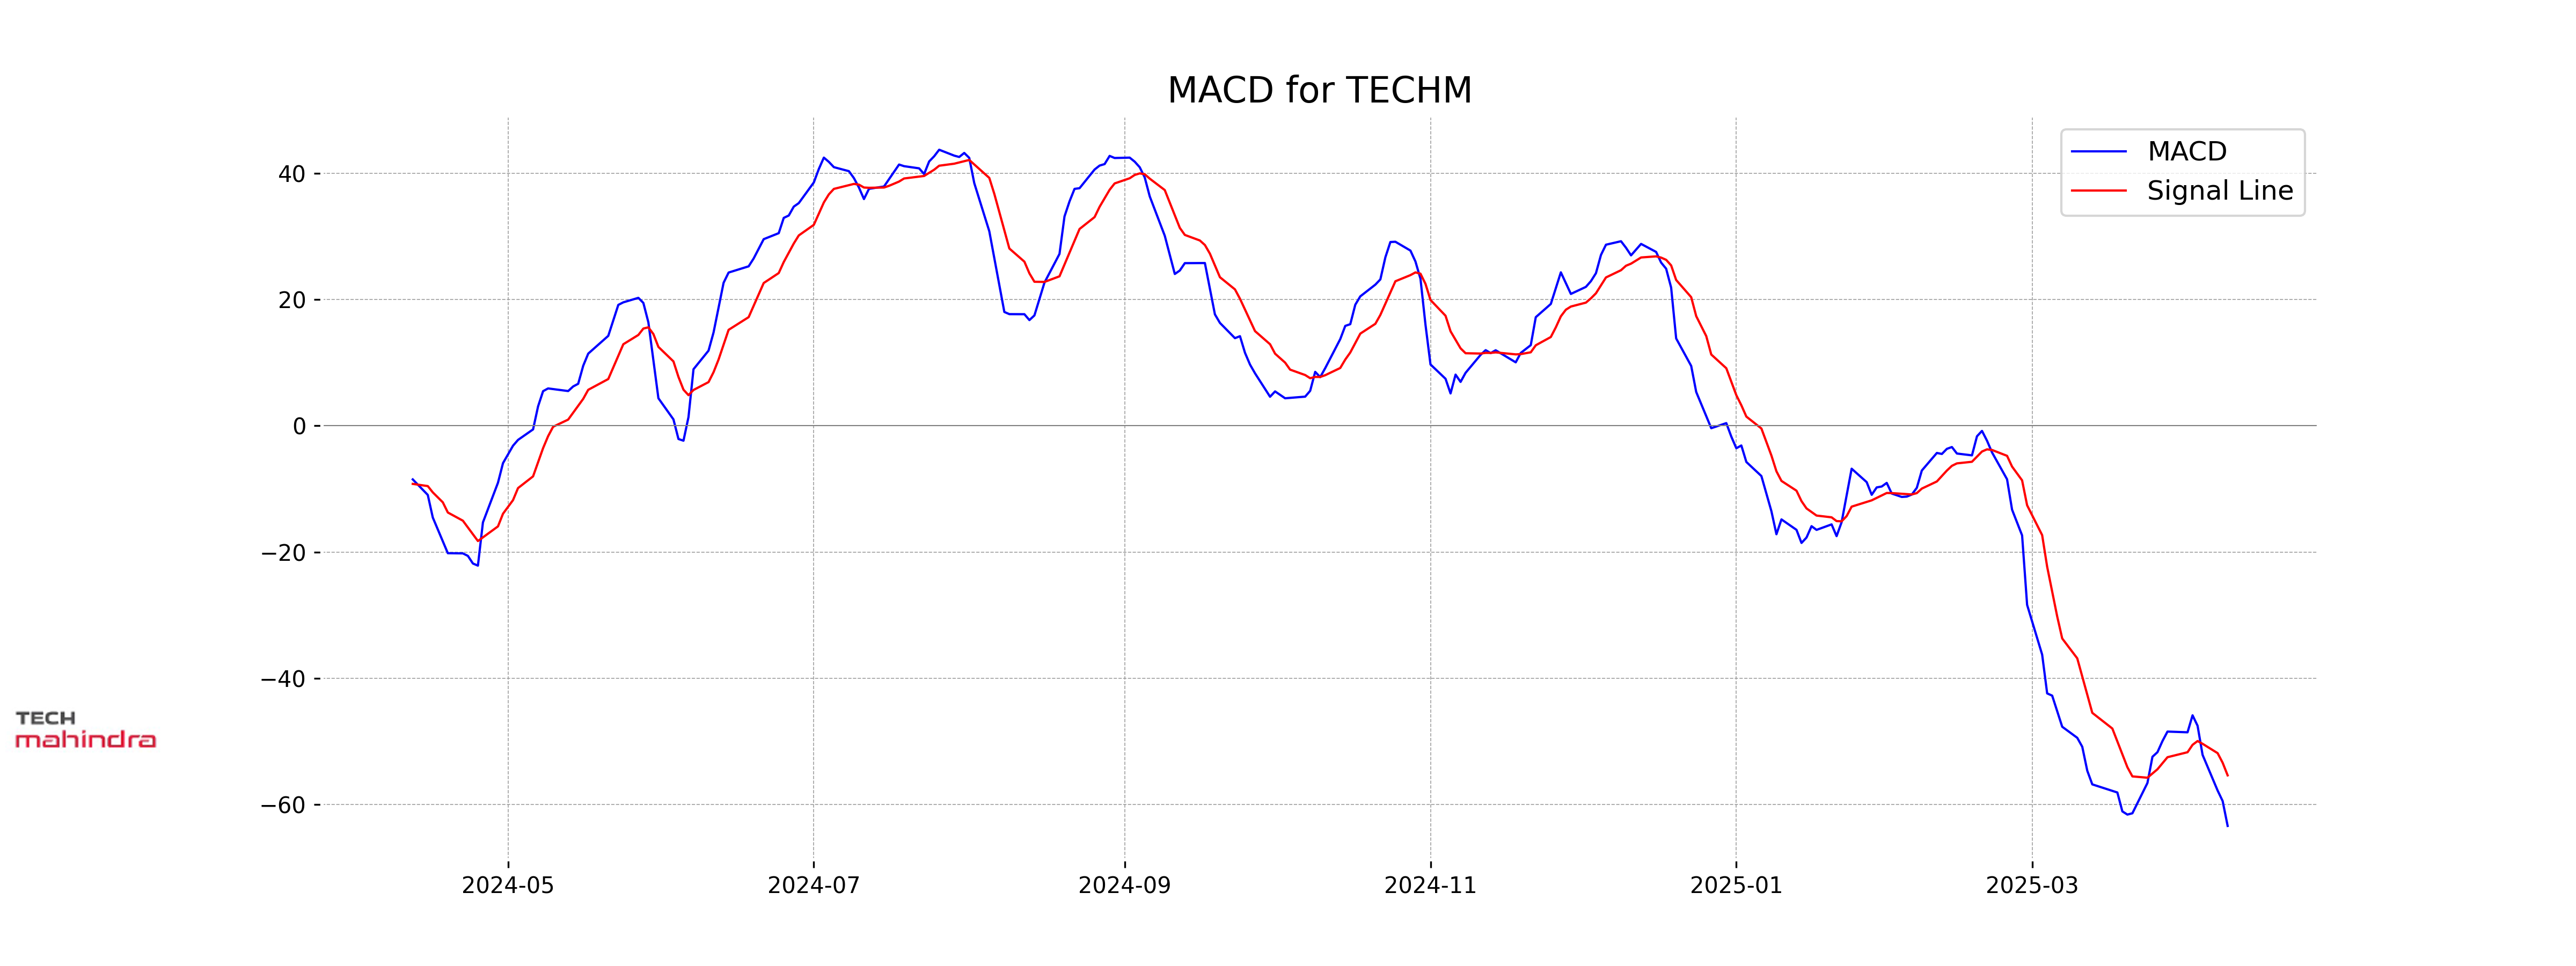
Tech Mahindra's current MACD value of -63.41, with a signal line at -55.40, indicates a bearish trend. The negative divergence between the MACD and the signal line suggests continued downward momentum in the stock price. Given the RSI is also low at 26.97, the stock is potentially oversold, which may precede a reversal.
RSI Analysis
The Relative Strength Index (RSI) for Tech Mahindra is 26.97, indicating that the stock is in the oversold territory. An RSI below 30 suggests that the stock may be undervalued or experiencing downward momentum. Investors often look for such signals for potential buying opportunities.
Analysis for Trent - April 10, 2025

Trent Performance: Trent's stock showed a decline, closing at 4620.20, a 3.08% decrease compared to its previous close of 4767.20. The RSI stands at 34.41, indicating that the stock may be oversold. With a PE ratio of 84.74, it appears to be valued high relative to earnings. The company's market cap is approximately 1.64 trillion INR, reflecting its significant presence in the Apparel Retail industry within the Consumer Cyclical sector in India.
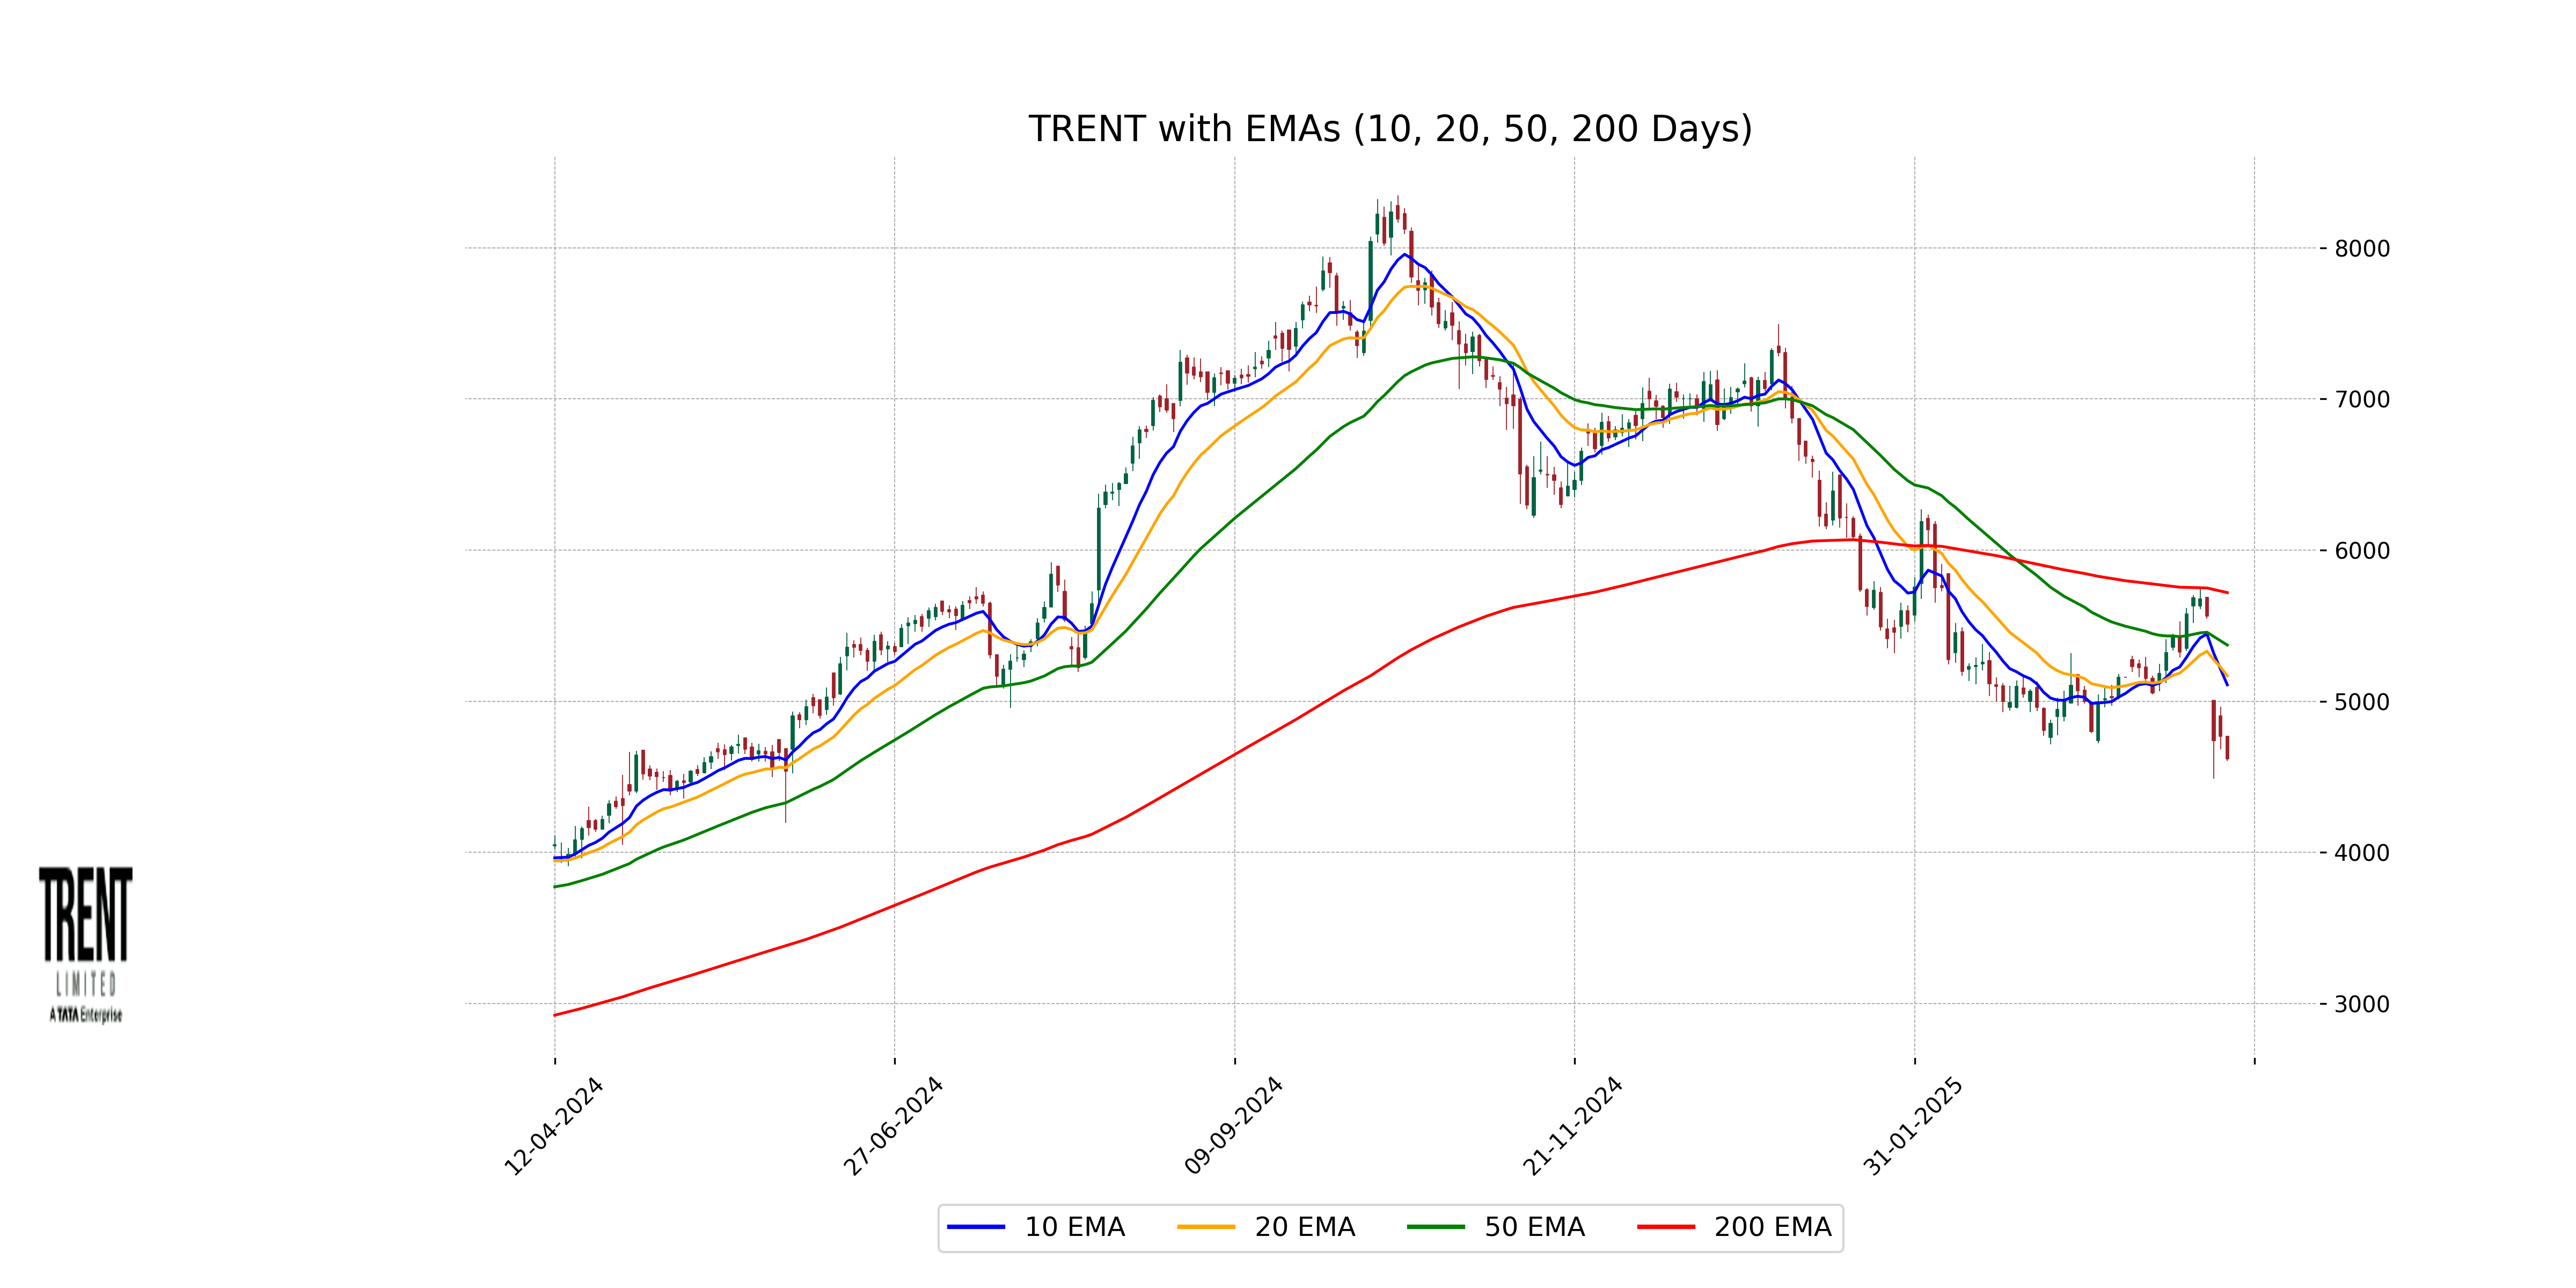
Relationship with Key Moving Averages
Trent's current close at 4620.20 is below its long-term and short-term moving averages, specifically the 50 EMA (5371.82), 200 EMA (5718.42), 10 EMA (5108.45), and 20 EMA (5168.23). This indicates a bearish trend as the stock is currently trading below these key moving averages.
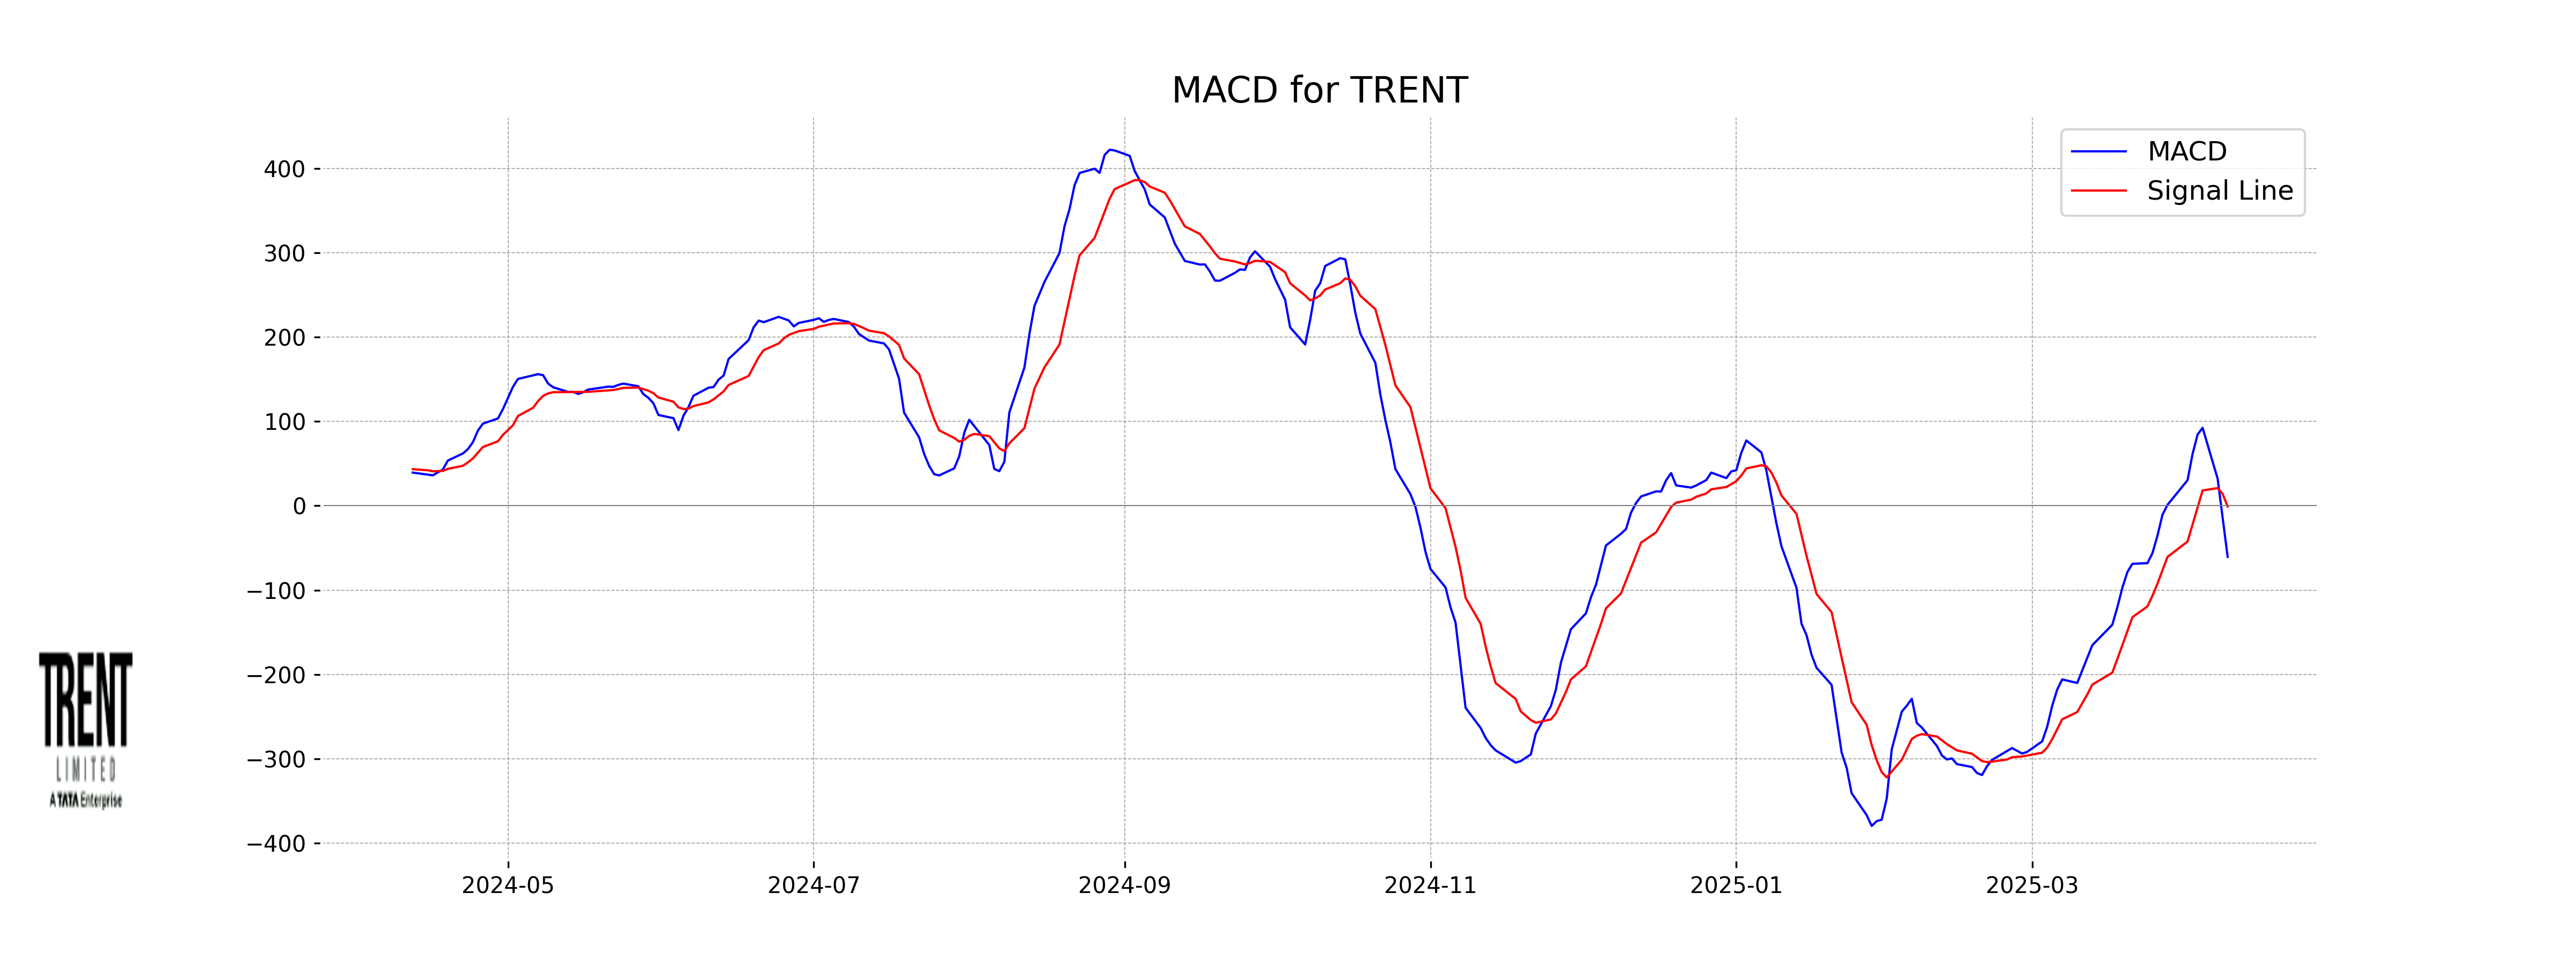
Moving Averages Trend (MACD)
The MACD for Trent is -60.52, indicating that the stock is experiencing bearish momentum as the MACD line is significantly below the signal line of -0.84. This suggests a potential downward trend, supported by other indicators such as a low RSI of 34.41.
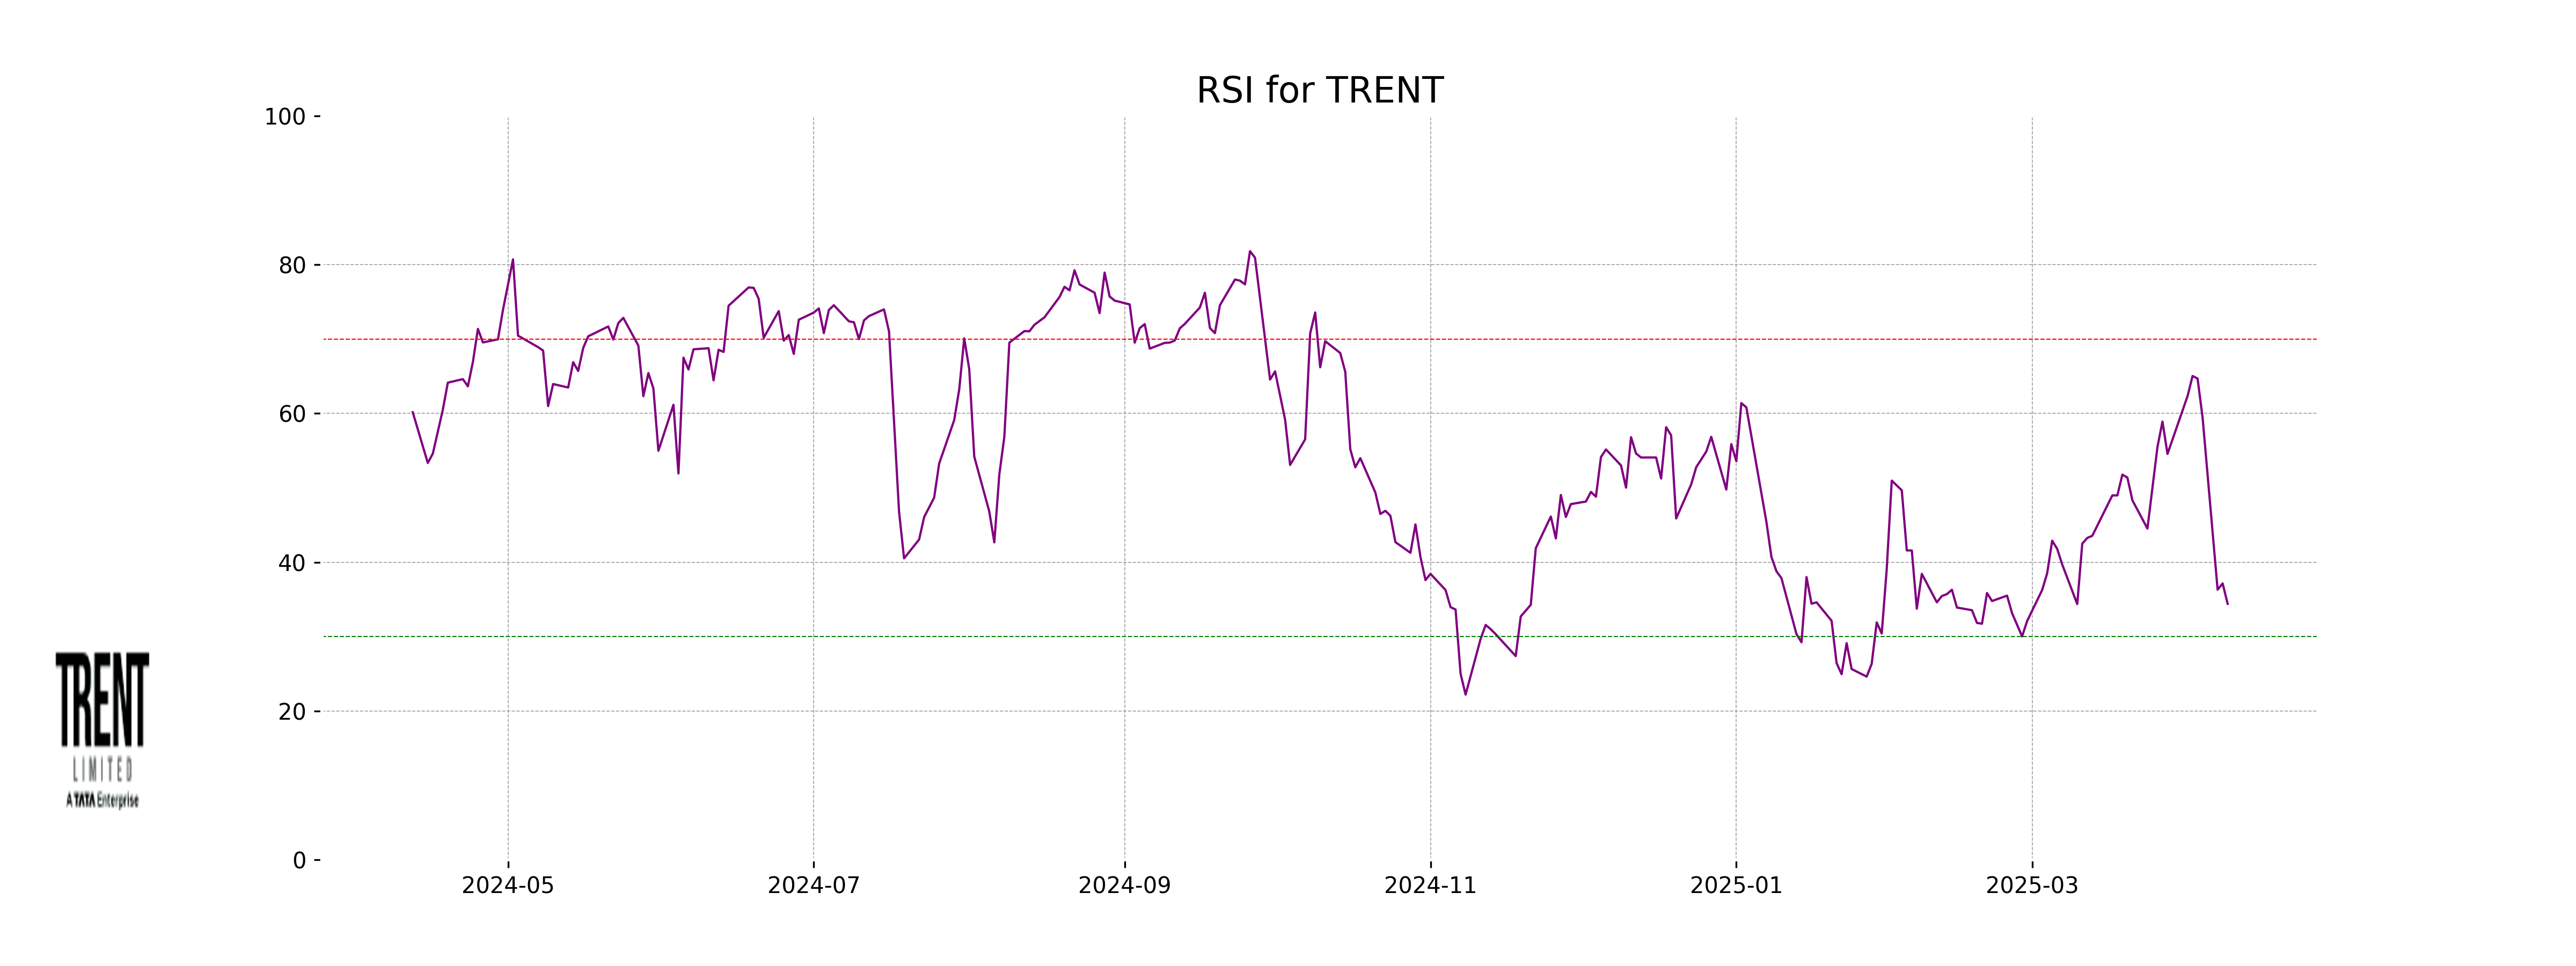
RSI Analysis
The Relative Strength Index (RSI) for Trent is at 34.41, which suggests that the stock is approaching the oversold territory. This level may indicate a potential buying opportunity if the downward momentum weakens and buyers start entering the market. However, it should be considered alongside other indicators for a comprehensive analysis.
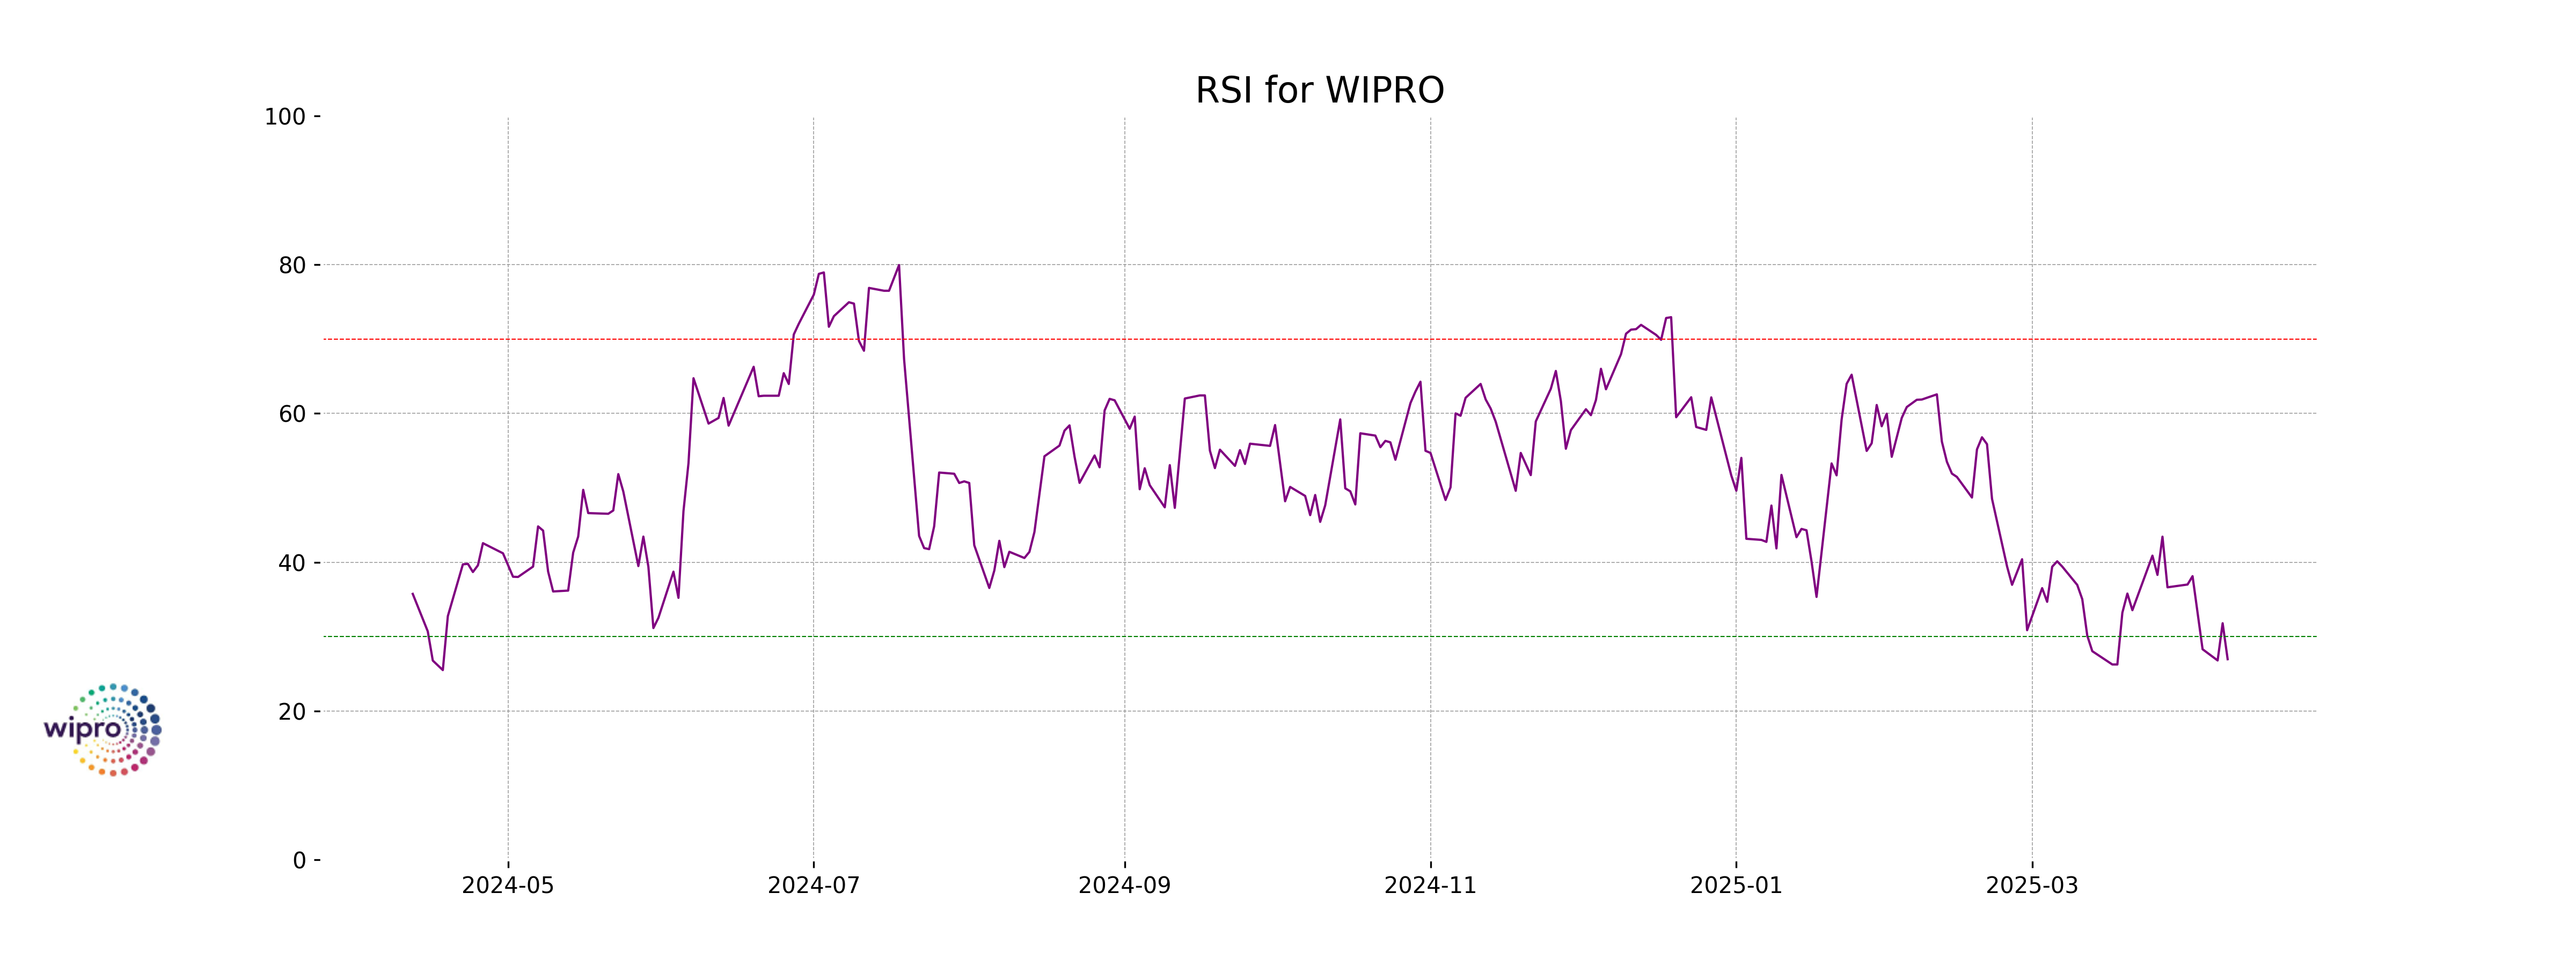
Analysis for Wipro - April 10, 2025

Wipro Performance: Wipro, with a market cap of 2,475,453,579,264 INR, experienced a notable decrease, closing at 236.65 INR, down by 4.29% from the previous close of 247.25 INR. The stock's Relative Strength Index (RSI) stands at 26.96, suggesting it might be oversold. Additionally, both its 50-day and 200-day EMAs are higher than the current close, indicating a potential bearish trend.
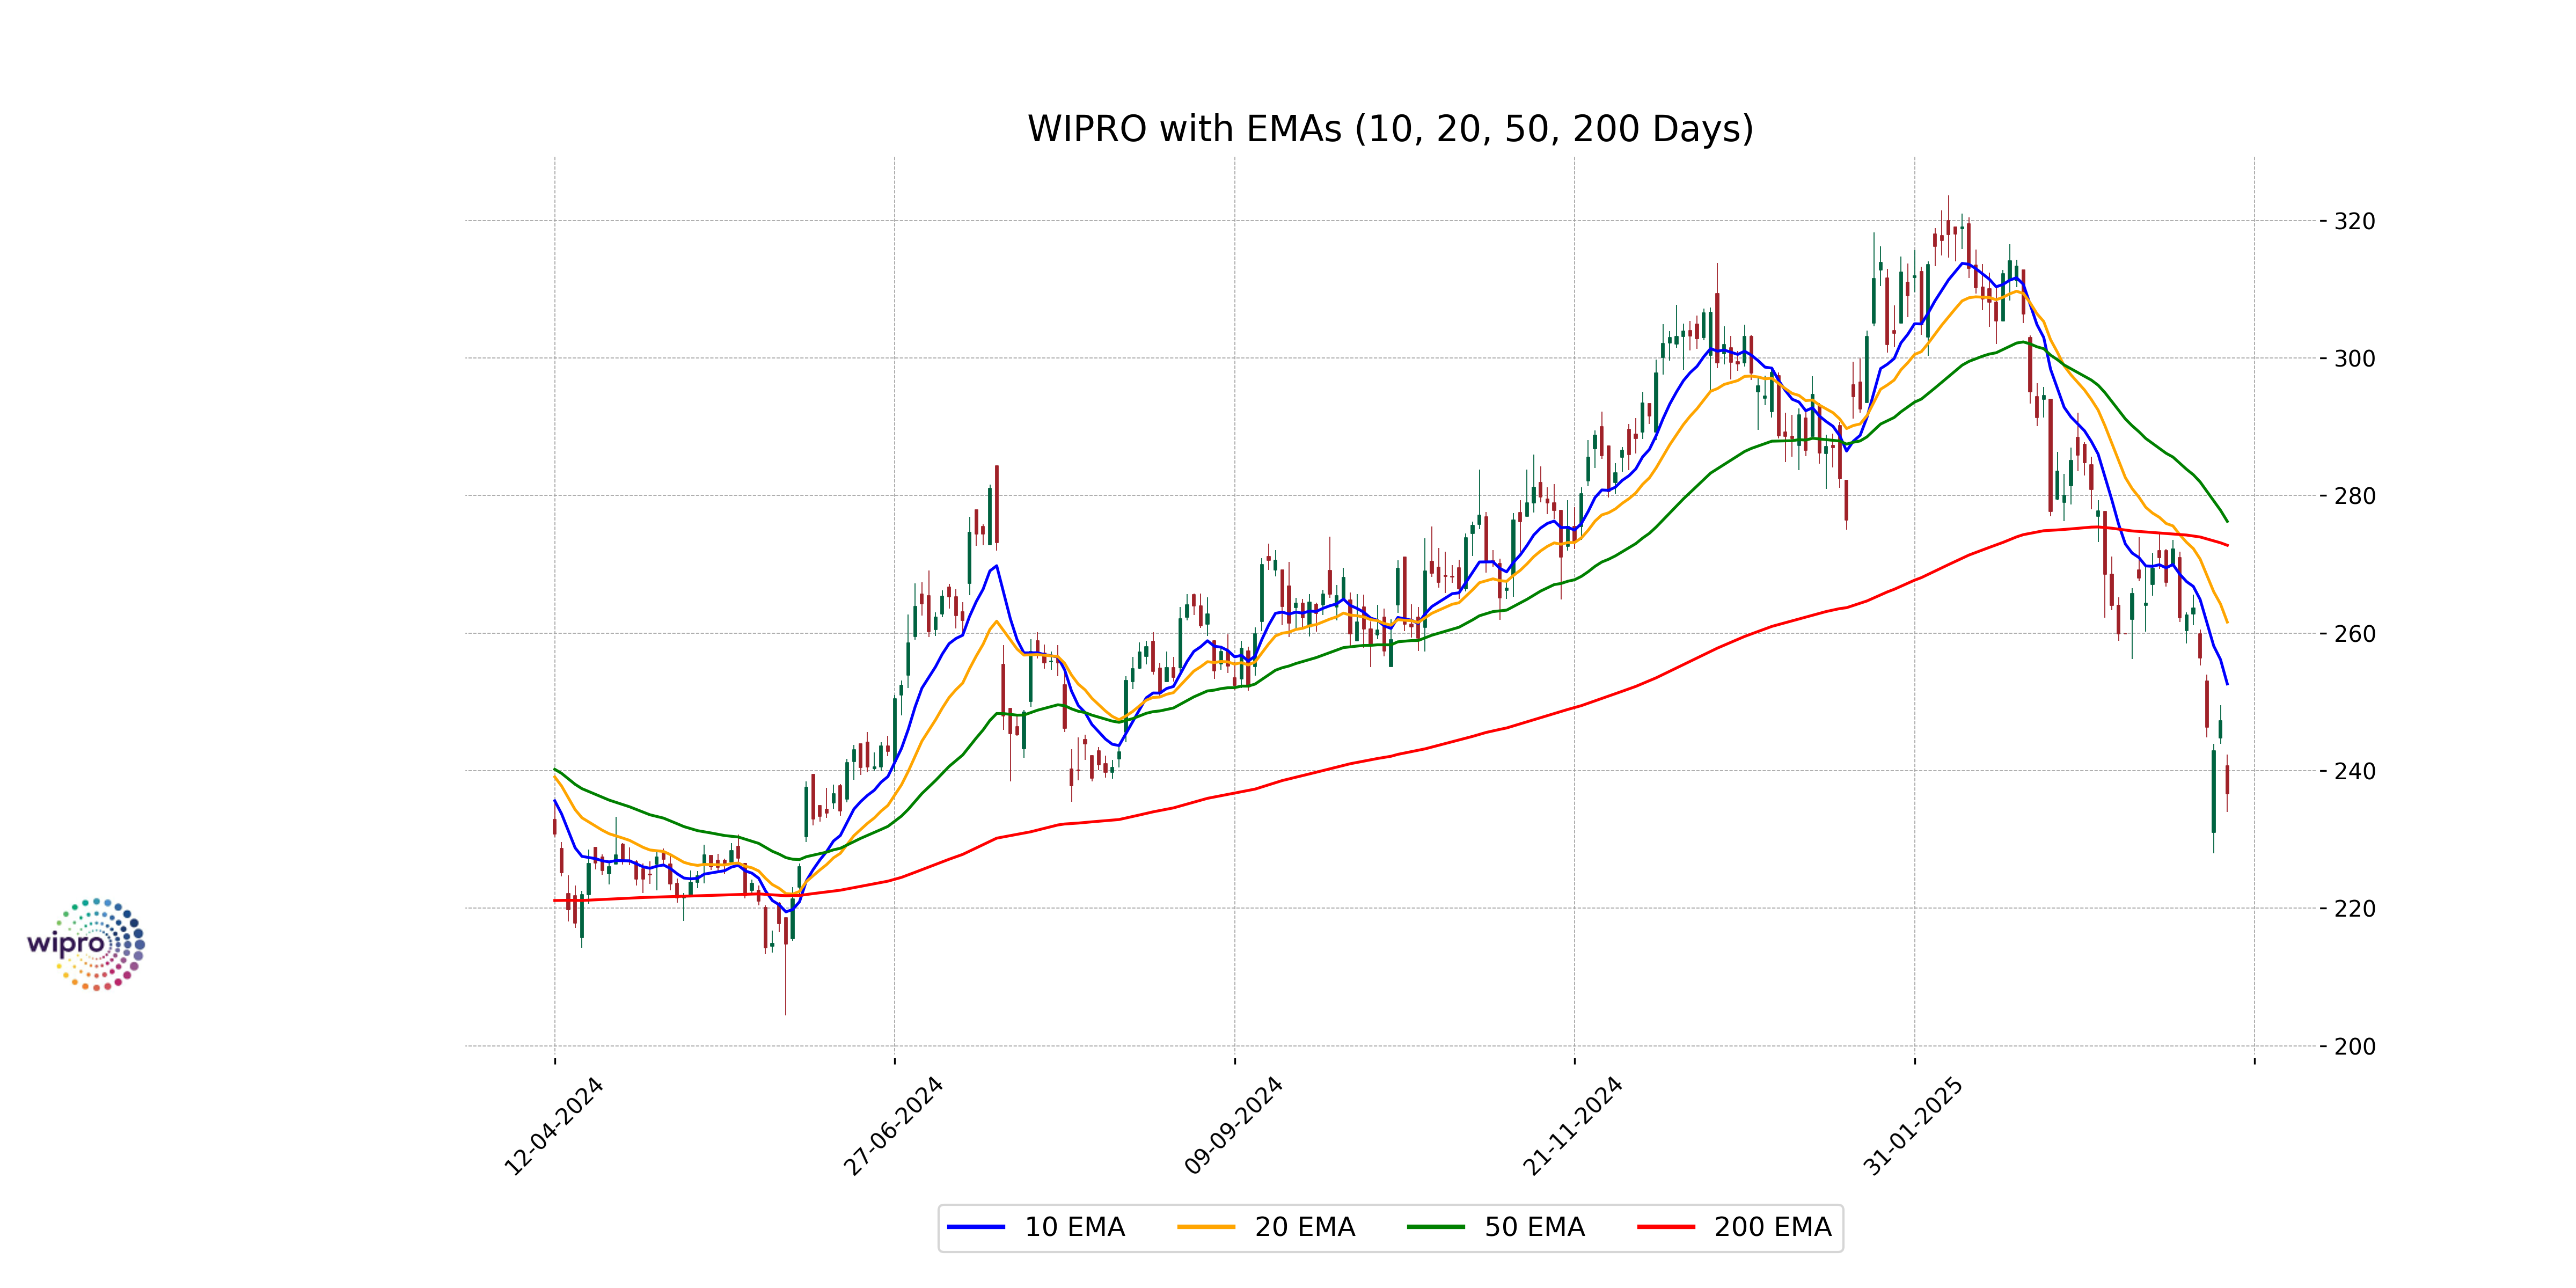
Relationship with Key Moving Averages
Wipro's current close price of 236.65 is below all key moving averages, including the 50-day EMA of 276.23, 200-day EMA of 272.75, 10-day EMA of 252.60, and 20-day EMA of 261.59. This indicates a bearish trend, as the stock is trading below its recent and long-term averages.
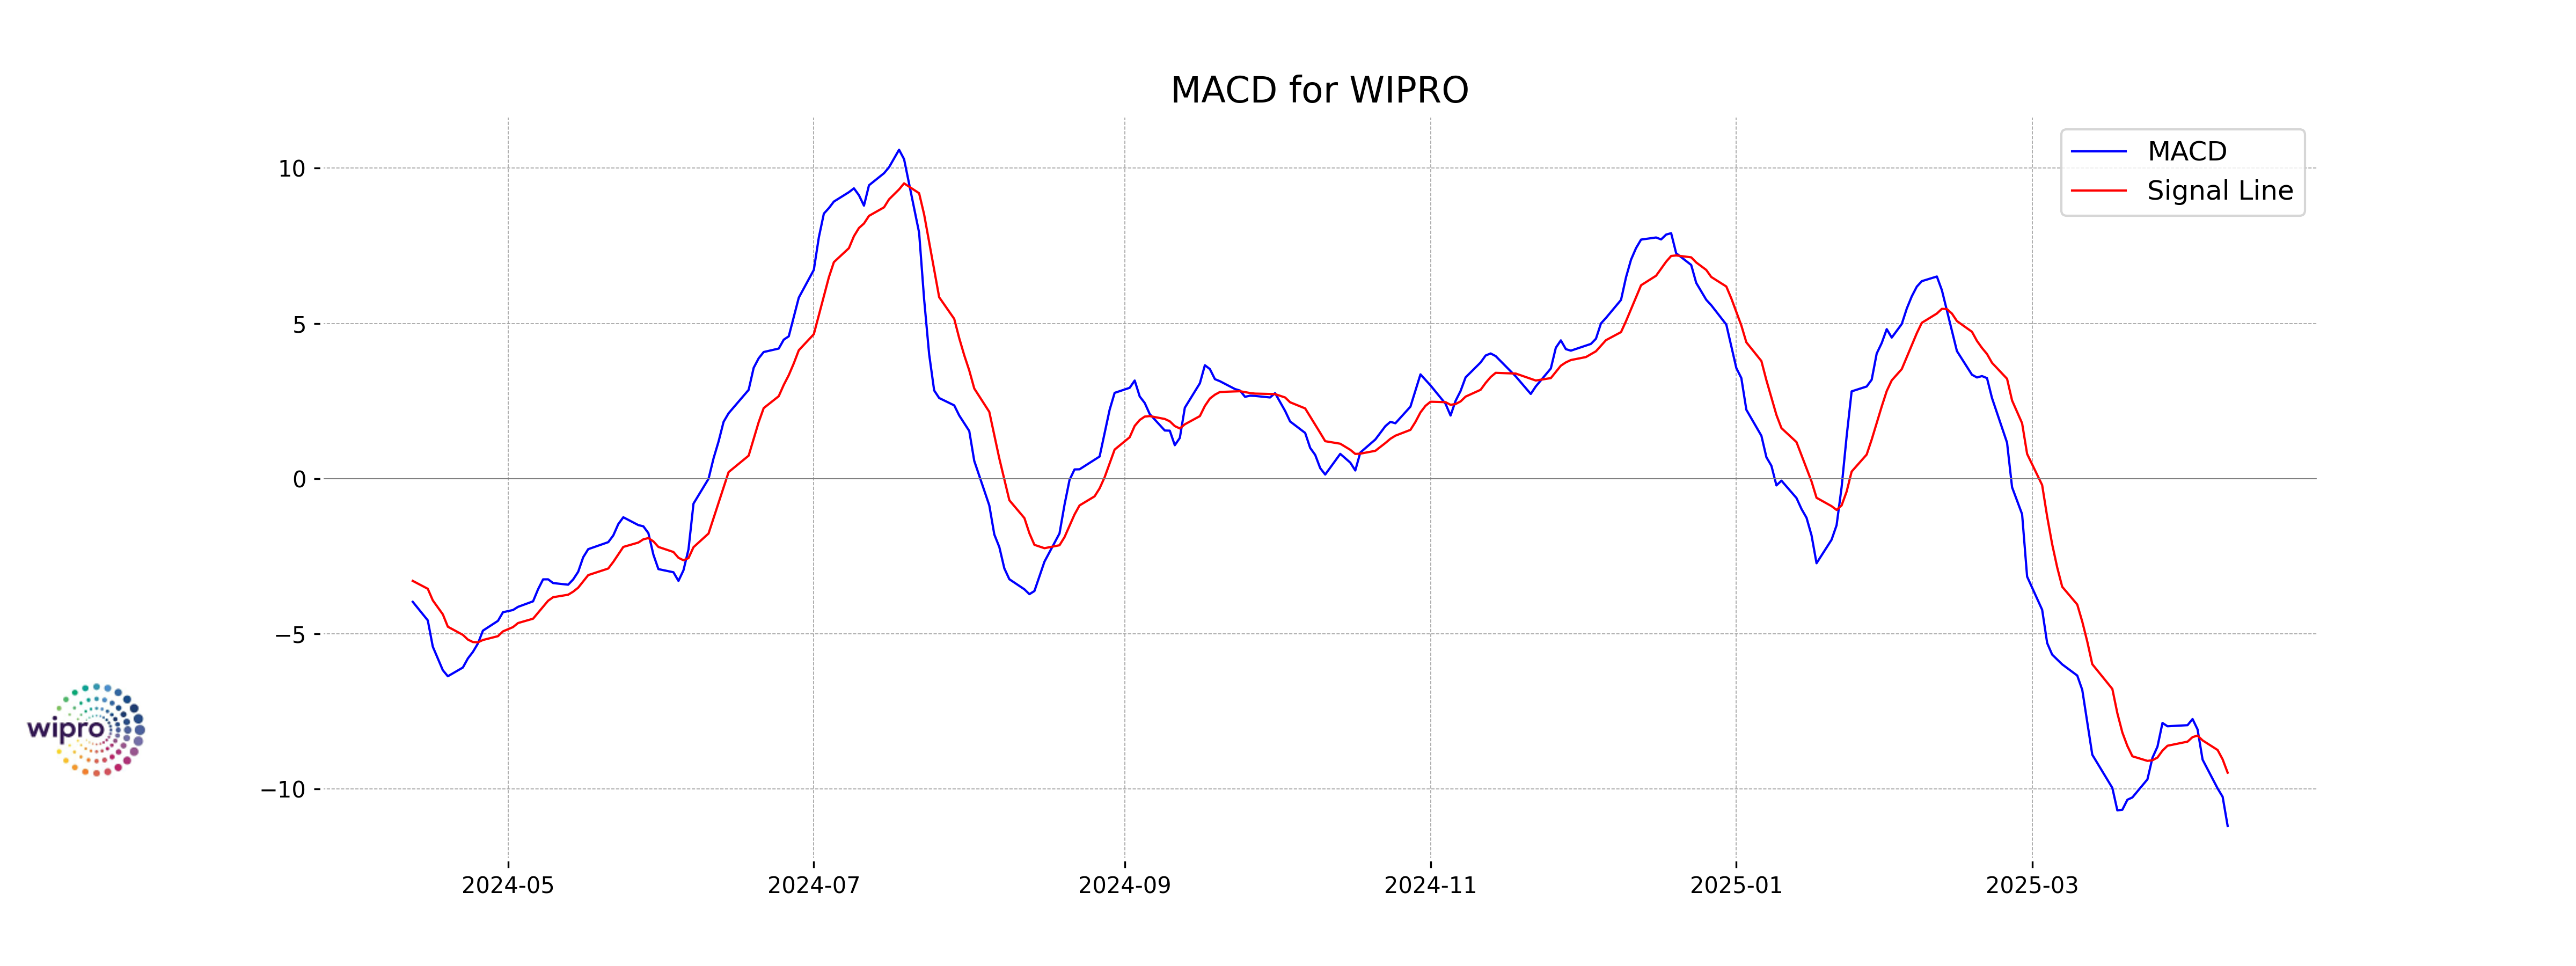
Moving Averages Trend (MACD)
For Wipro, the MACD is at -11.18, which is below the MACD Signal line of -9.47. This indicates a bearish trend, suggesting potential further downside in the stock price.
RSI Analysis
Wipro's RSI is currently at 26.96, which indicates that the stock is in the oversold territory. This suggests that there may be potential for a price reversal or consolidation, as the RSI value is below the commonly referenced threshold of 30.