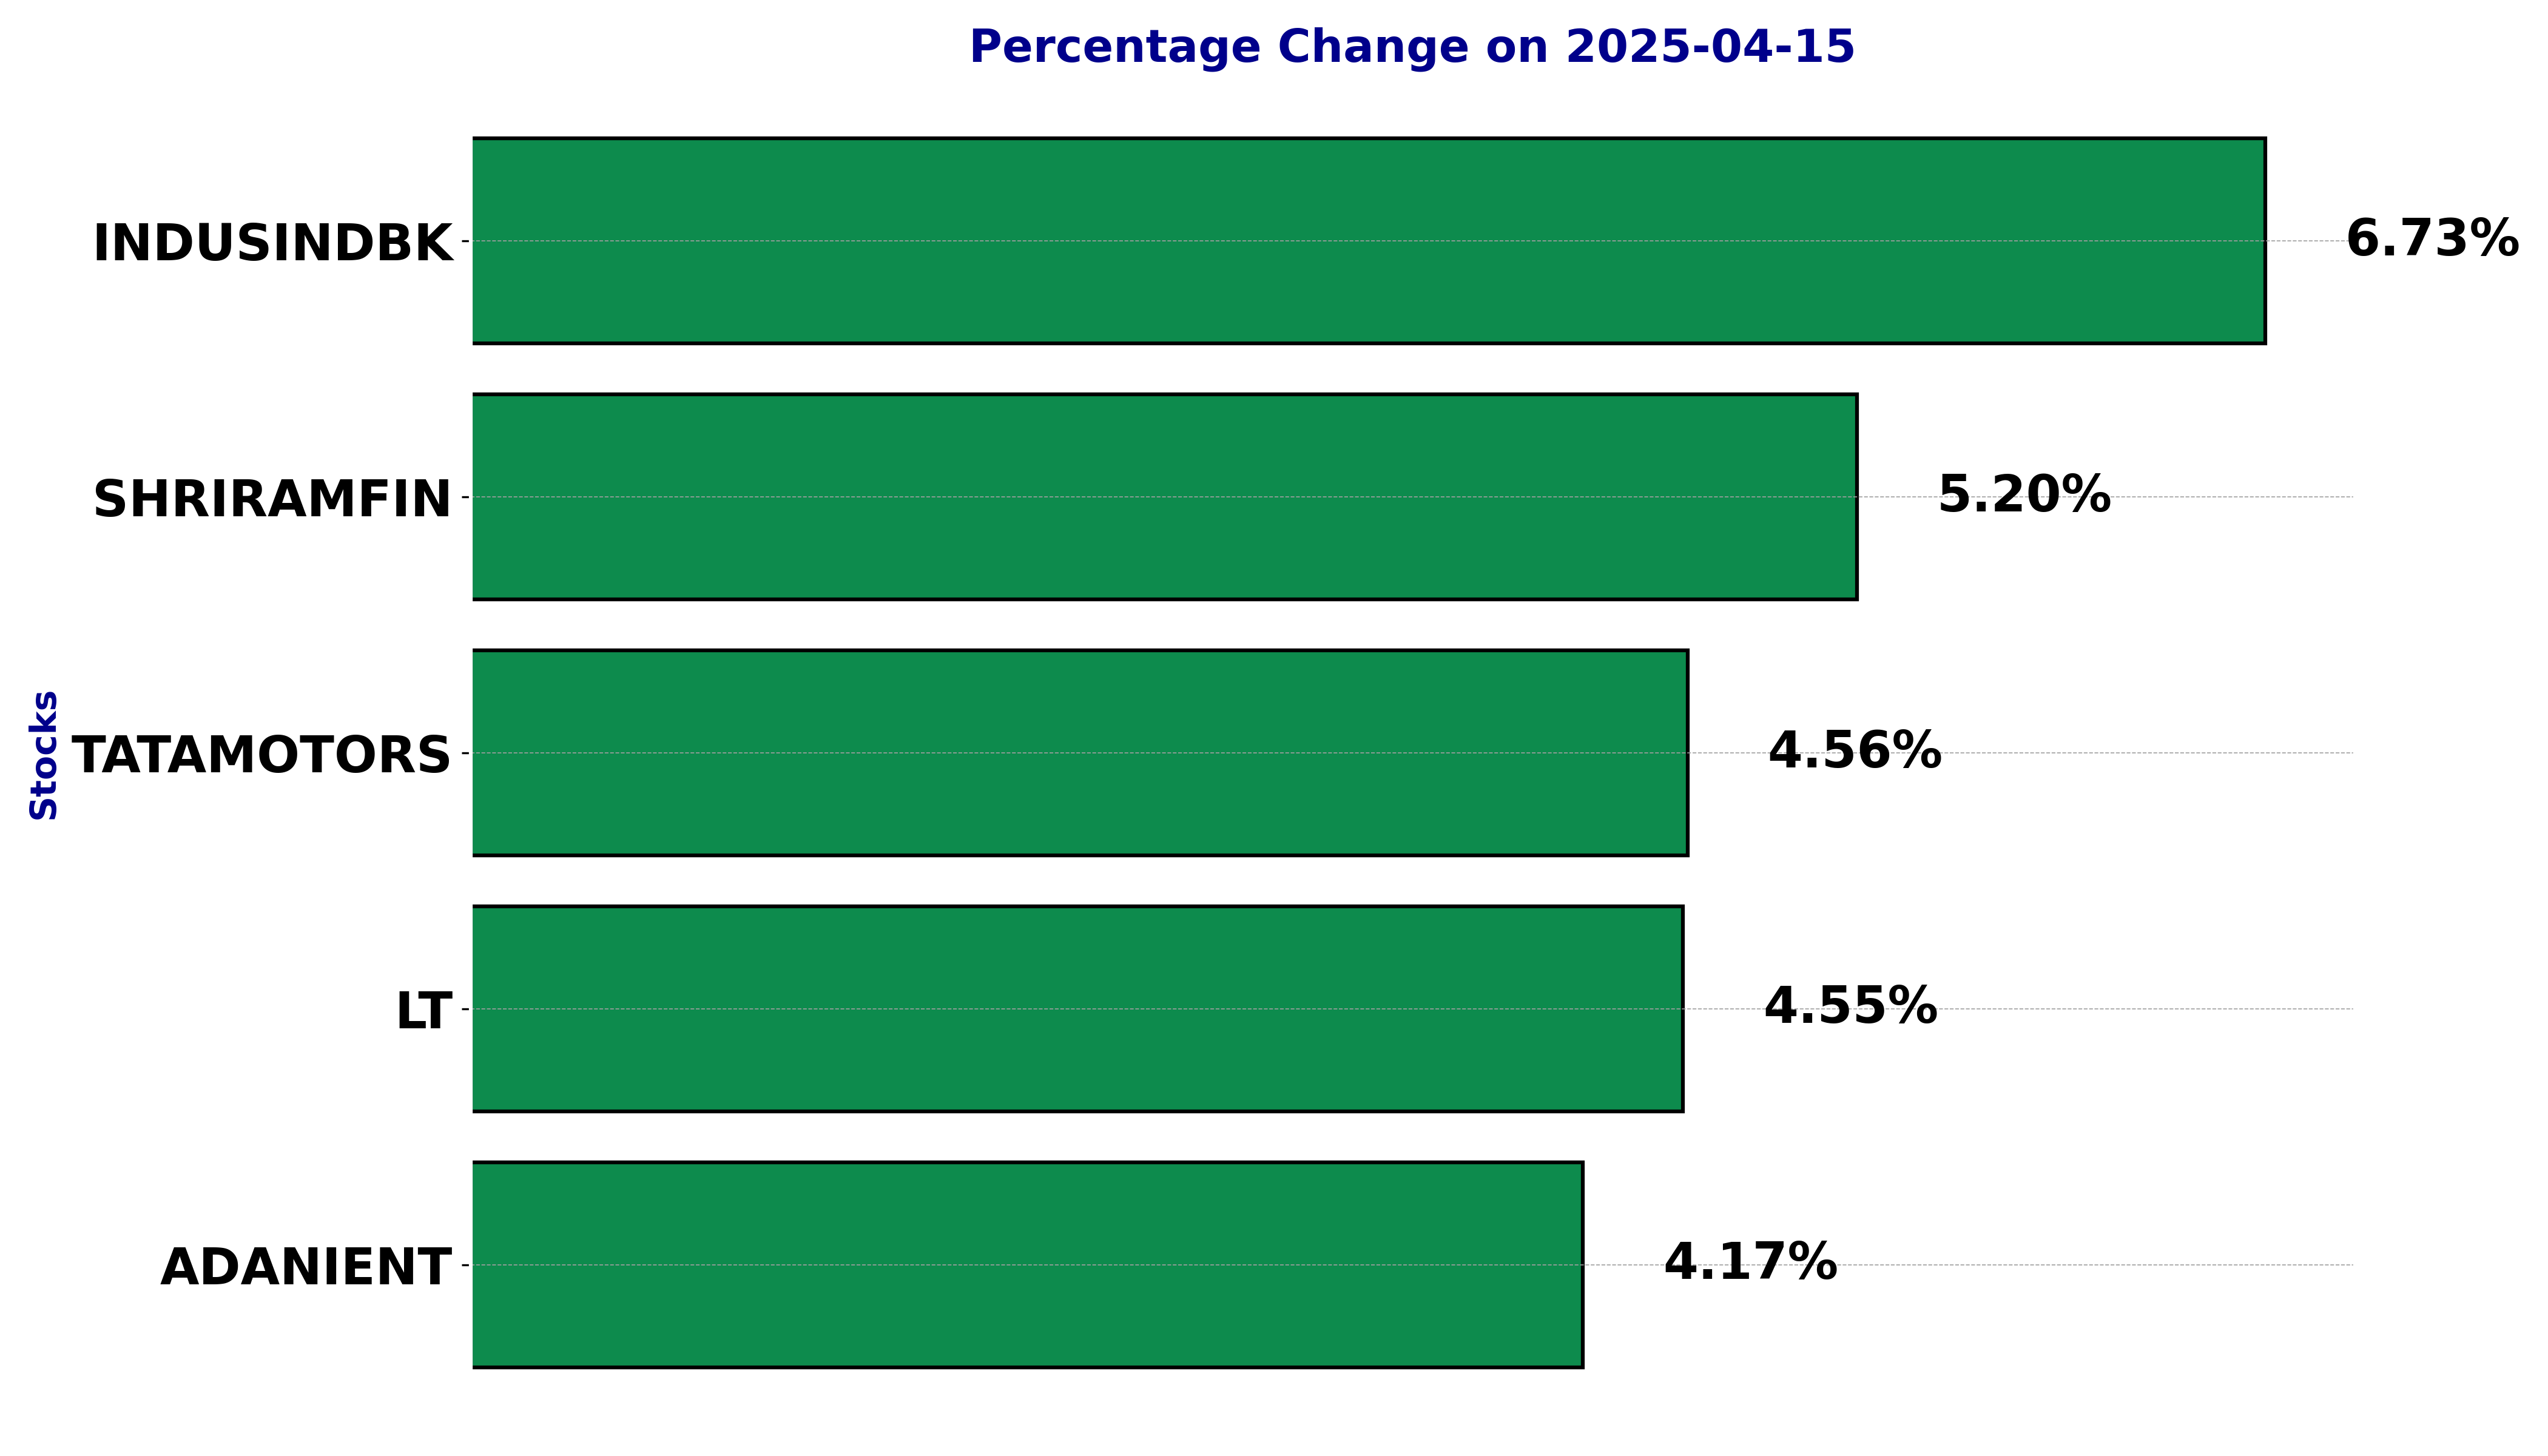
NSE Nifty 50 Top gainers: What are the 5 Biggest Stock gainers Today April 15, 2025
In this article, we will explore the technical indicators of some of the high-performing stocks on the Indian stock market, including ADANIENT, INDUSINDBK, LT, SHRIRAMFIN, and TATAMOTORS.
By looking at these stocks through the lens of key technical factors, we aim to better understand their price movements, trends, and potential future performance.
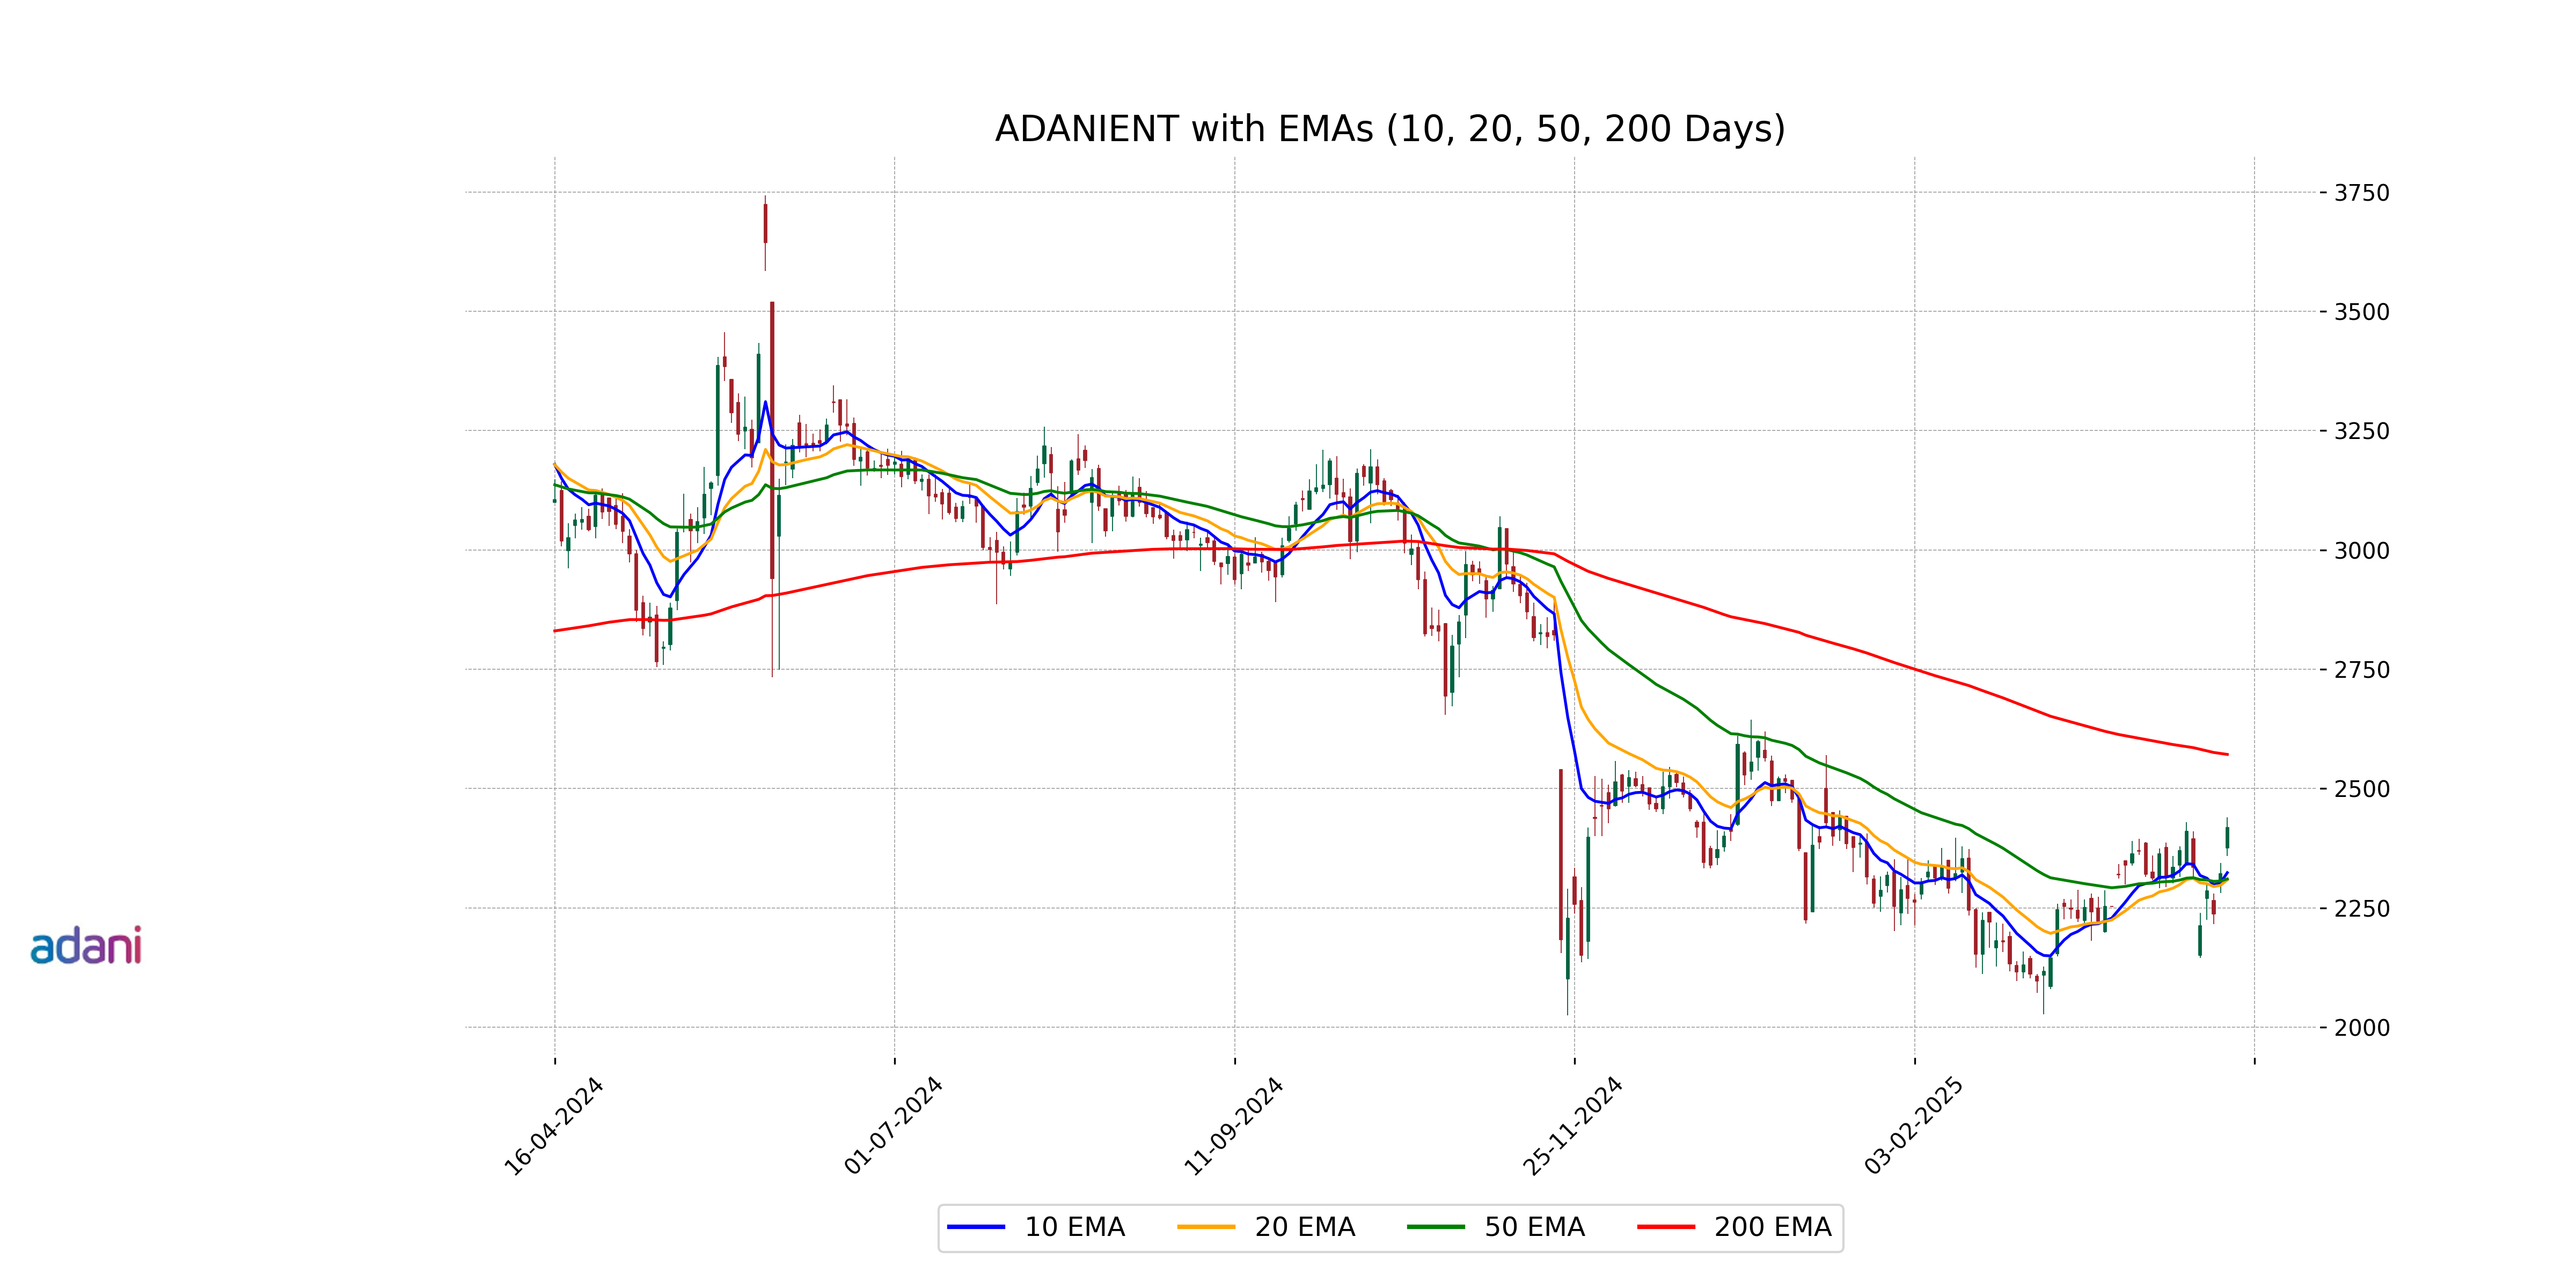
Analysis for Adani Enterprises - April 15, 2025
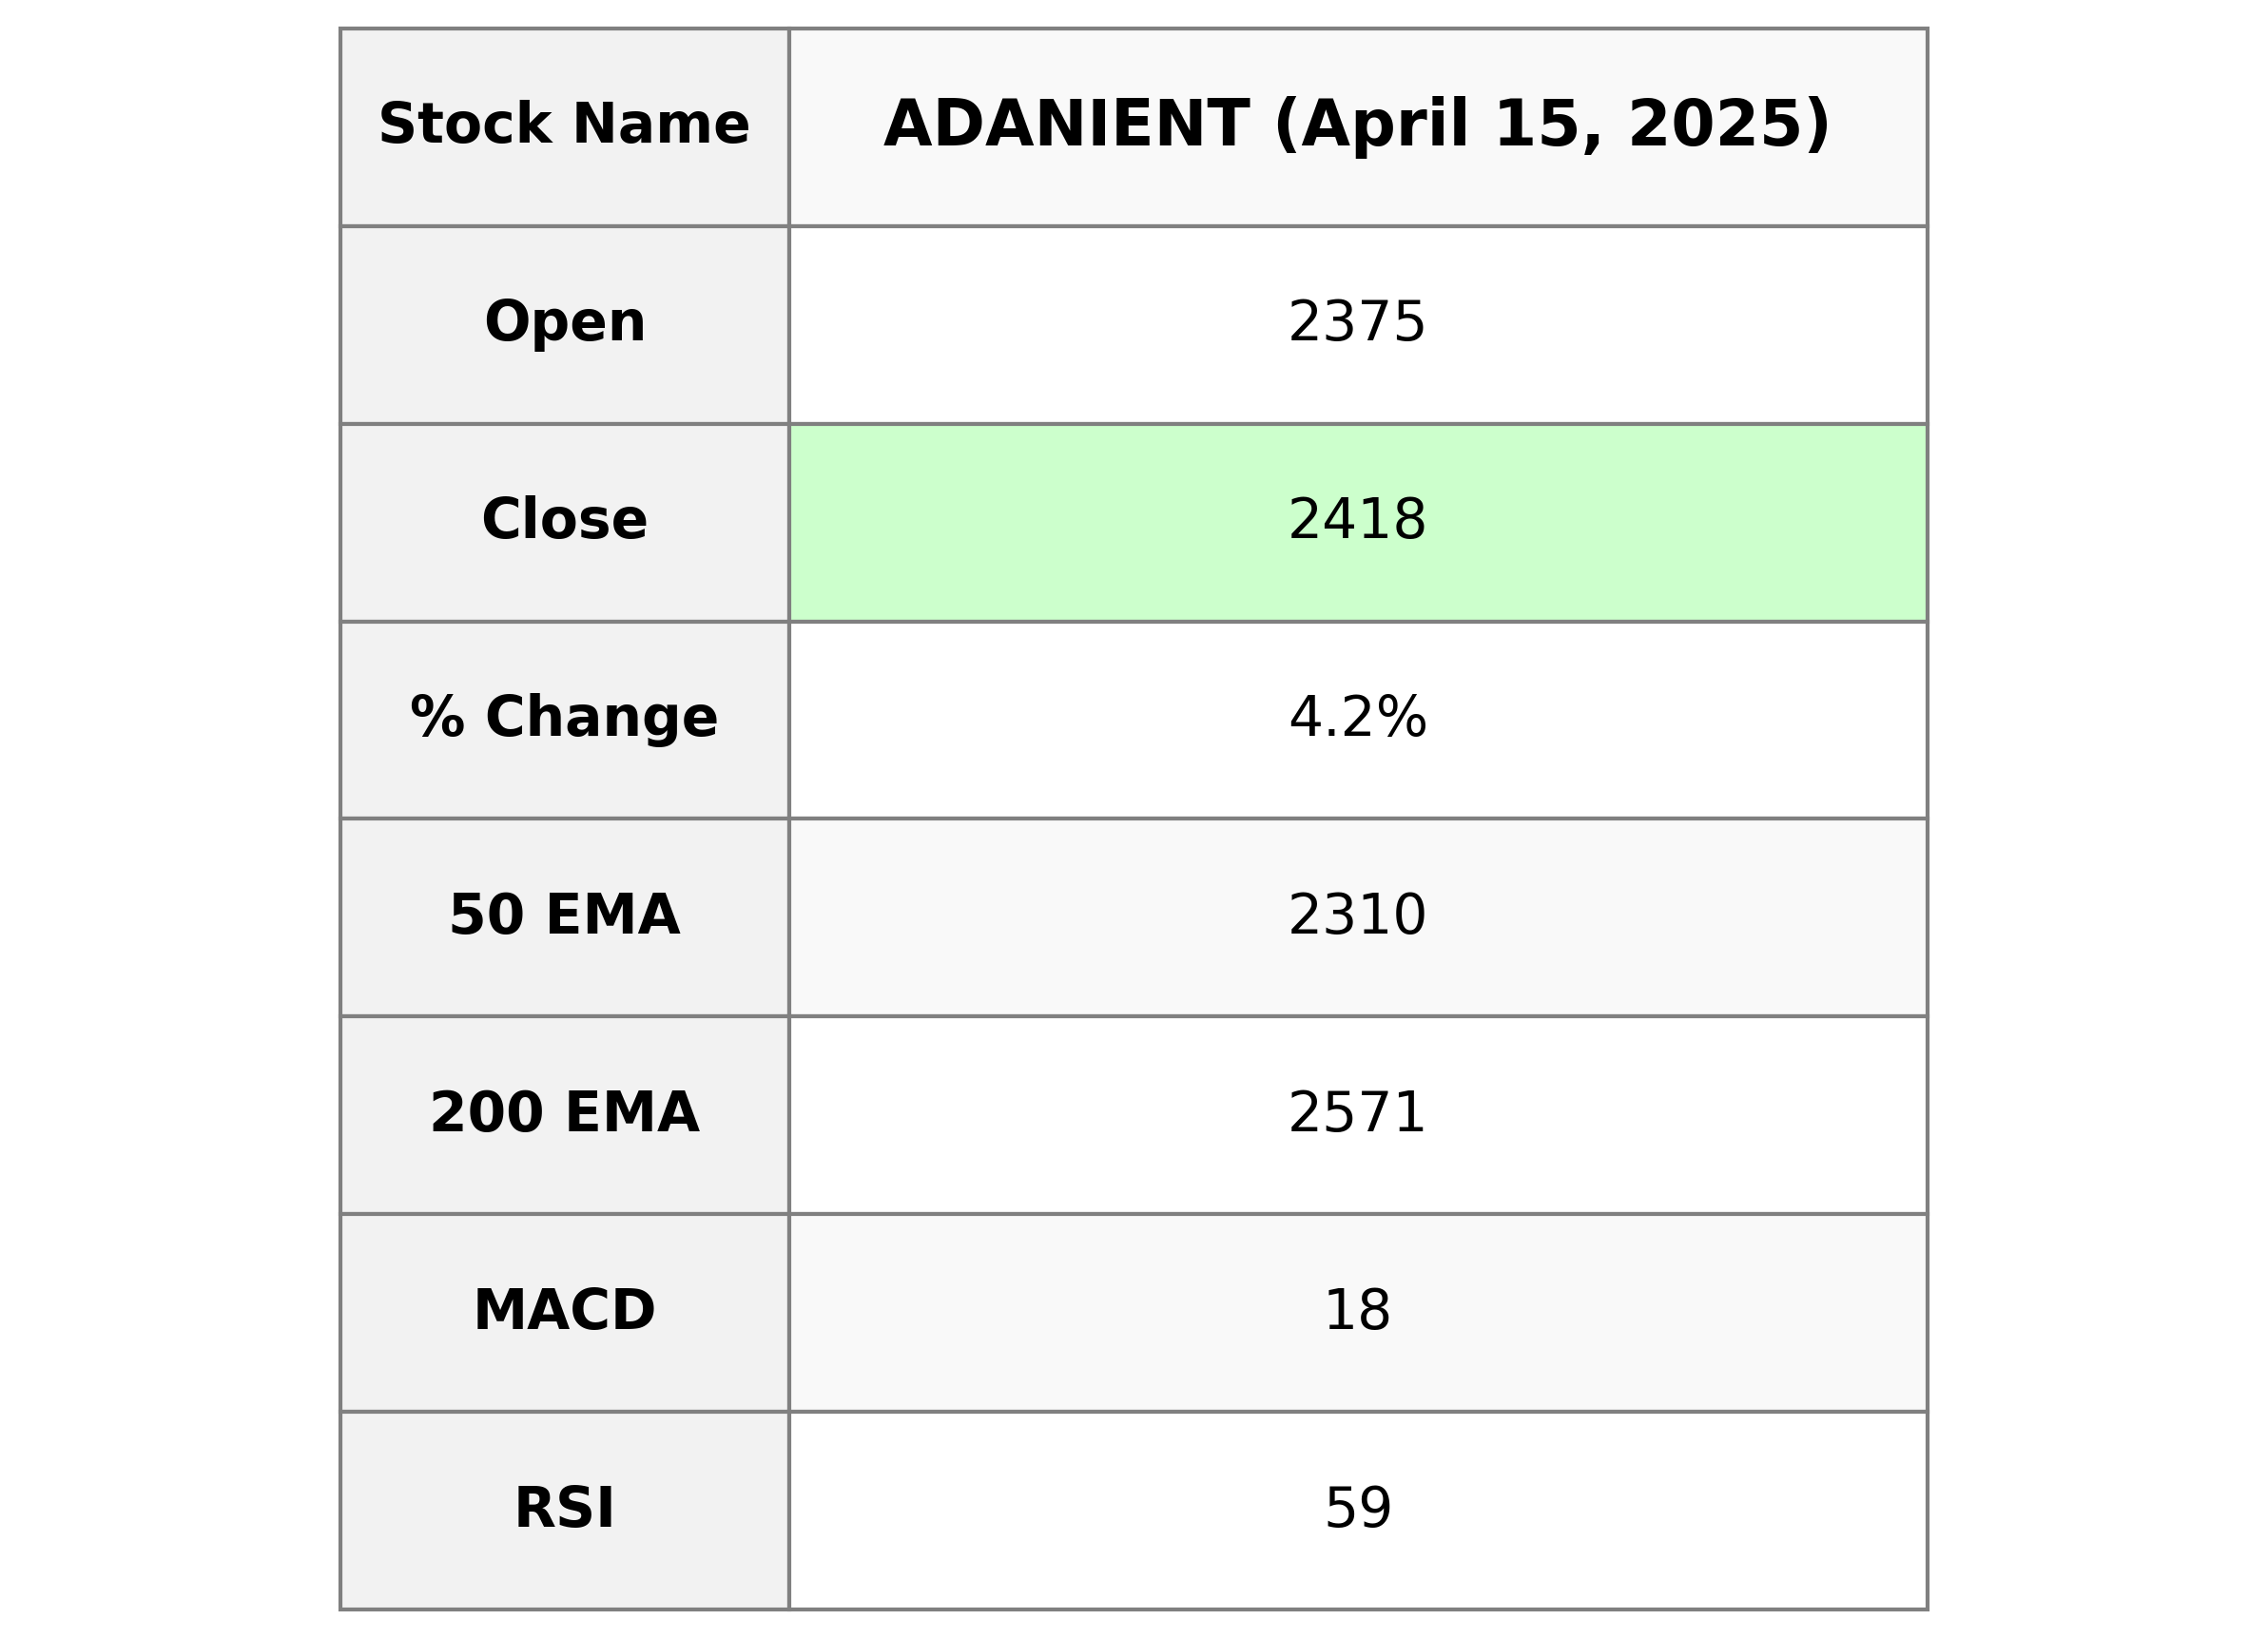
Adani Enterprises demonstrated a strong performance with a notable closing price of 2418.20, reflecting a 4.17% increase over the previous close of 2321.40. The company's market cap stands at approximately 2.79 trillion INR, with a PE ratio of 80.74, indicating significant investor interest. Operating in the energy sector, specifically the thermal coal industry, Adani Enterprises is a key player in India, exhibiting solid technical indicators such as an RSI of 59.0, suggesting a moderate strength in its stock momentum.
Relationship with Key Moving Averages
The closing price of Adani Enterprises is above its 50-EMA and 10-EMA, indicating a bullish short-term trend, but it remains below the 200-EMA, suggesting a longer-term bearish trend. The stock is trading above the 20-EMA, reinforcing the recent upward momentum.
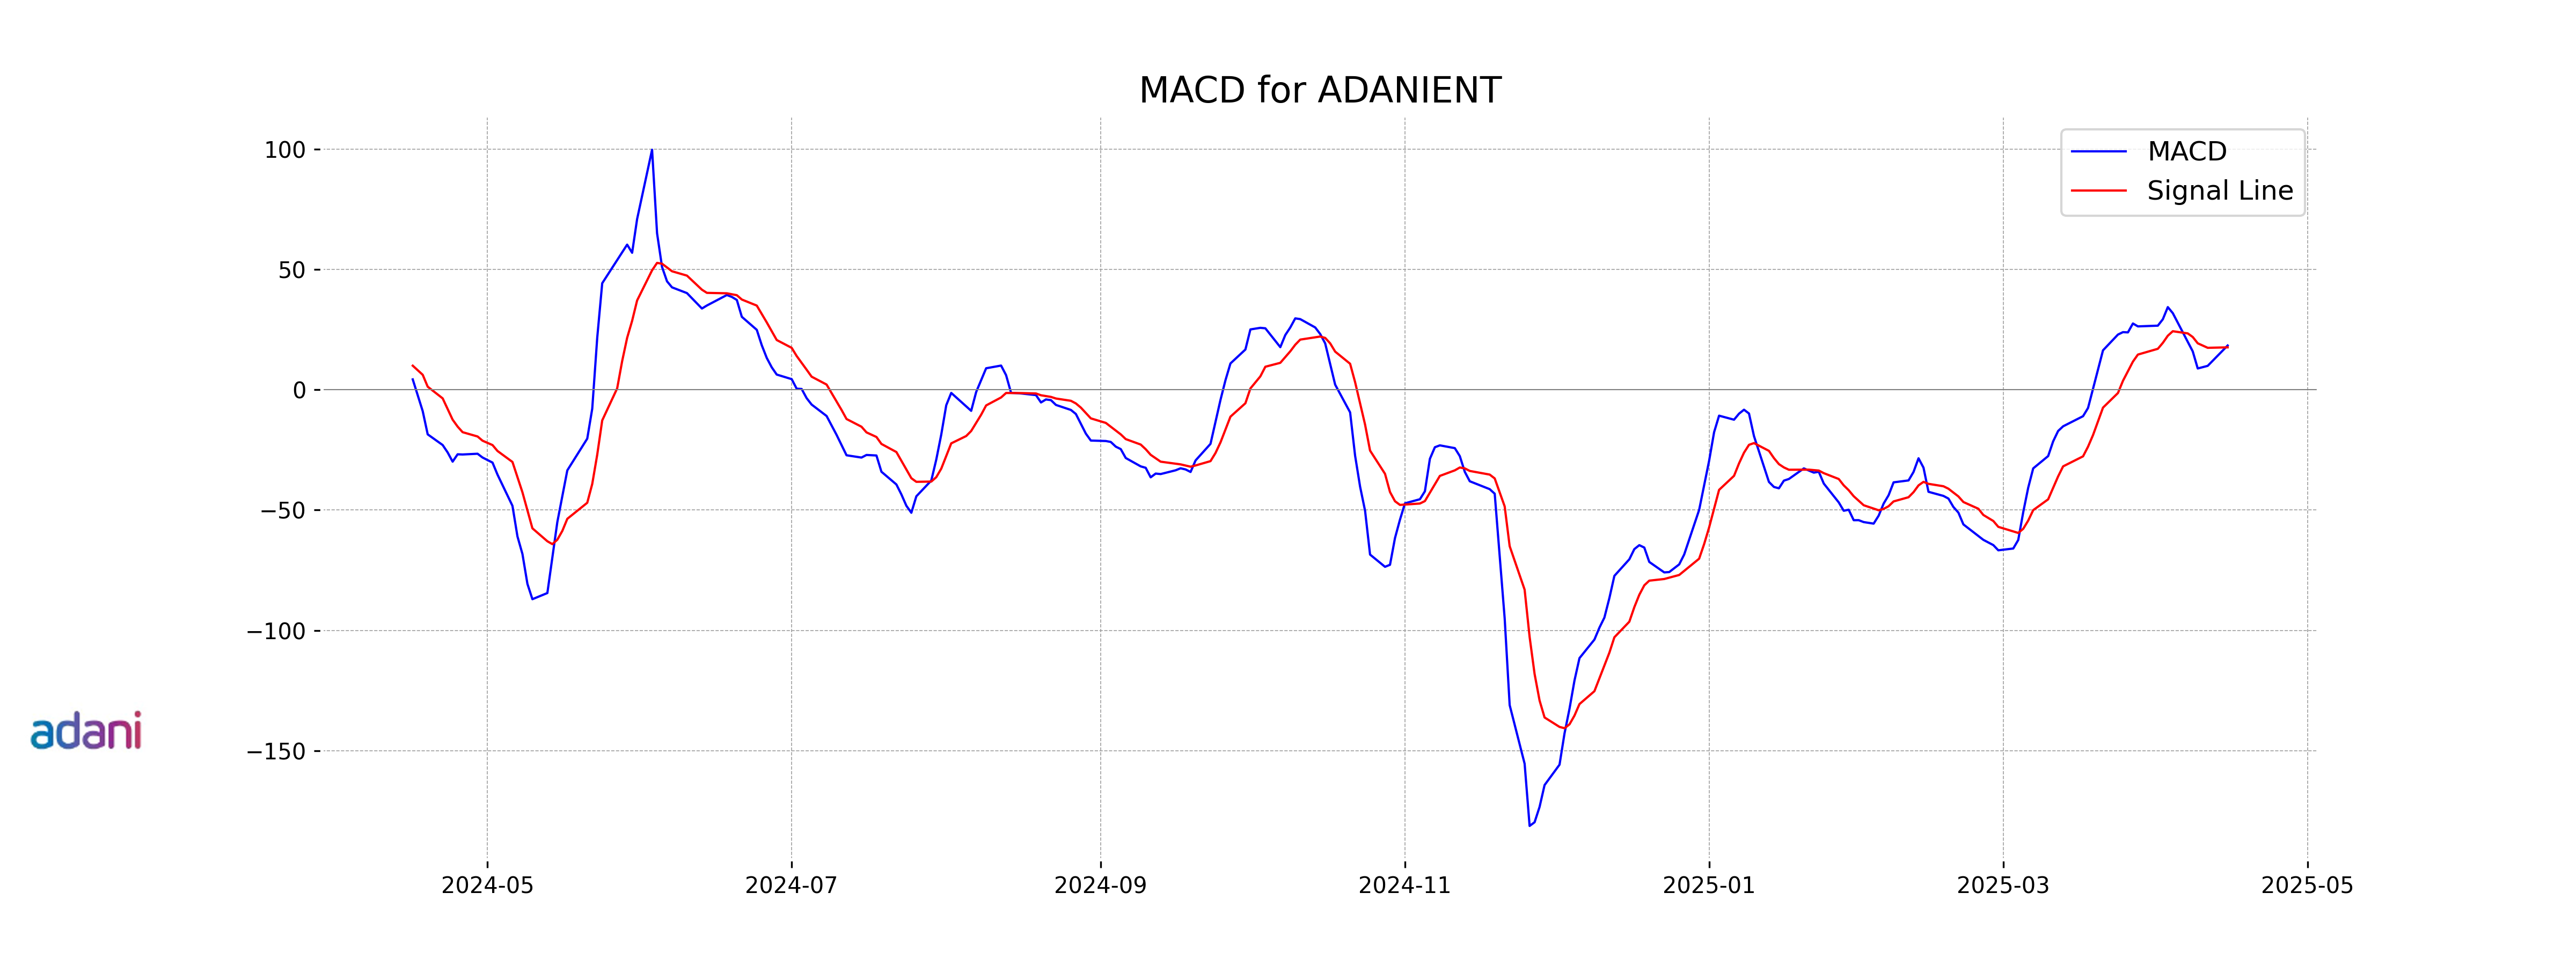
Moving Averages Trend (MACD)
1. MACD Analysis for Adani Enterprises: - The current MACD value is 18.40, which is above the signal line value of 17.63. - This indicates a positive momentum, suggesting a potential bullish trend for Adani Enterprises.
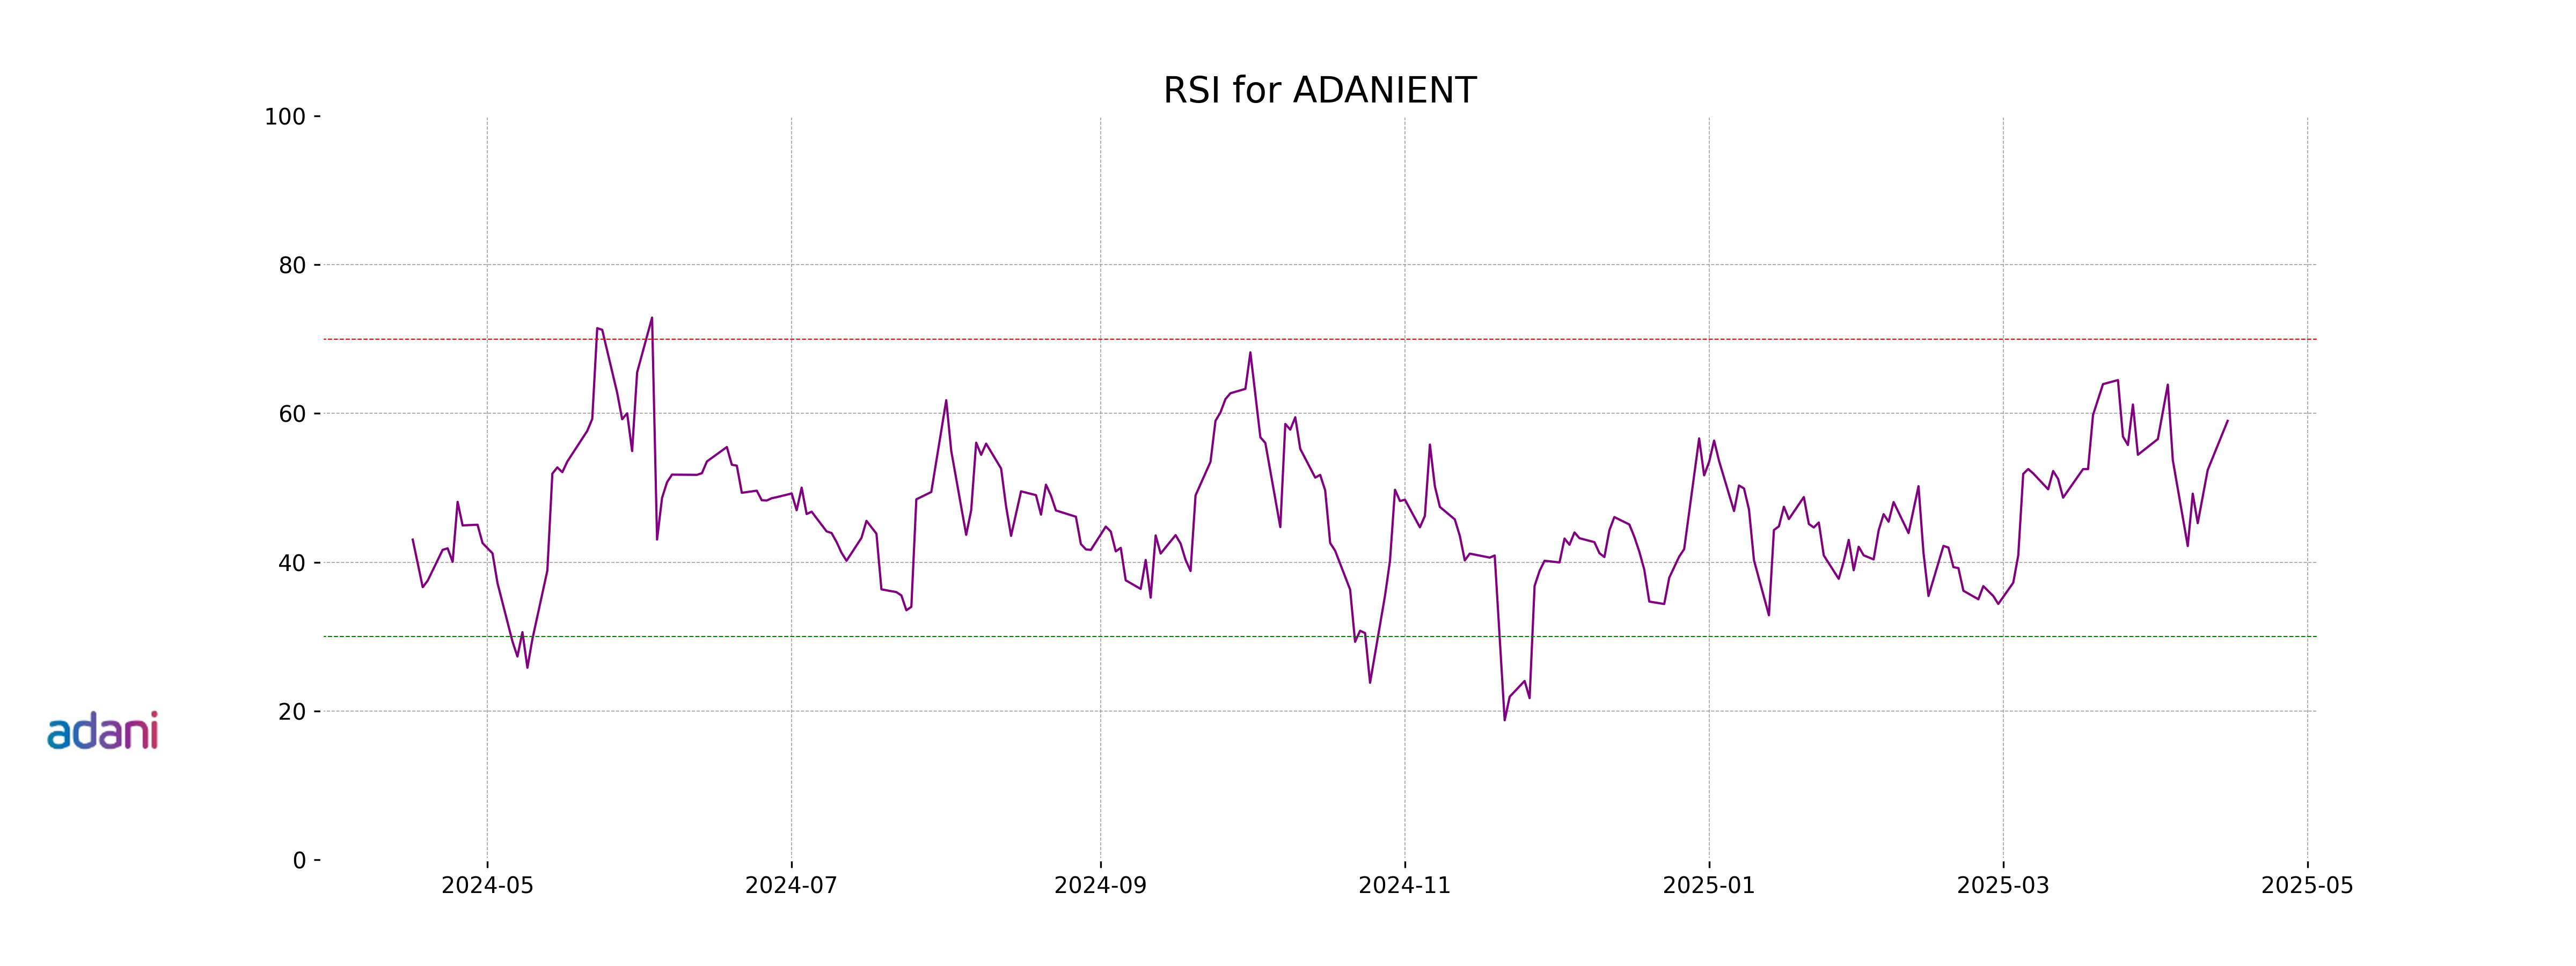
RSI Analysis
Adani Enterprises currently has an RSI of 59.01, indicating that the stock is in a neutral zone. This suggests there is no significant overbought or oversold condition, allowing for potential volatility without a strong directional bias.
Analysis for IndusInd Bank - April 15, 2025
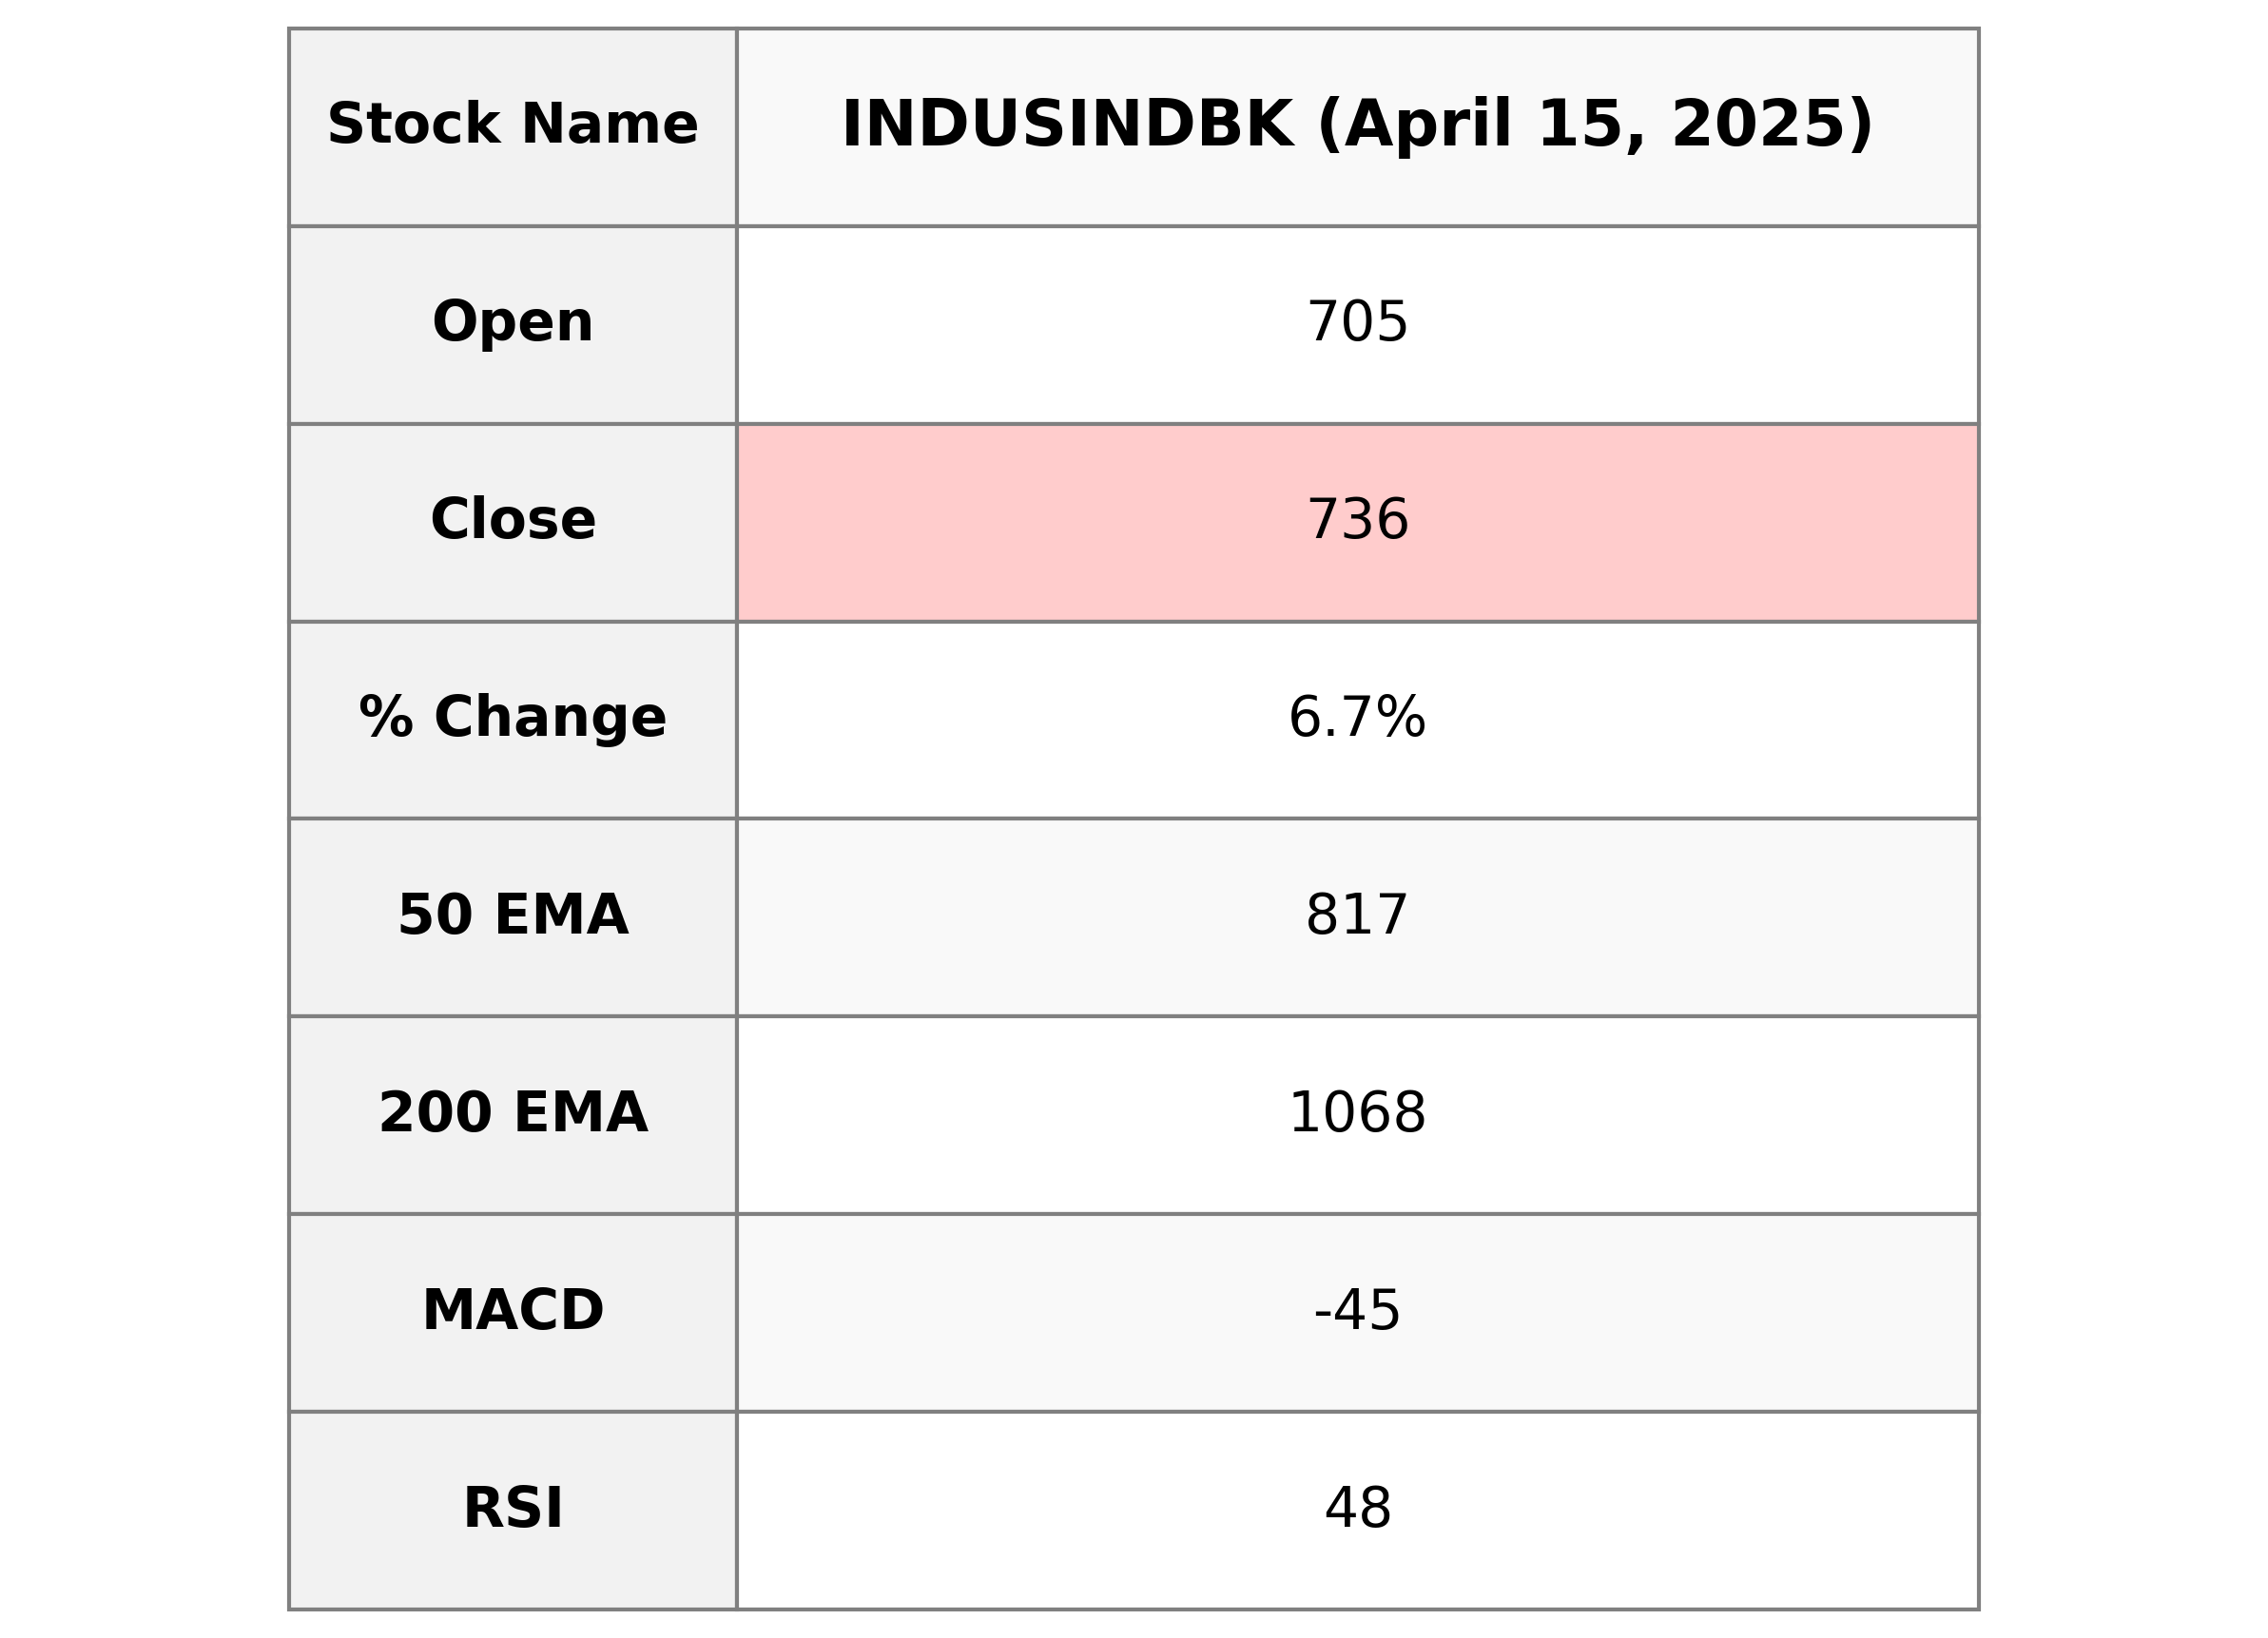
IndusInd Bank experienced a notable increase in its stock price, with a close at 735.90 and a percentage change of 6.73% from its previous close. Despite the positive performance, its 50 and 200 EMA values suggest it's trading below its short and long-term averages, hinting at potential volatility. The bank is in the Financial Services sector, specifically under Regional Banks, with a relatively low PE ratio of 7.91, indicating potential undervaluation compared to its earnings.
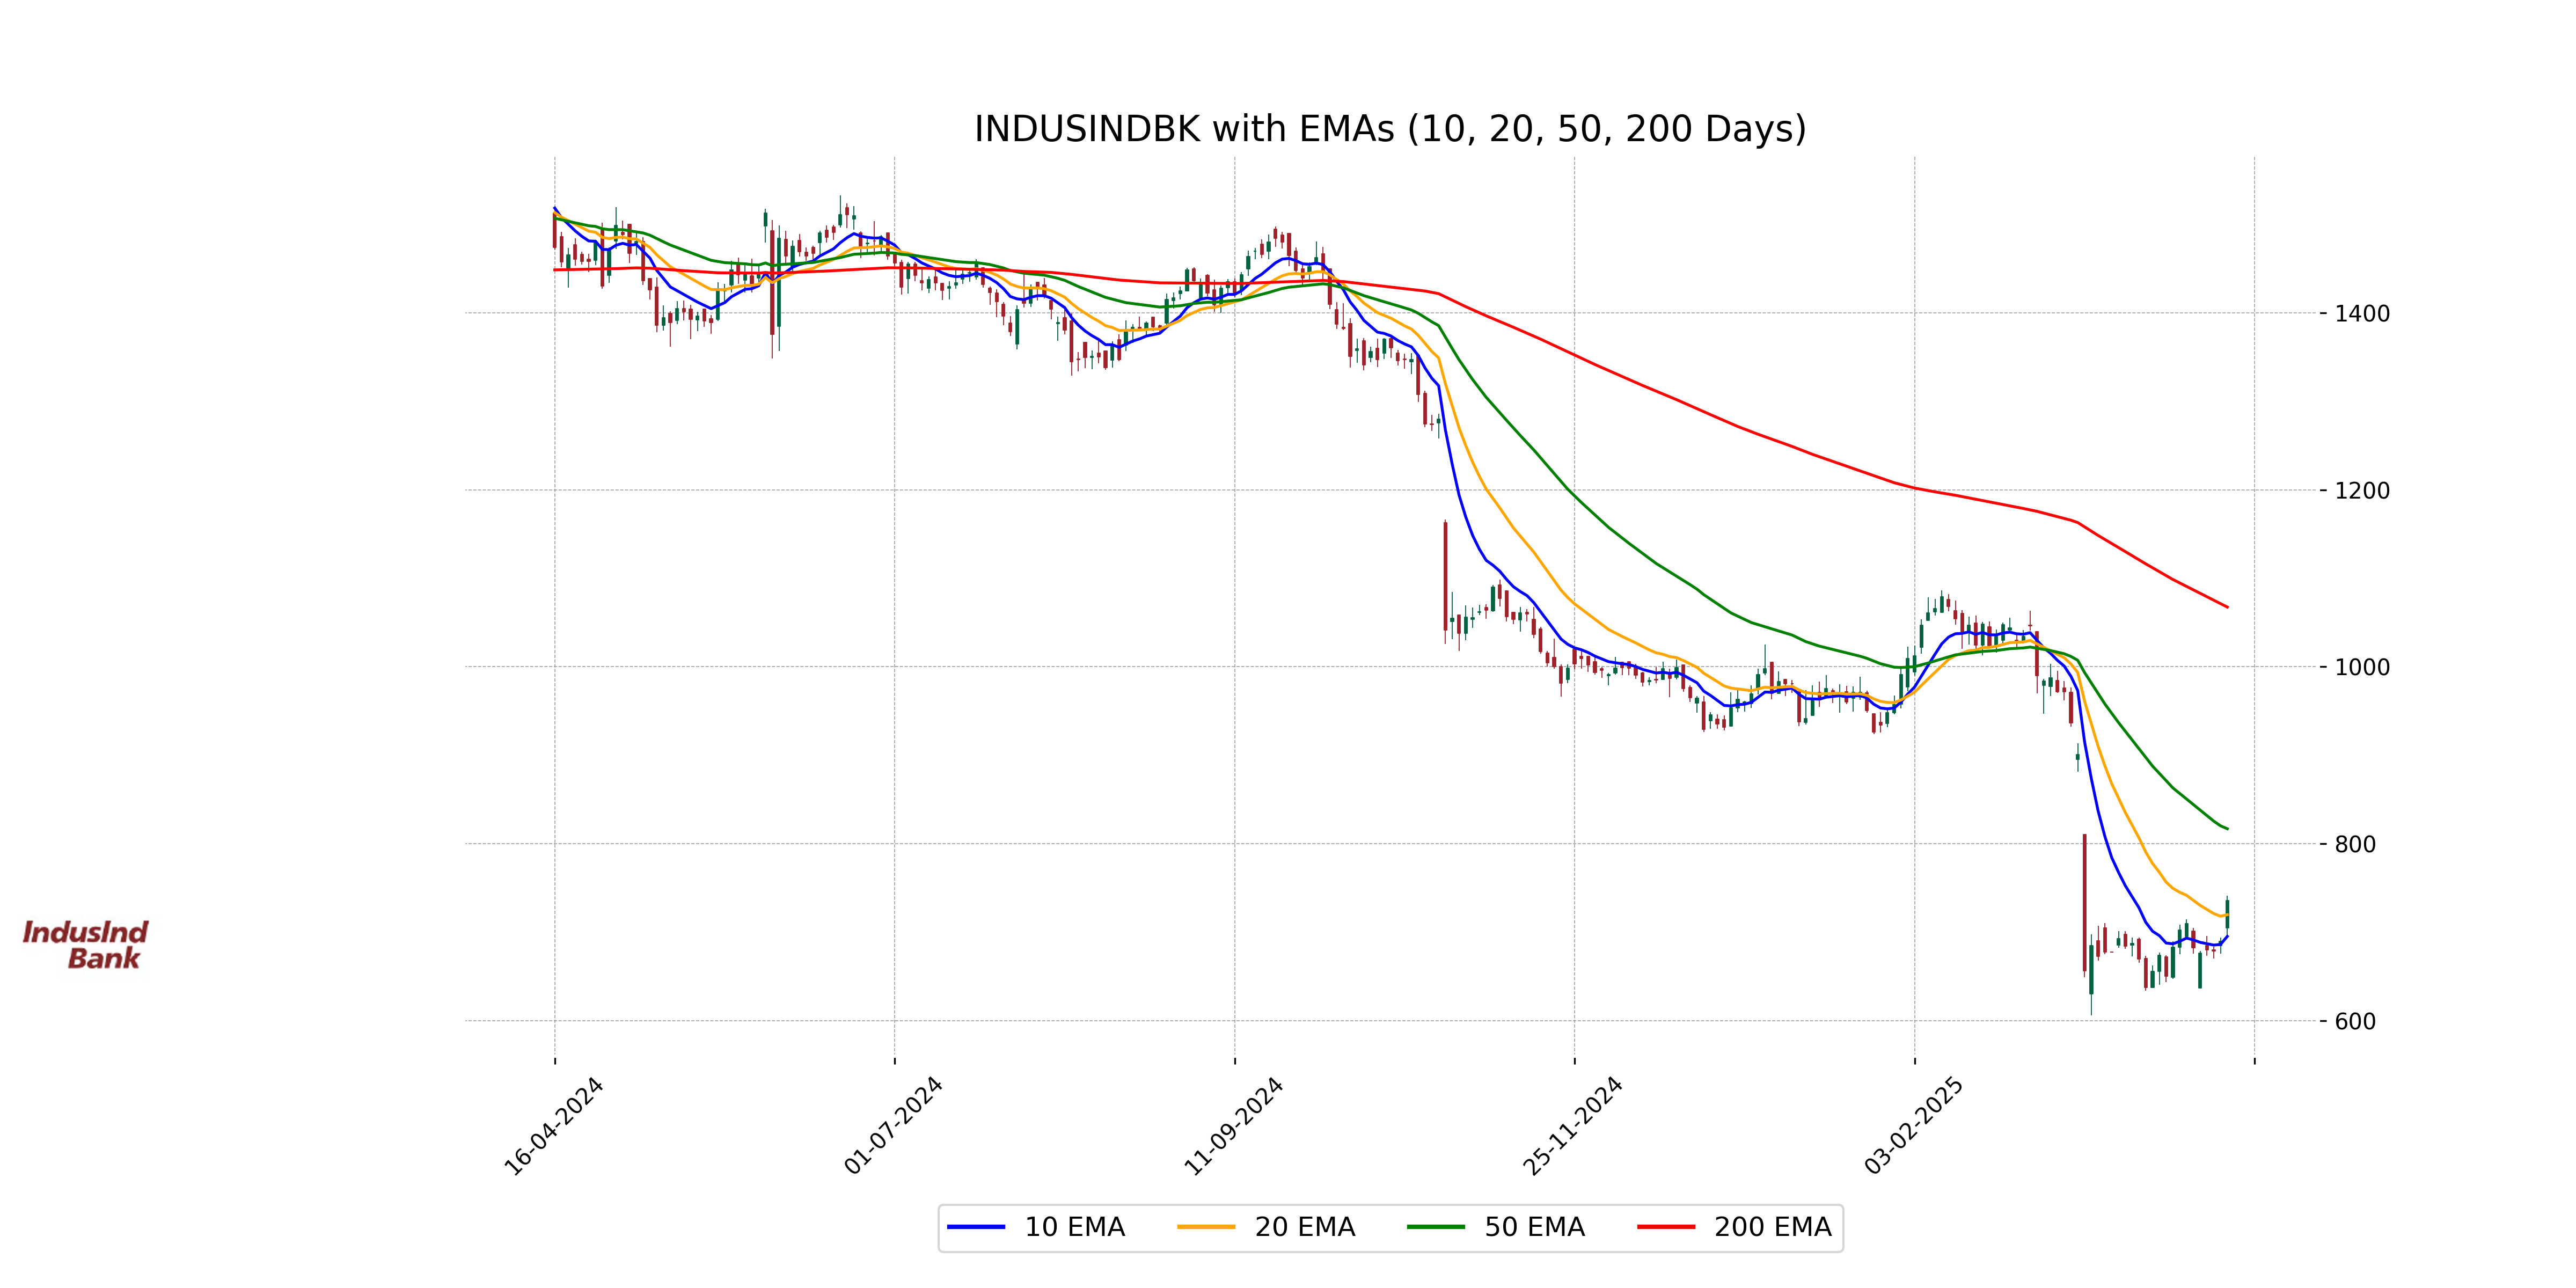
Relationship with Key Moving Averages
IndusInd Bank's current closing price of 735.90 is below its 50-day EMA of 816.86 and significantly below the 200-day EMA of 1067.55, indicating a bearish trend relative to these key moving averages. However, it is currently above the 10-day EMA of 695.12 and close to the 20-day EMA of 719.64, suggesting some recent positive momentum.
Moving Averages Trend (MACD)
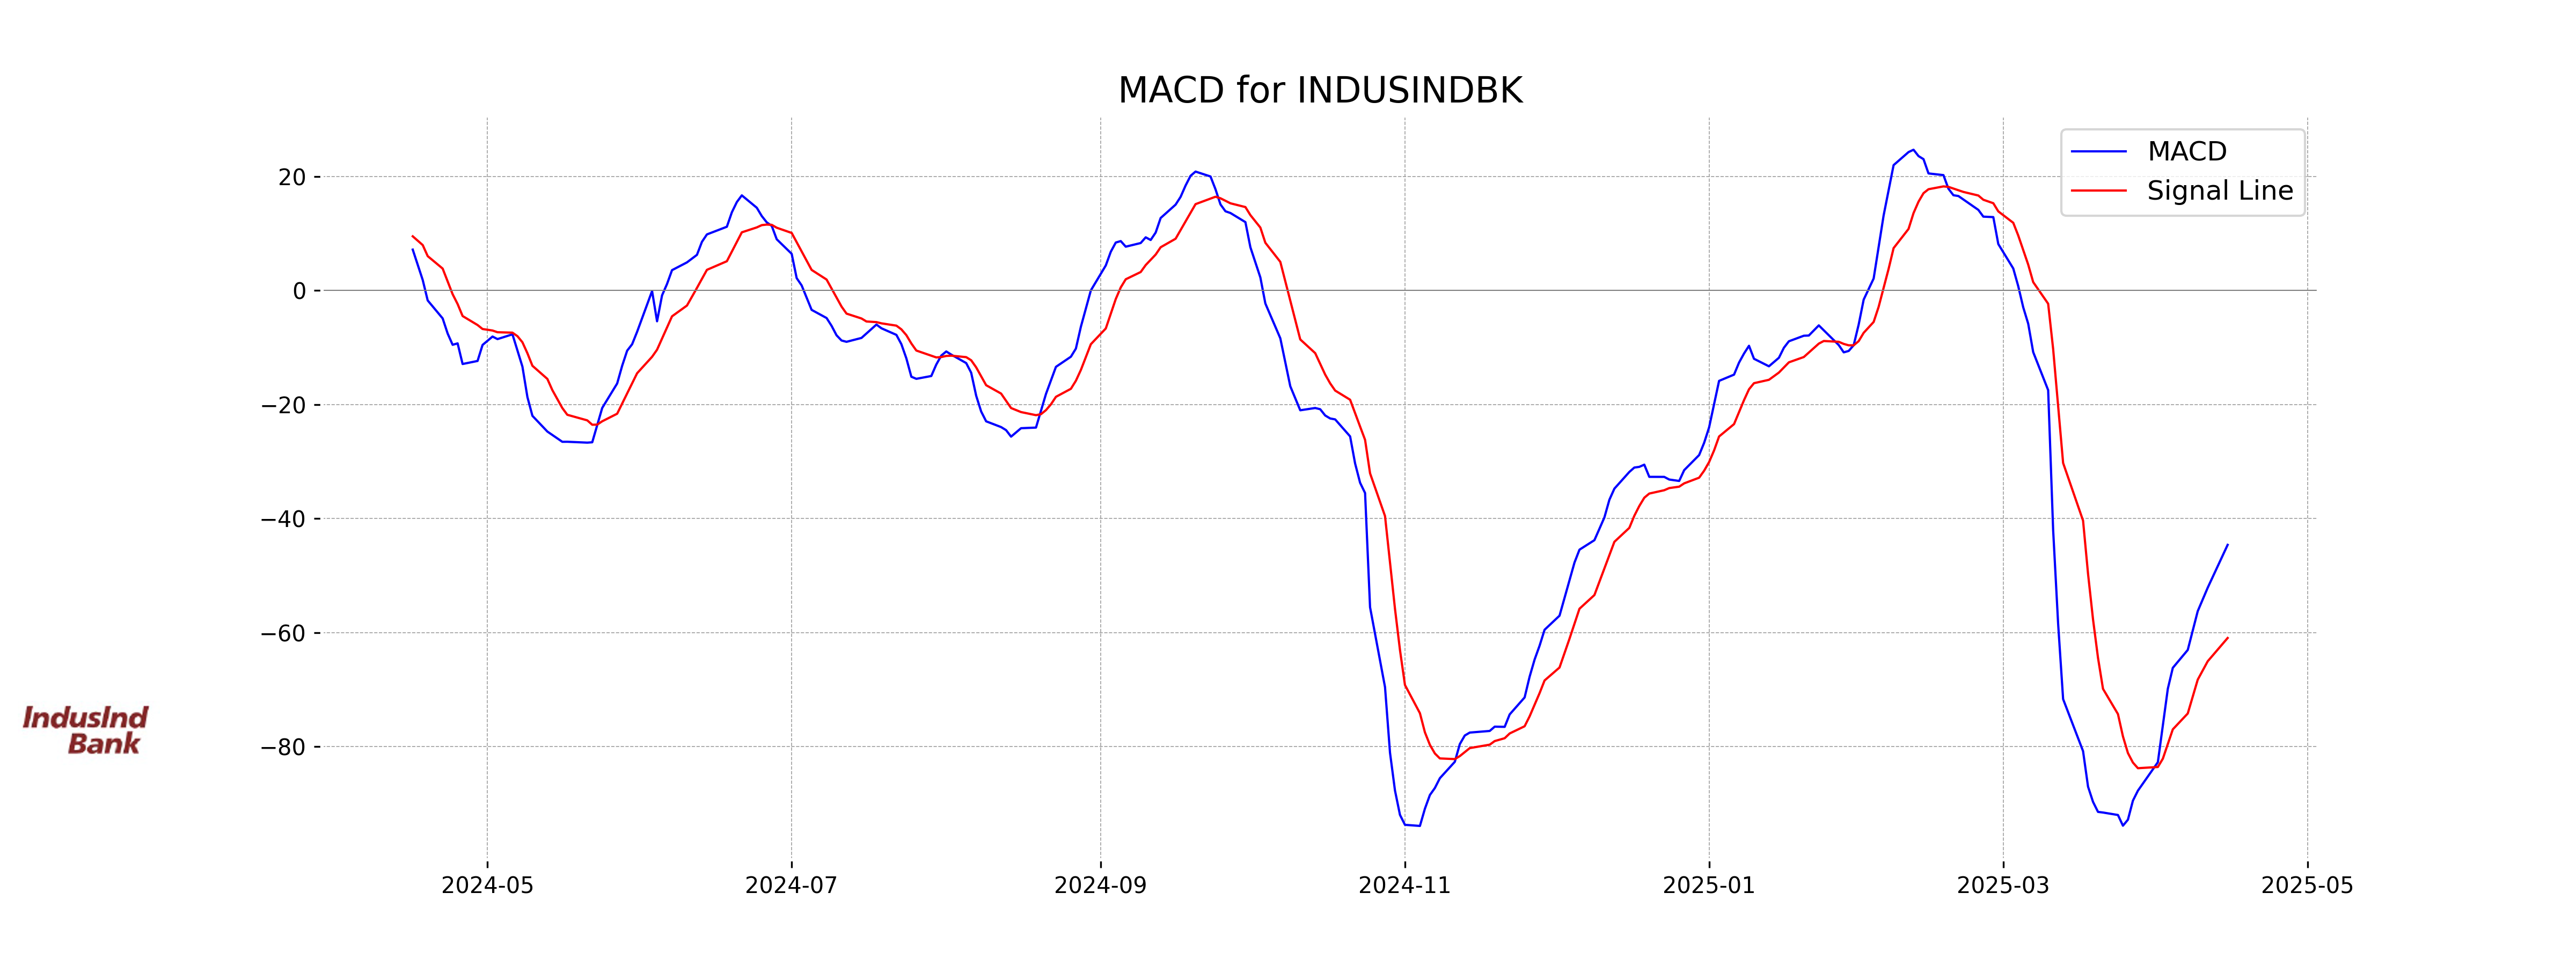
MACD Analysis for IndusInd Bank The MACD value of -44.61, being higher than the MACD signal of -60.94, indicates a bullish crossover, suggesting potential upward momentum. Despite this, the MACD remains in negative territory, pointing towards overall bearish conditions that might be weakening.
RSI Analysis
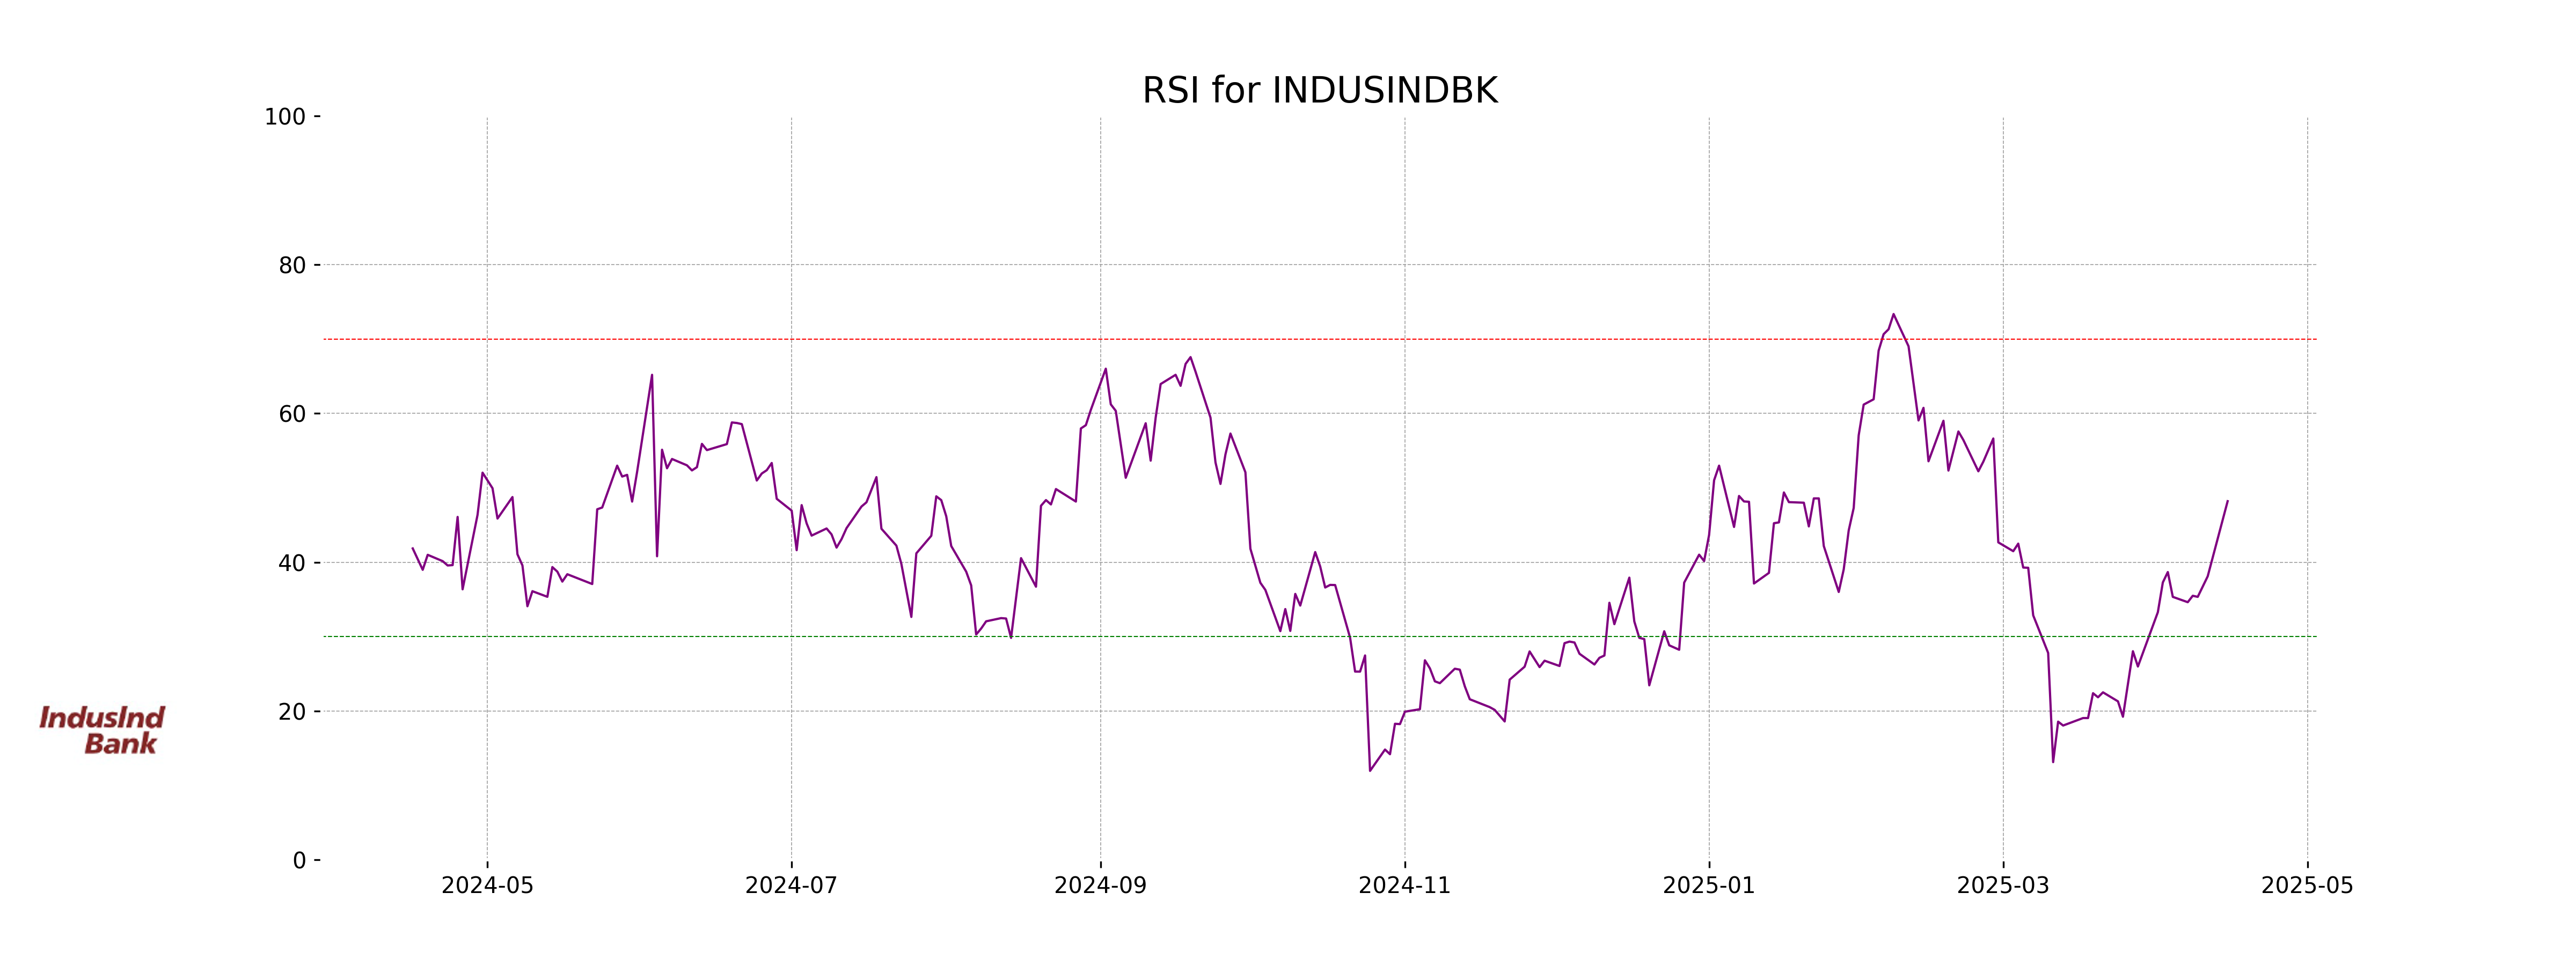
IndusInd Bank's RSI is 48.21, which suggests that the stock is neither in the overbought nor oversold territory. This level indicates a neutral momentum, and investors might look for additional signals to determine further price direction.
Analysis for HCL Technologies - April 15, 2025
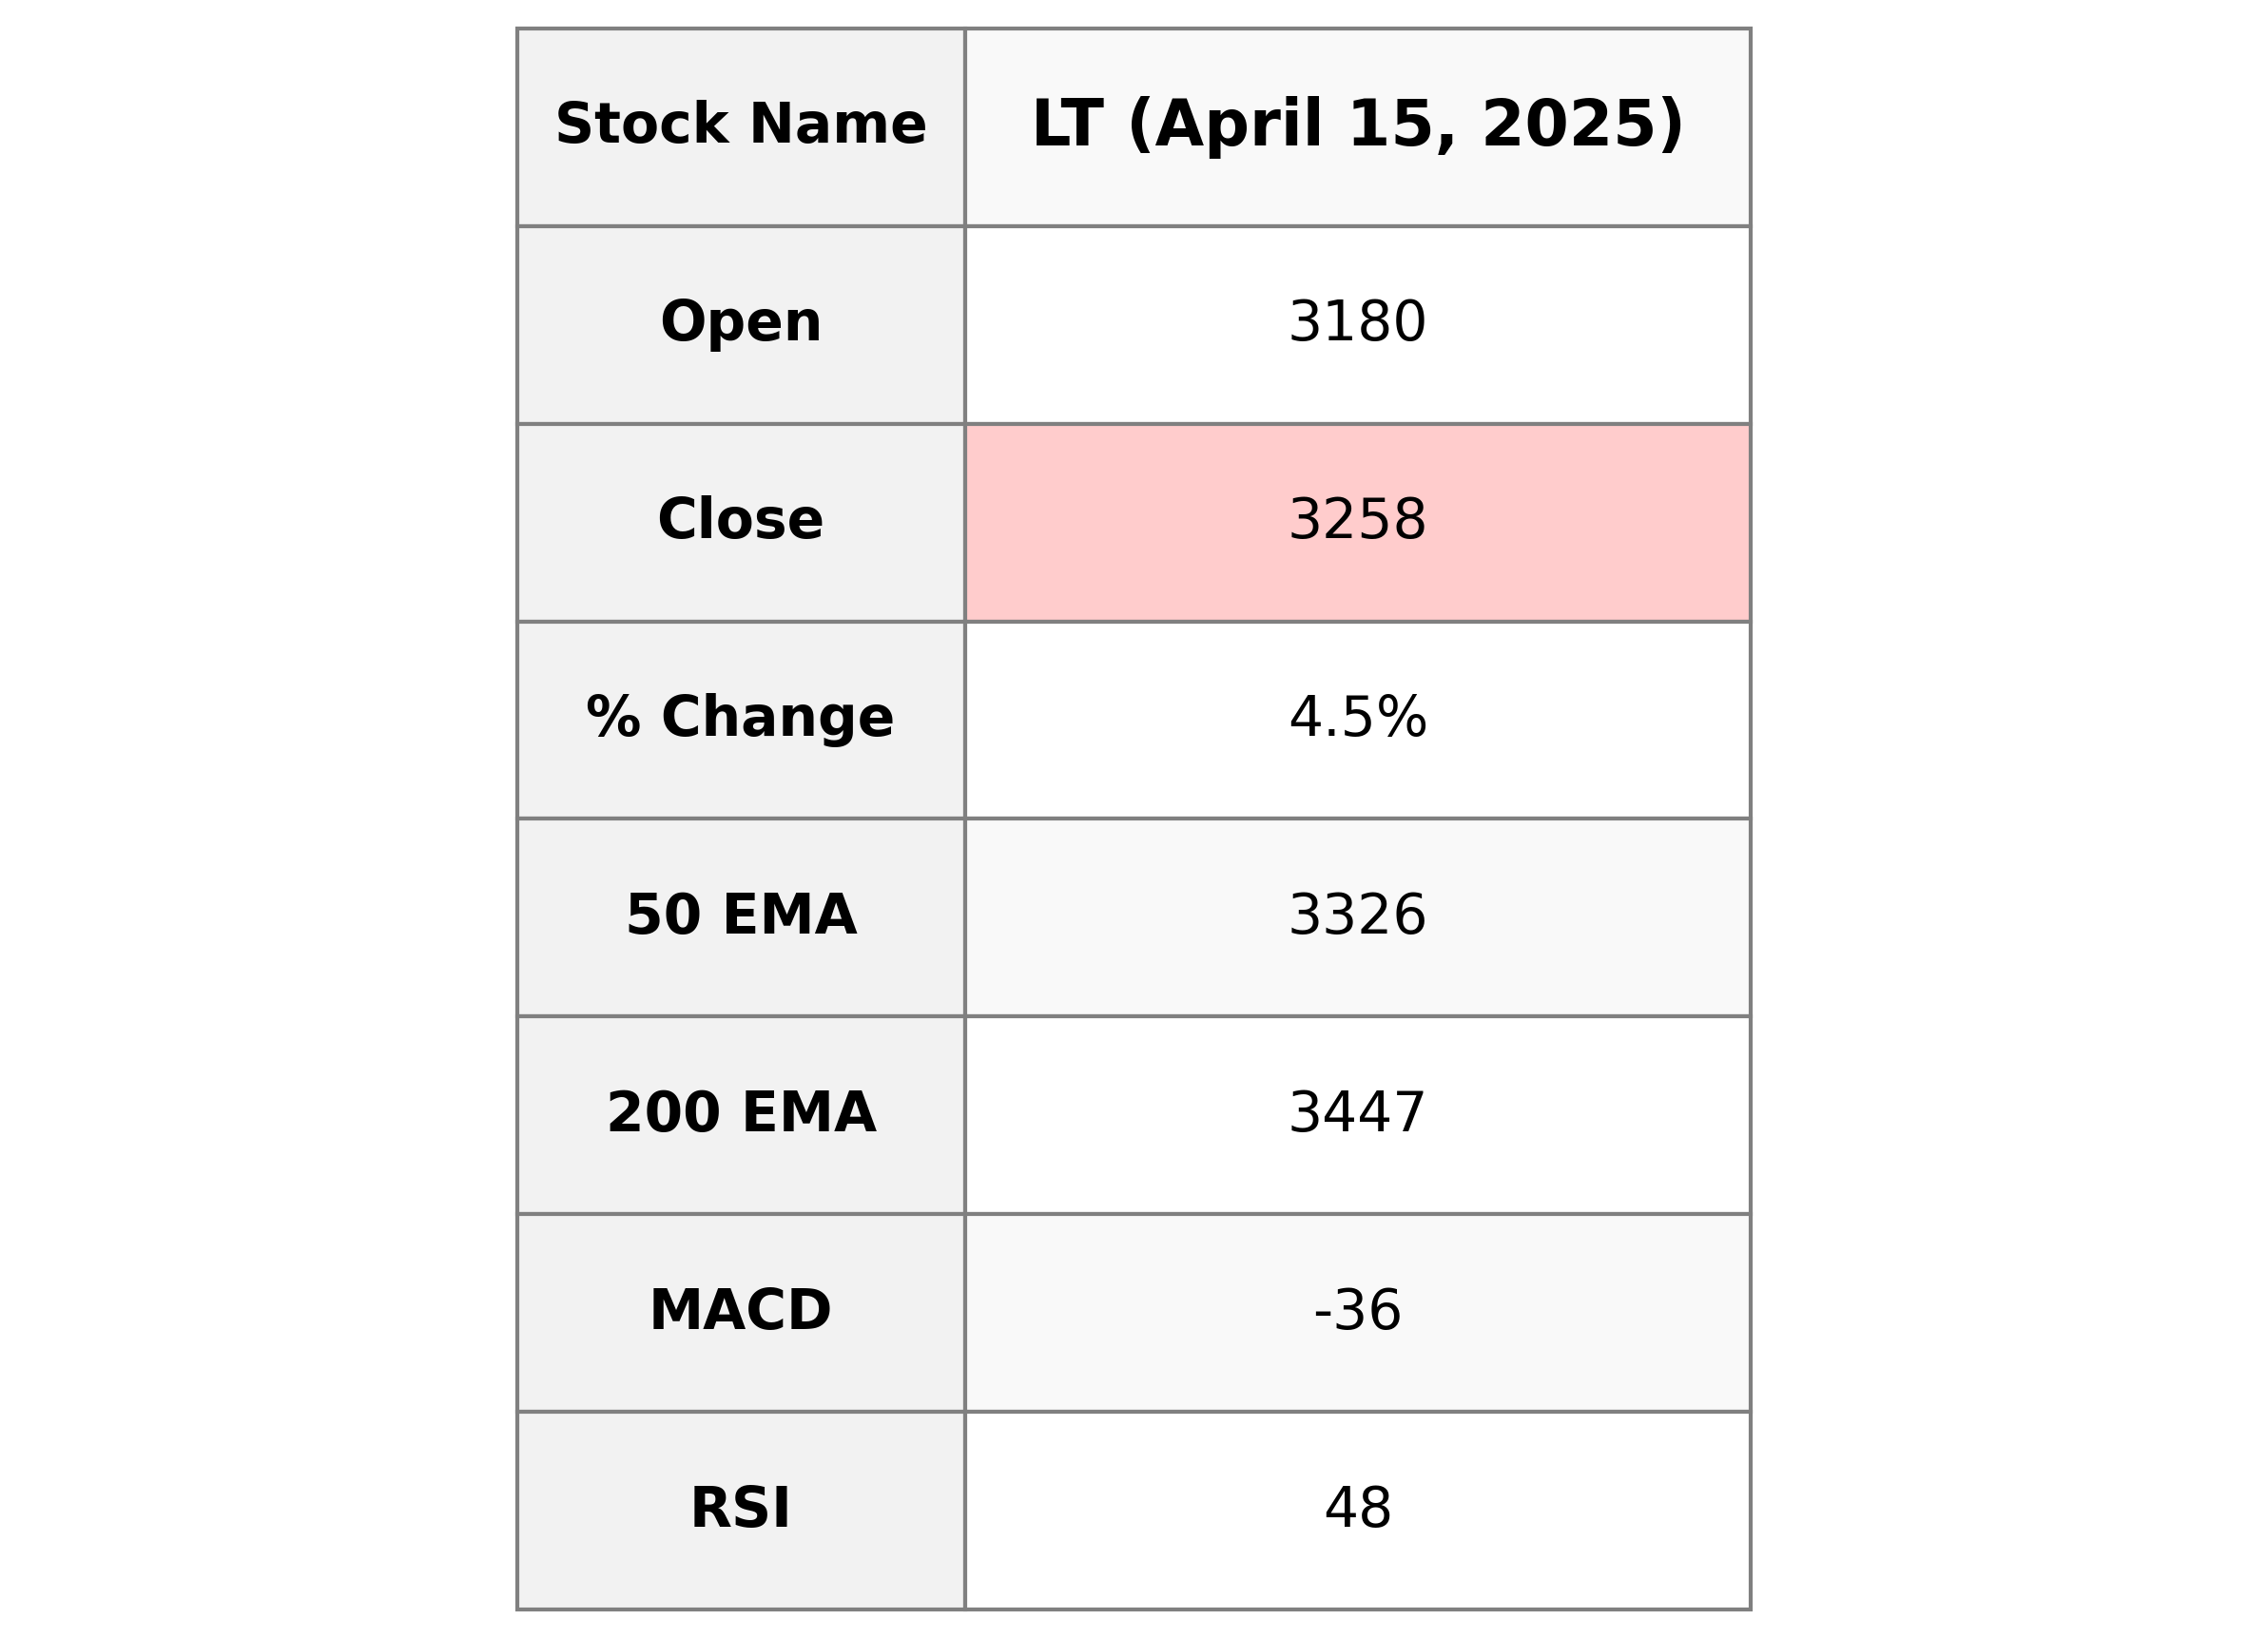
HCL Technologies Performance: The provided data offers a glimpse into the stock performance of L&T on a specific trading day. The stock opened at 3180.0 and closed at 3257.6, marking a 4.55% increase from its previous close of 3115.95. Despite trading below its 50 and 200 EMA, the RSI indicates a neutral momentum, and the MACD suggests a bearish trend, while the stock enjoys a robust market cap in the industrial sector in India.
Relationship with Key Moving Averages
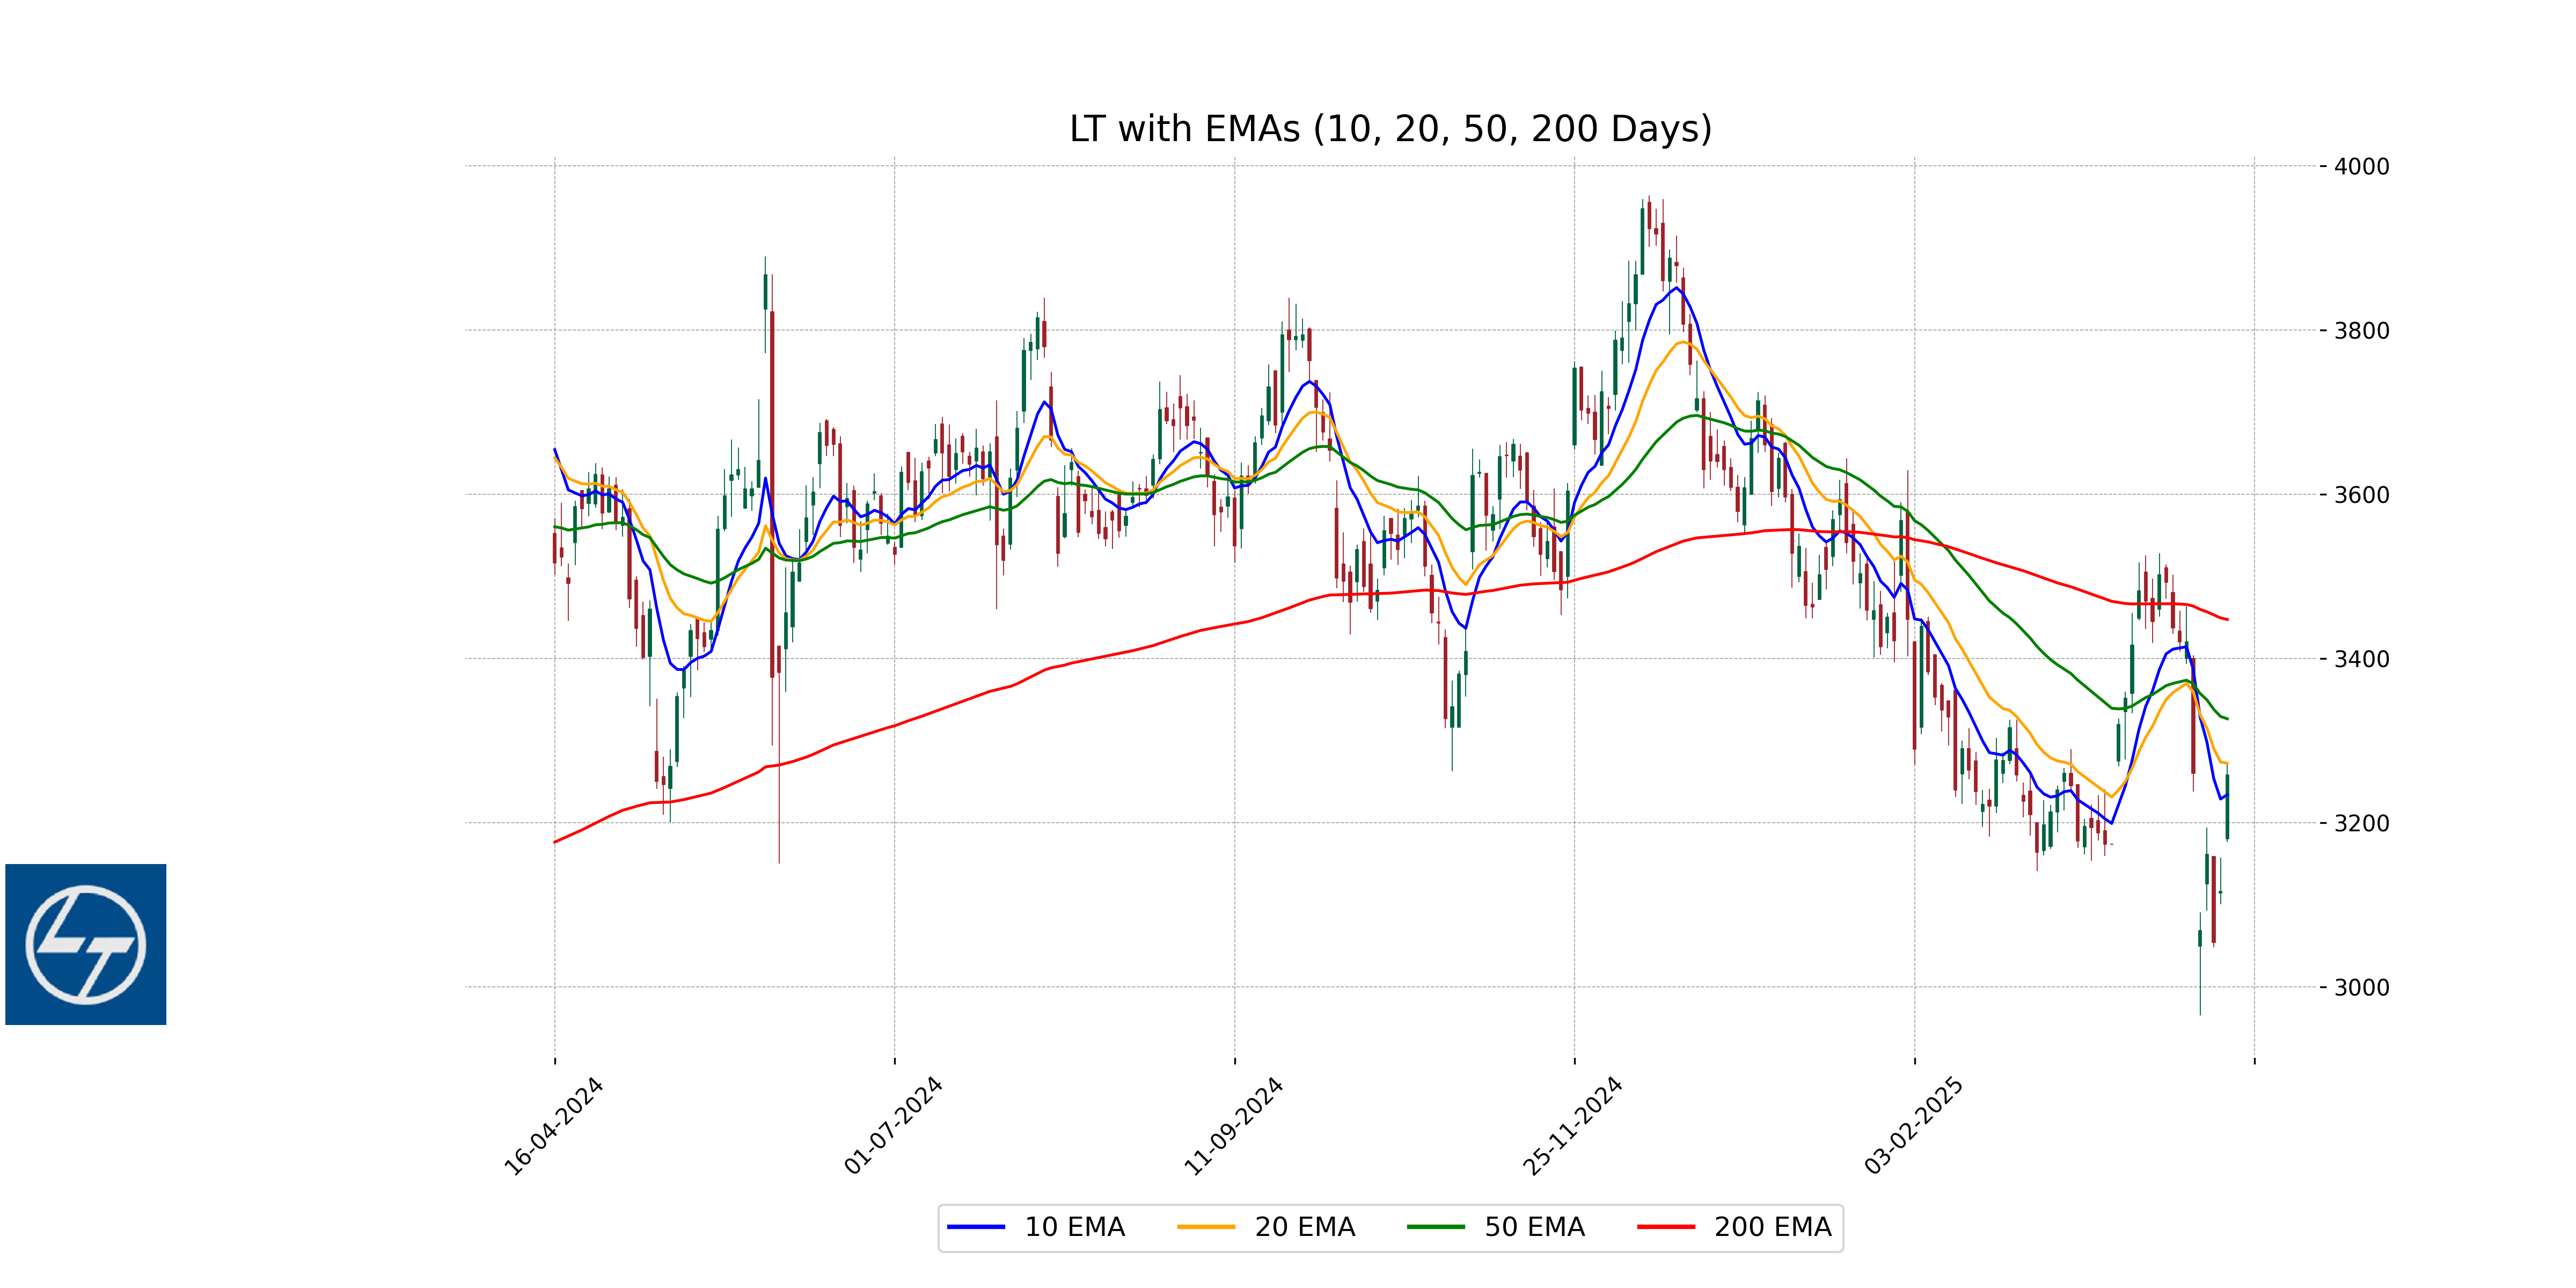
Larsen & Toubro's current close price of 3257.60 is below its 50-day EMA of 3326.28 and significantly below its 200-day EMA of 3447.27. This suggests a potential downtrend in the stock, as it also trades near its 10-day EMA of 3233.85 but below its 20-day EMA of 3272.11.
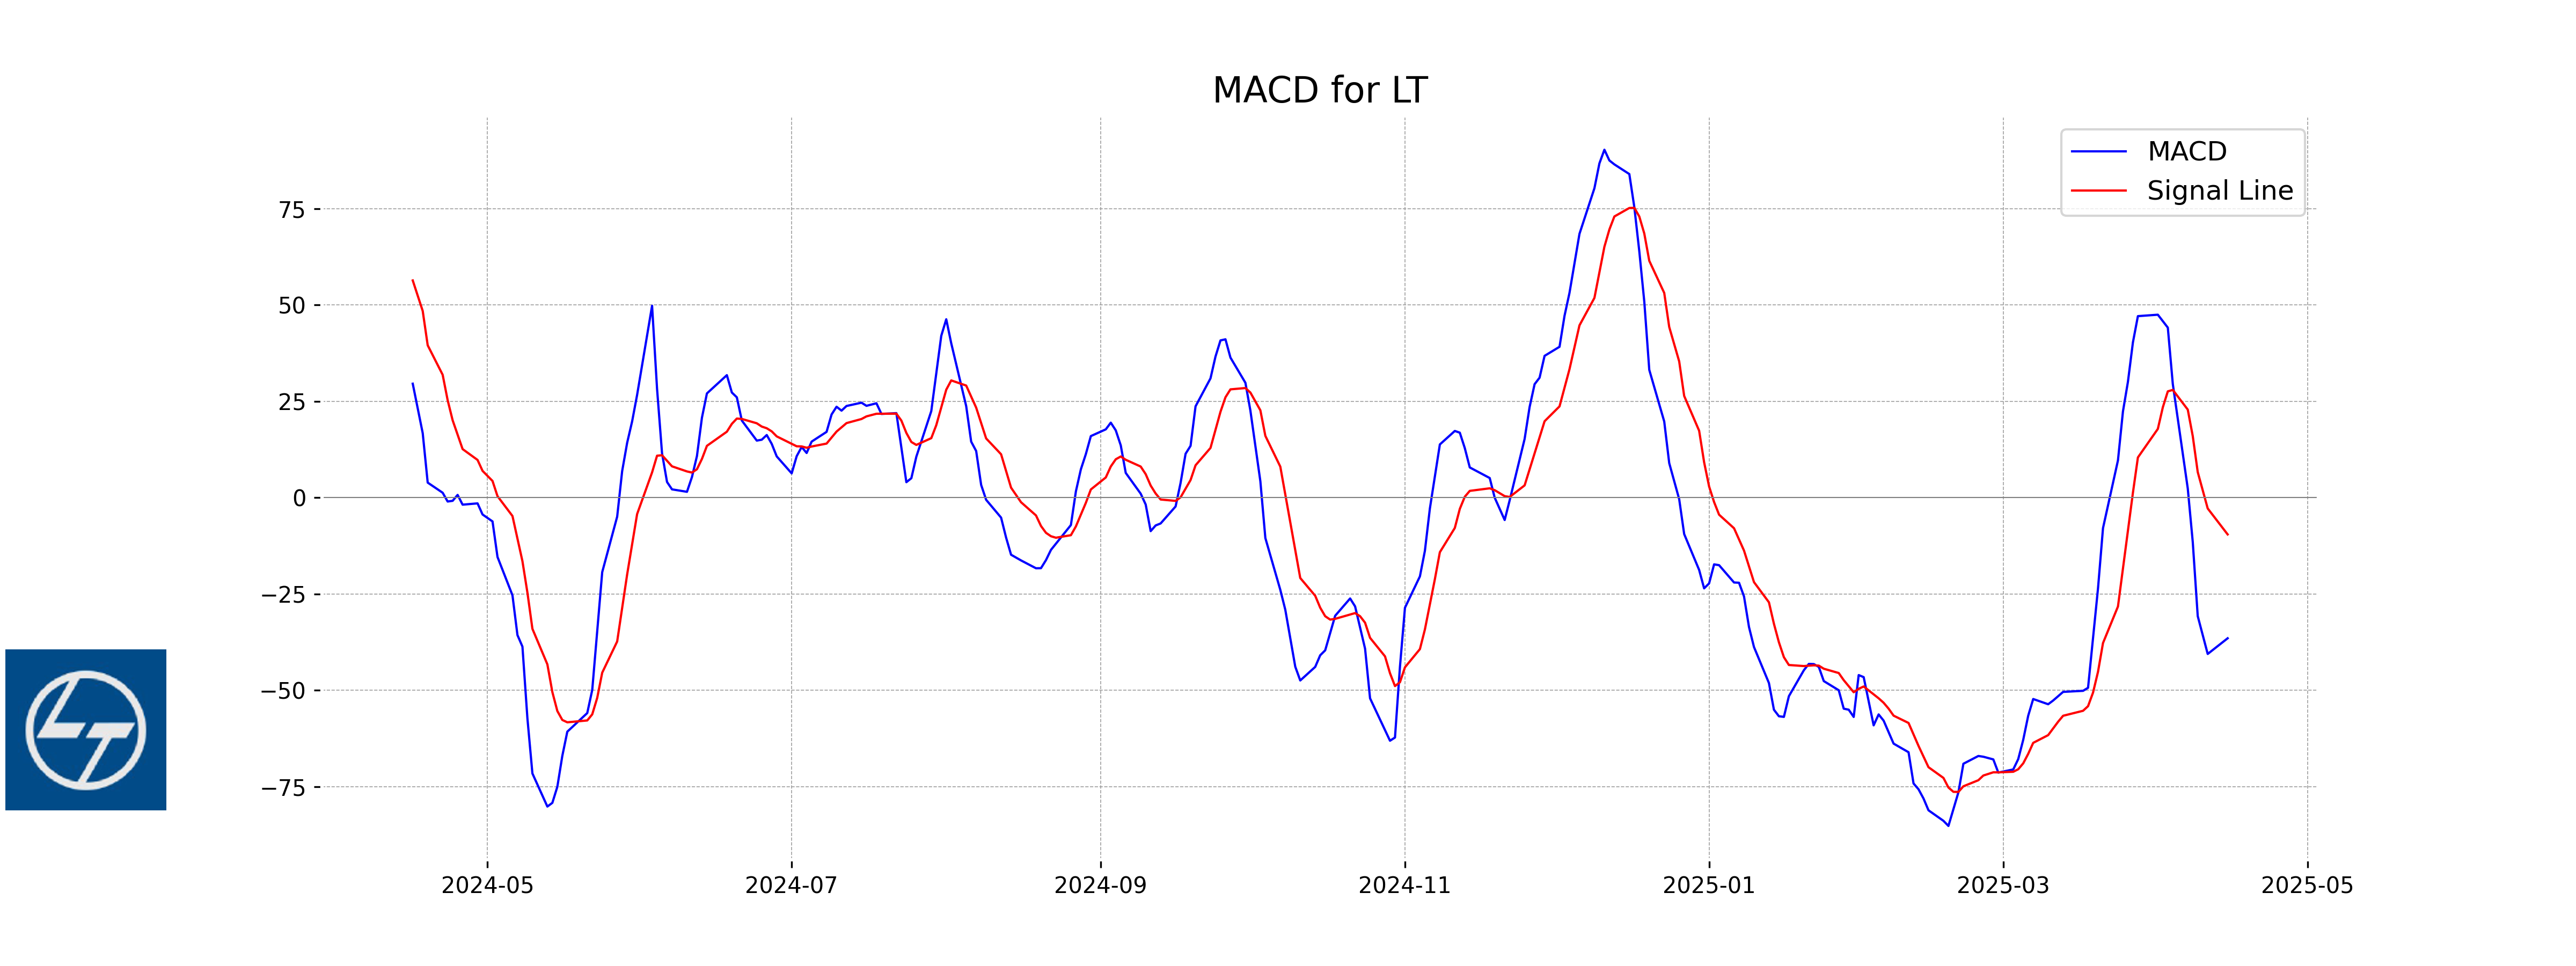
Moving Averages Trend (MACD)
``` The MACD for HCL Technologies indicates a bearish trend where the MACD line is below the signal line. This suggests potential downward momentum in the stock' price. Investors may need to look out for further signals to confirm this trend before making decisions. ```
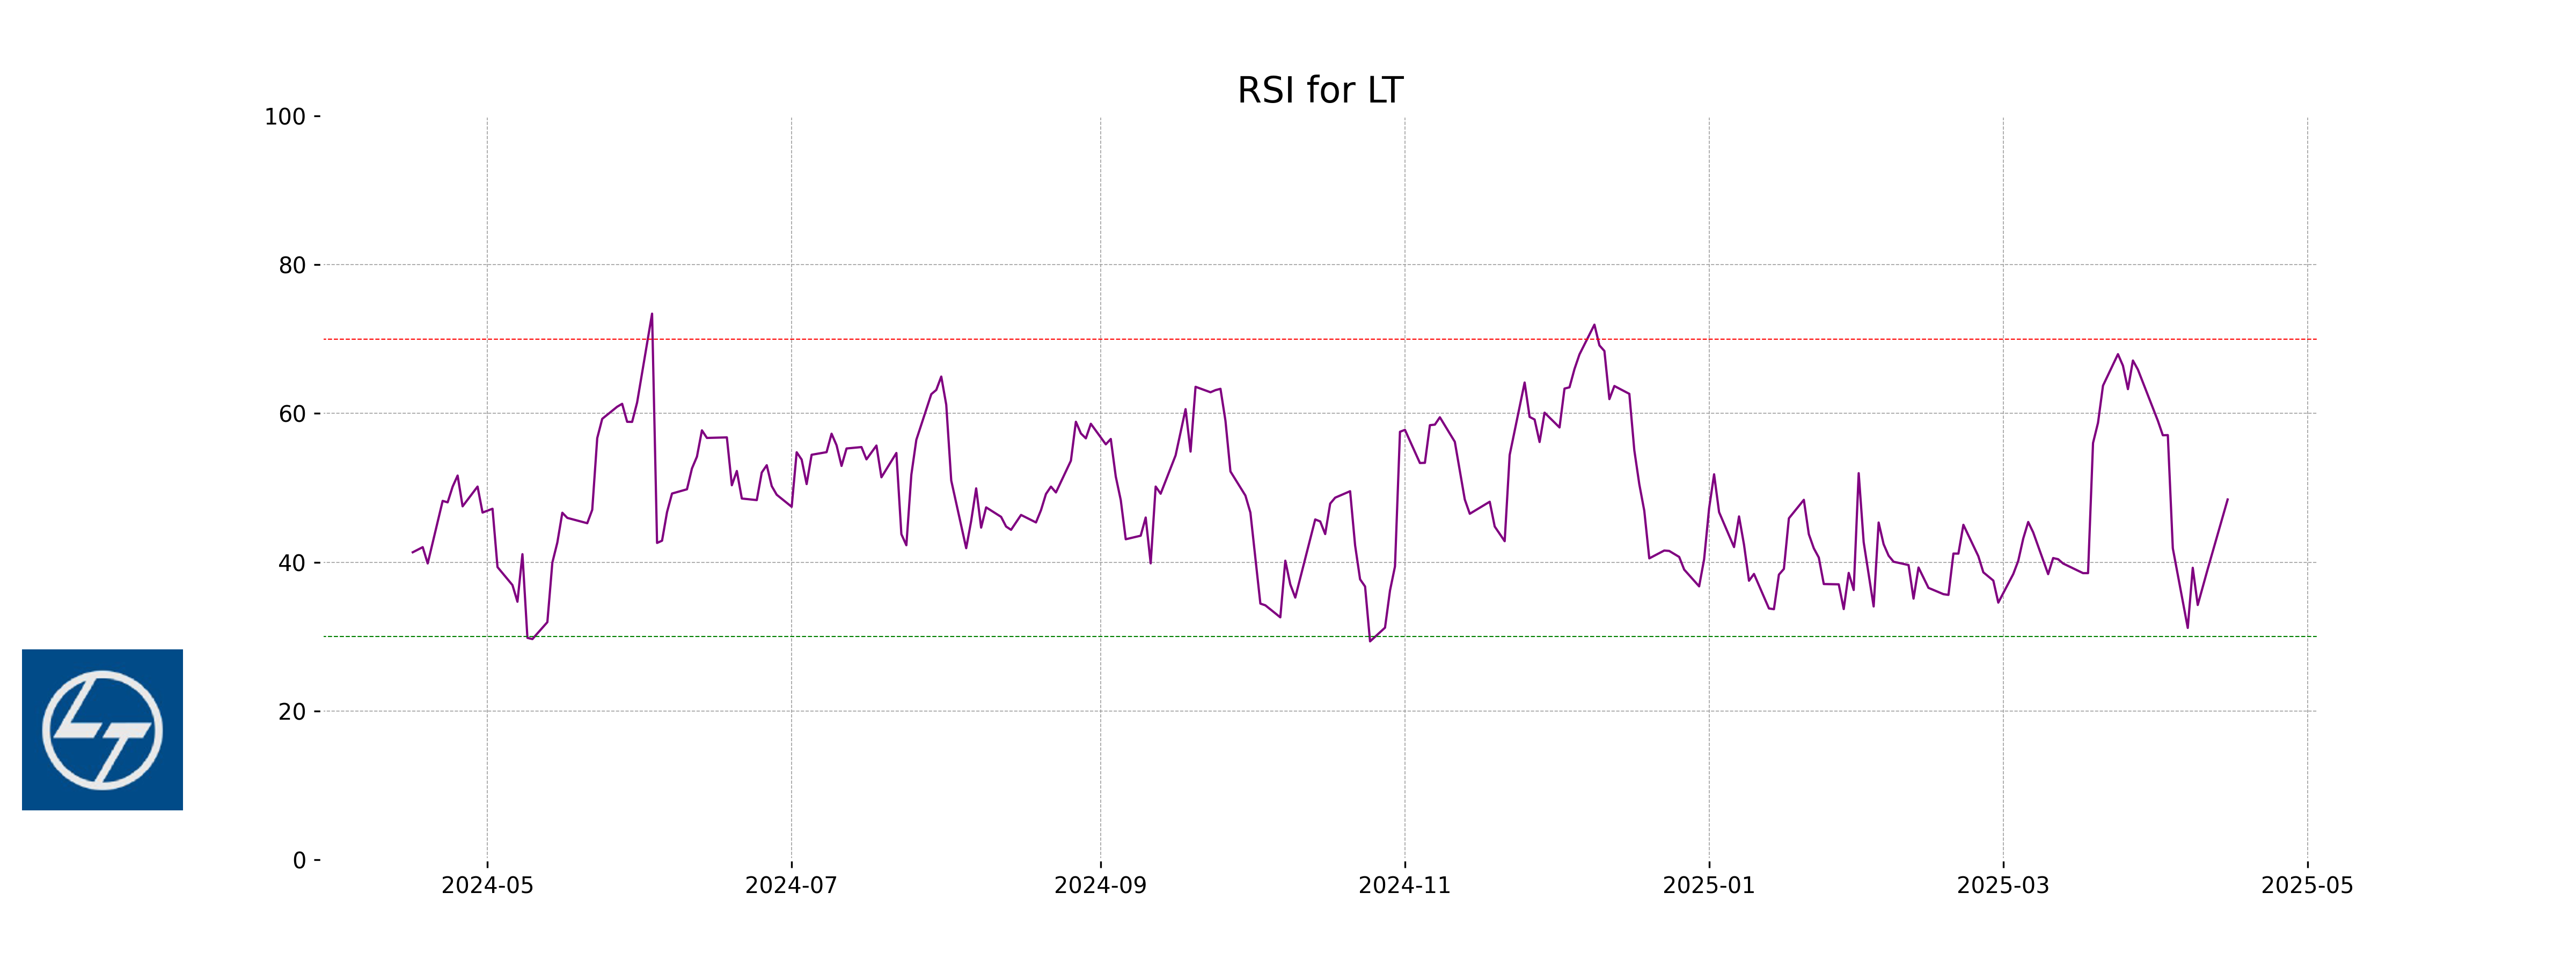
RSI Analysis
The RSI value for Larsen & Toubro is 48.44, indicating that the stock is neither overbought nor oversold and is in a neutral zone. This suggests that the price action may find some balance before making a decisive move in either direction.
Analysis for Shriram Finance - April 15, 2025
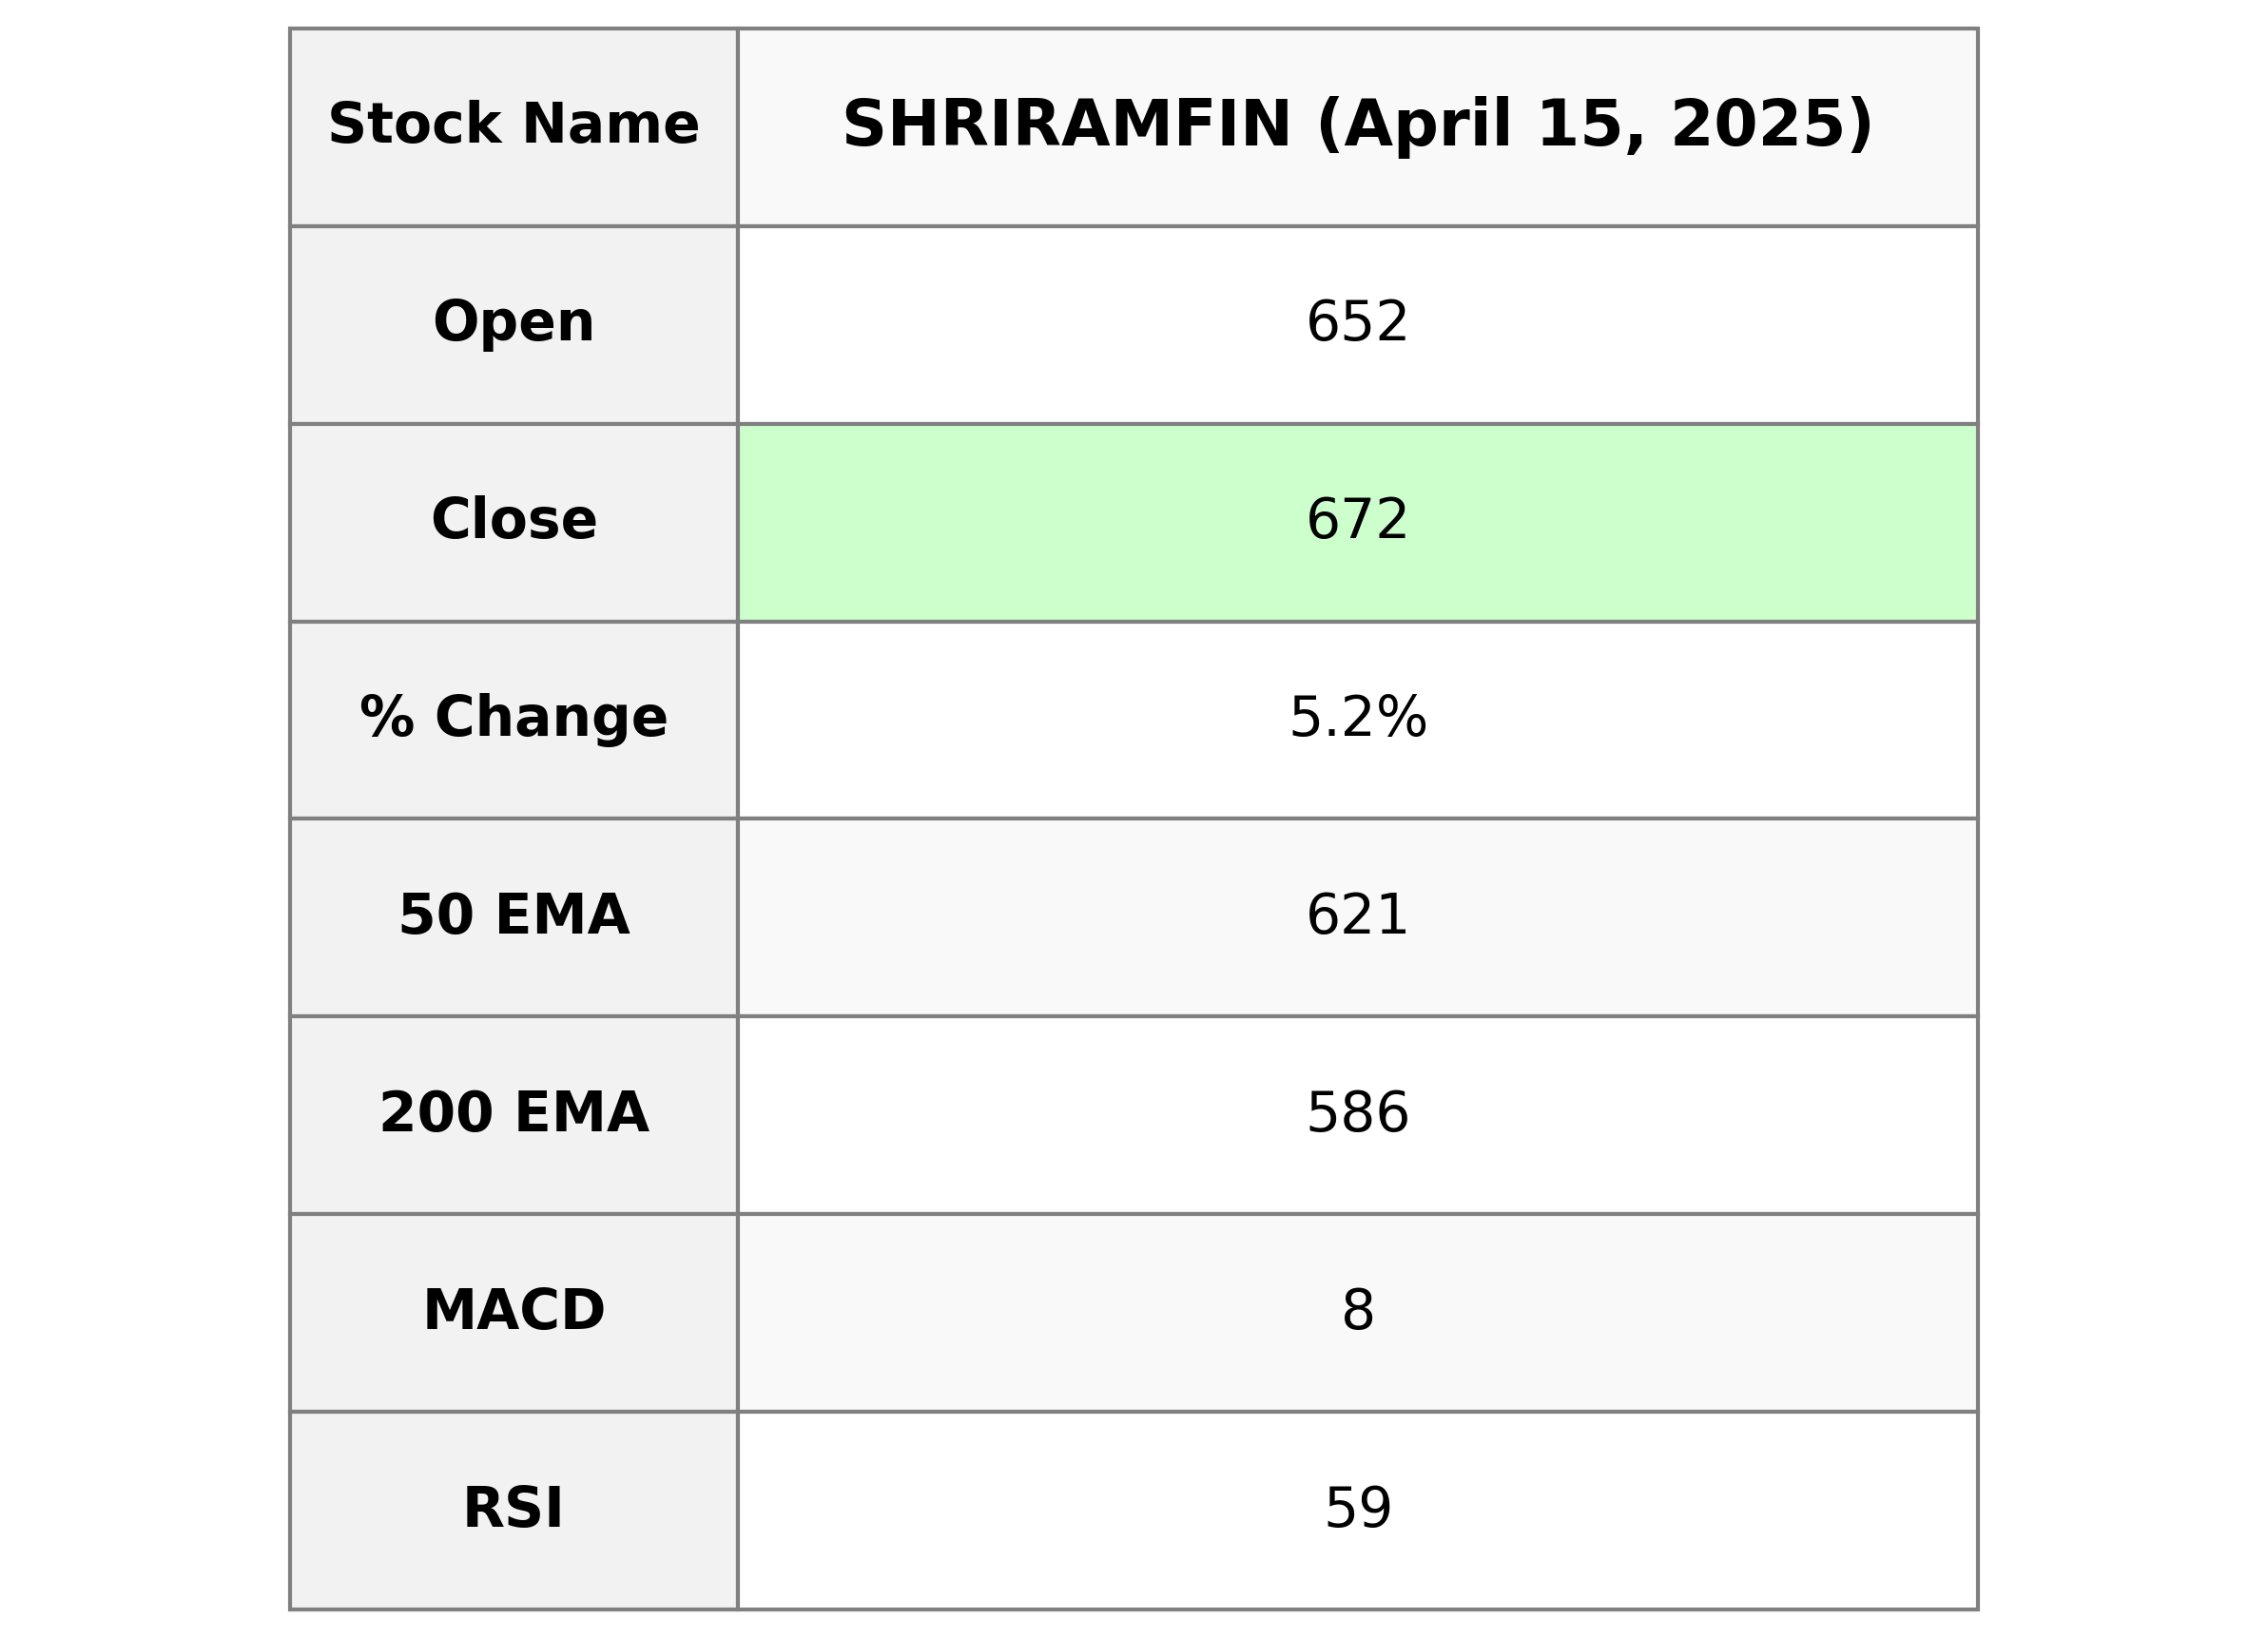
Shriram Finance demonstrated a notable performance with a 5.20% increase in its stock price, closing at 672.0 compared to the previous close of 638.80. The company operates within the Financial Services sector, specifically in Credit Services in India, and currently holds a market capitalization of approximately 1,263.6 billion INR.
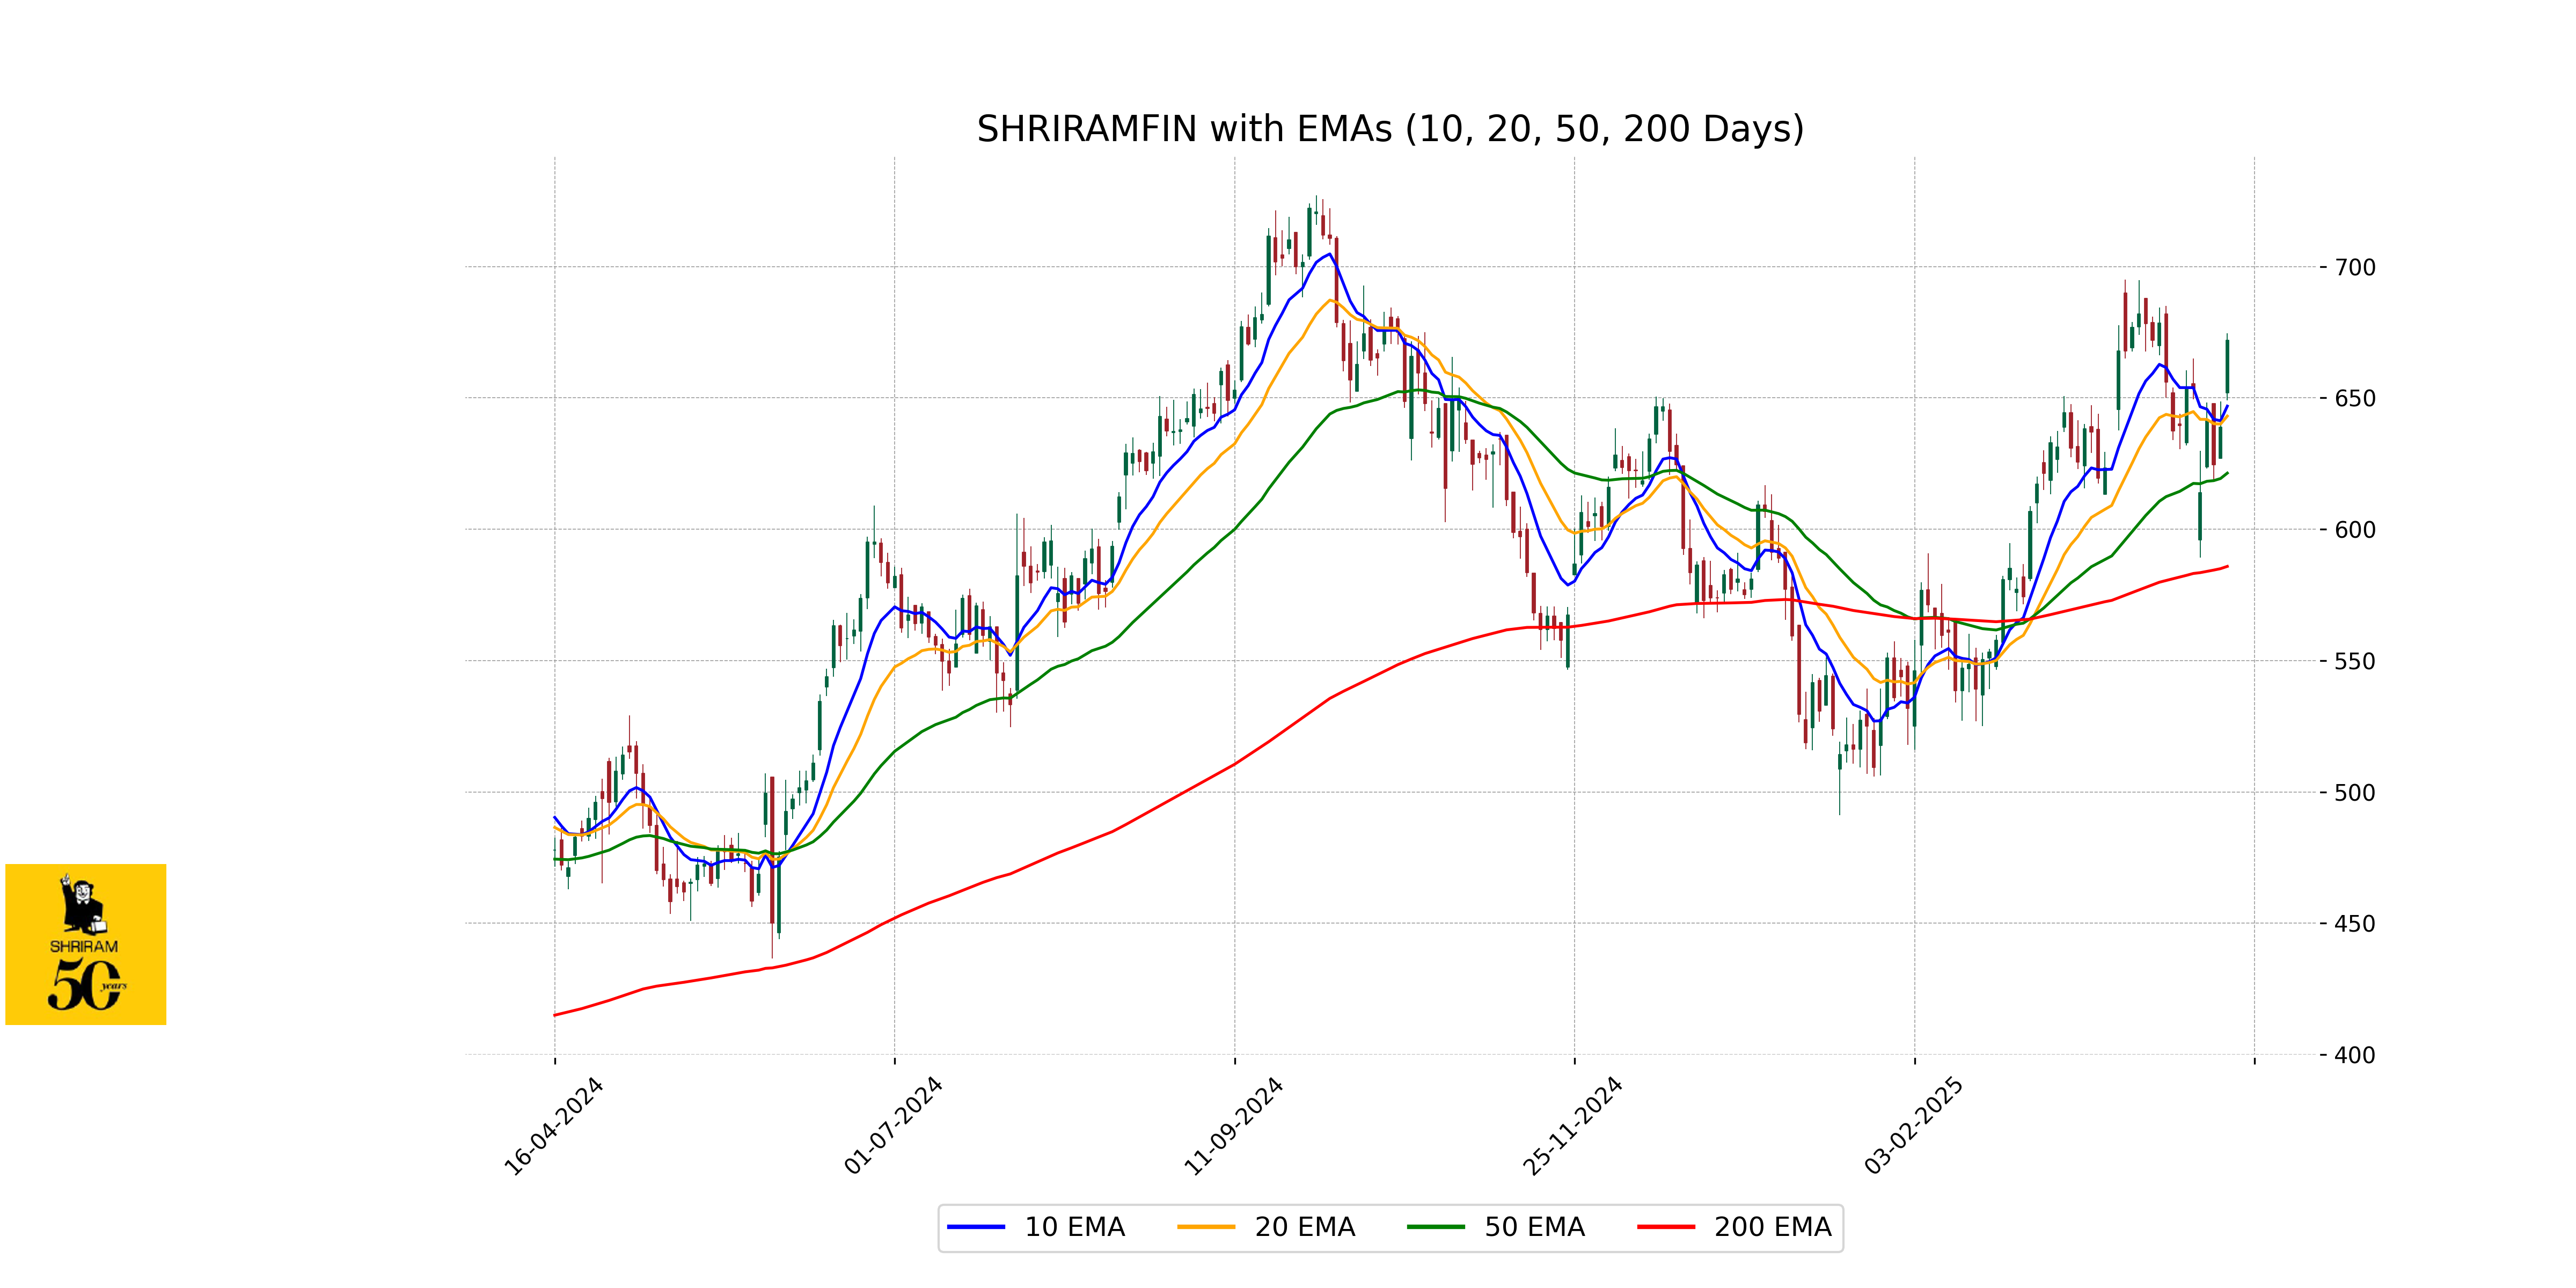
Relationship with Key Moving Averages
Shriram Finance currently trades above its 50-day EMA of 621.38 and 200-day EMA of 585.87, indicating a bullish trend. The stock also closed above its 10-day EMA of 646.88 and 20-day EMA of 643.09, further supporting a positive short-term momentum.
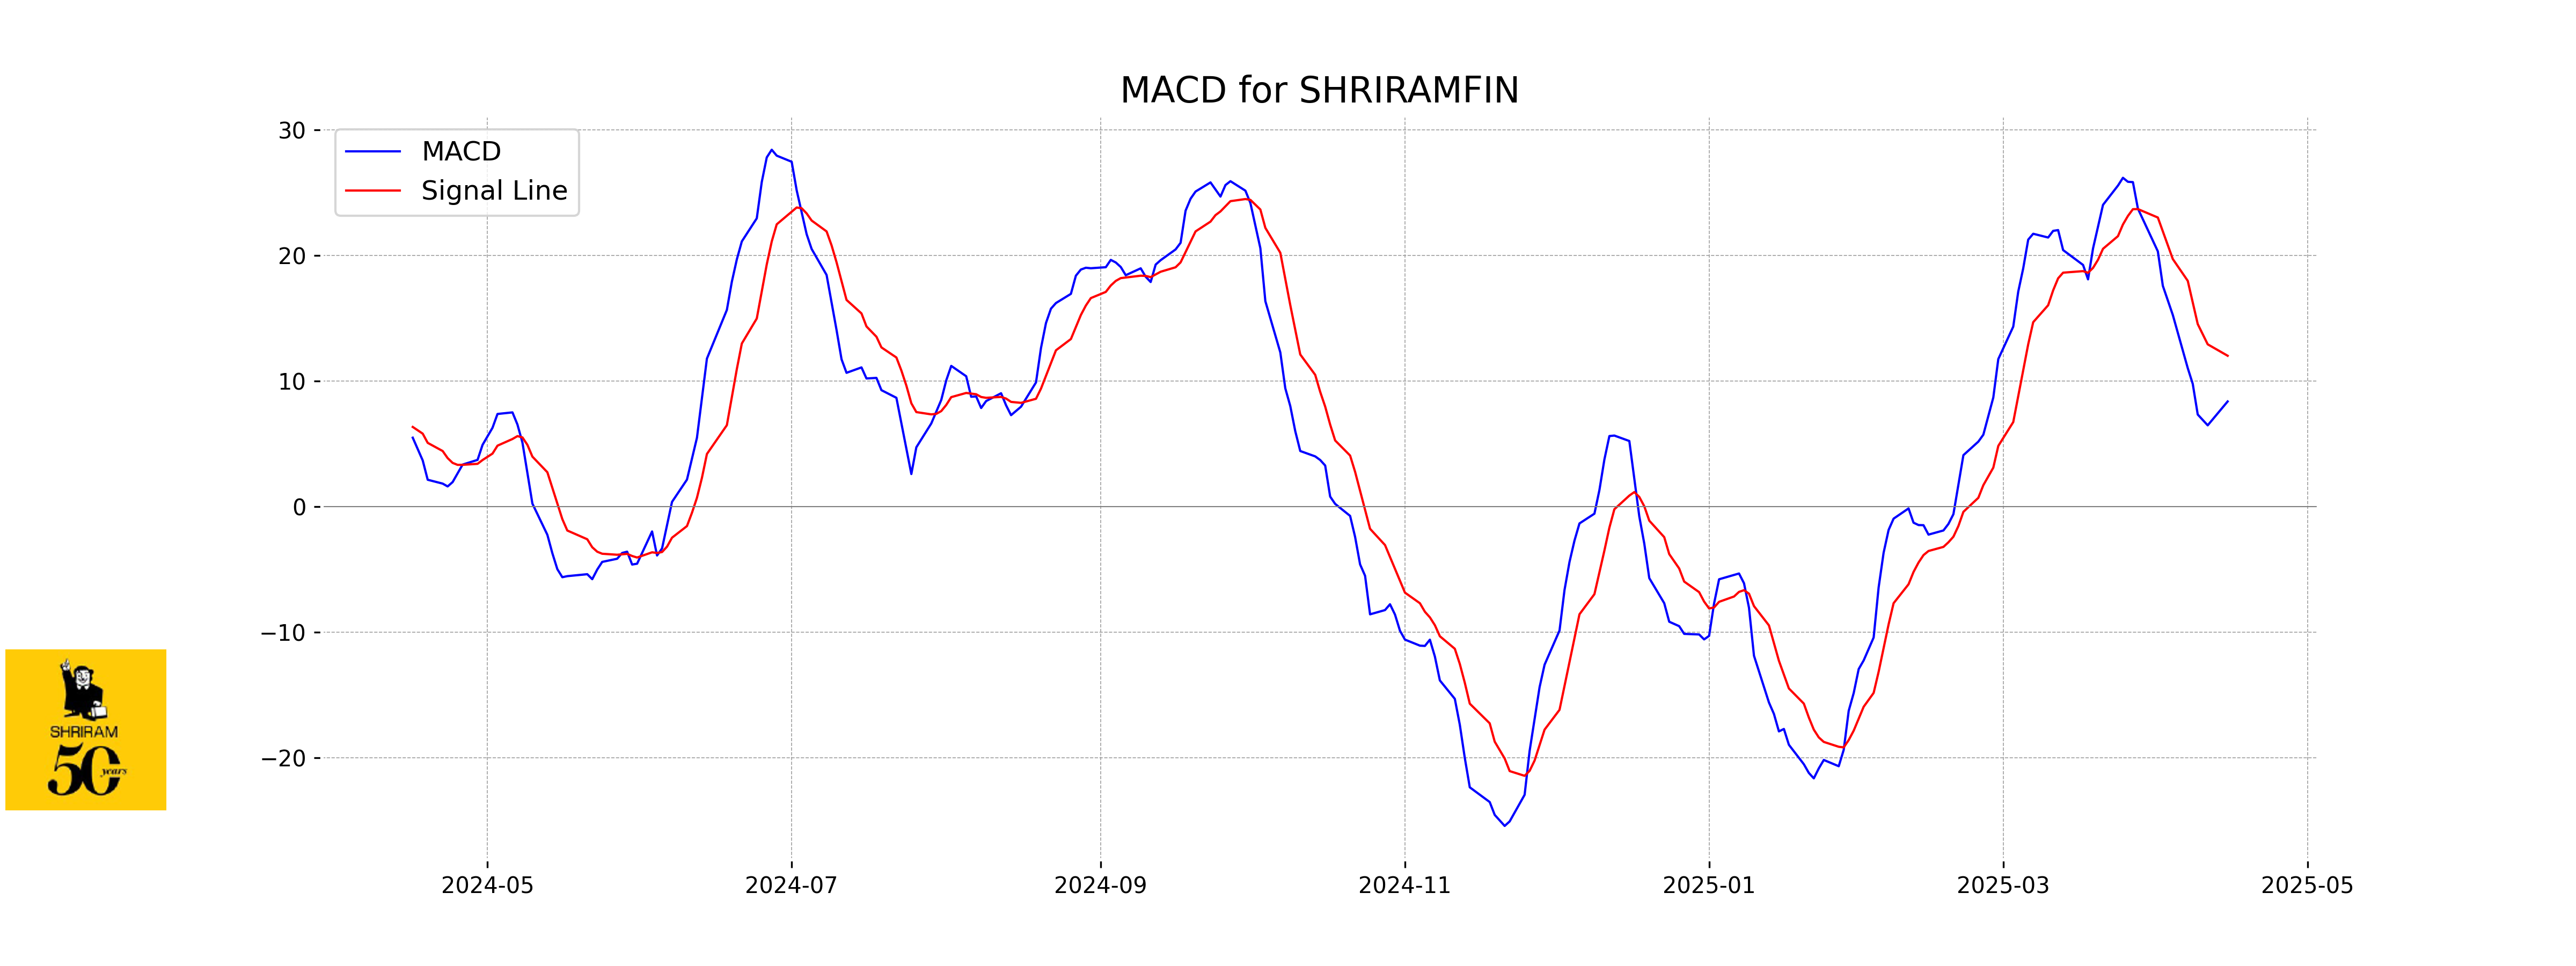
Moving Averages Trend (MACD)
The MACD for Shriram Finance is 8.38, which is below the MACD Signal line of 12.02. This suggests a potential bearish trend as the momentum appears to be decreasing. However, further confirmation is needed before making any trading decisions.
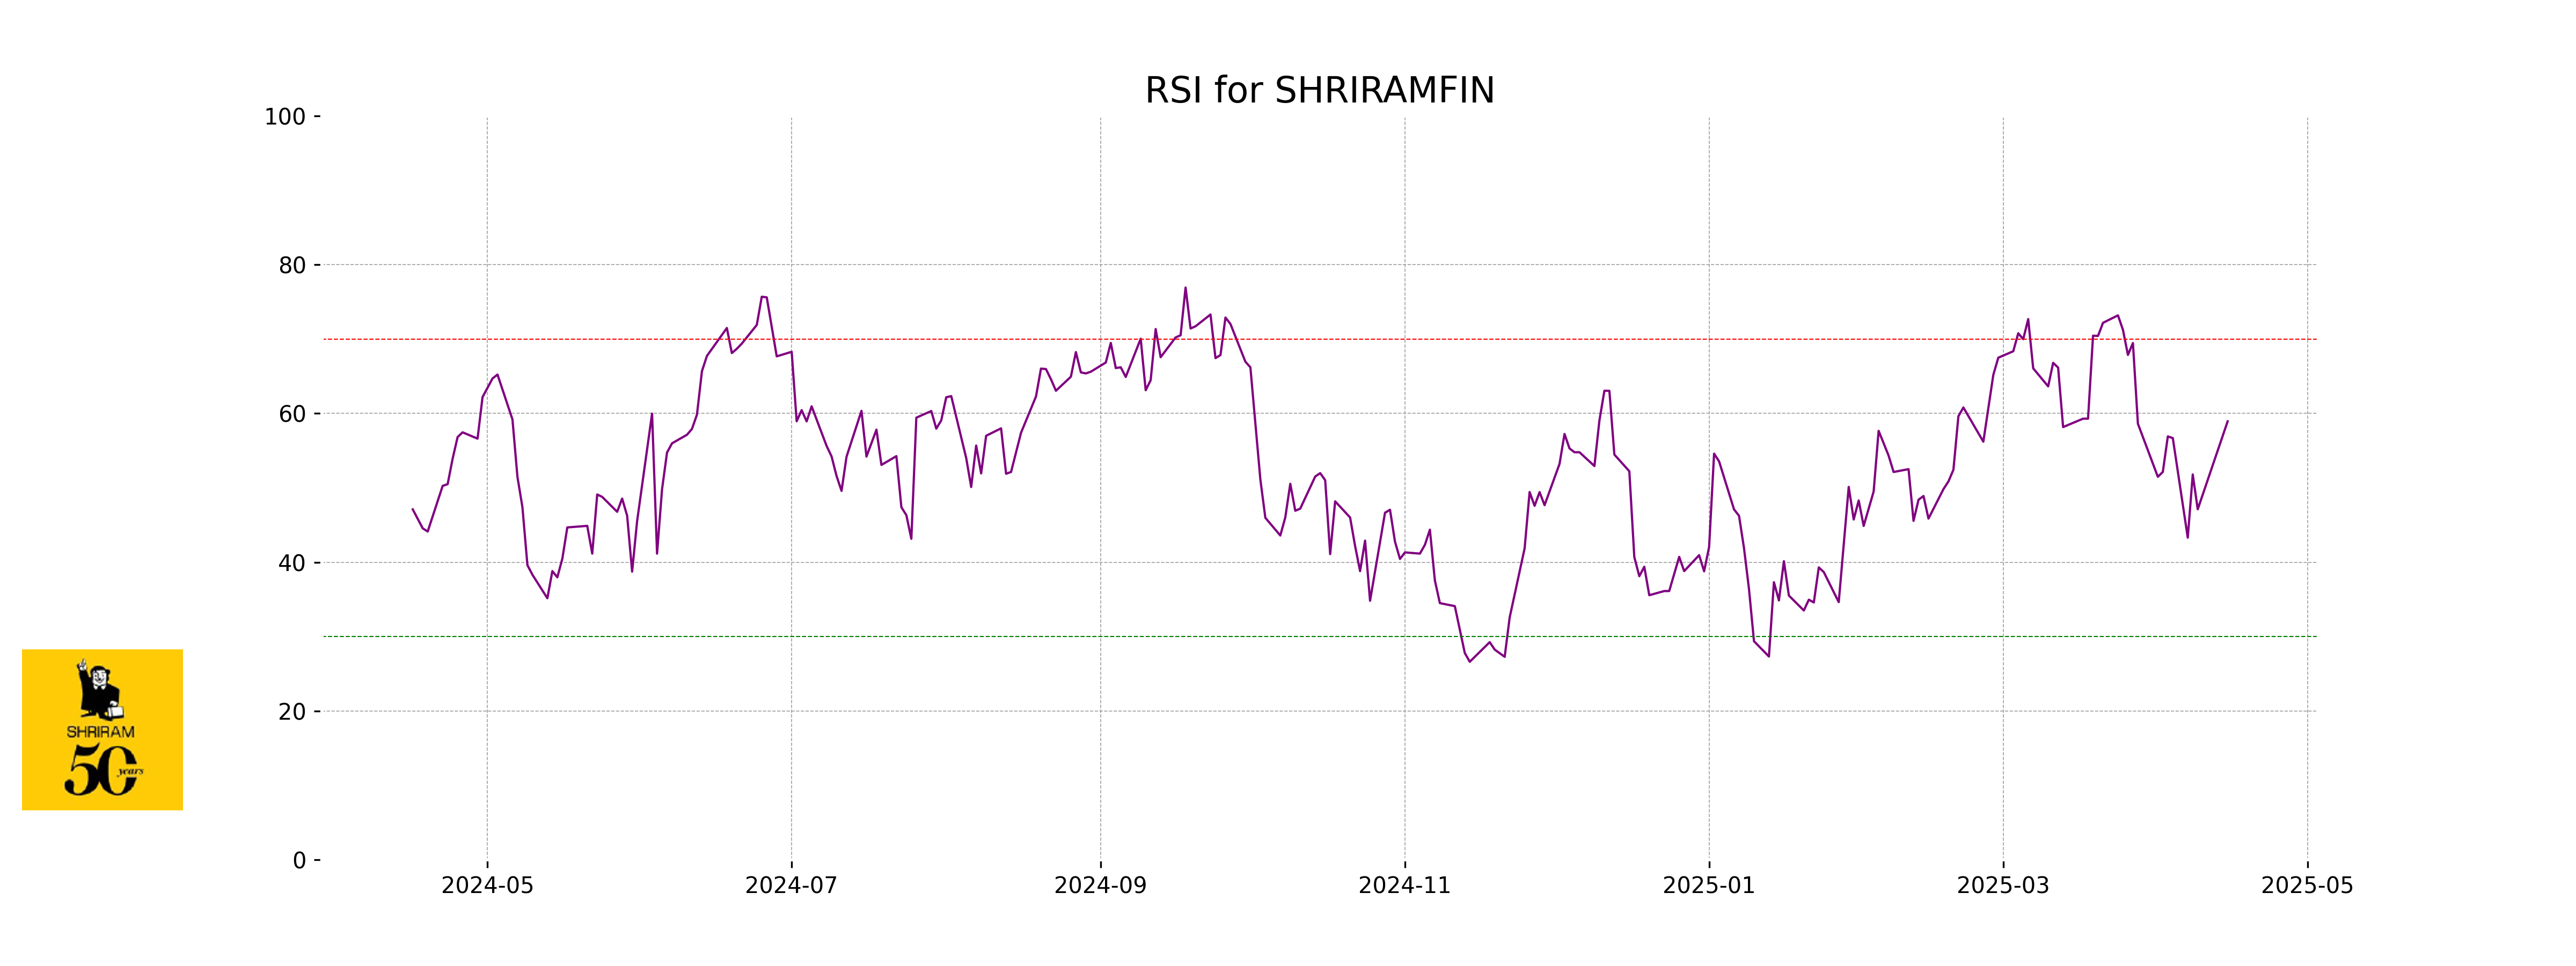
RSI Analysis
The Relative Strength Index (RSI) for Shriram Finance is 58.94, indicating that the stock is in a neutral zone, neither overbought nor oversold. RSI values typically below 30 may suggest an oversold condition, while values above 70 can indicate an overbought condition.
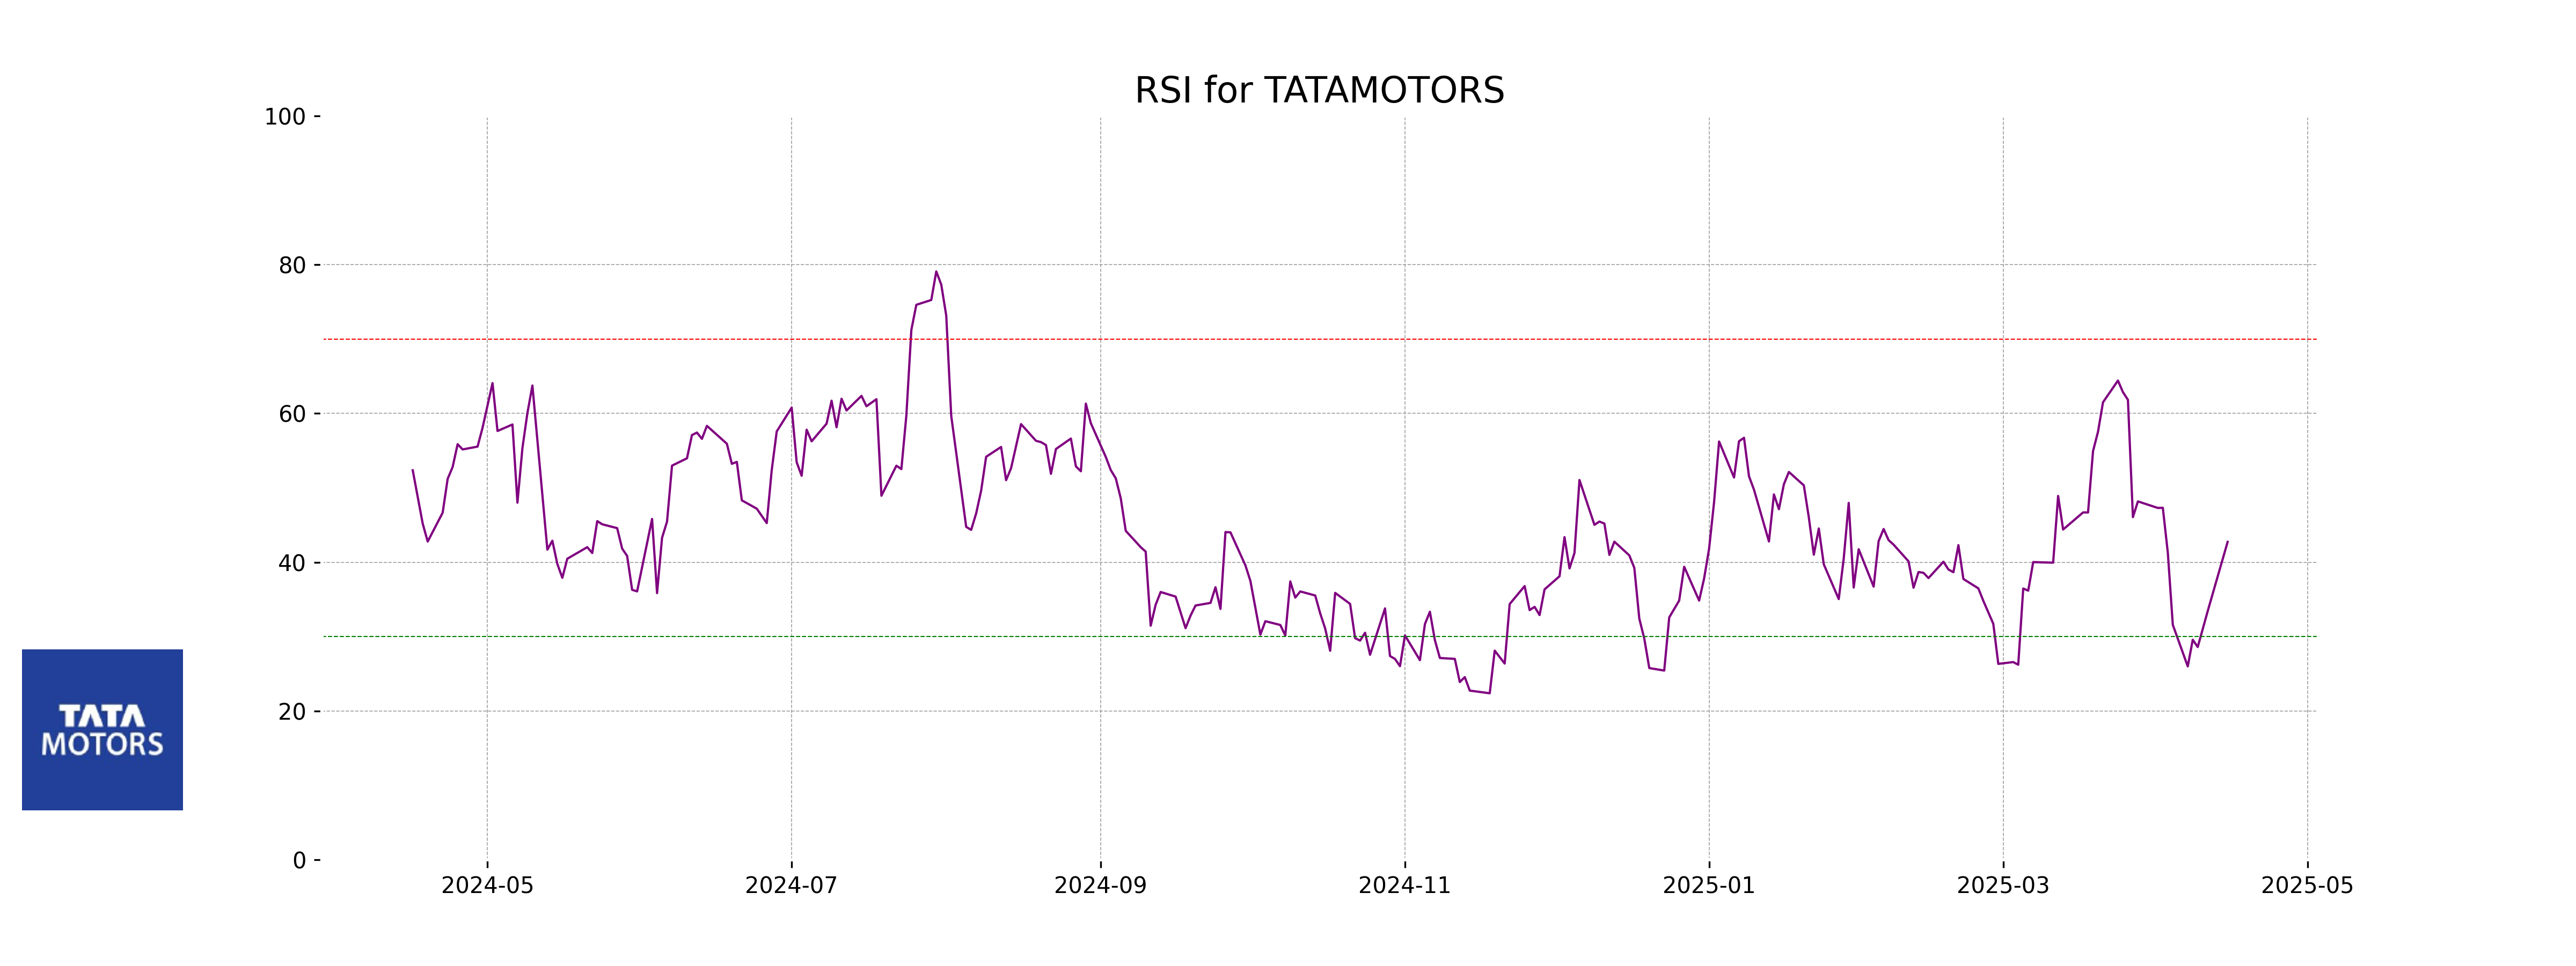
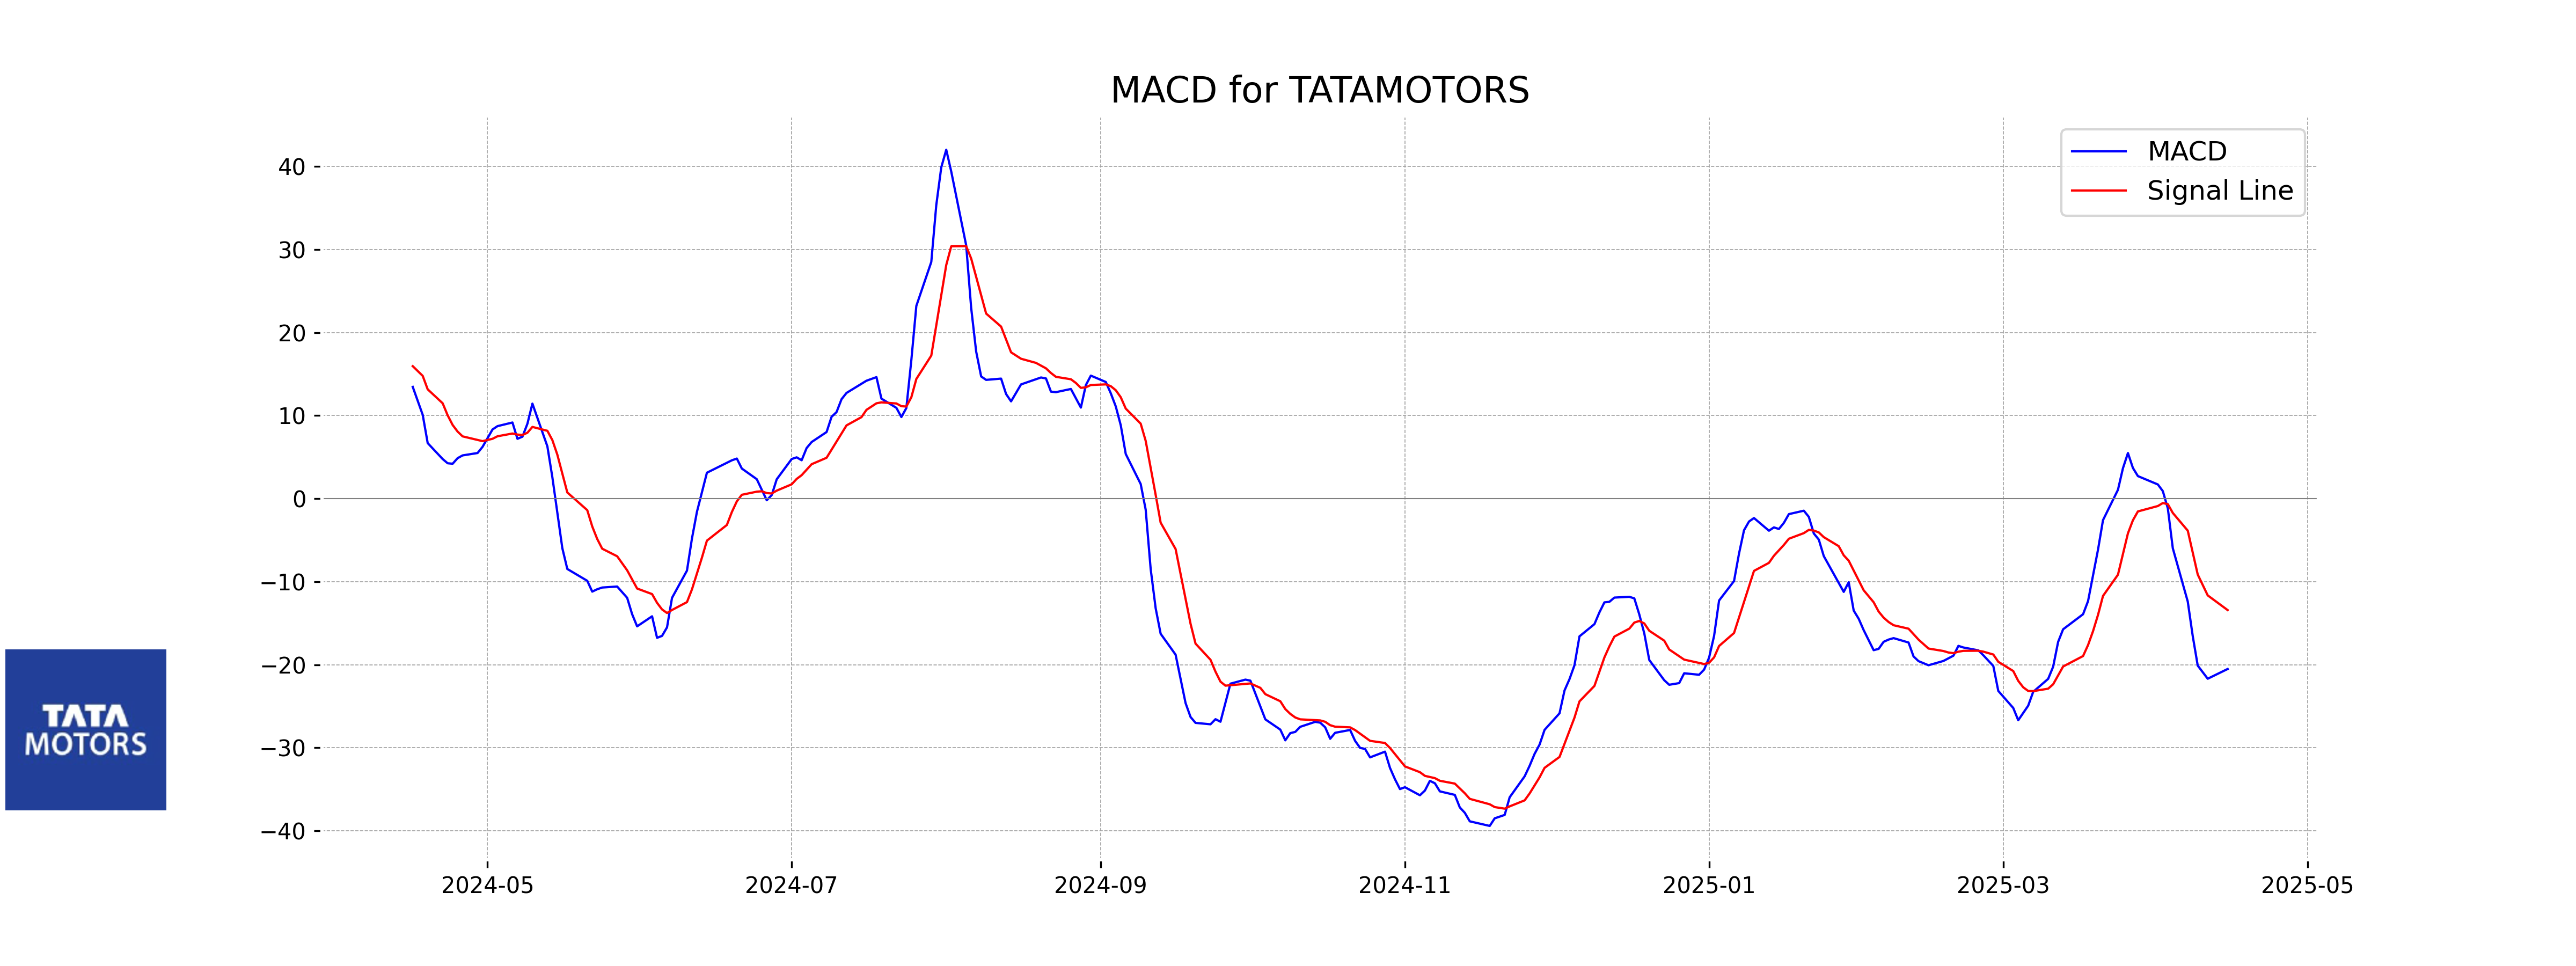
Analysis for Tata Motors - April 15, 2025
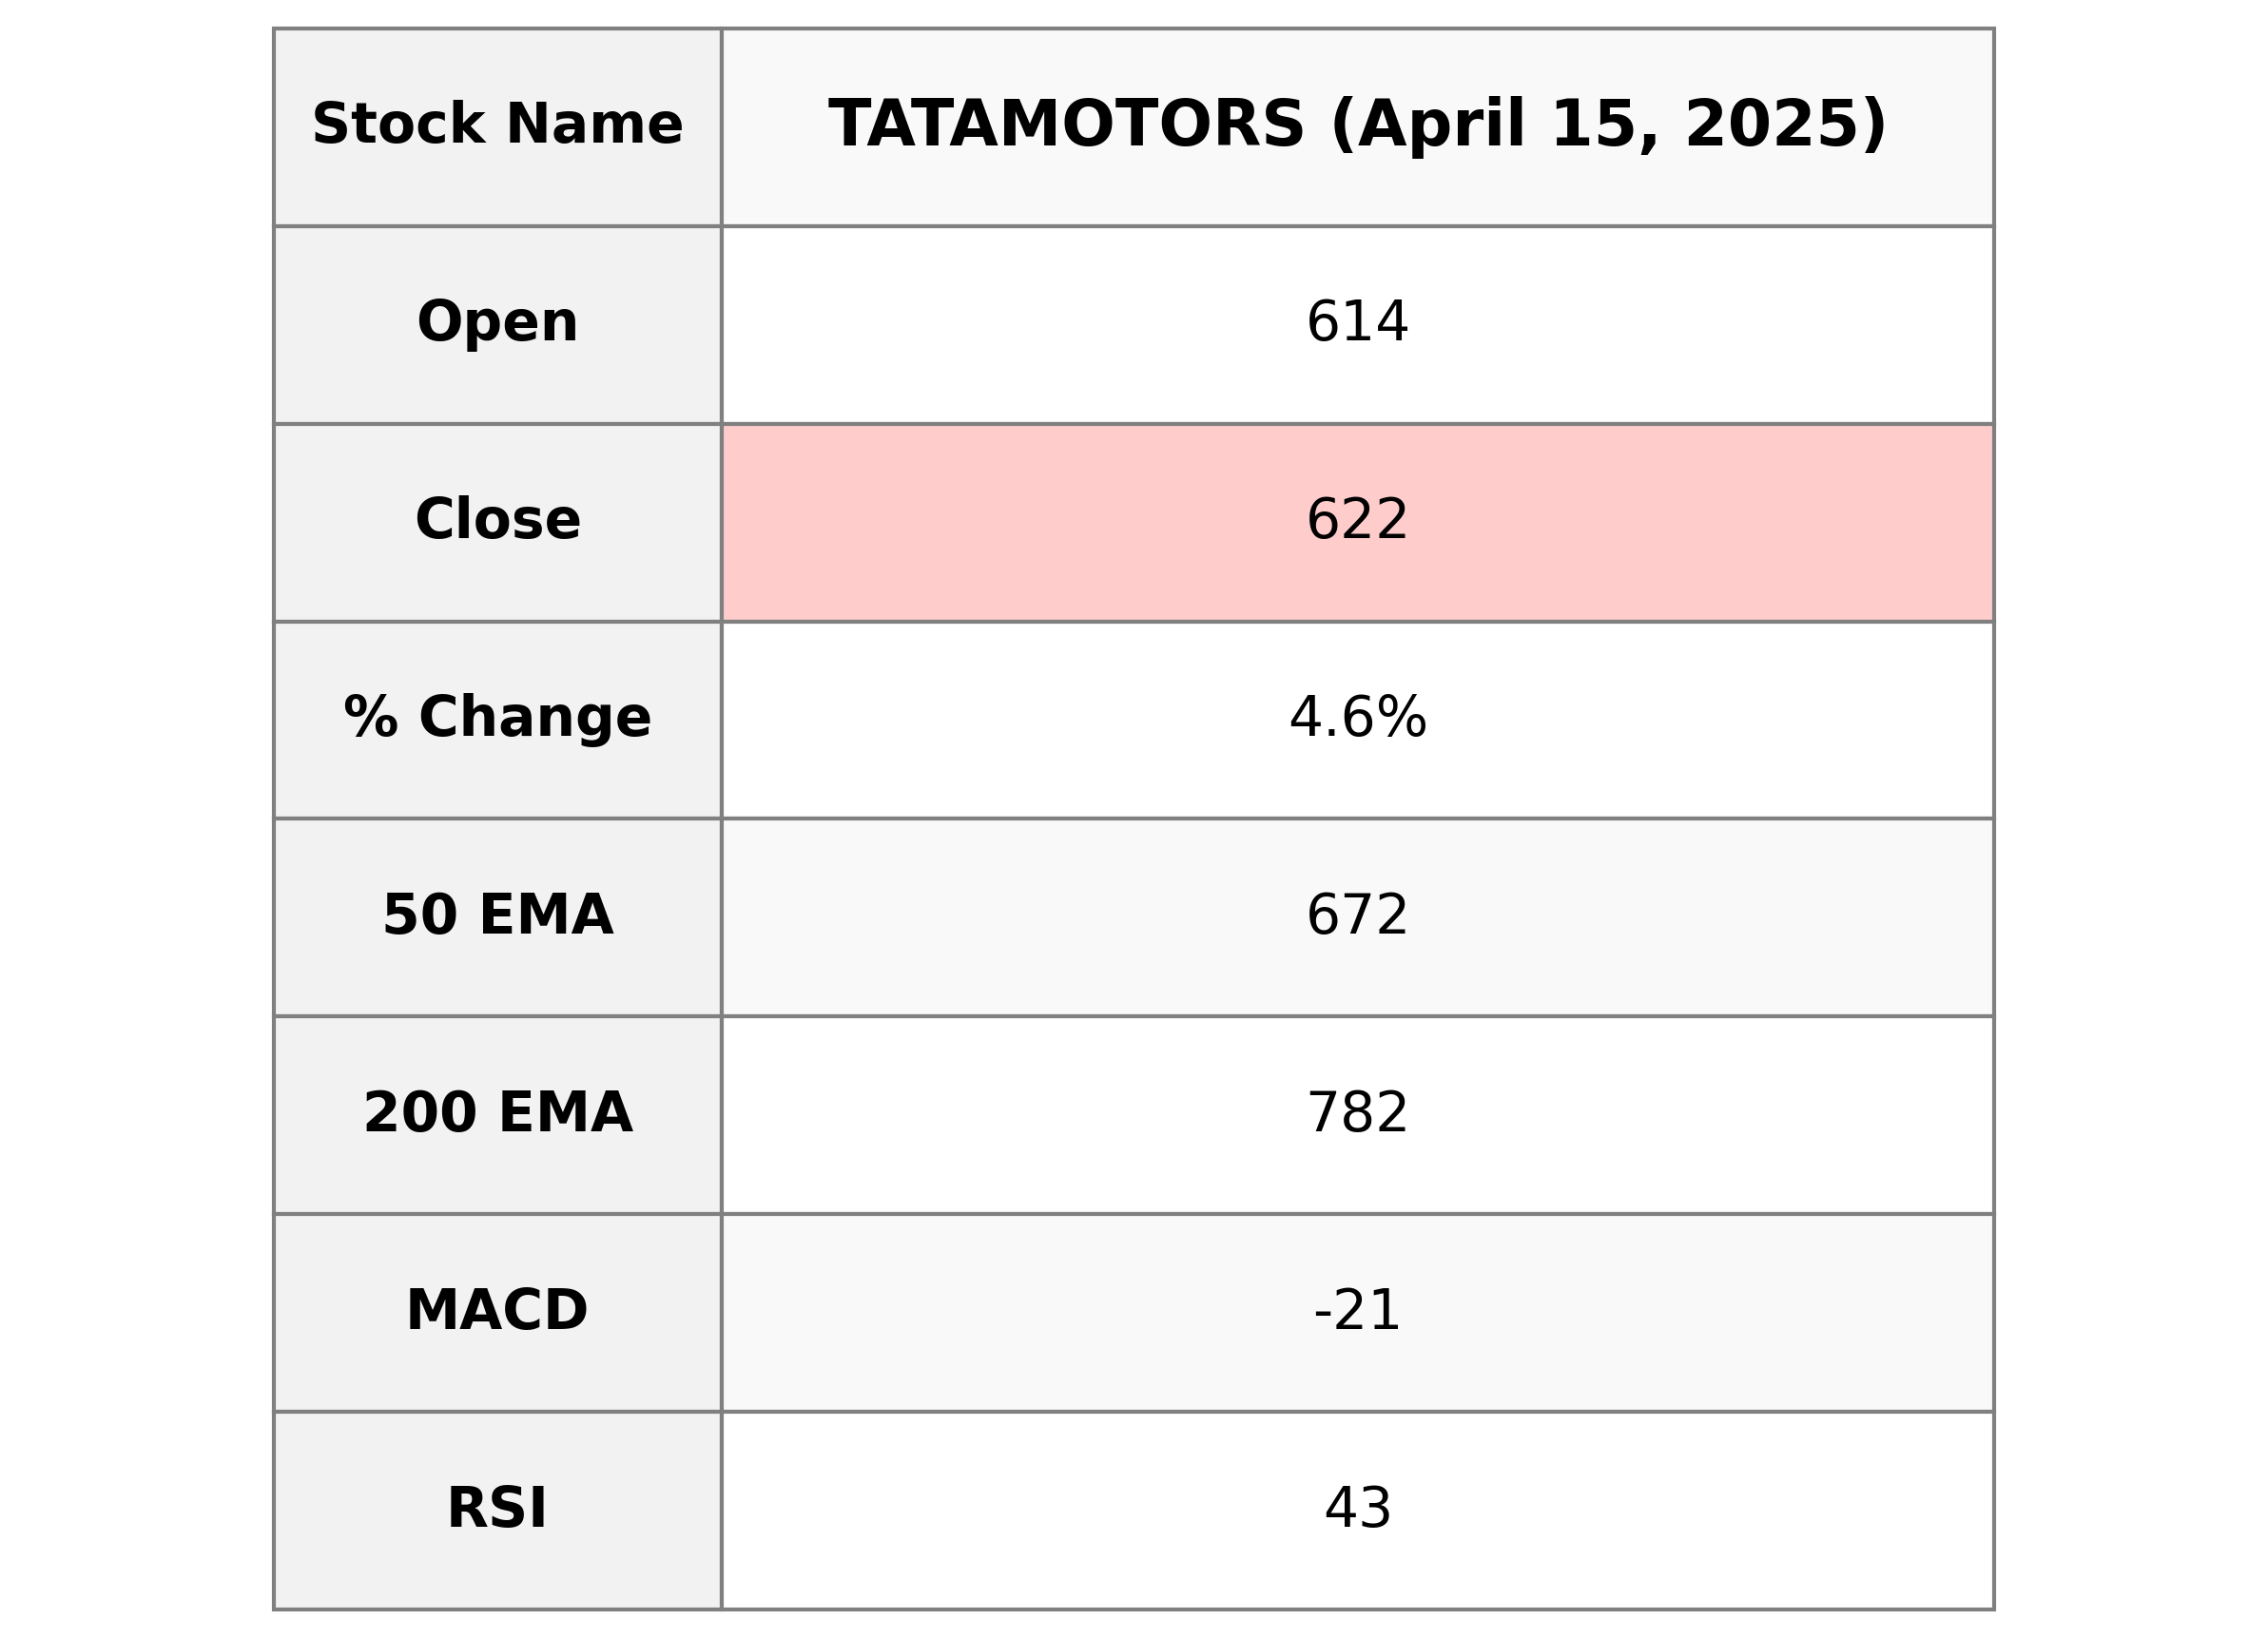
Tata Motors showcased a strong performance with a closing price of 622.20, indicating a 4.56% increase from its previous close. The stock's RSI at 42.74 suggests a neutral trend, while the MACD indicator reflects a bearish sentiment with a value of -20.51. Despite trading below its 50 and 200 EMA, Tata Motors maintains a solid position within the Auto Manufacturers industry in India.
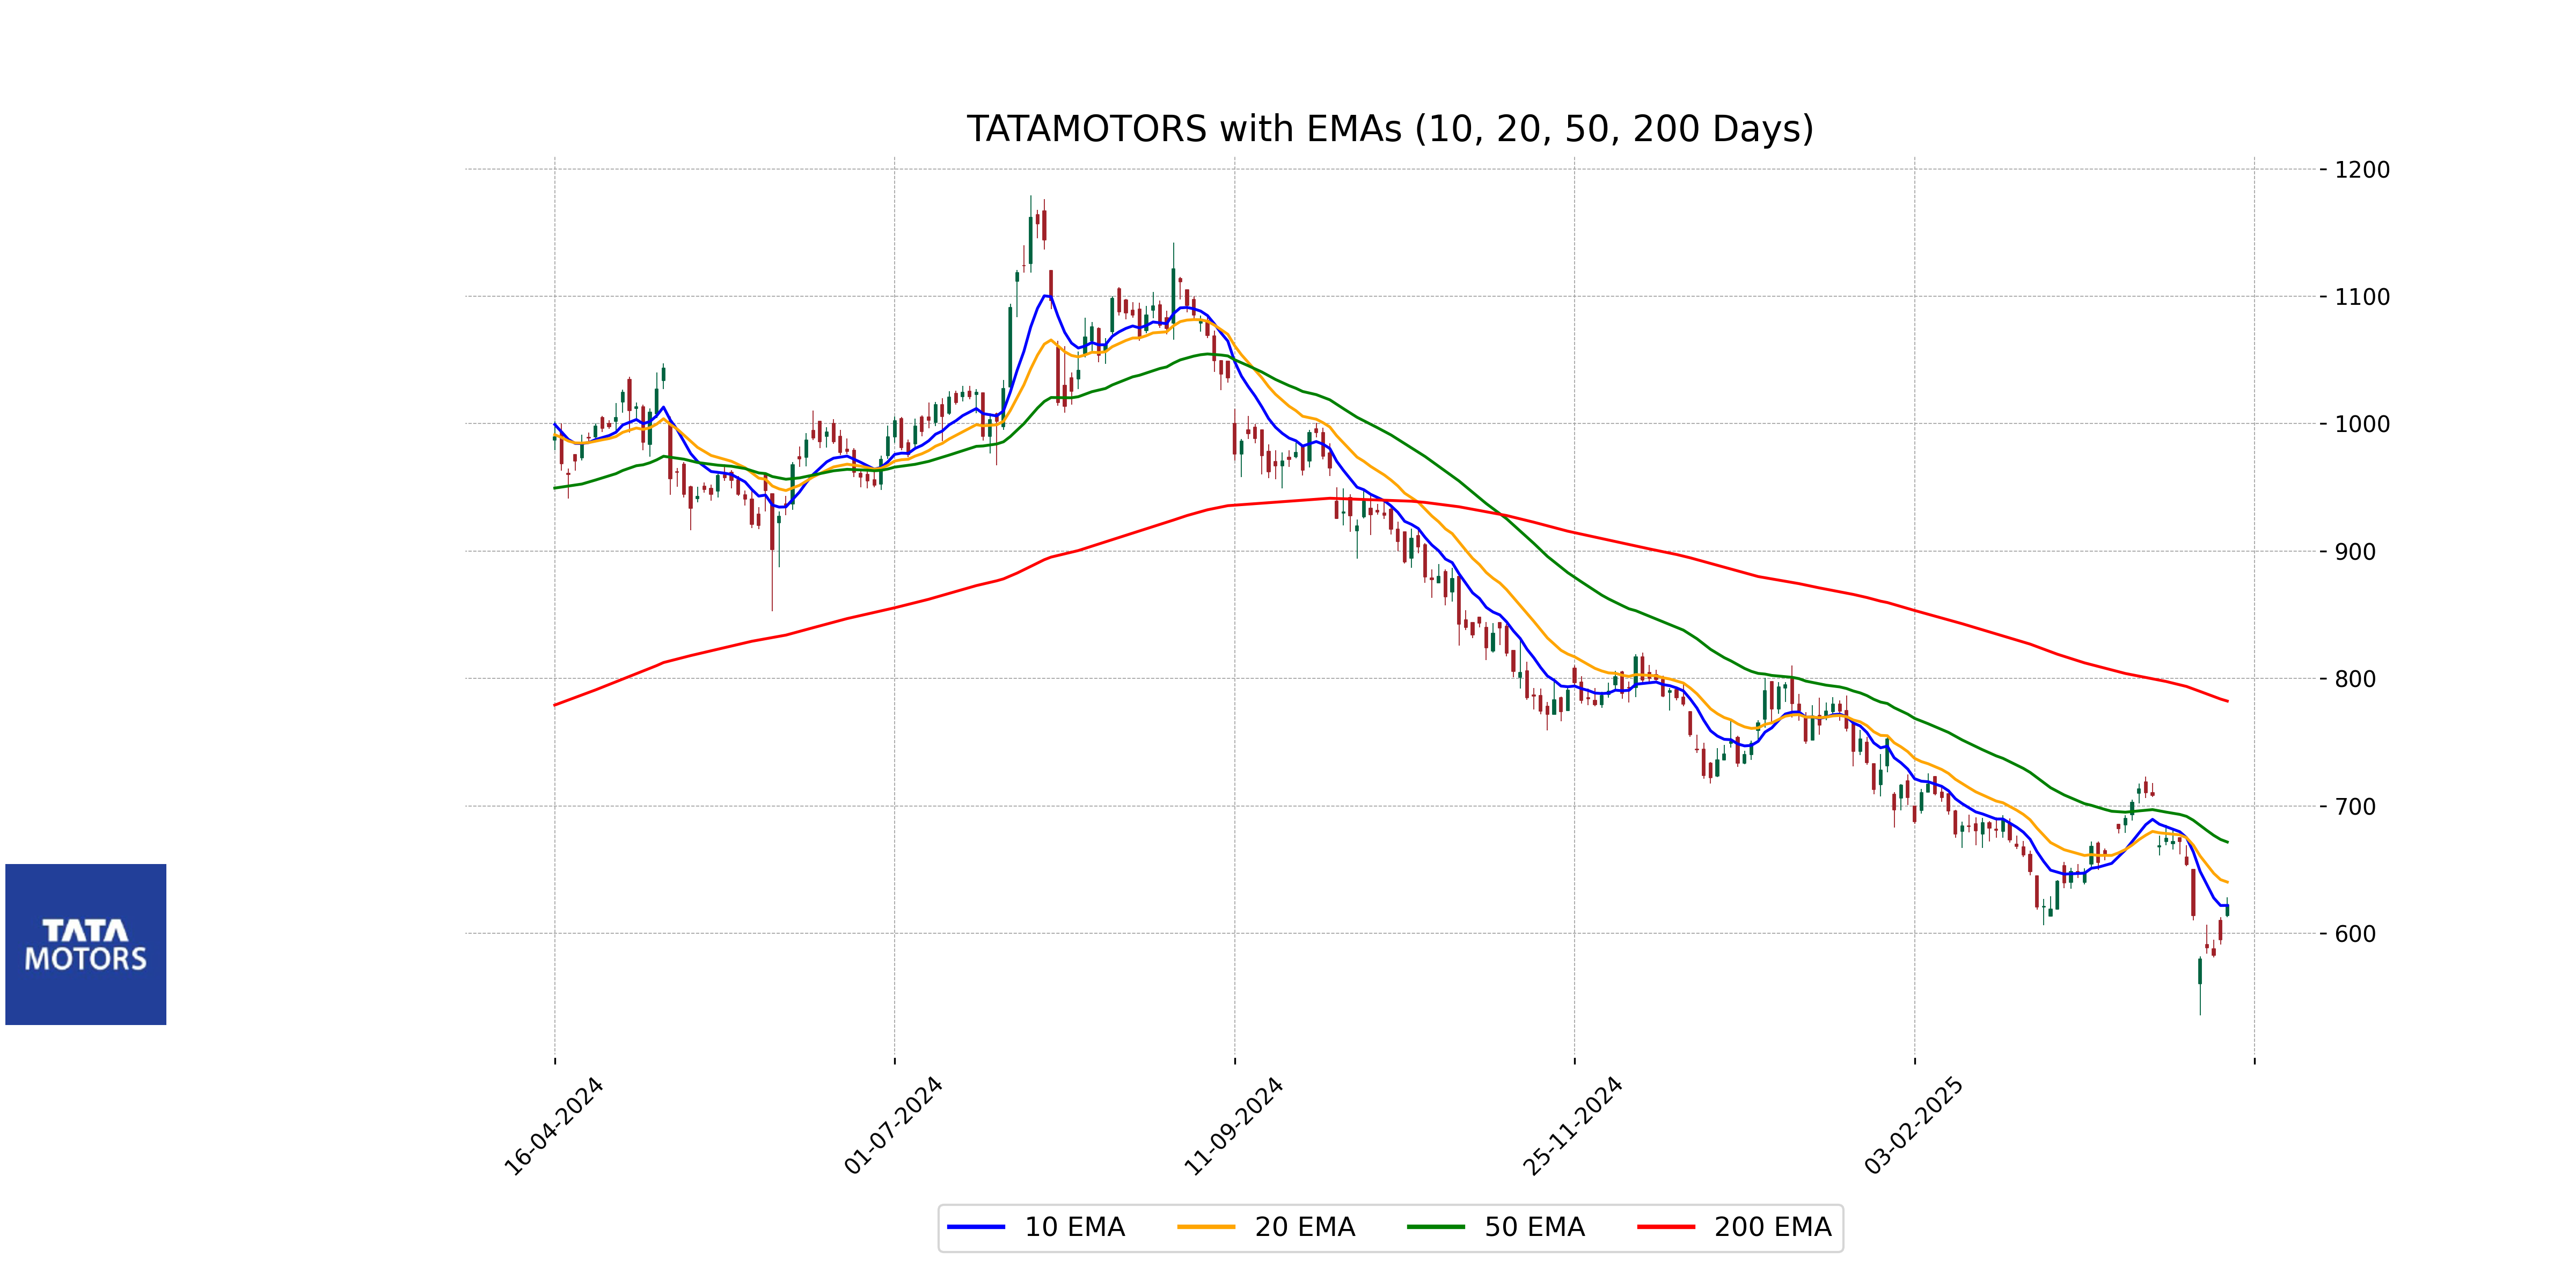
Relationship with Key Moving Averages
Tata Motors' stock is trading below both the 50-day EMA (671.65) and the 200-day EMA (782.26), indicating potential bearish sentiment in the longer-term trend. However, it is slightly above the 10-day EMA (621.89), which might suggest some short-term bullish momentum.
Moving Averages Trend (MACD)
MACD Analysis for Tata Motors: The MACD value of -20.51 suggests a bearish momentum as it is lower than the Signal line, which stands at -13.42. This indicates that the stock might be on a downward trend, signaling investors to exercise caution with long positions.
RSI Analysis
The Relative Strength Index (RSI) for Tata Motors is 42.74, suggesting moderately weak momentum. Typically, an RSI below 30 indicates the stock might be undervalued or oversold, while above 70 suggests overvaluation or overbought conditions. Being at 42.74, Tata Motors does not indicate strong oversold or overbought conditions, hinting at neutral momentum.