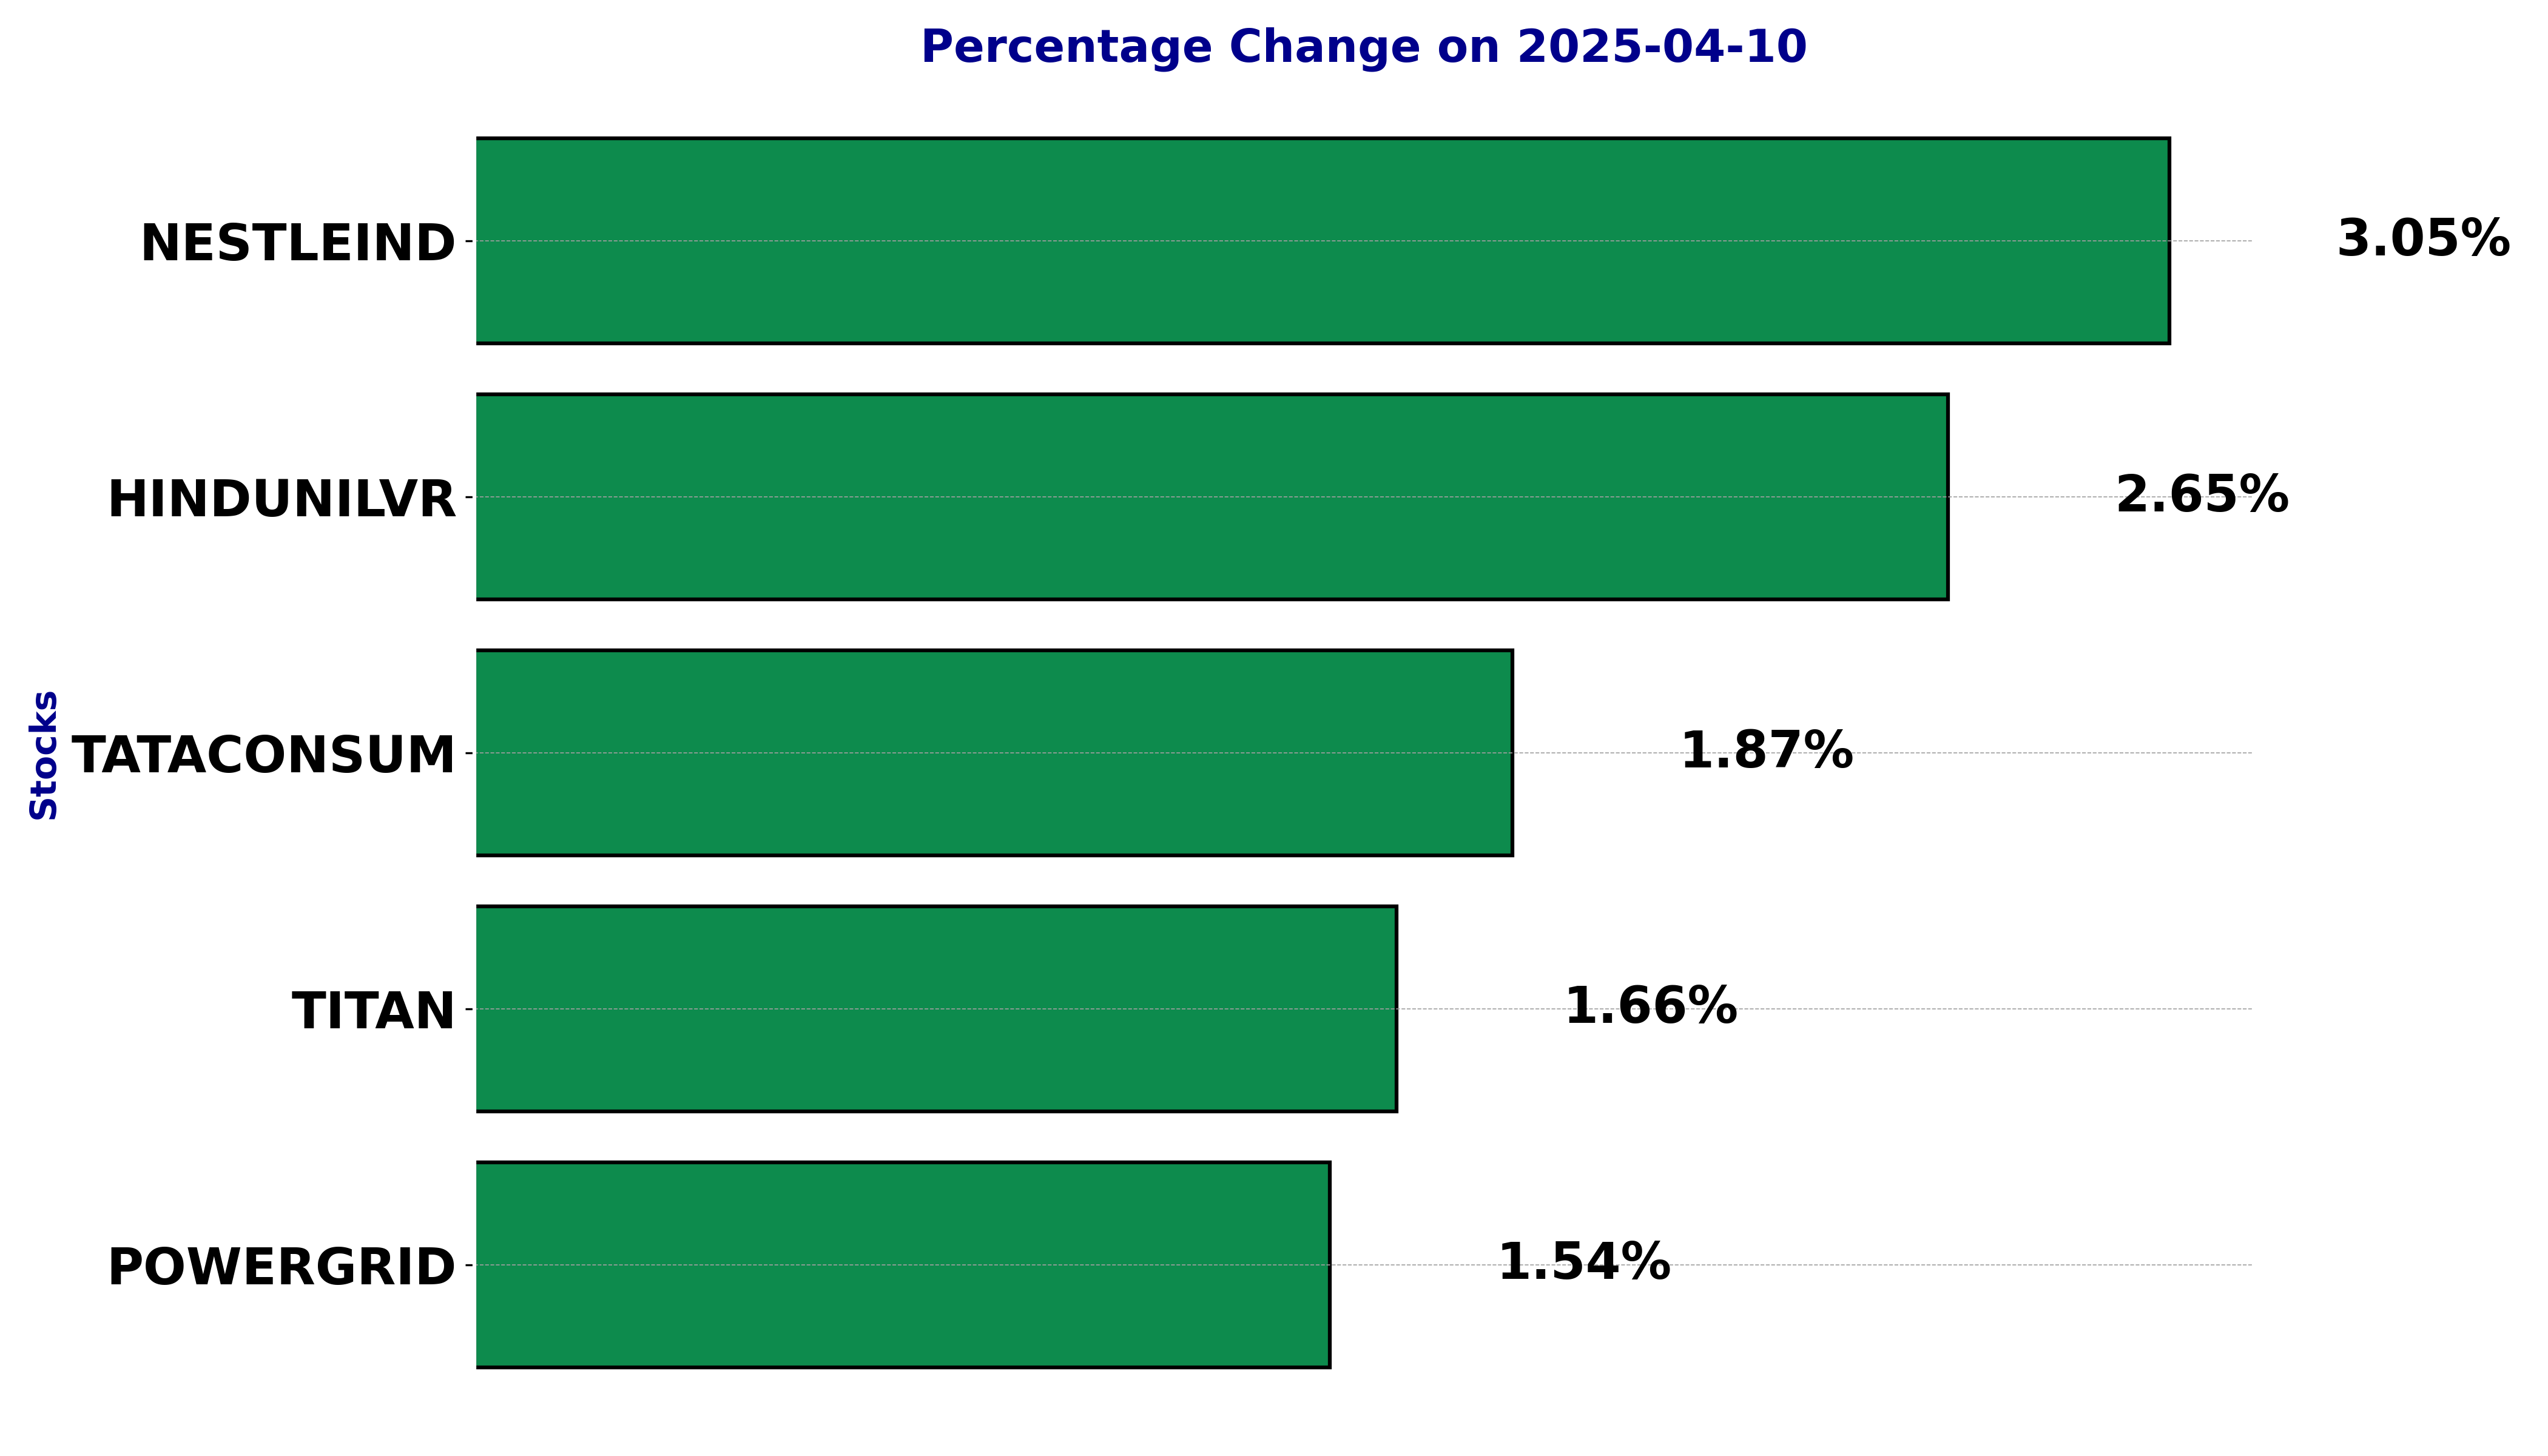
NSE Nifty 50 Top gainers: What are the 5 Biggest Stock gainers Today April 10, 2025
In this article, we will explore the technical indicators of some of the high-performing stocks on the Indian stock market, including HINDUNILVR, NESTLEIND, POWERGRID, TATACONSUM, and TITAN.
By looking at these stocks through the lens of key technical factors, we aim to better understand their price movements, trends, and potential future performance.
Analysis for Hindustan Unilever - April 10, 2025

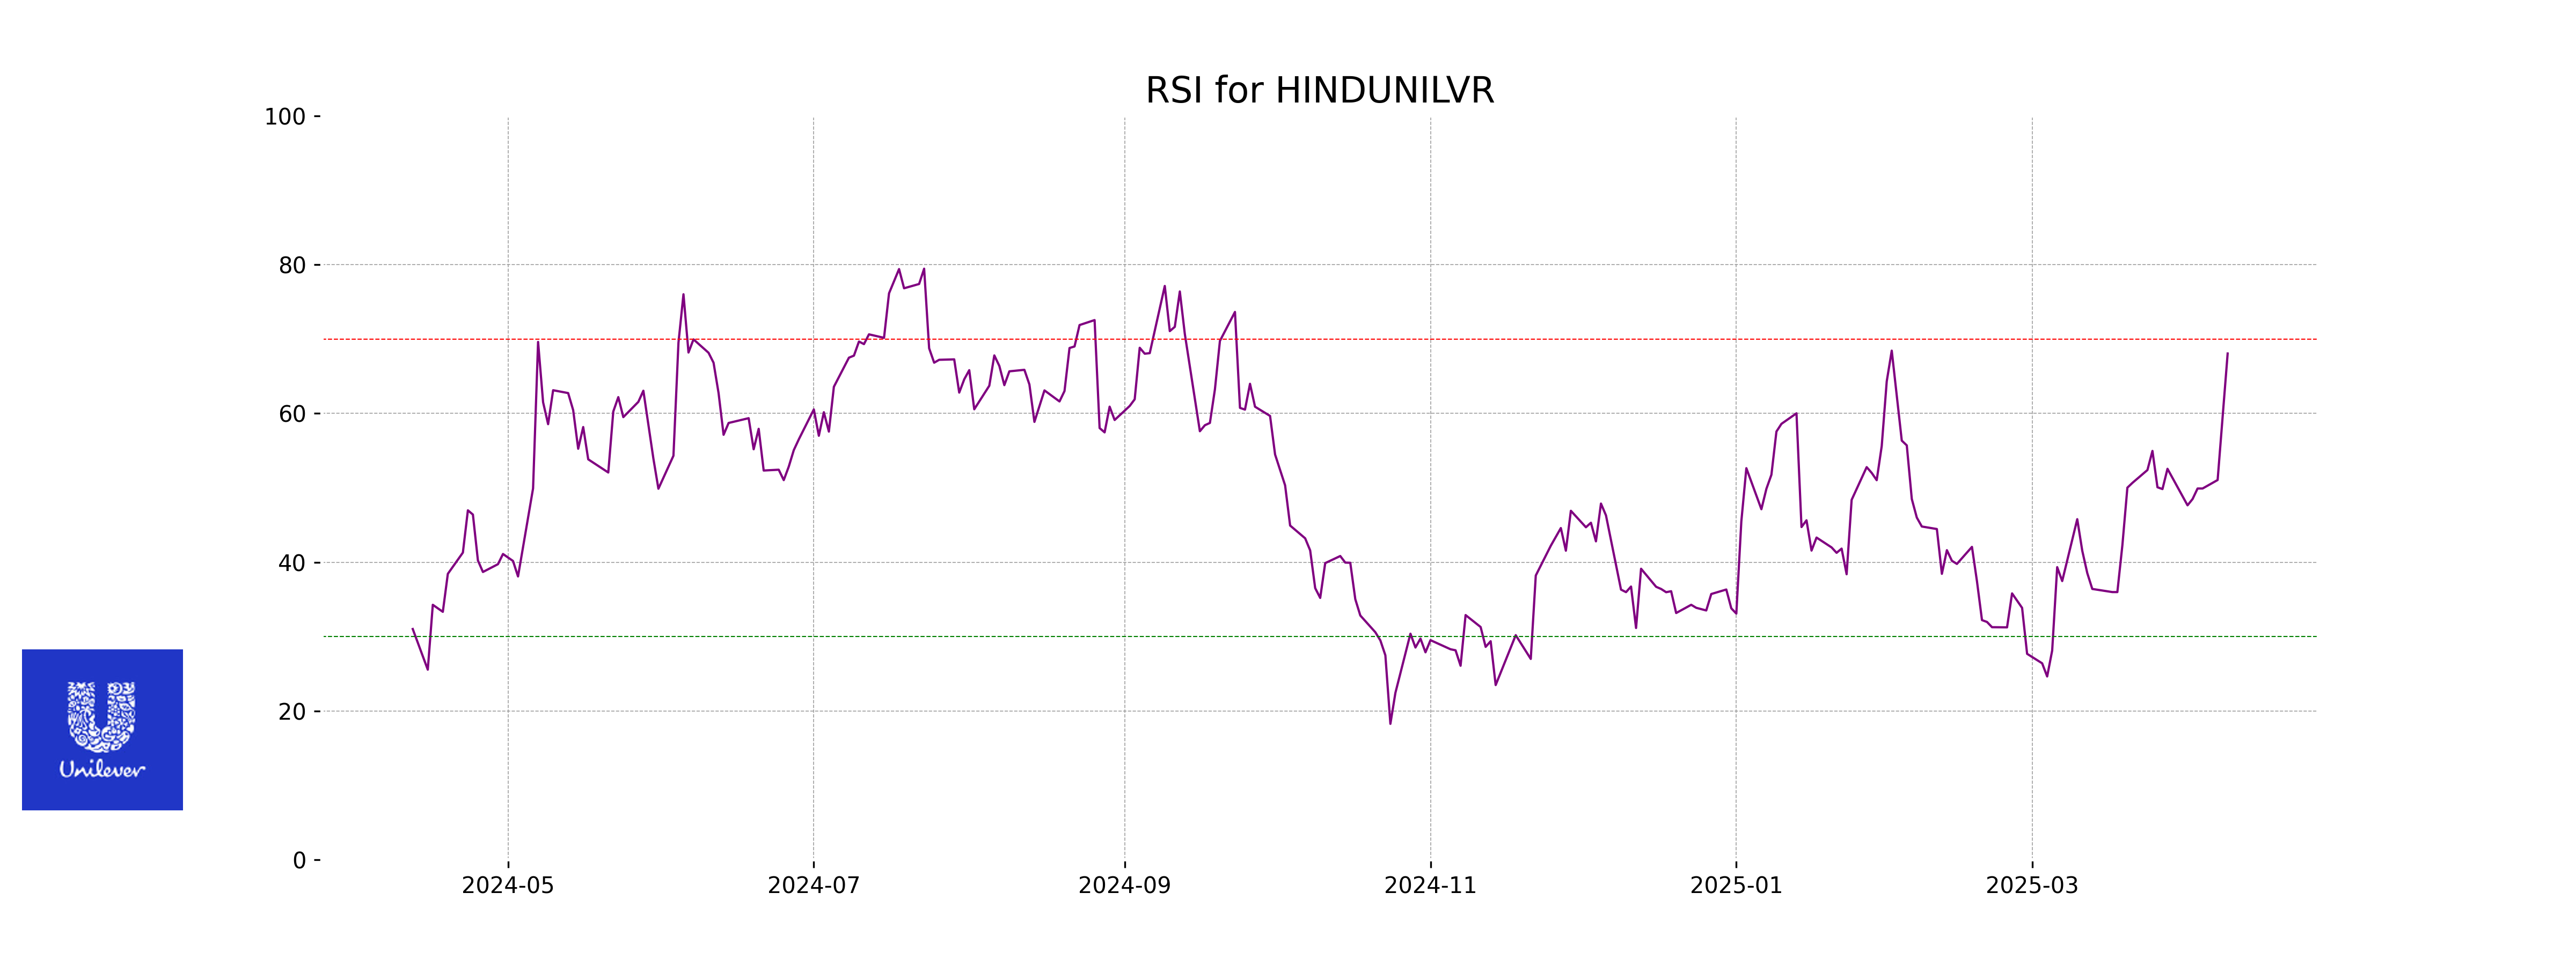
Hindustan Unilever has showcased a strong performance with a notable increase of 2.65% in its stock price, closing at 2350.0. The company maintains a robust market cap of 5.52 trillion INR and a healthy PE ratio of 51.28, indicating positive investor sentiment. With an RSI of 68.06, the stock exhibits strength and is nearing overbought conditions, reflecting its resilience in the Consumer Defensive sector.
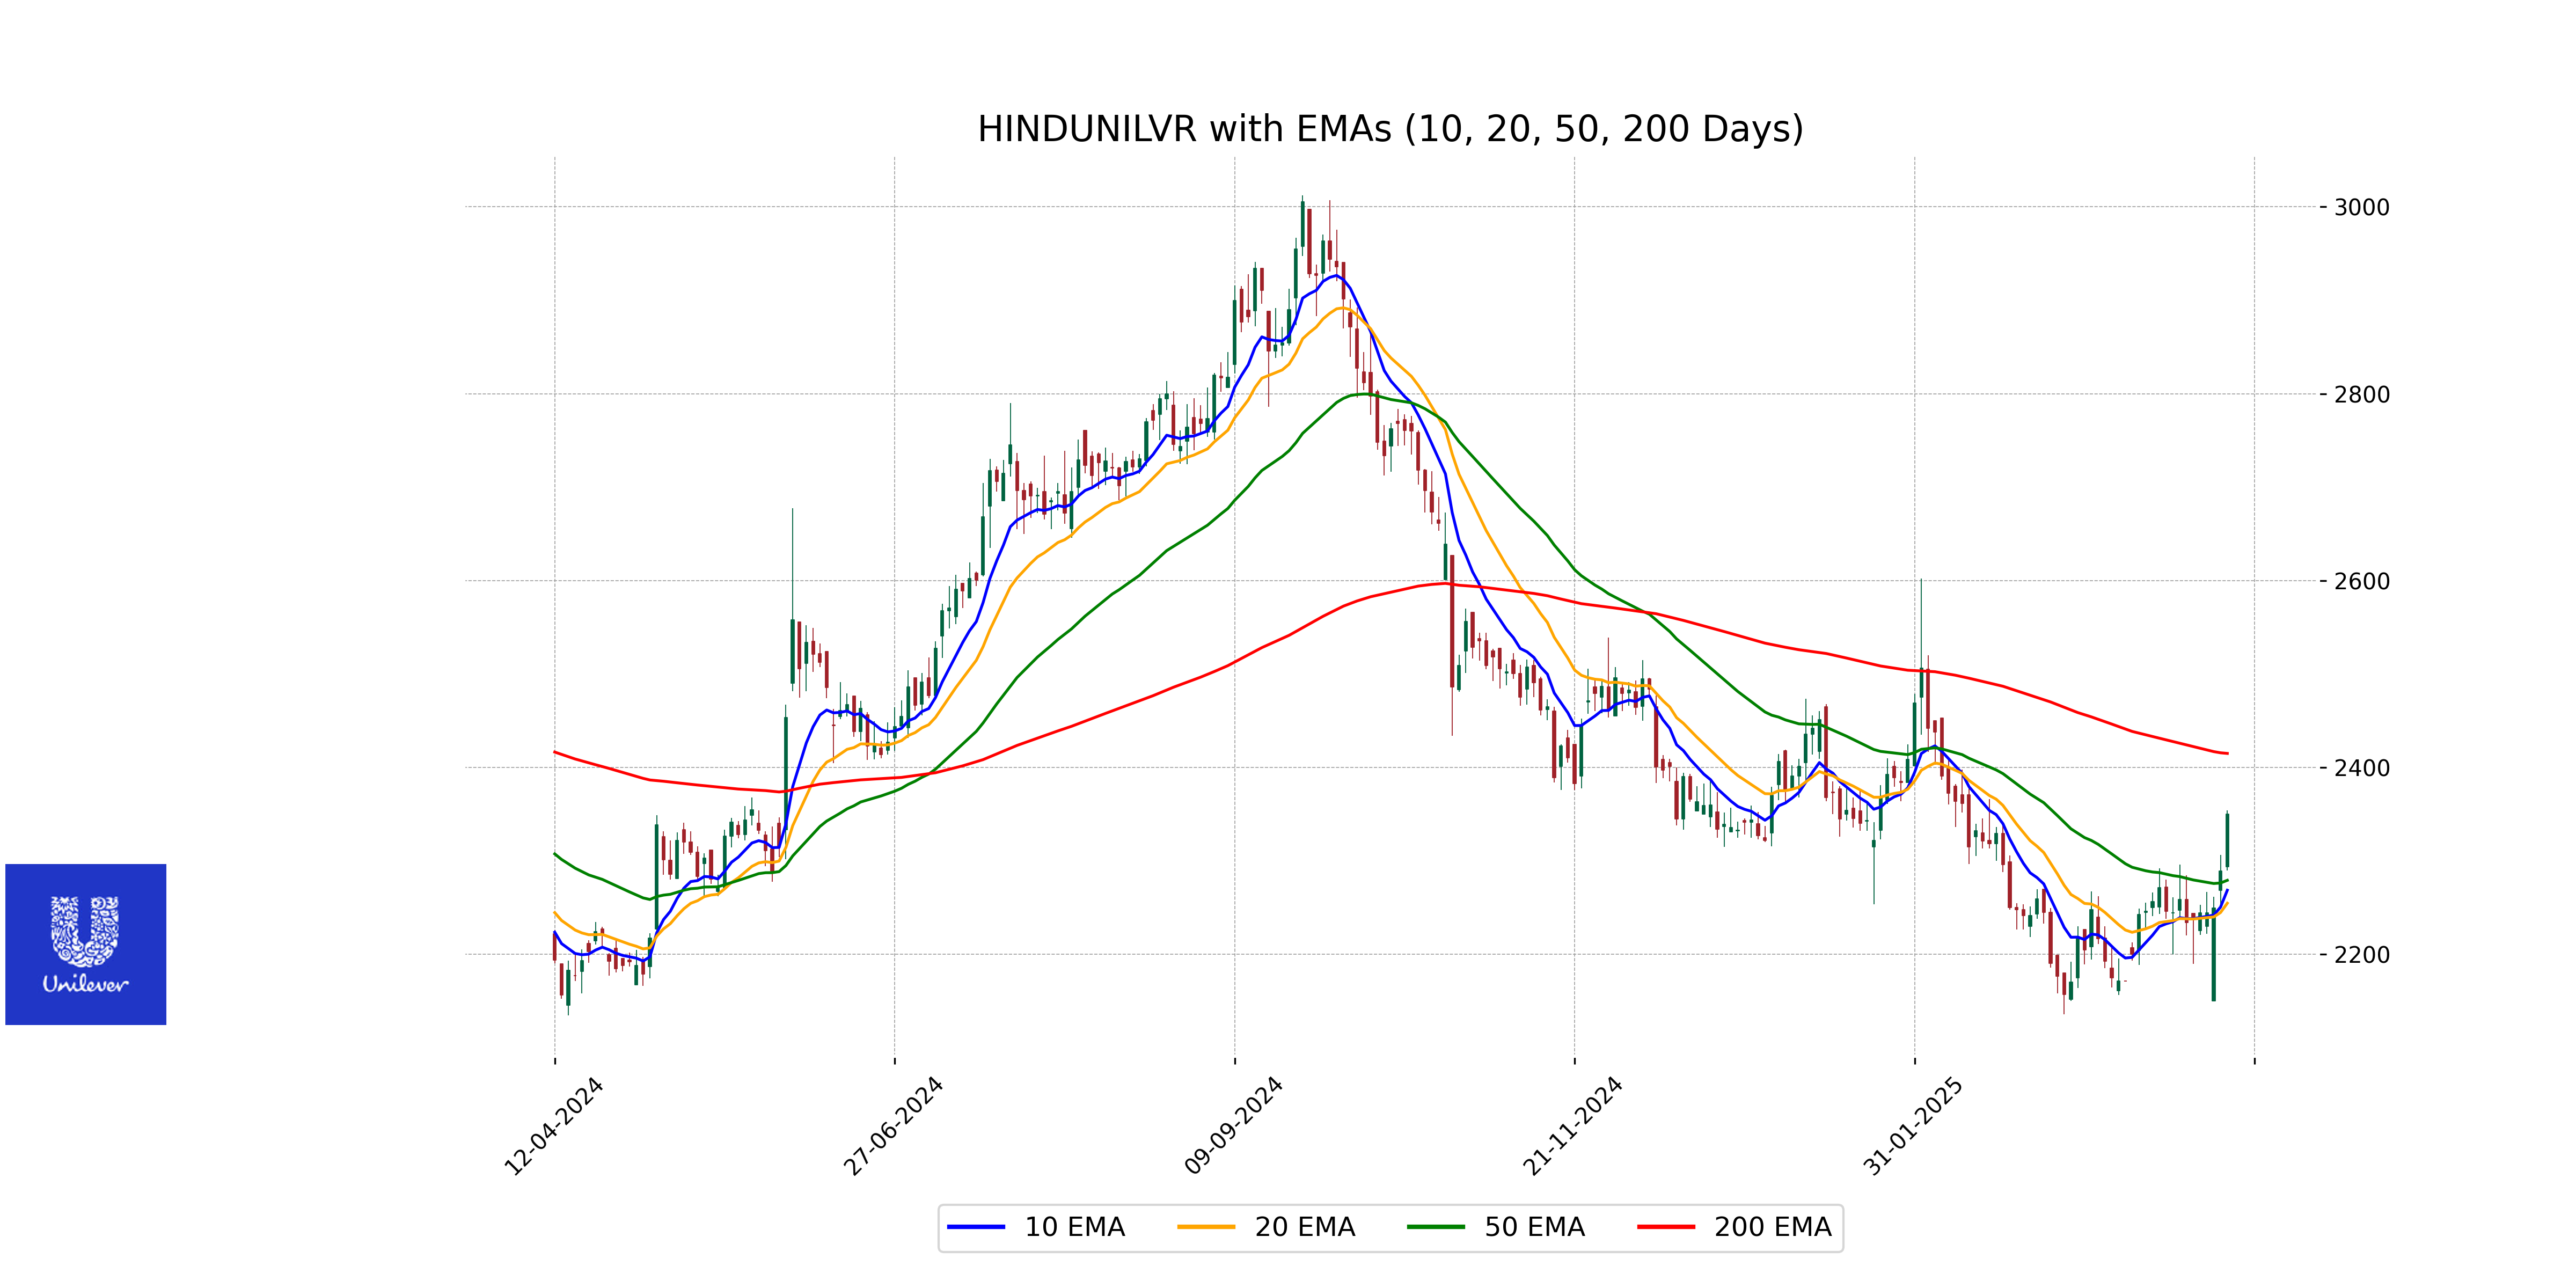
Relationship with Key Moving Averages
Hindustan Unilever's current close at 2350.0 is above the 50-day EMA of 2279.24 and the 10-day EMA of 2268.63, indicating a short-term bullish trend. However, it remains below the 200-day EMA of 2415.05, suggesting potential longer-term resistance.
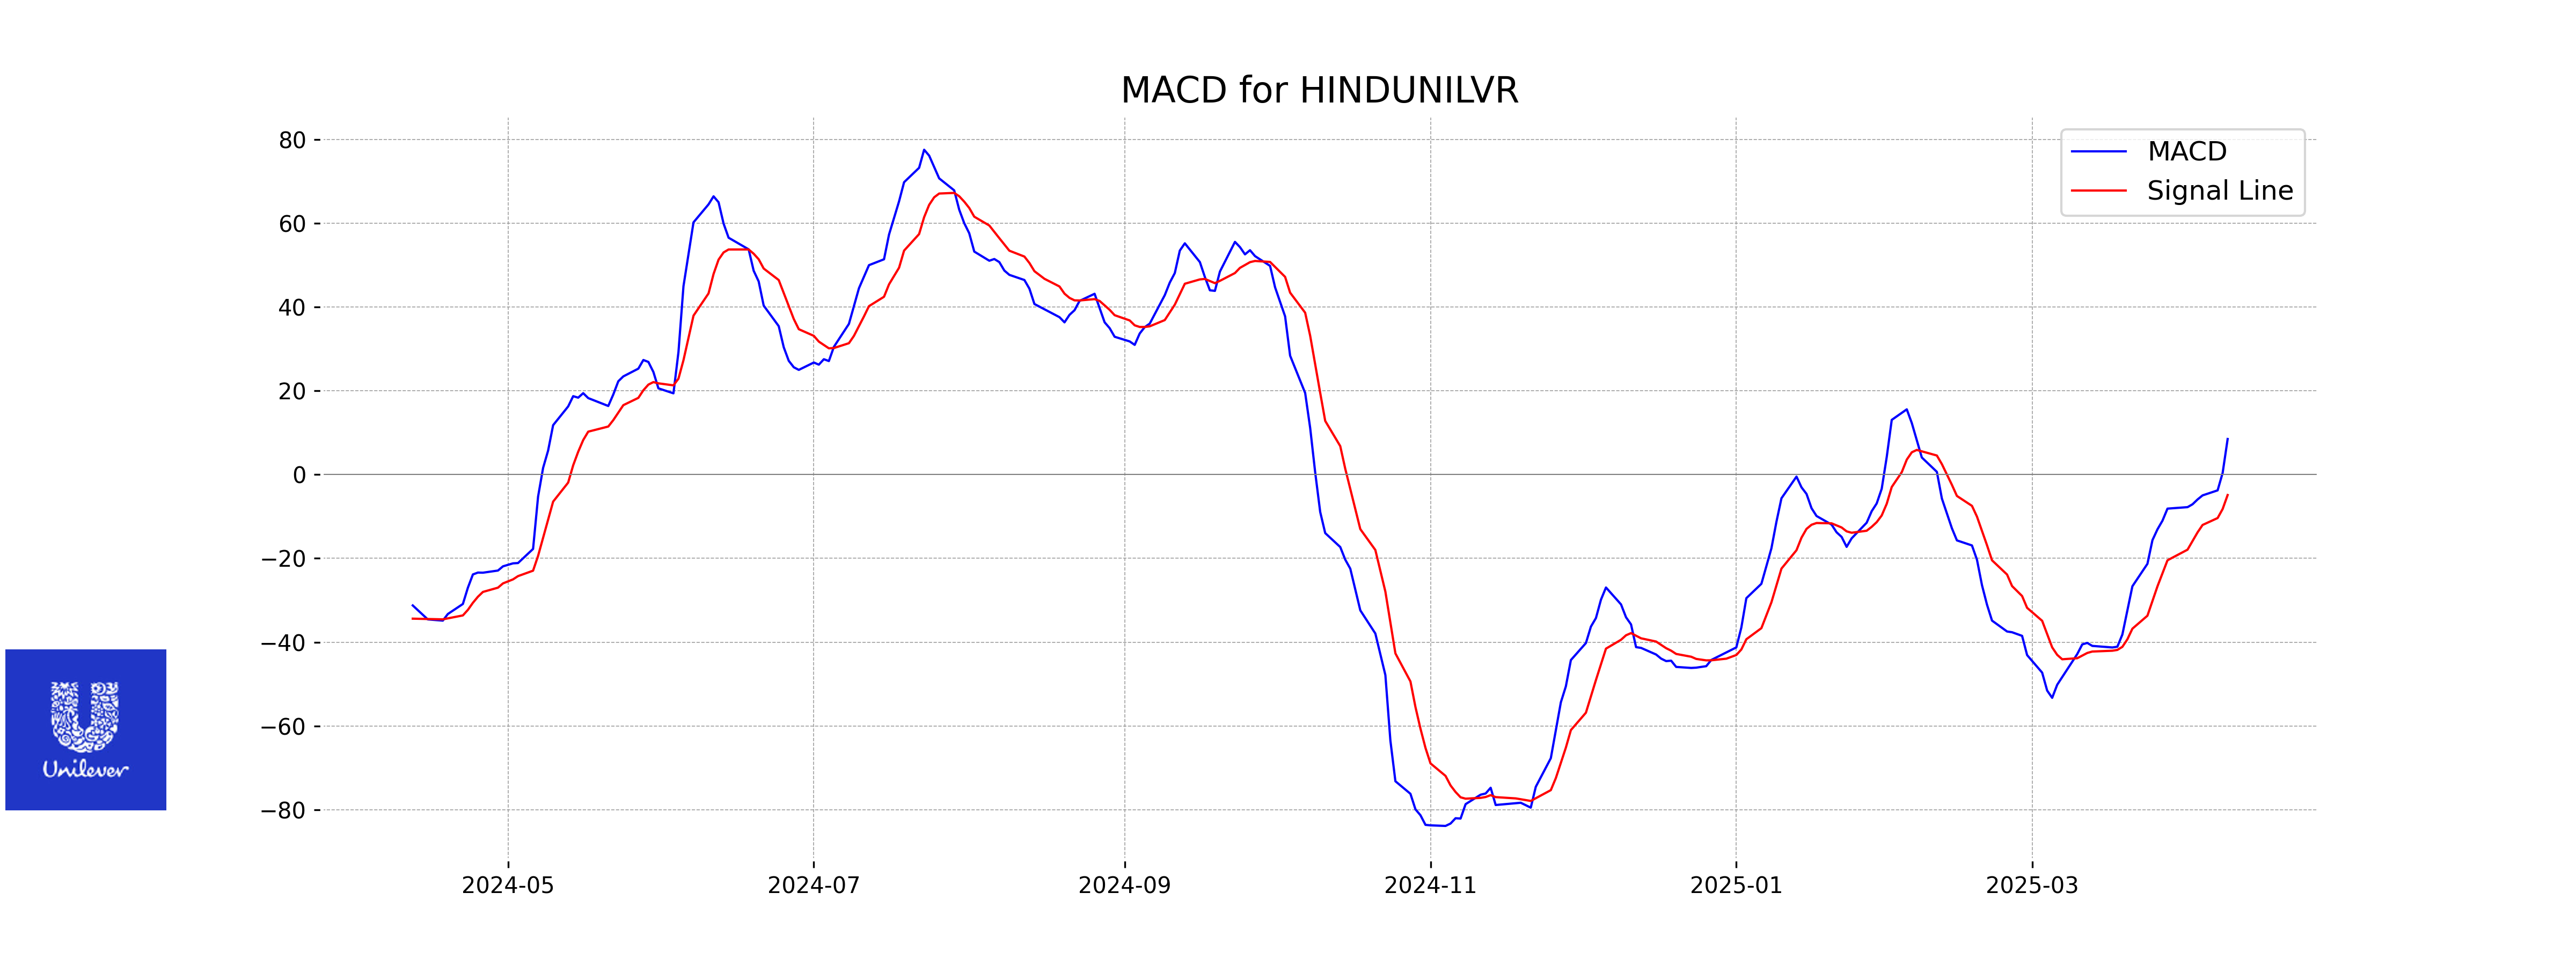
Moving Averages Trend (MACD)
The MACD for Hindustan Unilever is 8.52, which is above the MACD Signal of -4.86, indicating a bullish trend. This suggests that the stock is experiencing positive momentum and could continue to rise in the short term.
RSI Analysis
Hindustan Unilever's RSI is 68.06, indicating that the stock is approaching the overbought territory, as RSI values above 70 typically signify overbought conditions. However, it is just below the 70 mark, suggesting that while strong, there isn't immediate overbought pressure.
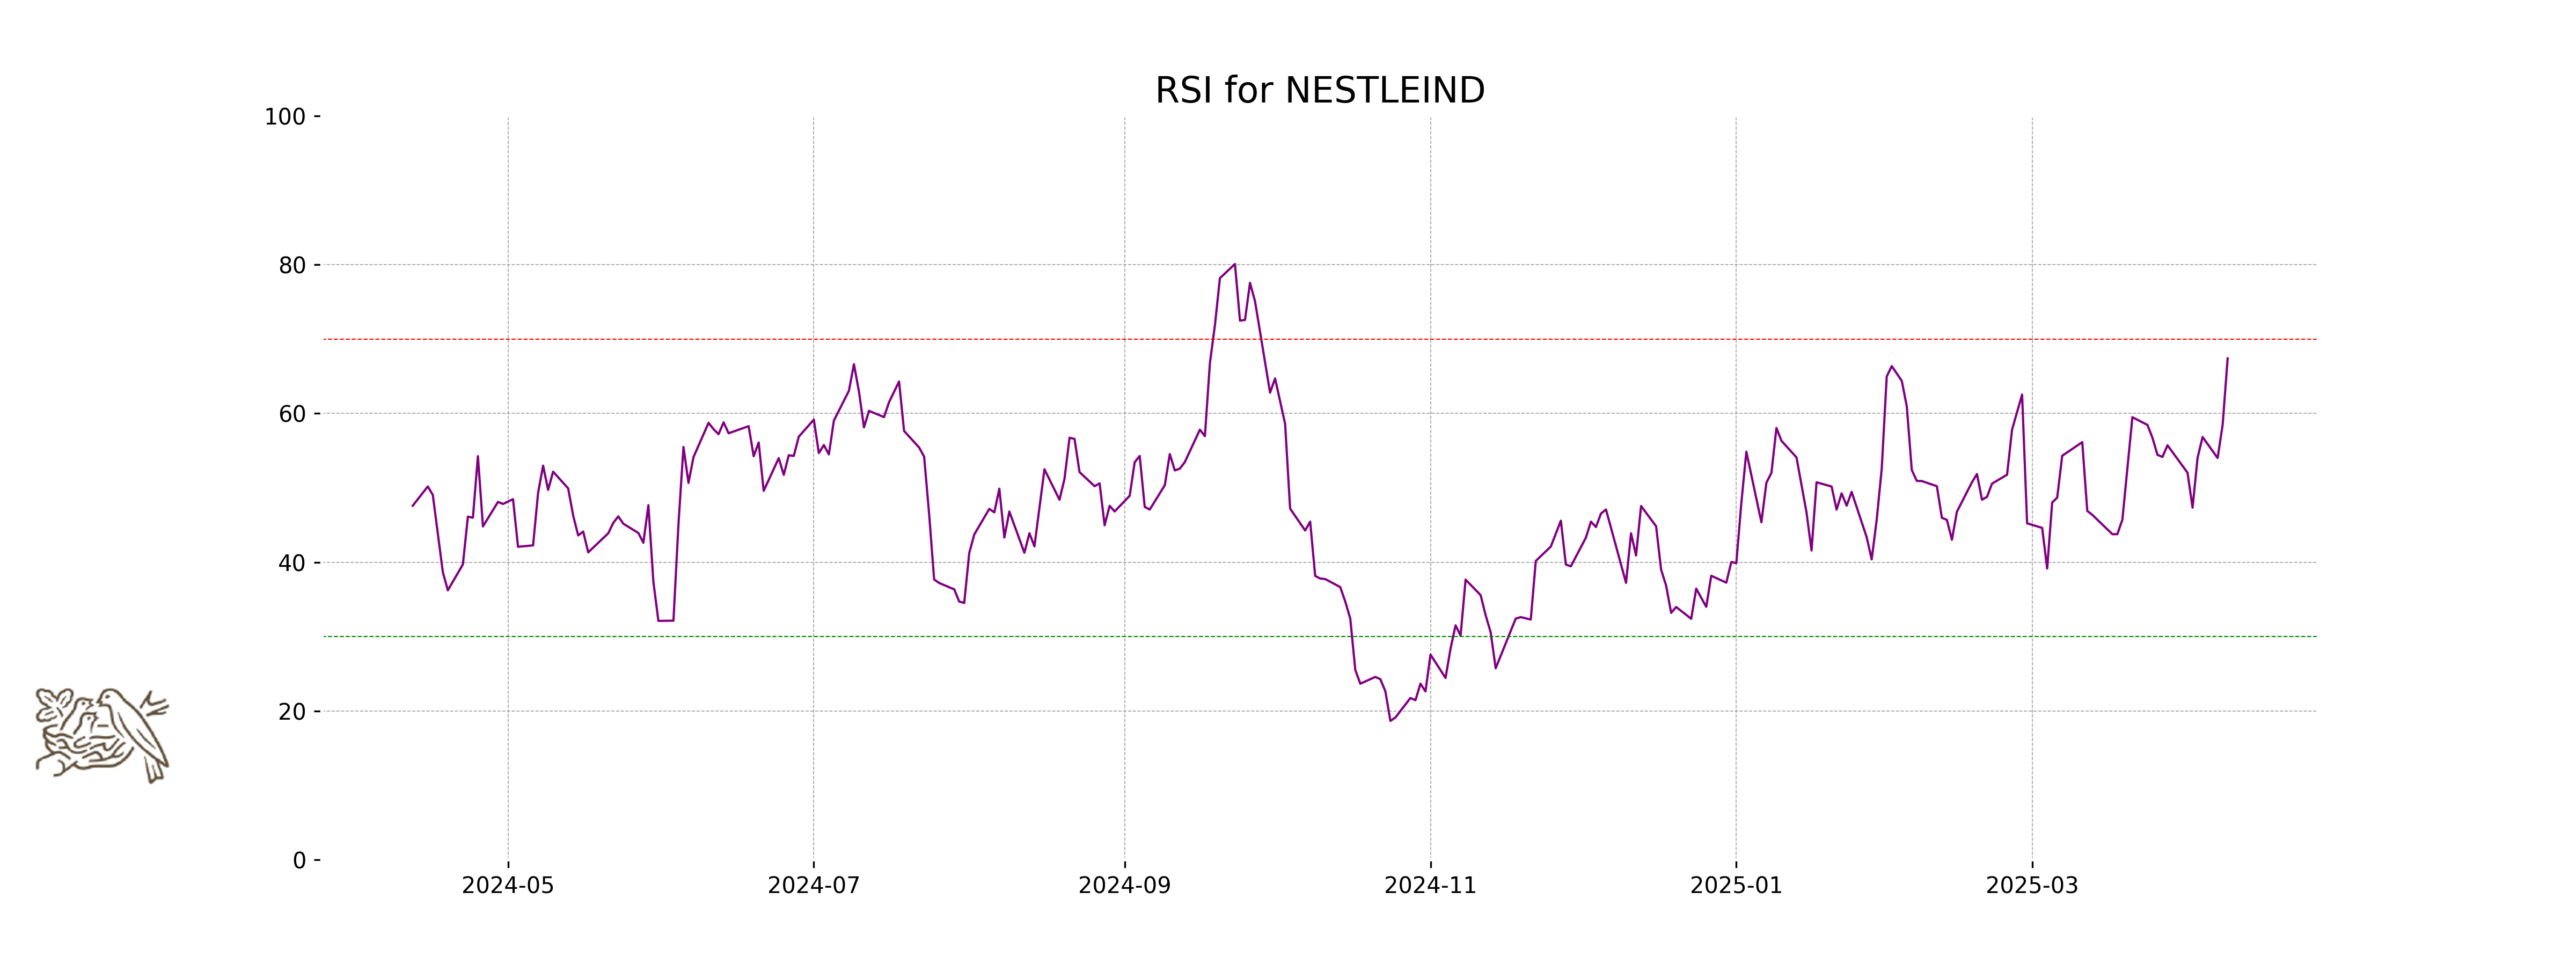
Analysis for Nestle - April 10, 2025
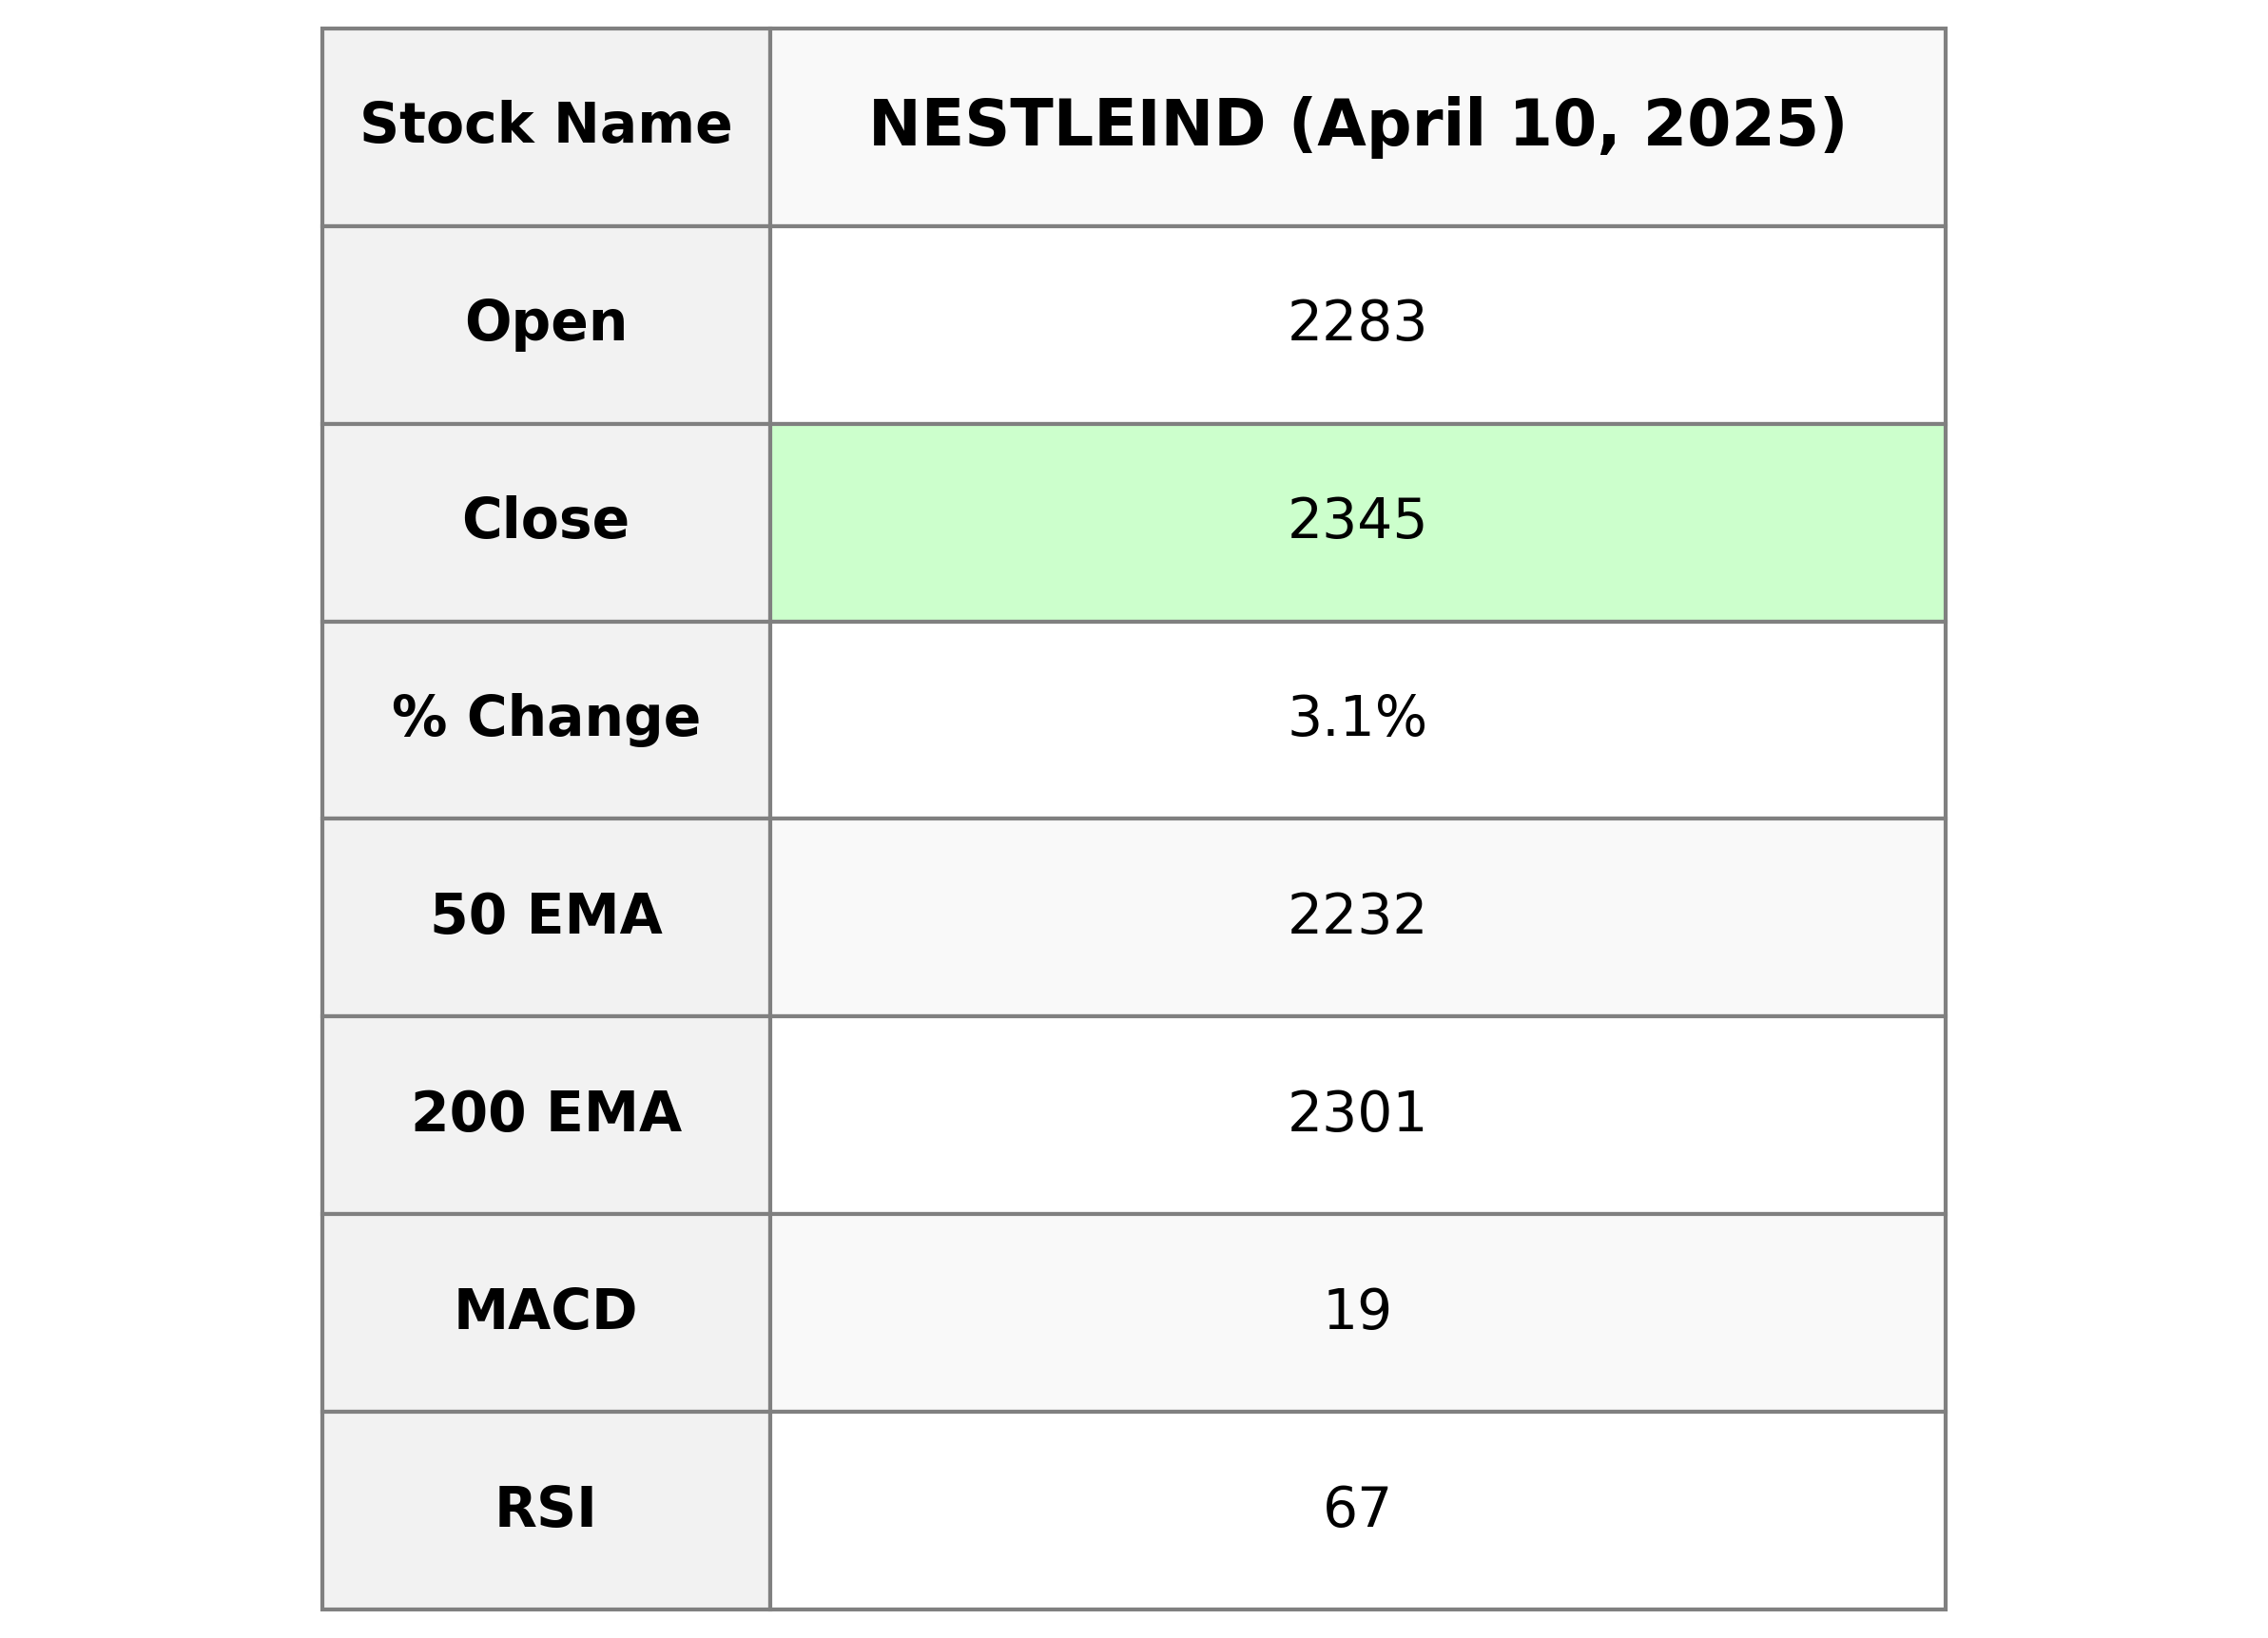
Nestle India Performance: Nestle India Ltd. opened at 2283.20 and closed at 2344.85, achieving a significant price increase of 3.05% over the previous close. The stock showed strong upward momentum with key indicators like the RSI at 67.41 and a positive MACD above its signal line, suggesting a bullish trend. With a market cap of over 2 trillion INR, the company operates in the Consumer Defensive sector, specifically within the Packaged Foods industry in India.
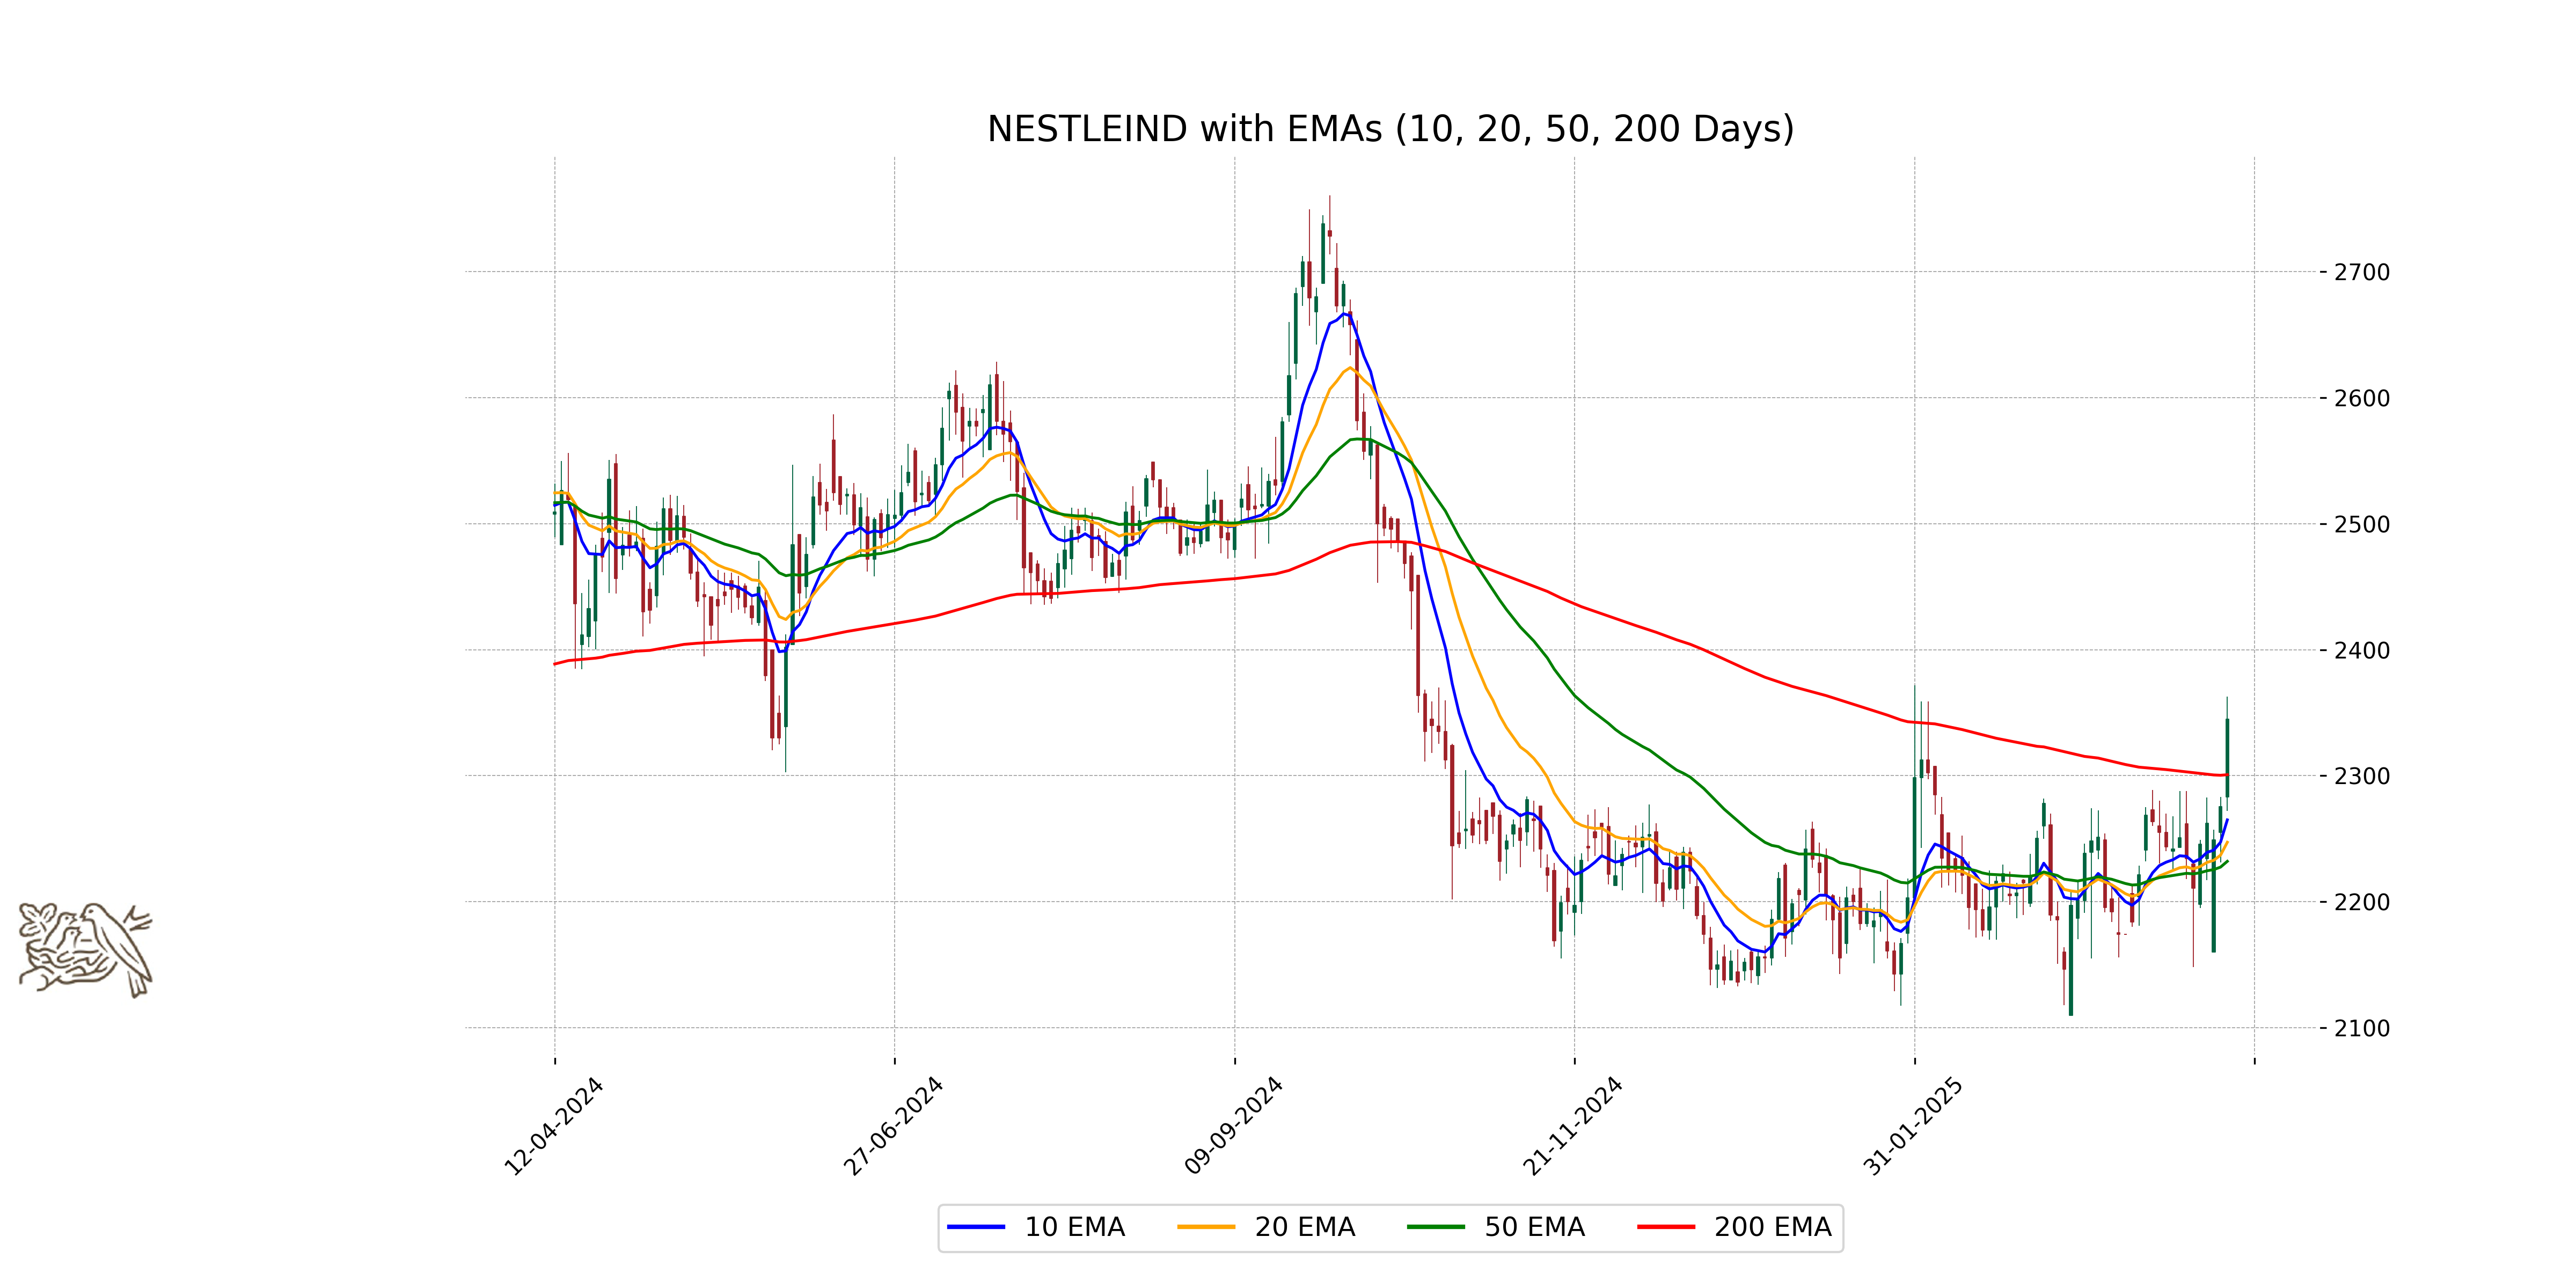
Relationship with Key Moving Averages
Nestle India is trading above its key moving averages, with the current close at 2344.85, above the 50-day EMA (2232.08), 200-day EMA (2300.80), 10-day EMA (2264.95), and 20-day EMA (2247.20). This indicates a strong upward trend in the stock's momentum.
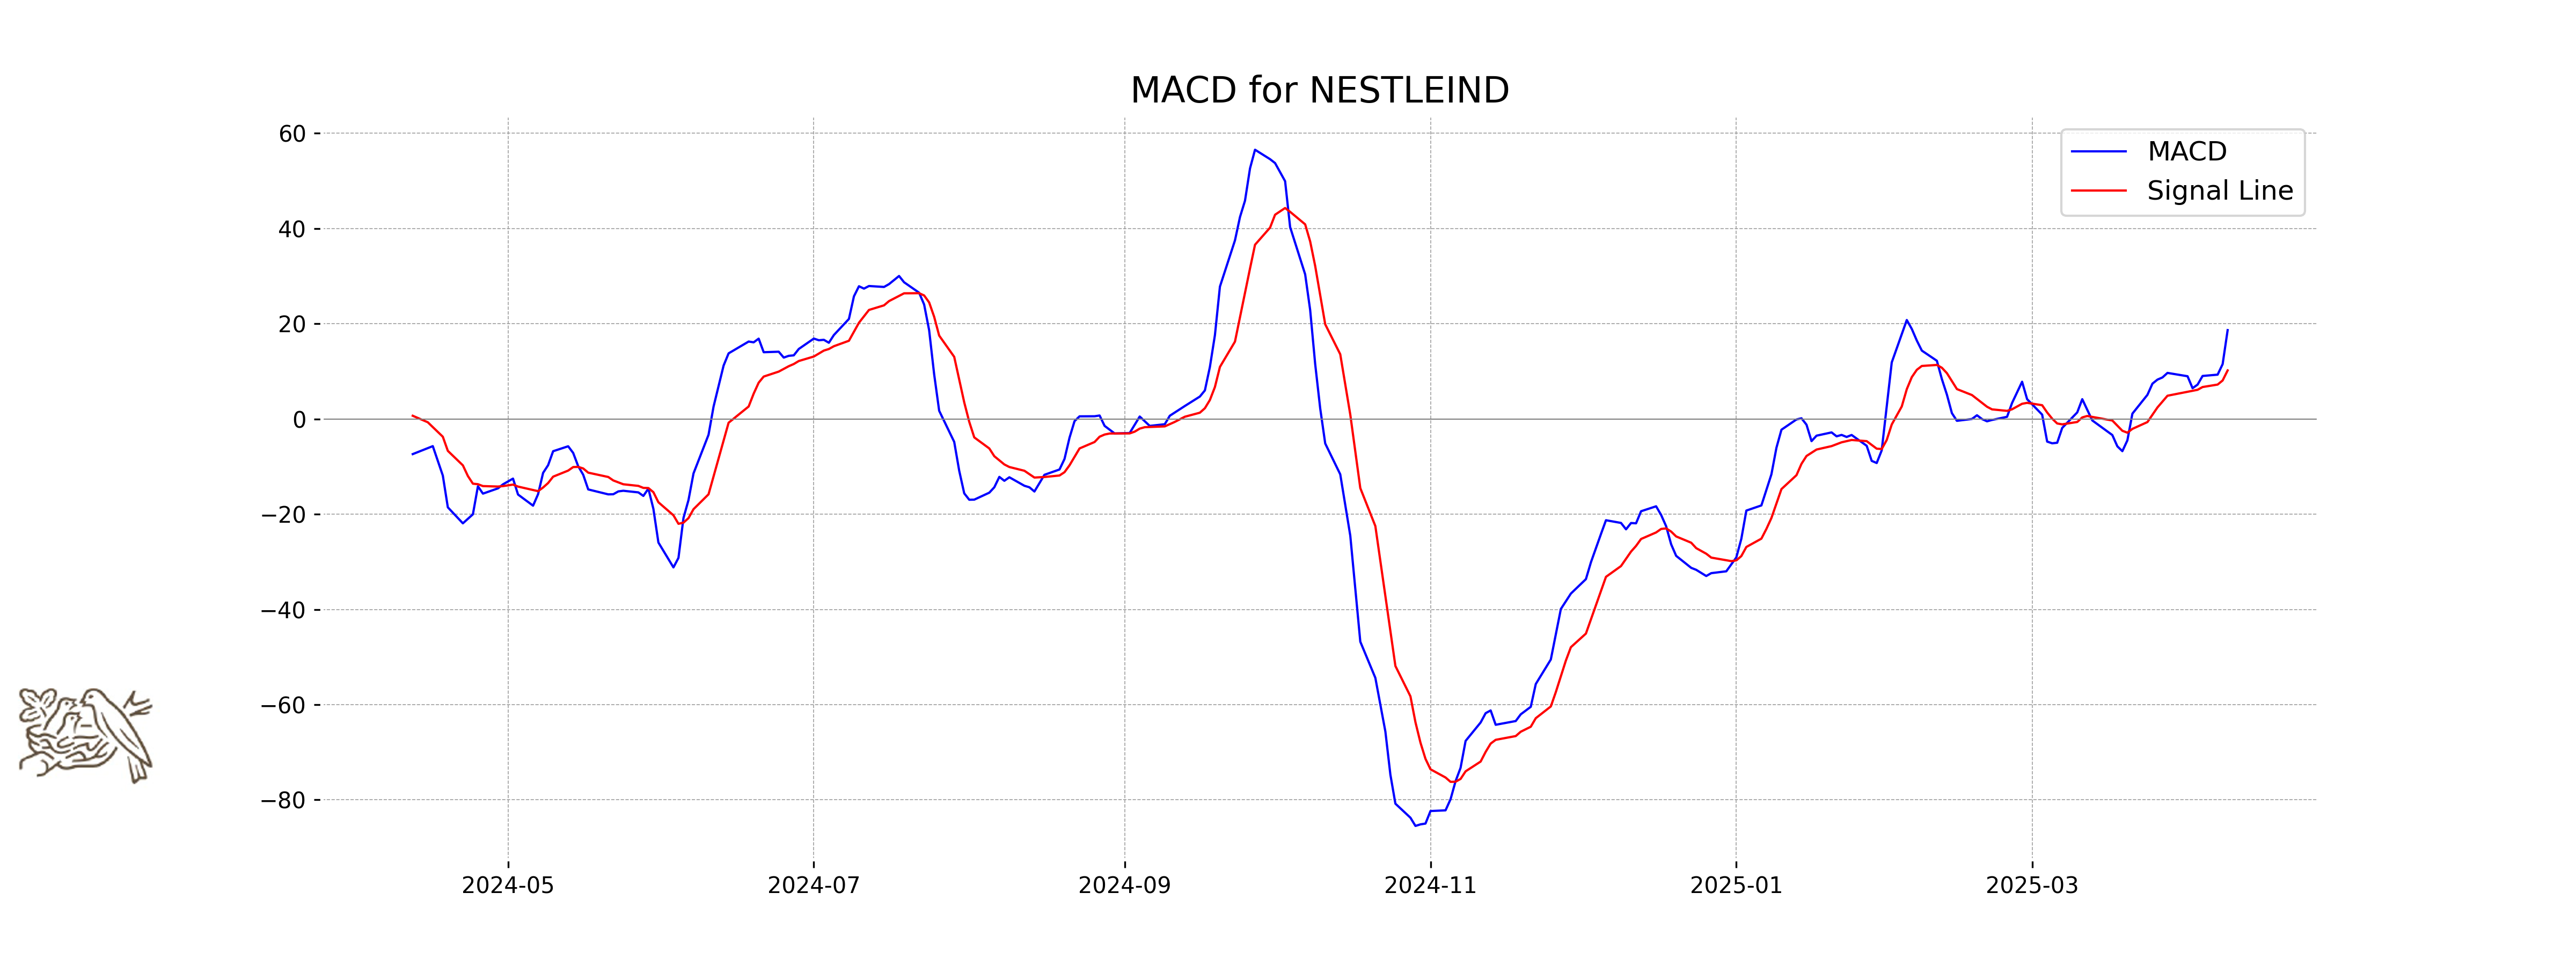
Moving Averages Trend (MACD)
MACD Analysis for Nestle: The MACD value for Nestle is 18.67, which is above the MACD Signal of 10.20. This indicates a bullish trend, suggesting that the stock price has potential for upward movement.
RSI Analysis
The RSI value for Nestle is 67.41, indicating that the stock is approaching overbought levels. An RSI above 70 typically suggests that the stock may be overvalued or poised for a correction, while levels below 30 indicate possible undervaluation. Traders might watch closely for any movements above or below these critical points.
Analysis for Power Grid - April 10, 2025
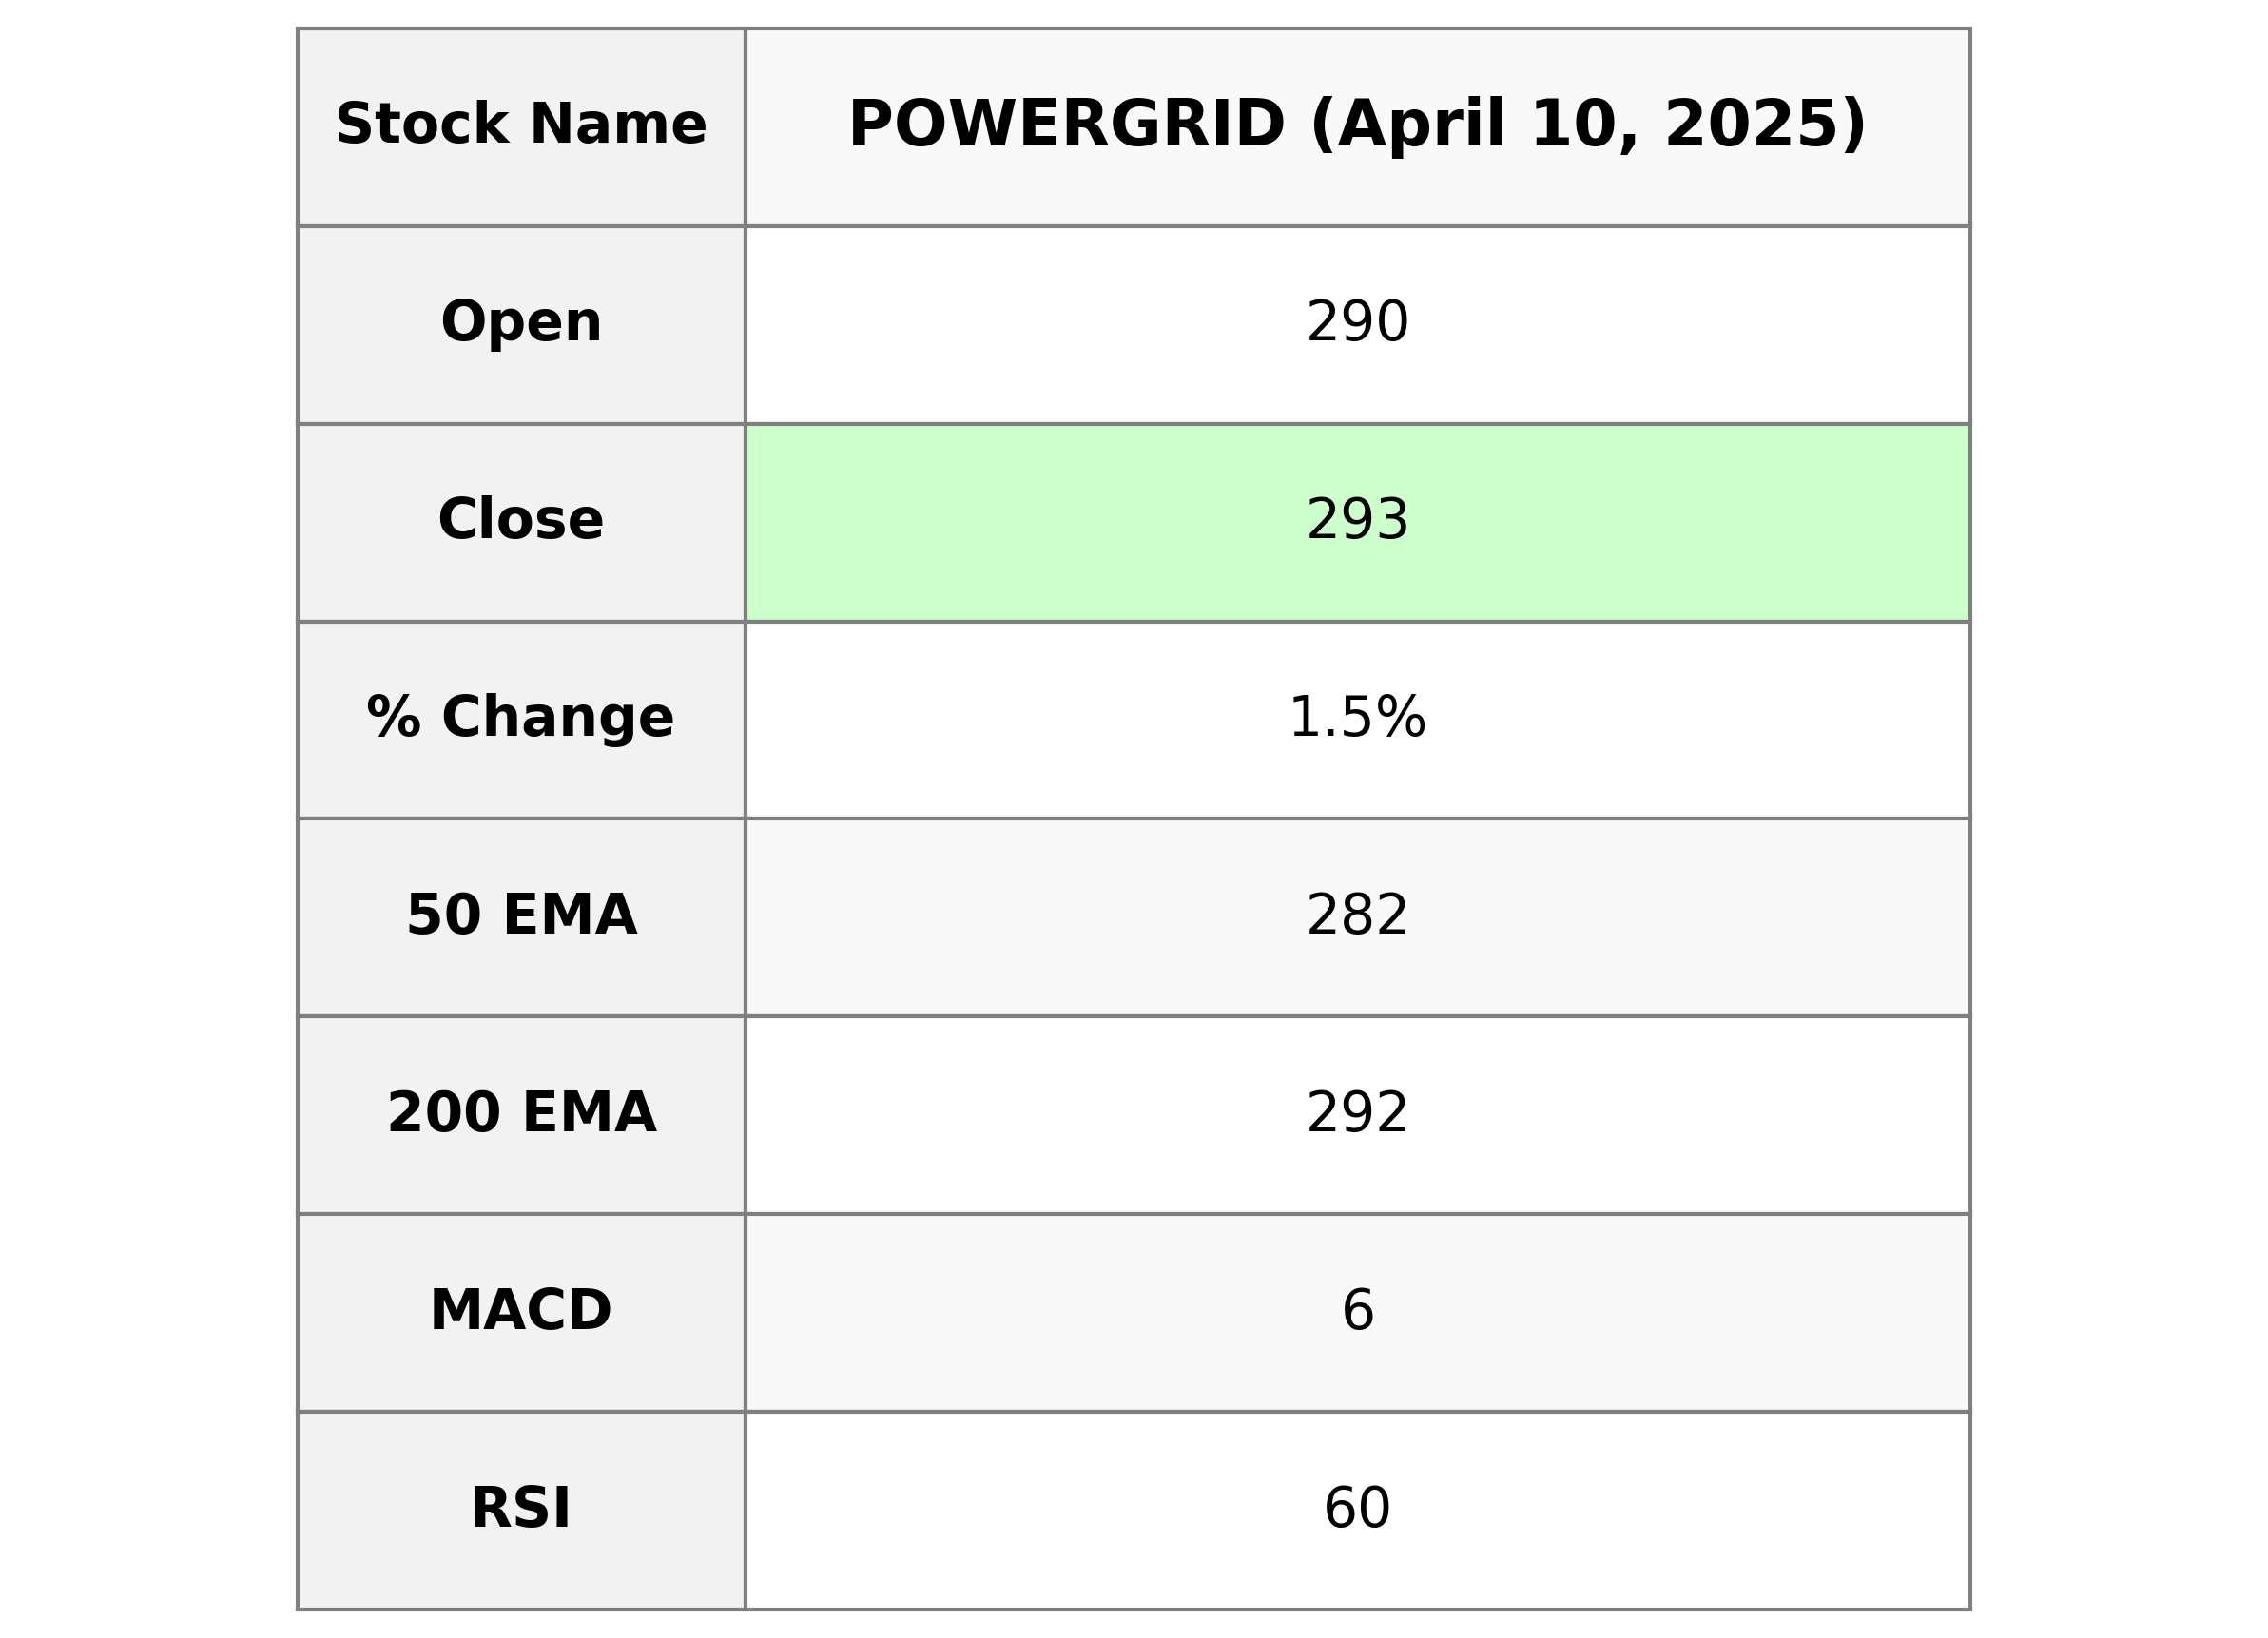
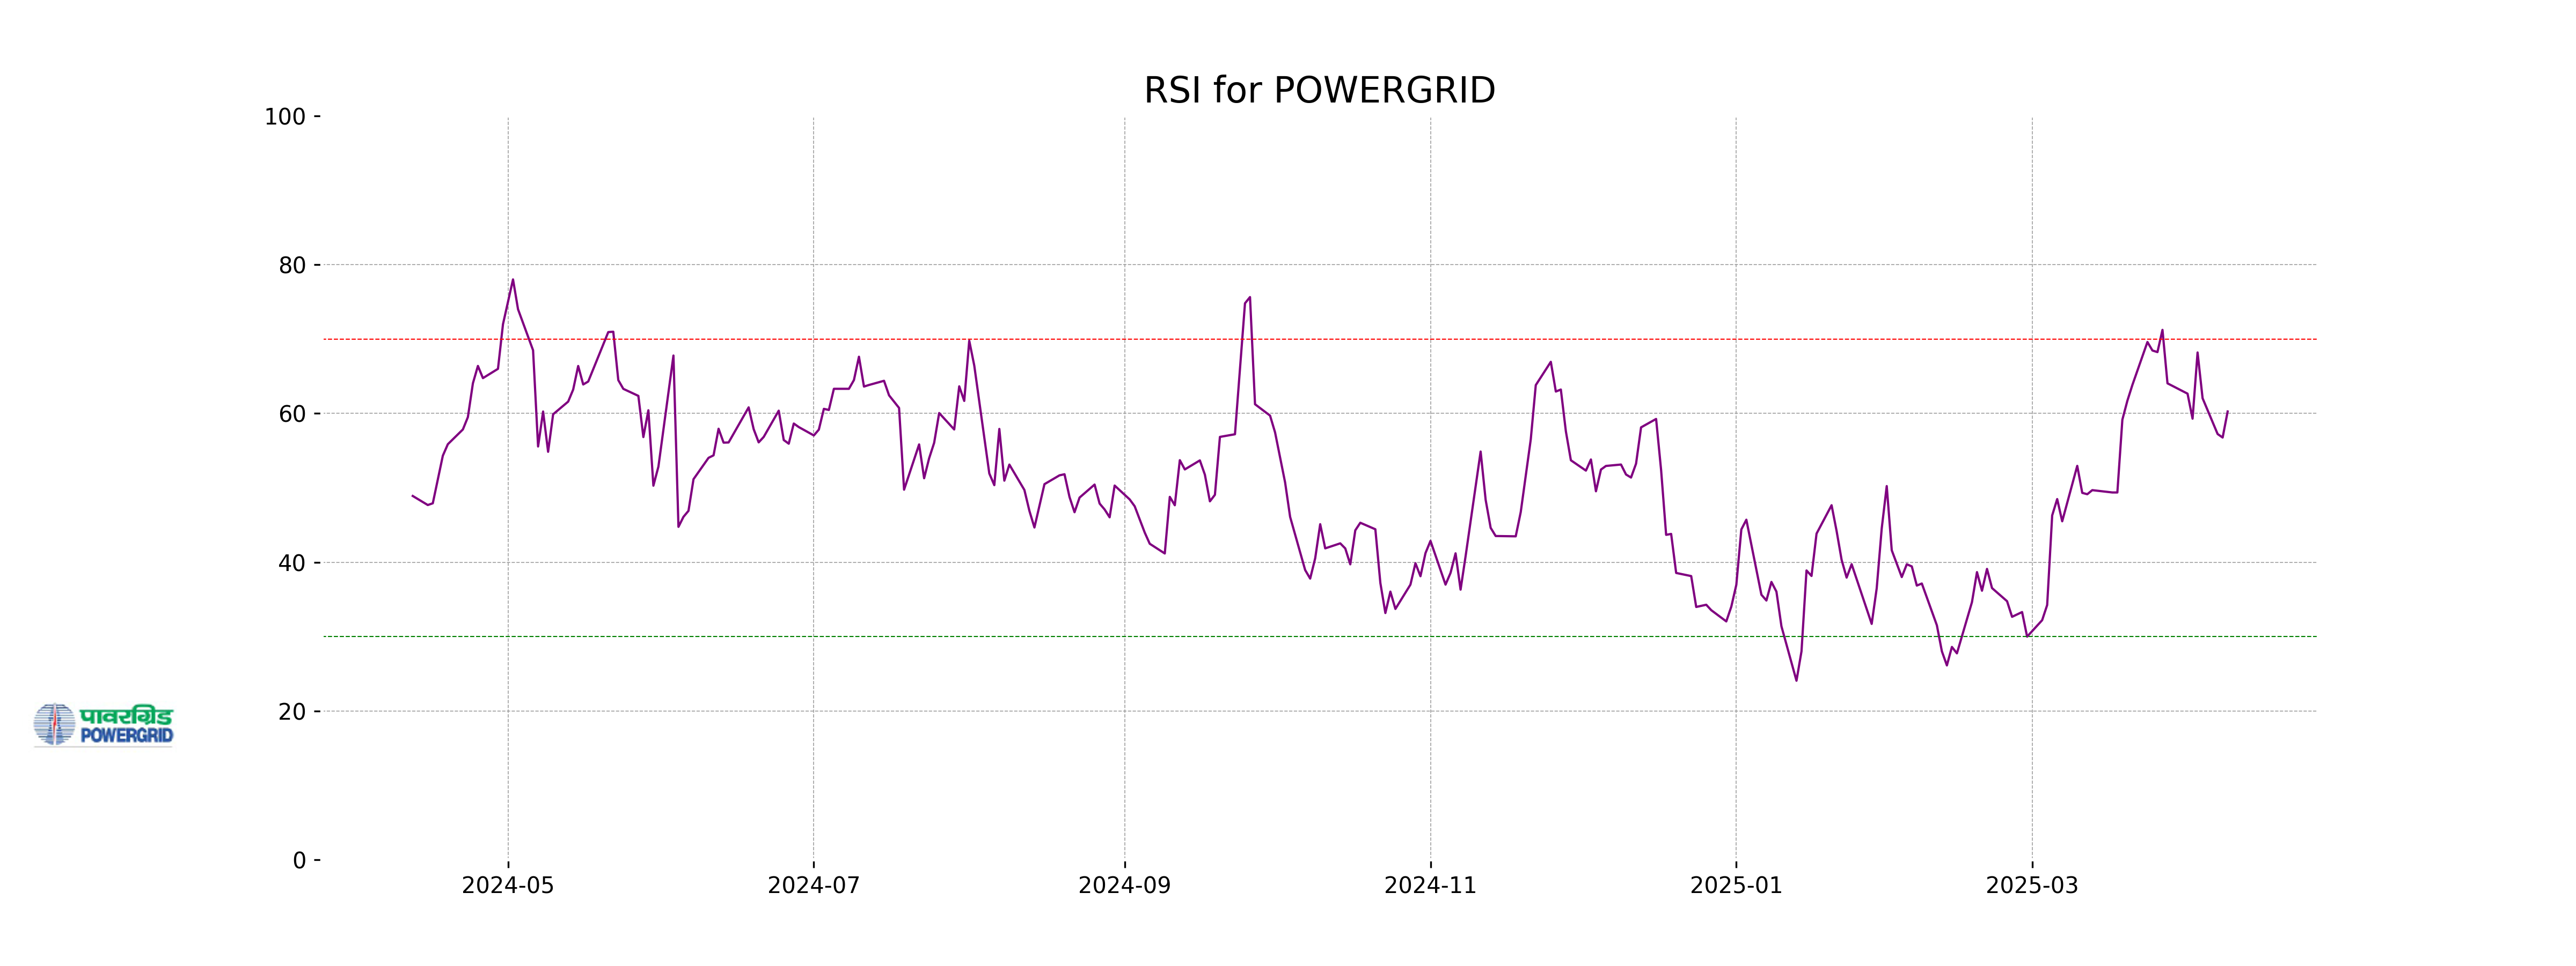
Stock Performance Overview: Power Grid Corporation of India showed a positive performance, with a closing price of 293.40, up by 1.54% from the previous close. The trading volume was significant at 21,342,531 shares. The stock demonstrated bullish momentum, indicated by its higher relative strength index (RSI) of 60.27 and a MACD of 5.81 surpassing the signal line. Company Profile Summary: Power Grid Corporation operates in the Utilities sector, specifically within the Utilities - Regulated Electric industry, in India. The company holds a substantial market cap of 2,728,795,832,320 INR. With a P/E ratio of 17.60 and an EPS of 16.67, Power Grid maintains a solid financial standing.
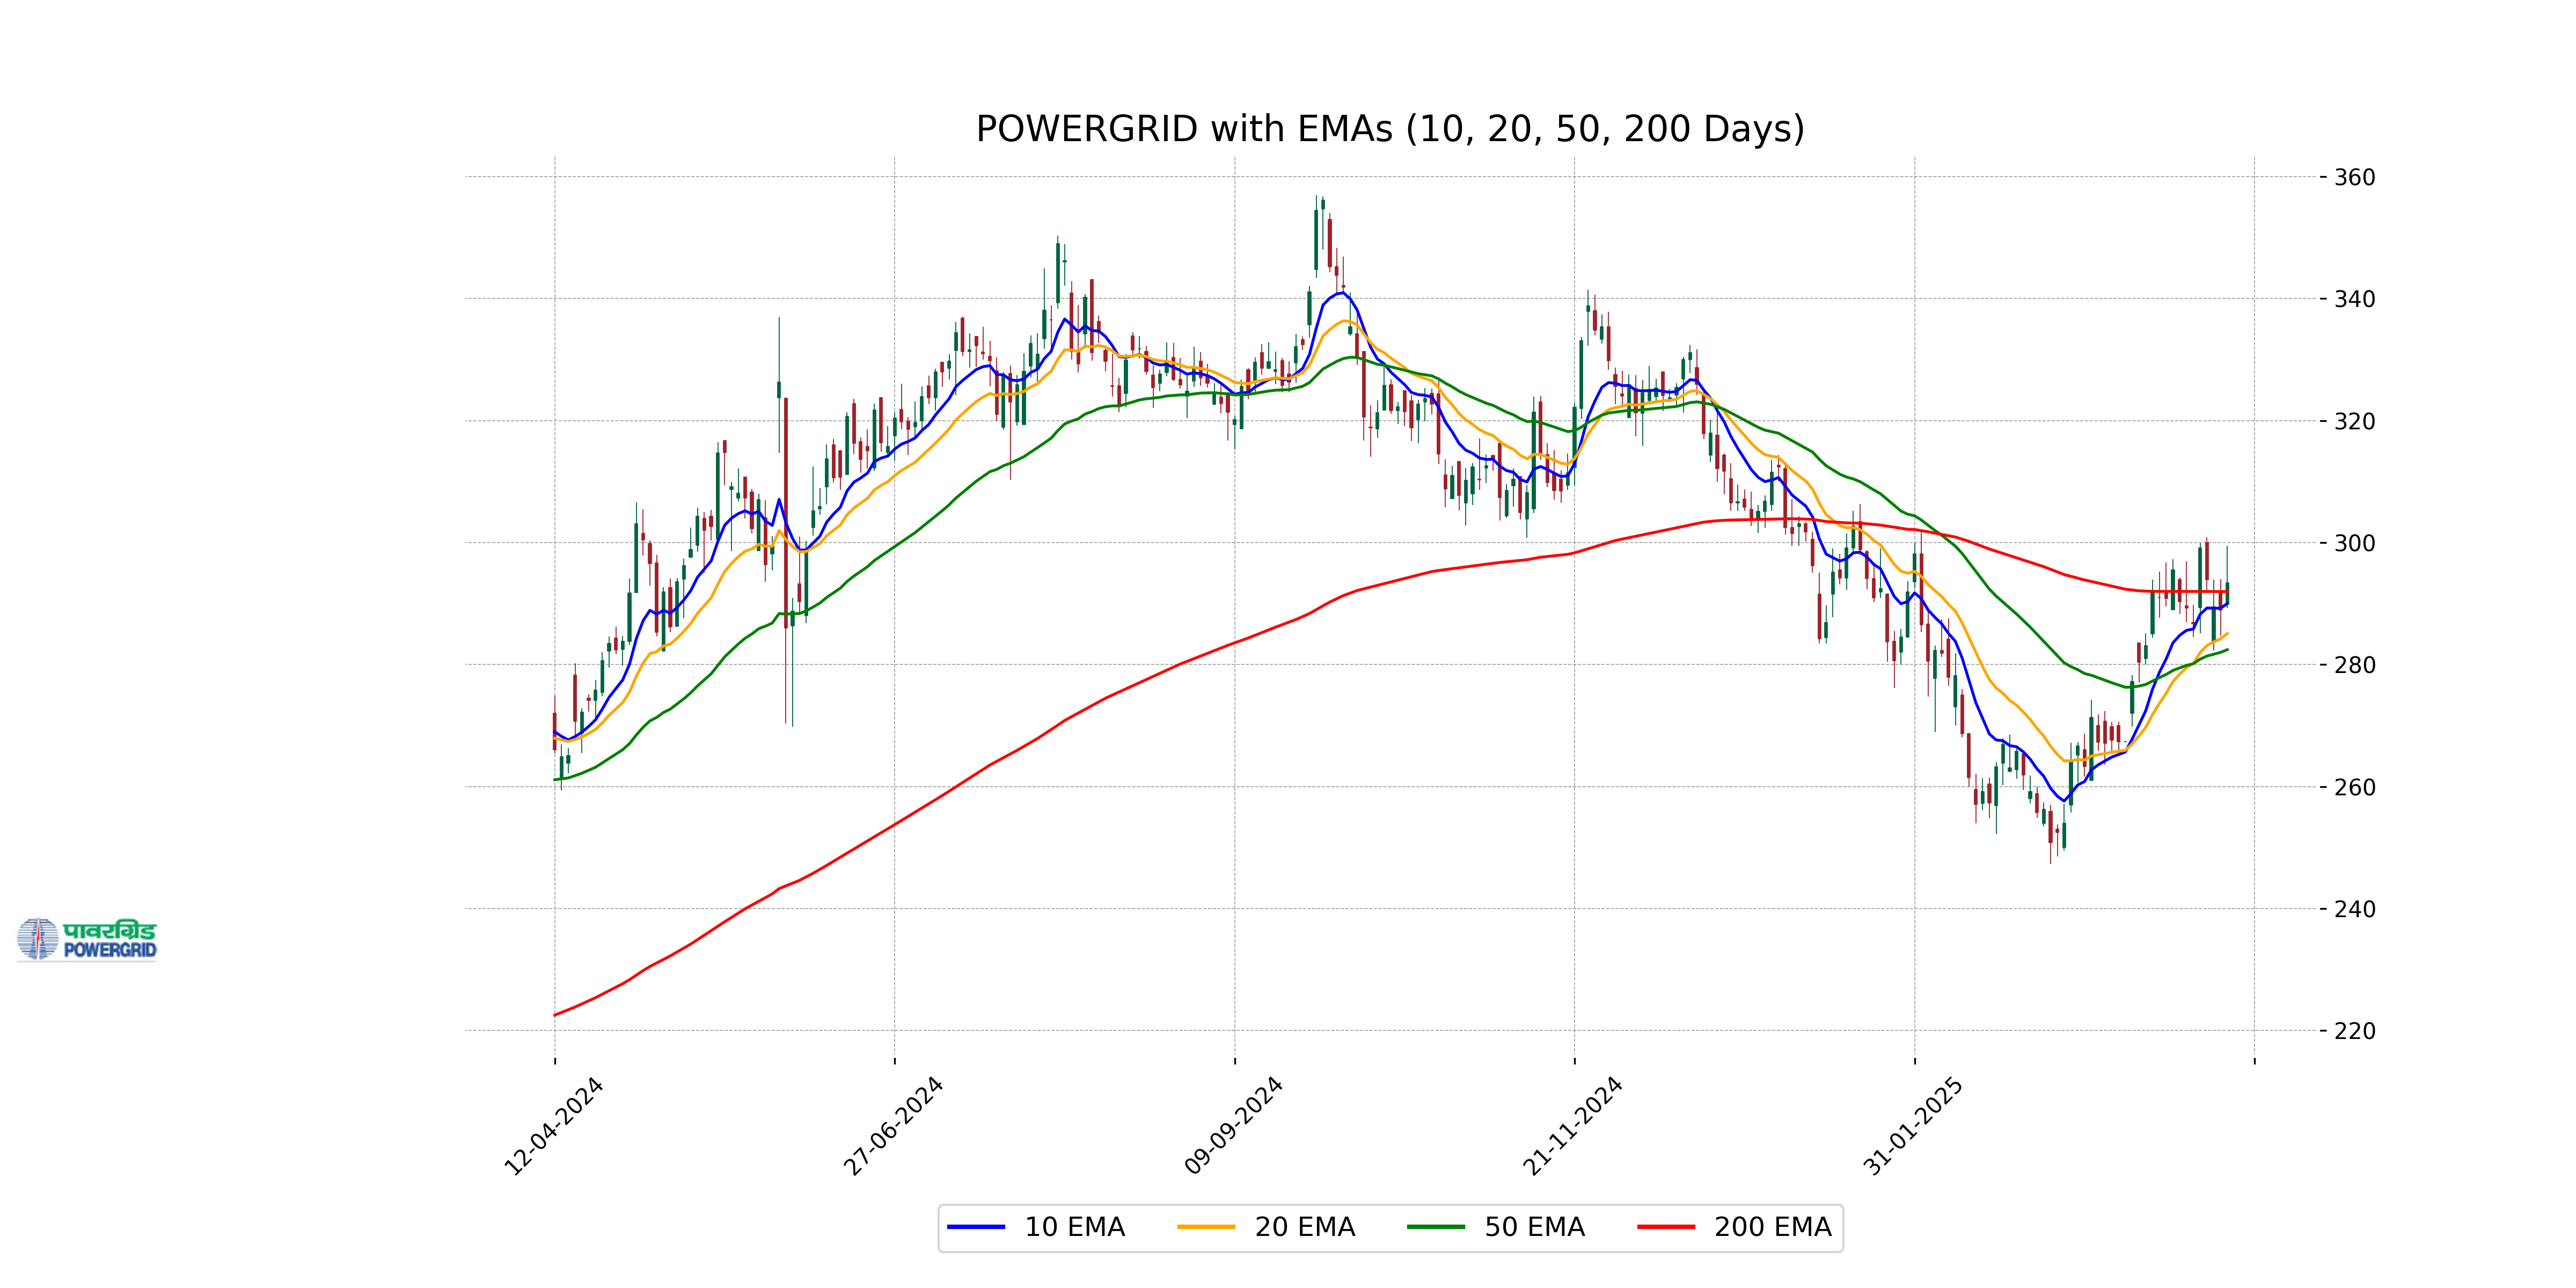
Relationship with Key Moving Averages
Power Grid's current close of 293.40 is above the 50-day EMA of 282.44 and slightly above the 200-day EMA of 291.96, indicating a positive trend. Additionally, it is above the 10-day EMA of 289.99 and the 20-day EMA of 285.08, suggesting short-term upward momentum.
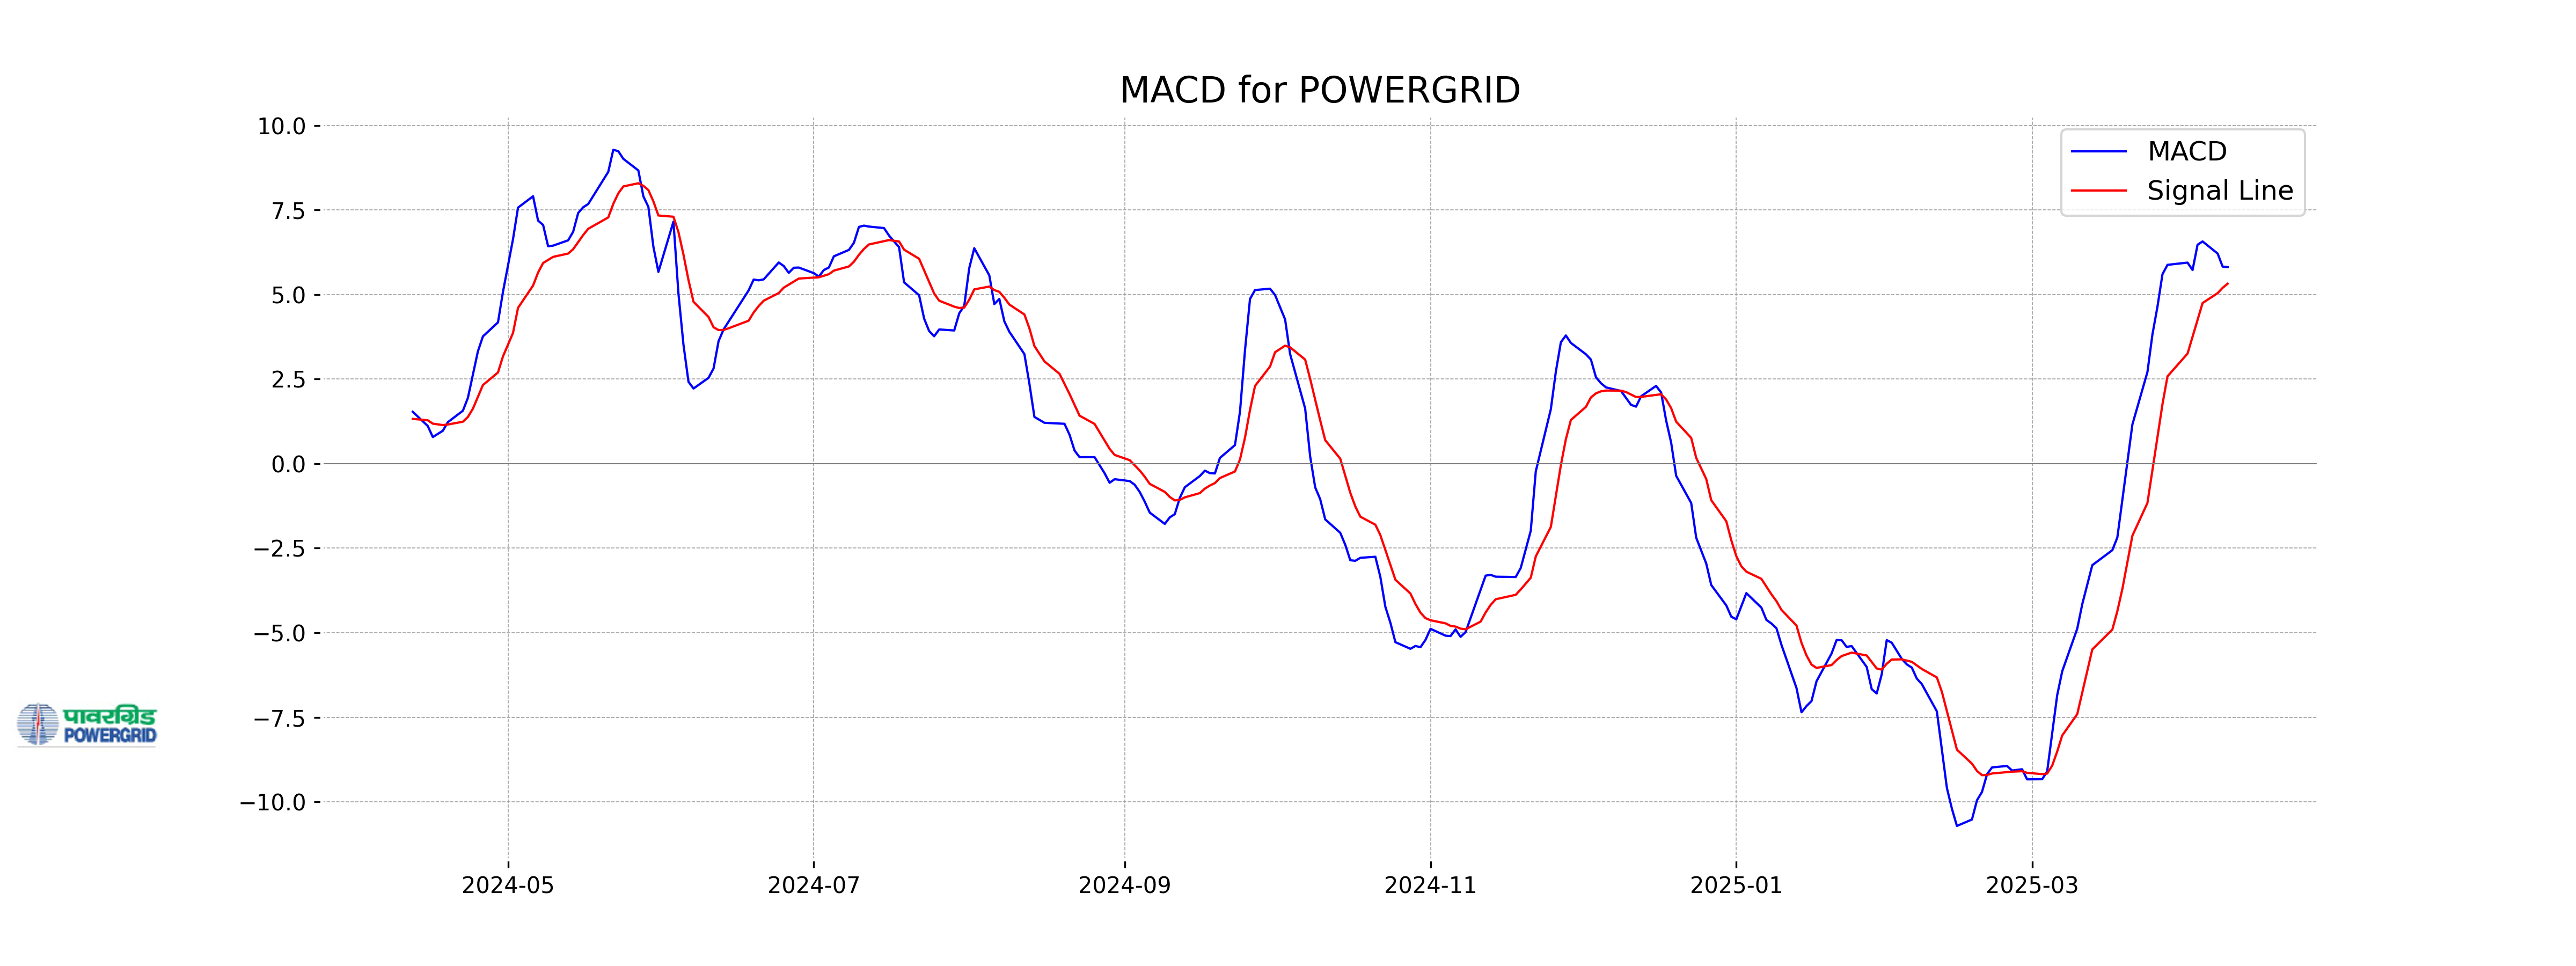
Moving Averages Trend (MACD)
Based on the MACD analysis for Power Grid, the MACD line is currently above the MACD Signal line, indicating a bullish trend. The difference between the two values suggests that momentum in the stock's price movement is increasing. Investors may view this as a positive signal for potential upward movement in the stock price.
RSI Analysis
The RSI value for Power Grid is 60.27, which suggests that the stock is in a neutral range, leaning towards being overbought. Typically, an RSI above 70 is considered overbought, and below 30 is considered oversold. Thus, the current RSI indicates a moderate uptrend in the stock's momentum.
Analysis for Tata Consumer - April 10, 2025

Tata Consumer Tata Consumer showed a positive performance with a closing price of 1089.75, marking a 1.87% increase from its previous close of 1069.75. It has a significant trading volume of 2,274,161 shares, indicating active market interest. With a market cap of approximately 1,078.85 billion INR, the company is positioned in the Consumer Defensive sector, focusing on Packaged Foods in India.
Relationship with Key Moving Averages
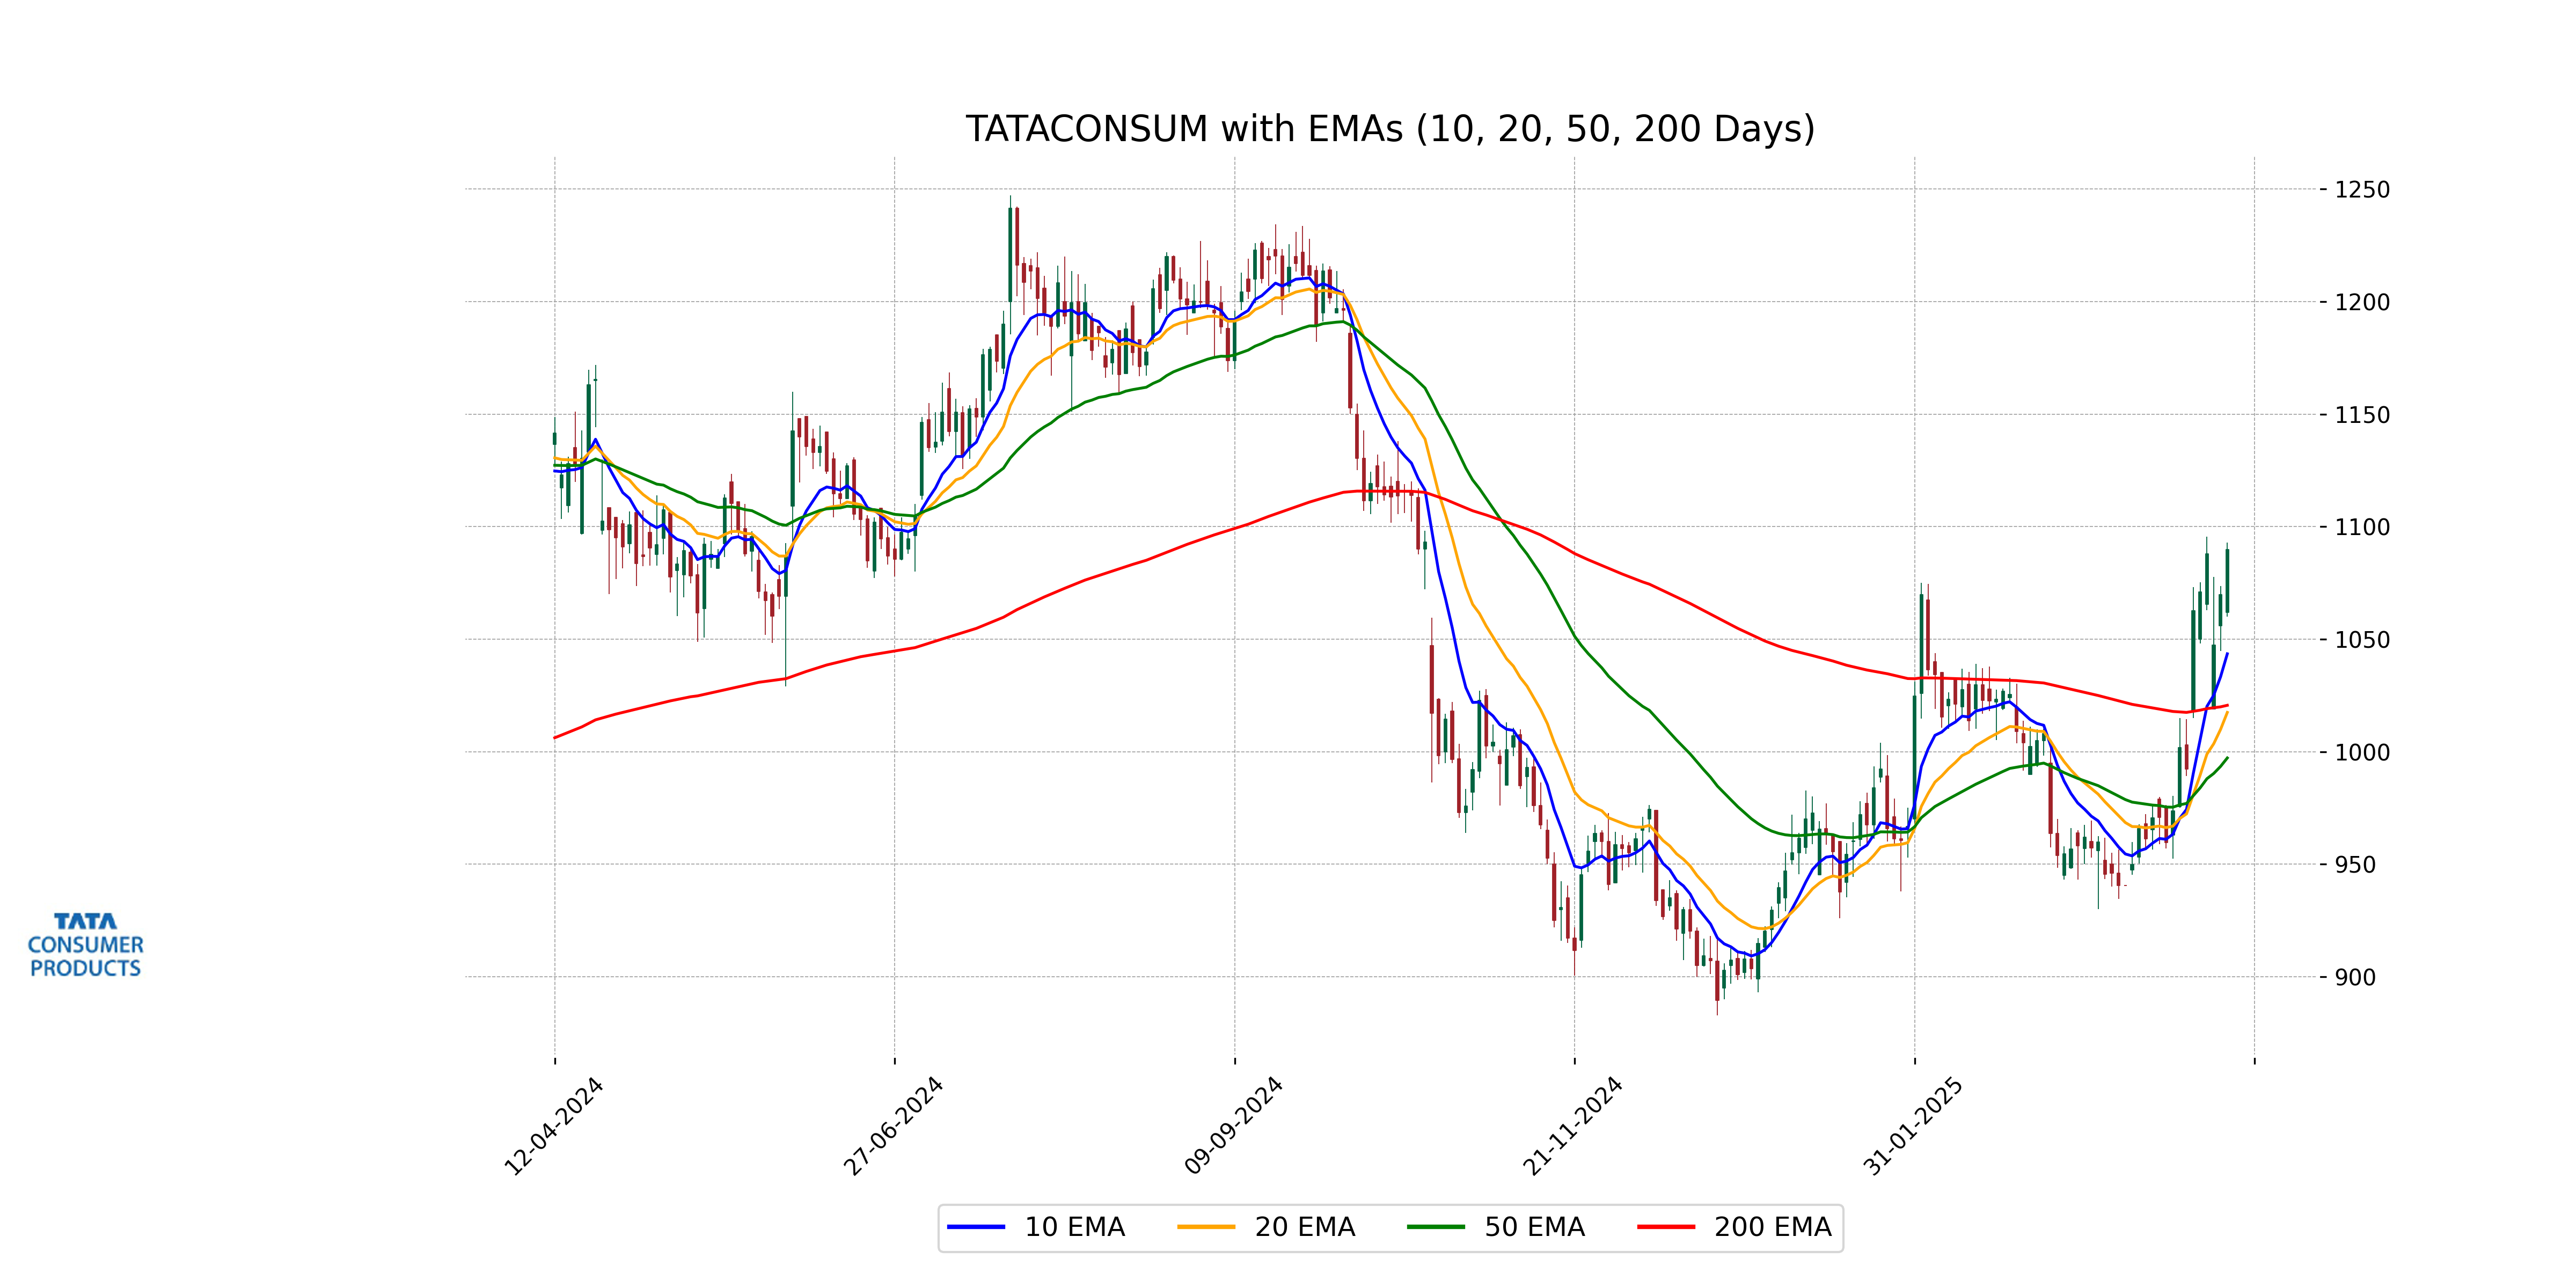
Tata Consumer's current closing price of 1089.75 is above its 50-day EMA of 997.20, 10-day EMA of 1043.47, 20-day EMA of 1017.43, and 200-day EMA of 1020.60, indicating a bullish trend across key moving averages. The relative strength index (RSI) at 68.95 suggests that the stock is close to being overbought.
Moving Averages Trend (MACD)
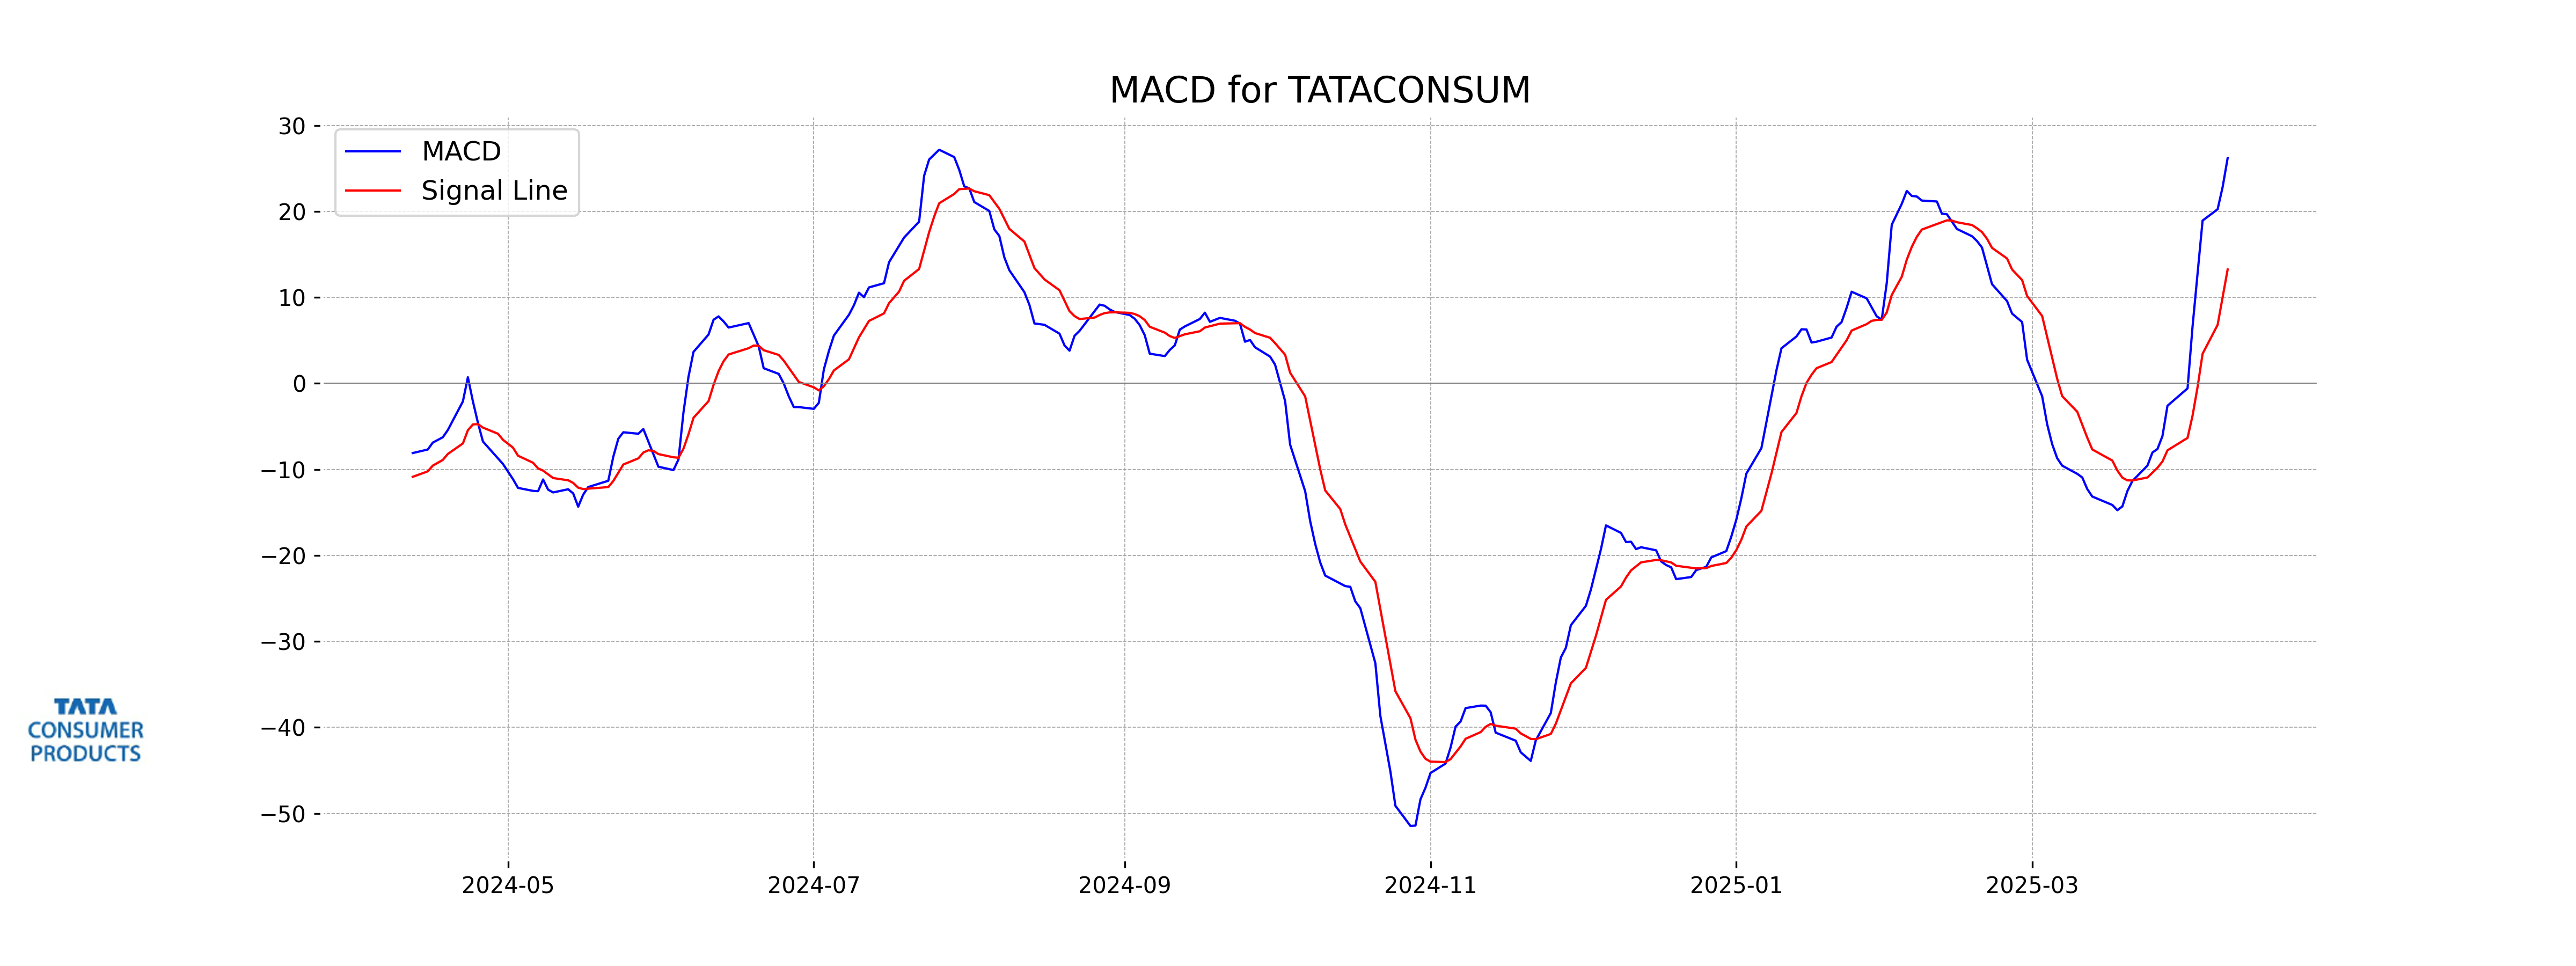
MACD Analysis for Tata Consumer The MACD (Moving Average Convergence Divergence) for Tata Consumer is currently at 26.21, with a MACD Signal at 13.25, indicating a positive divergence. This suggests a potential bullish momentum as the MACD line is above the signal line, pointing towards a possible uptrend in the stock's price.
RSI Analysis
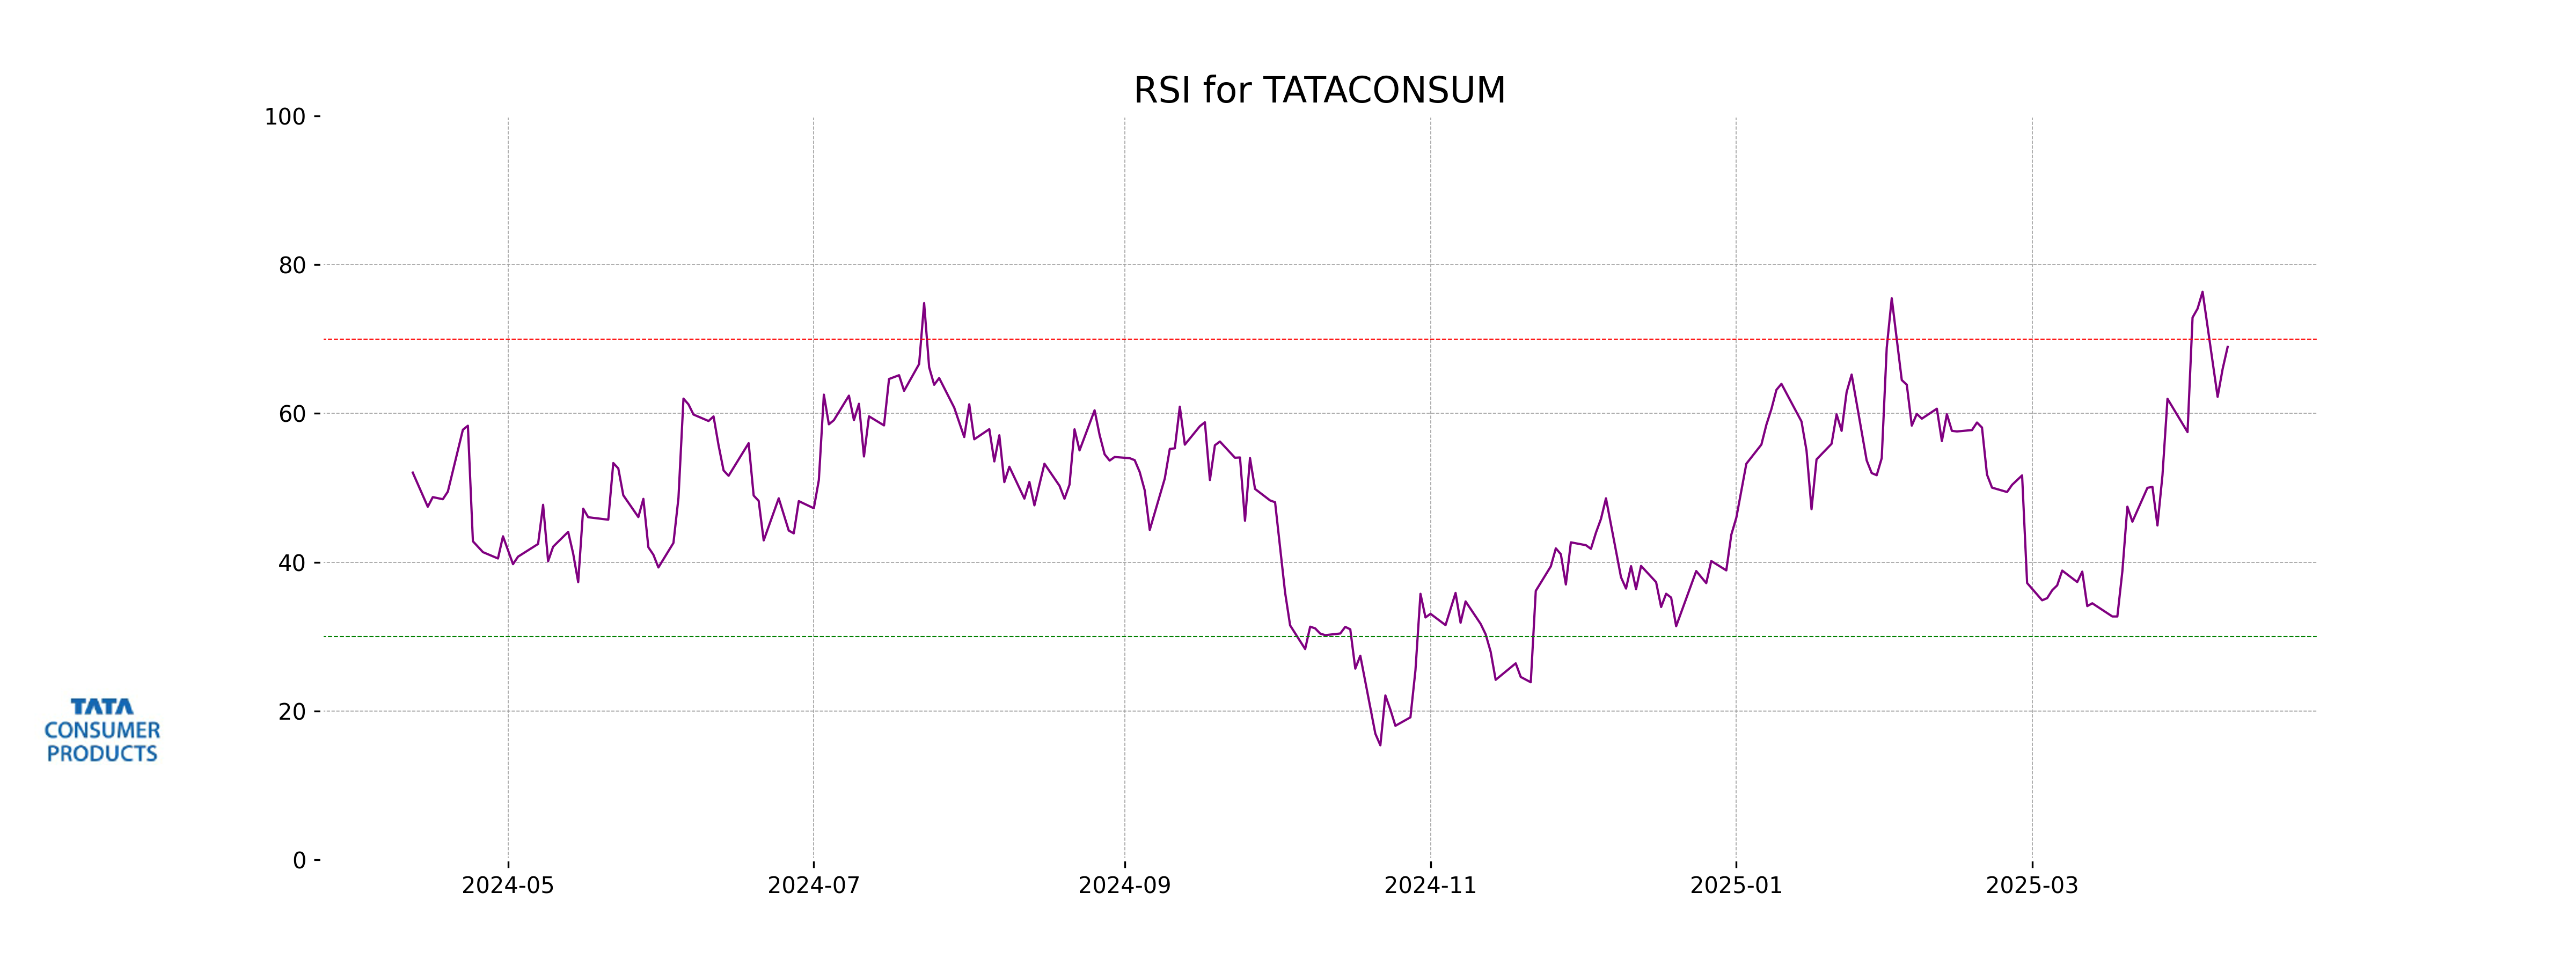
RSI Analysis for Tata Consumer: The Relative Strength Index (RSI) for Tata Consumer is 68.95, which suggests that the stock is approaching the overbought territory. This may indicate a potential for a price correction or consolidation in the near term unless the buying momentum continues to push the RSI higher.
Analysis for Titan Company - April 10, 2025
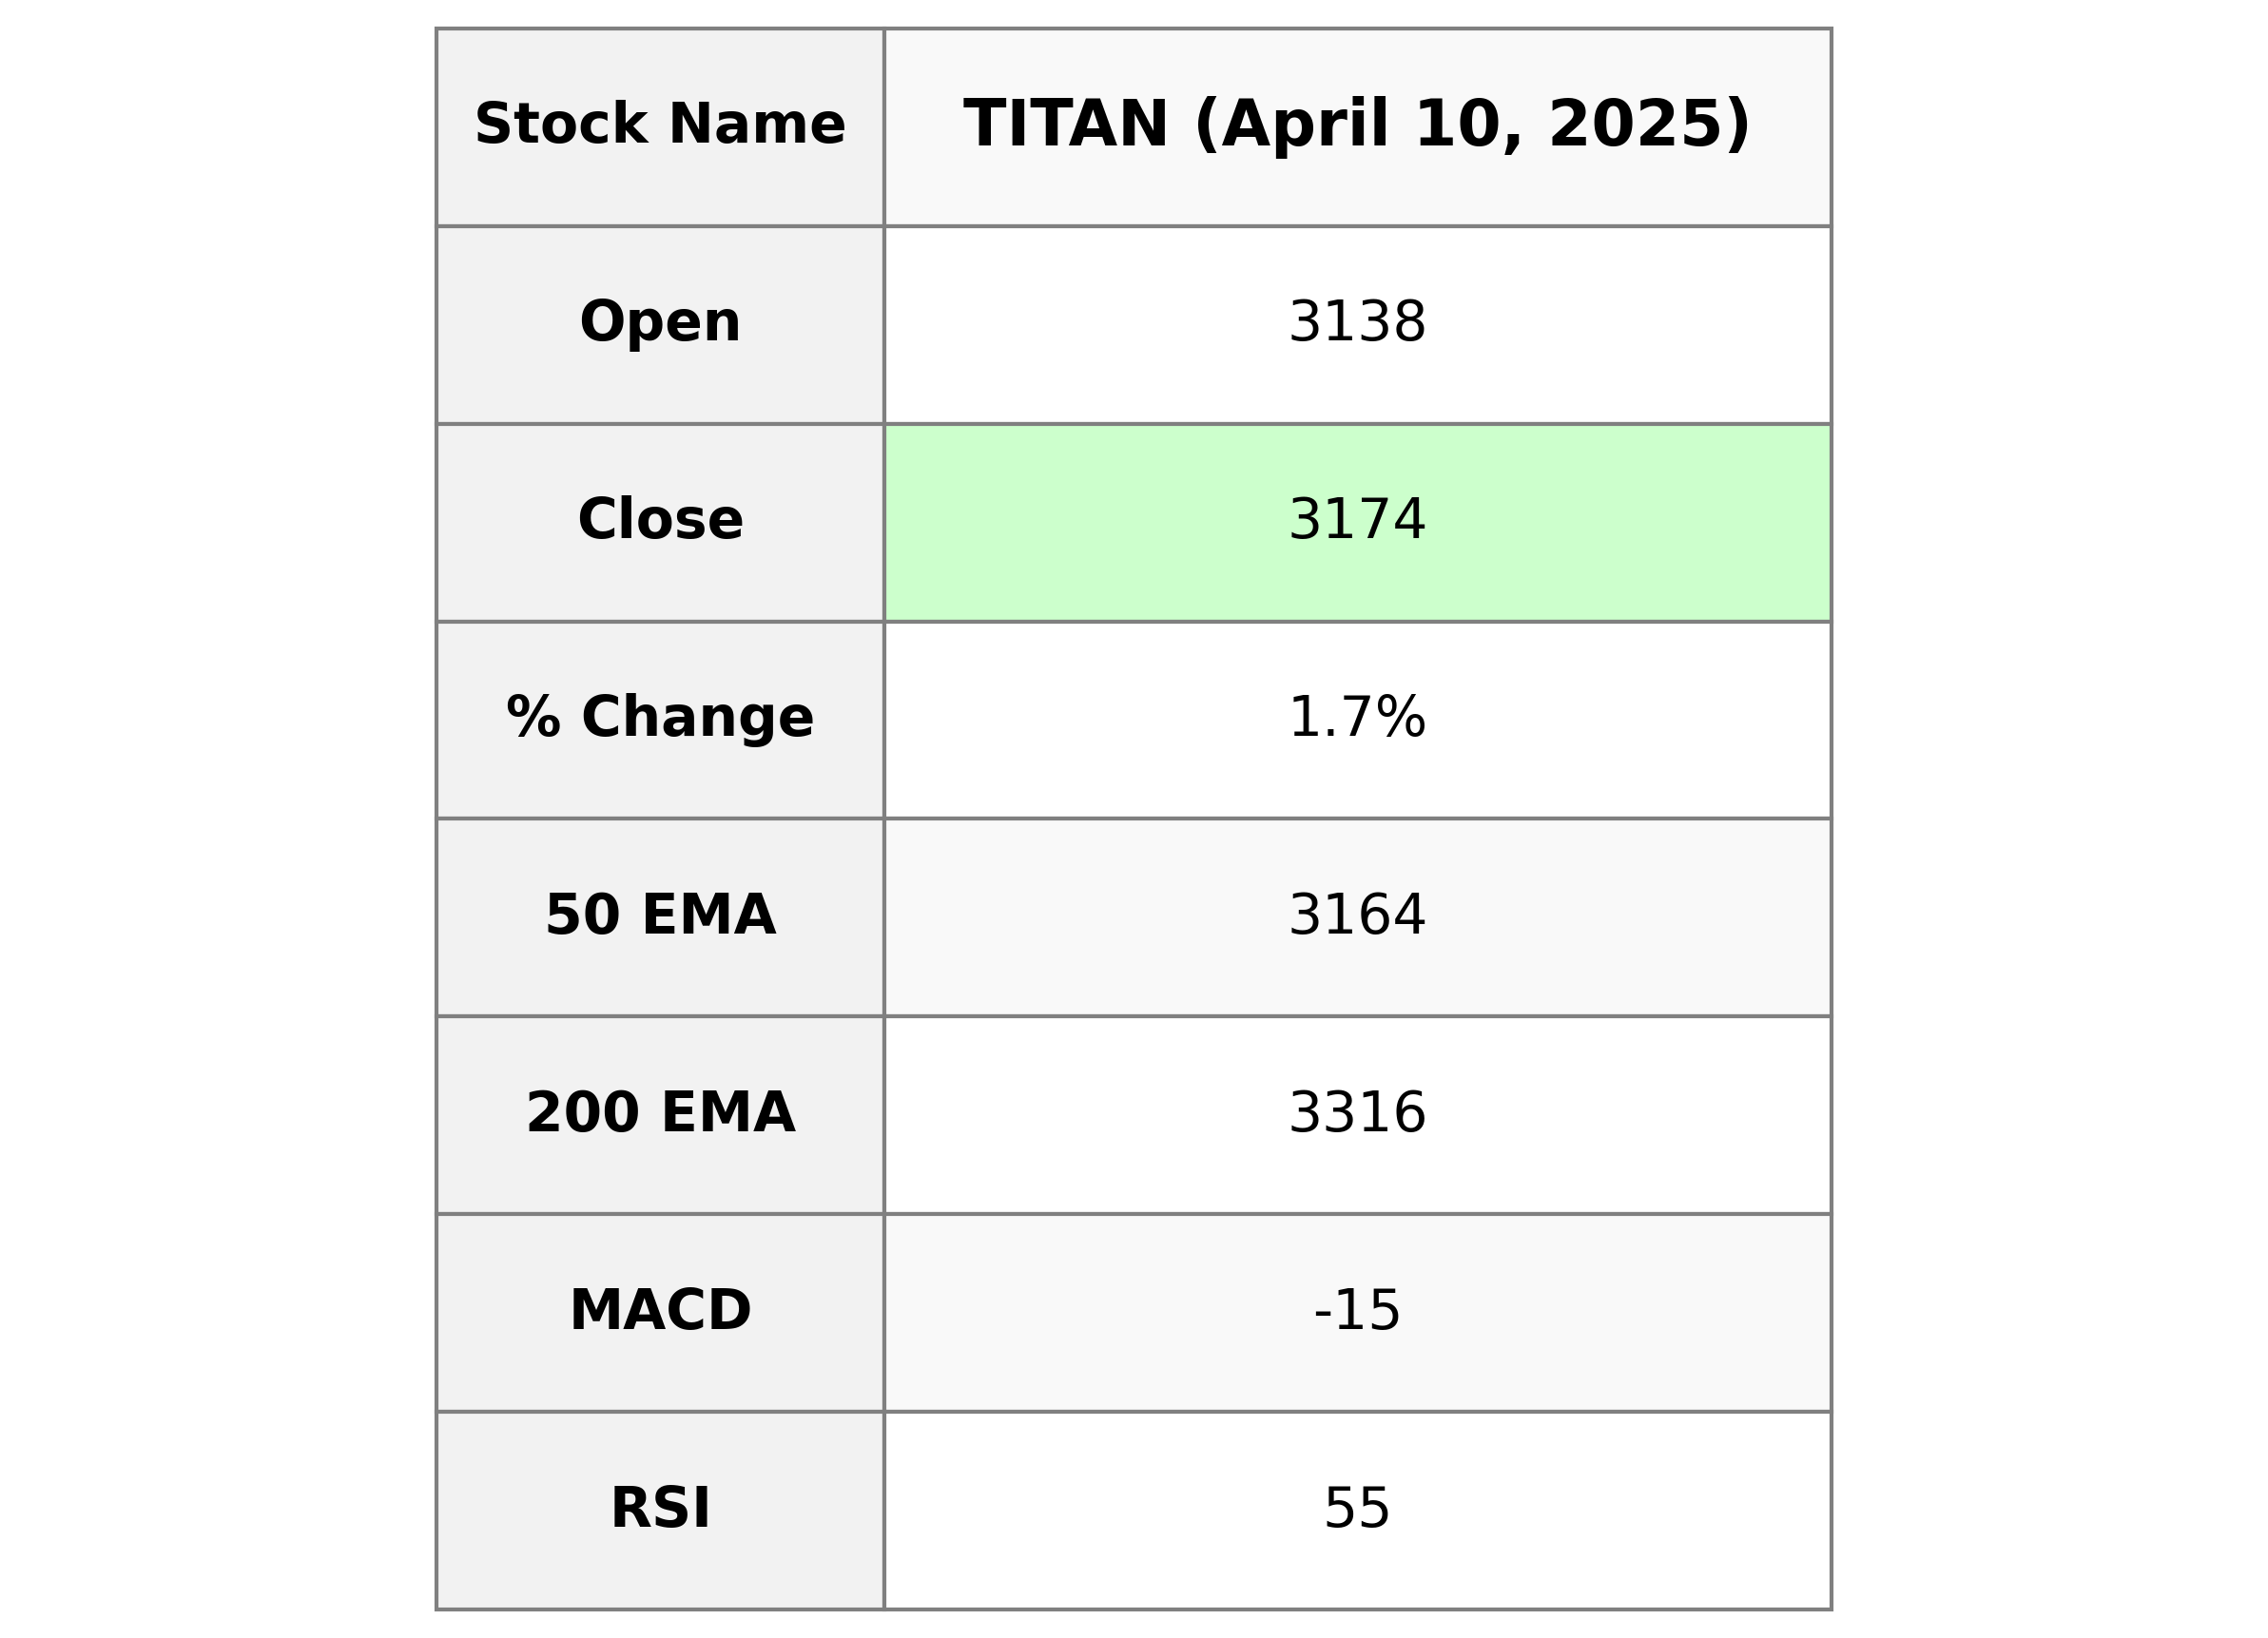
Titan Company has shown a notable performance with a closing price of 3174.15, marking a 1.66% increase from the previous close. The stock maintained a trading range between a low of 3090.70 and a high of 3188.25. Despite a lower 10-day and 20-day EMA, Titan's MACD indicates a negative momentum, while the RSI is moderately positioned at 55.04. The company holds a market capitalization of 2815.61 billion INR and a PE ratio of 86.96, indicating its strong presence in the luxury goods sector within the consumer cyclical industry in India.
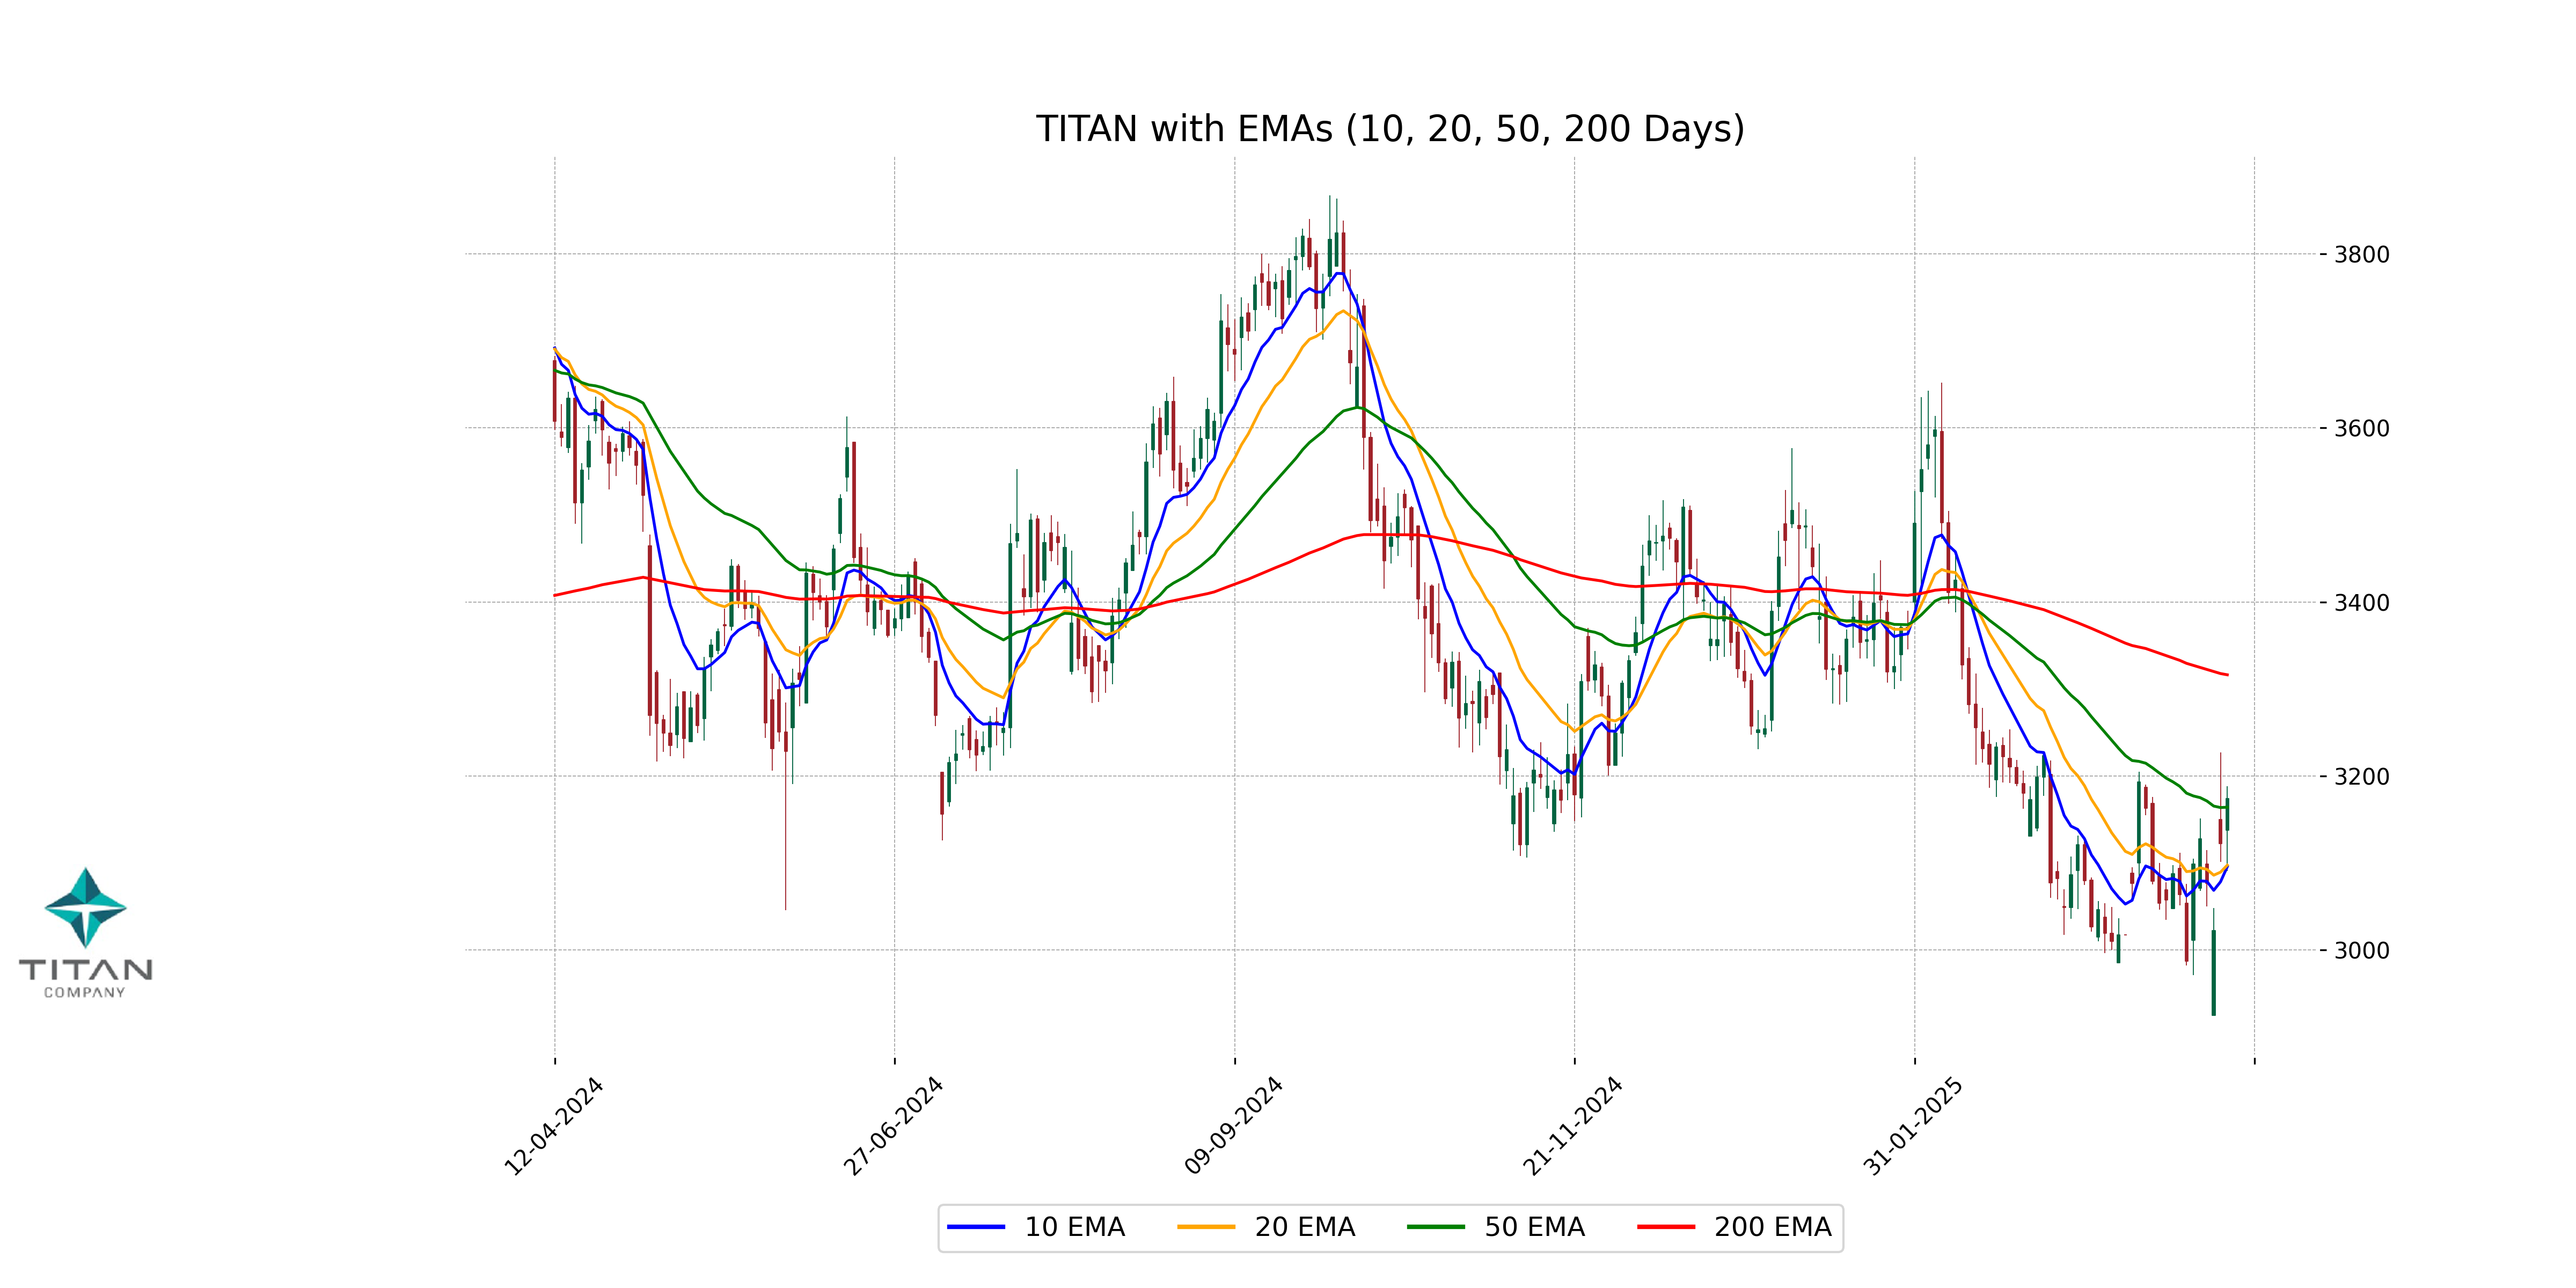
Relationship with Key Moving Averages
Titan Company's current closing price of 3174.15 is above both its 50-day EMA of 3164.03 and 10-day EMA of 3095.71, indicating a short-term positive momentum. However, it remains below the 200-day EMA of 3316.19, suggesting that the long-term trend still lags behind recent upward movements.
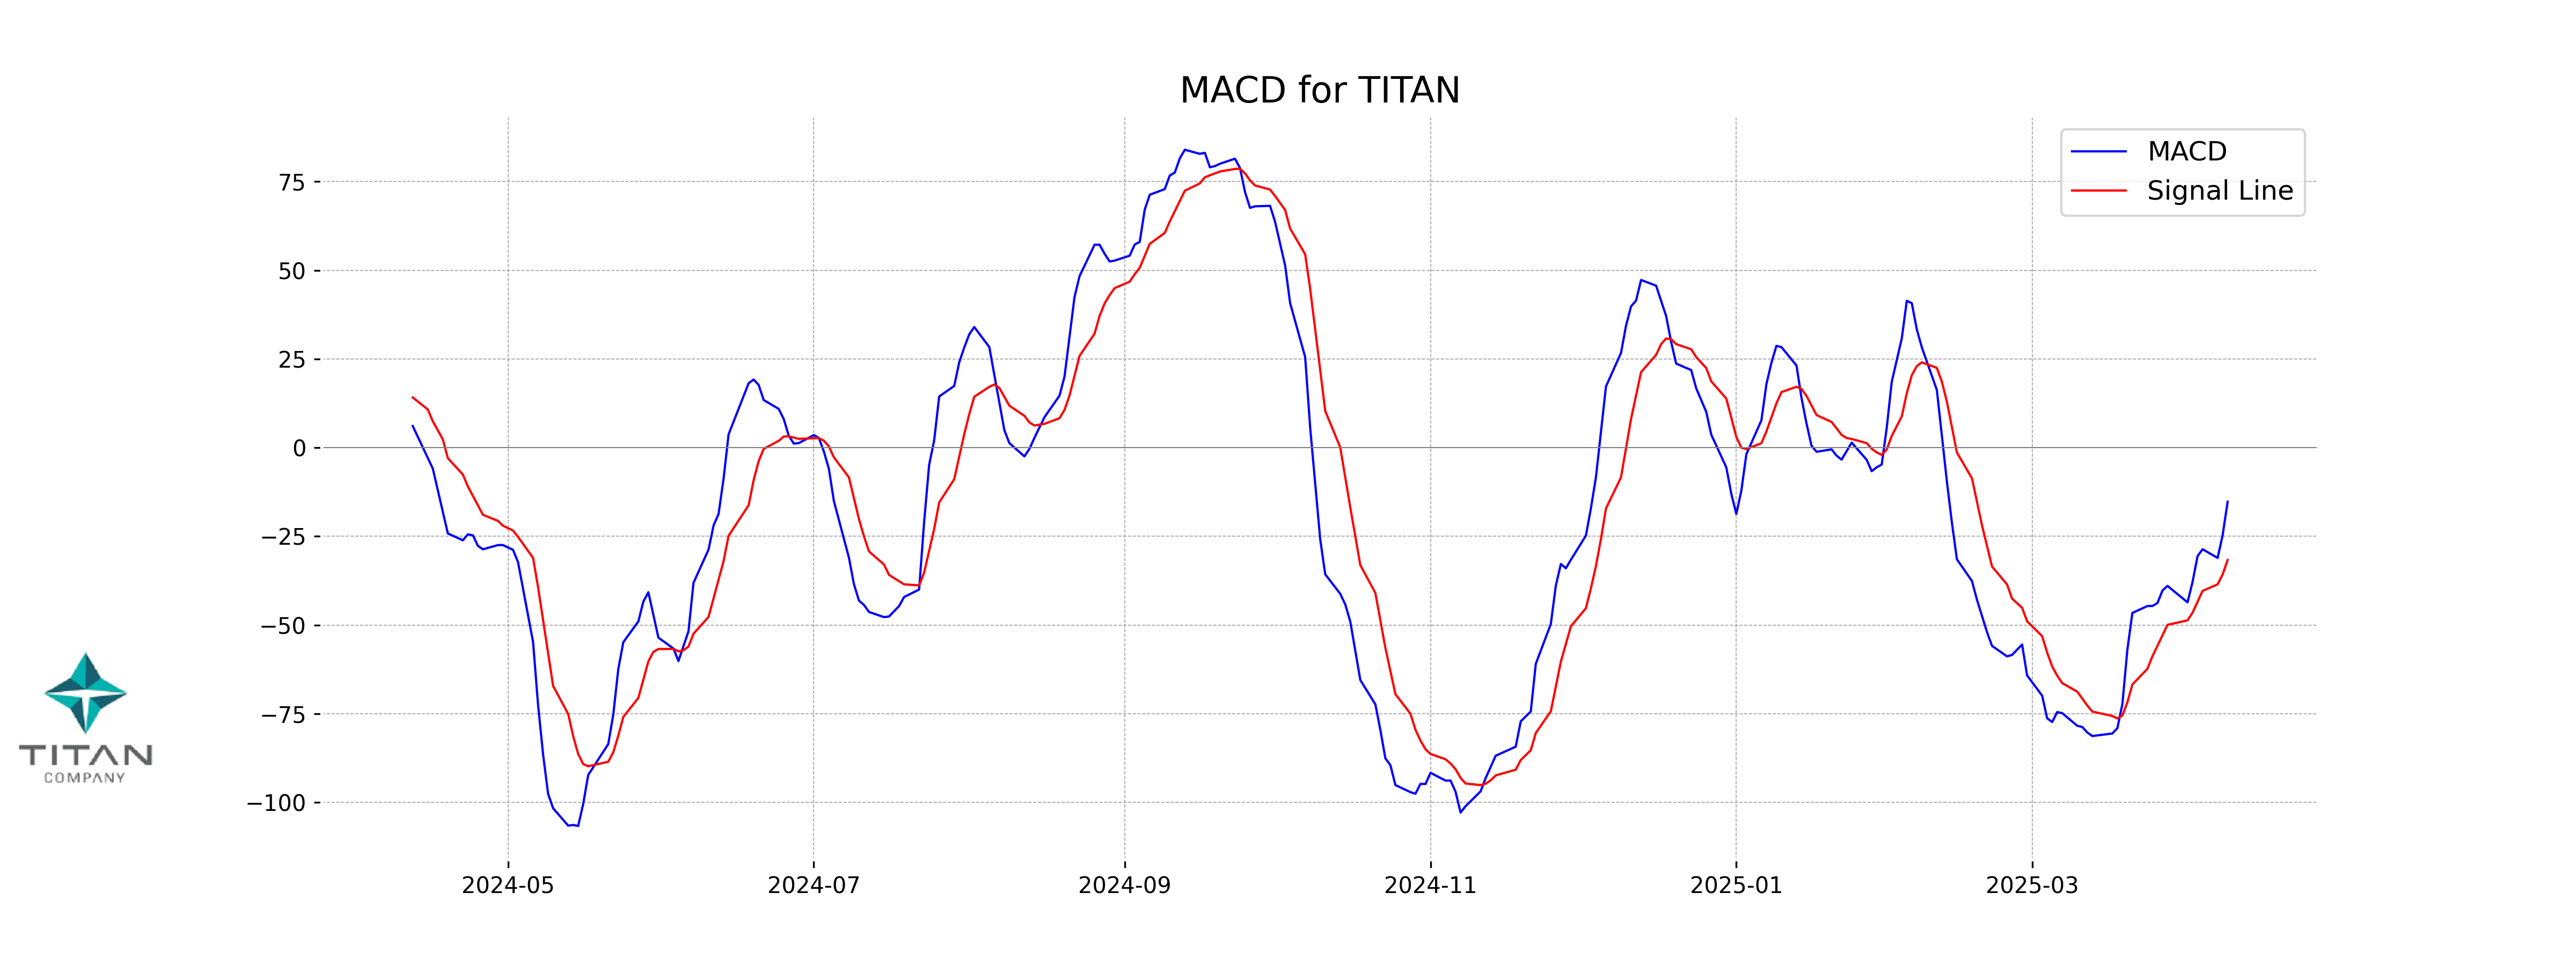
Moving Averages Trend (MACD)
Based on the given data, Titan Company's MACD value is -15.239, which is higher than the MACD Signal value of -31.662. This suggests a potential bullish crossover, indicating a possible uptrend continuation or reversal in the stock's current market trend.
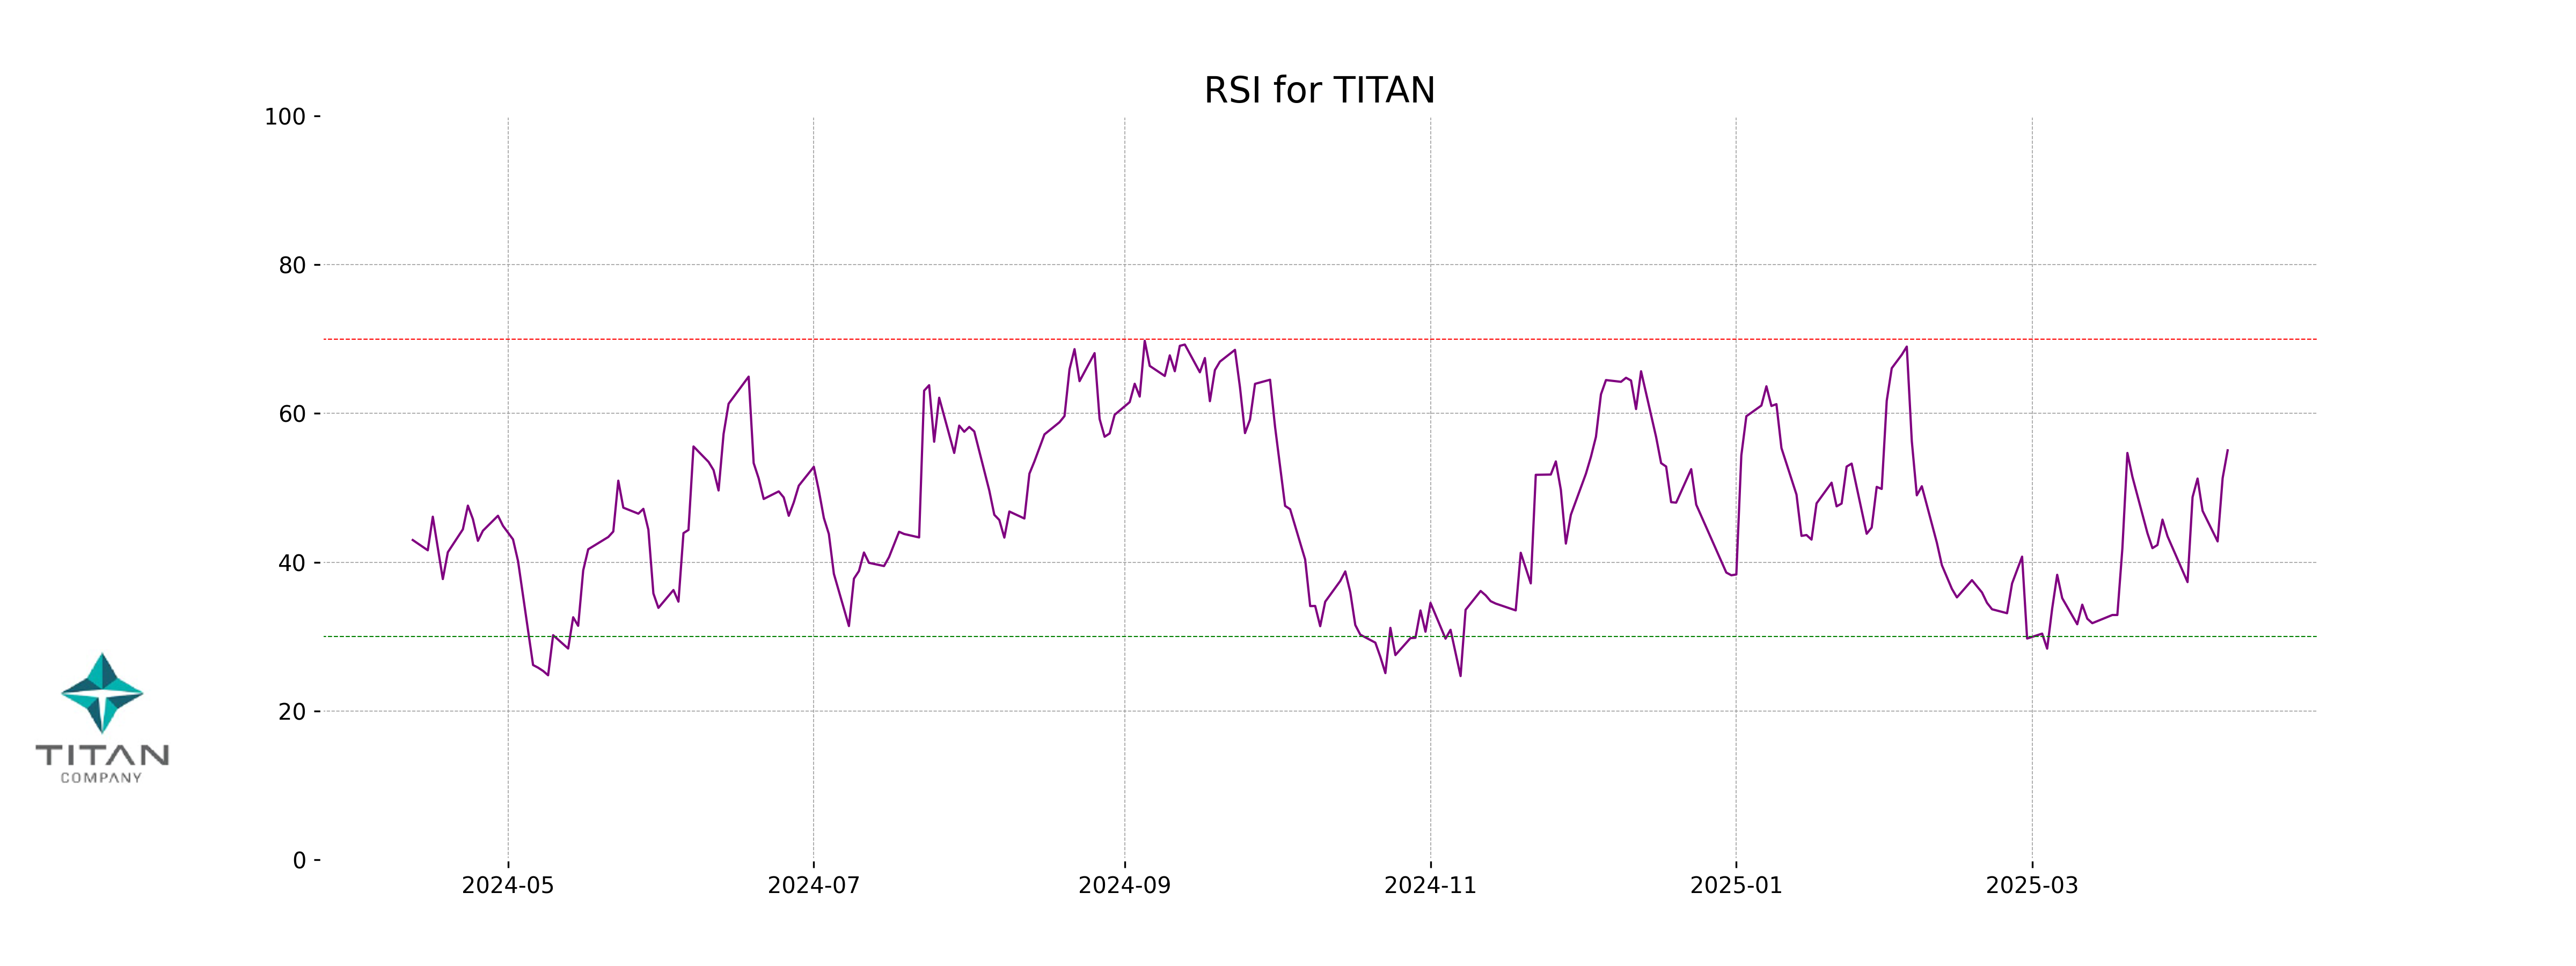
RSI Analysis
The RSI value for Titan Company is 55.04, which indicates a neutral momentum. This suggests that the stock is neither overbought nor oversold at the current levels, providing a balanced outlook for potential price movements.