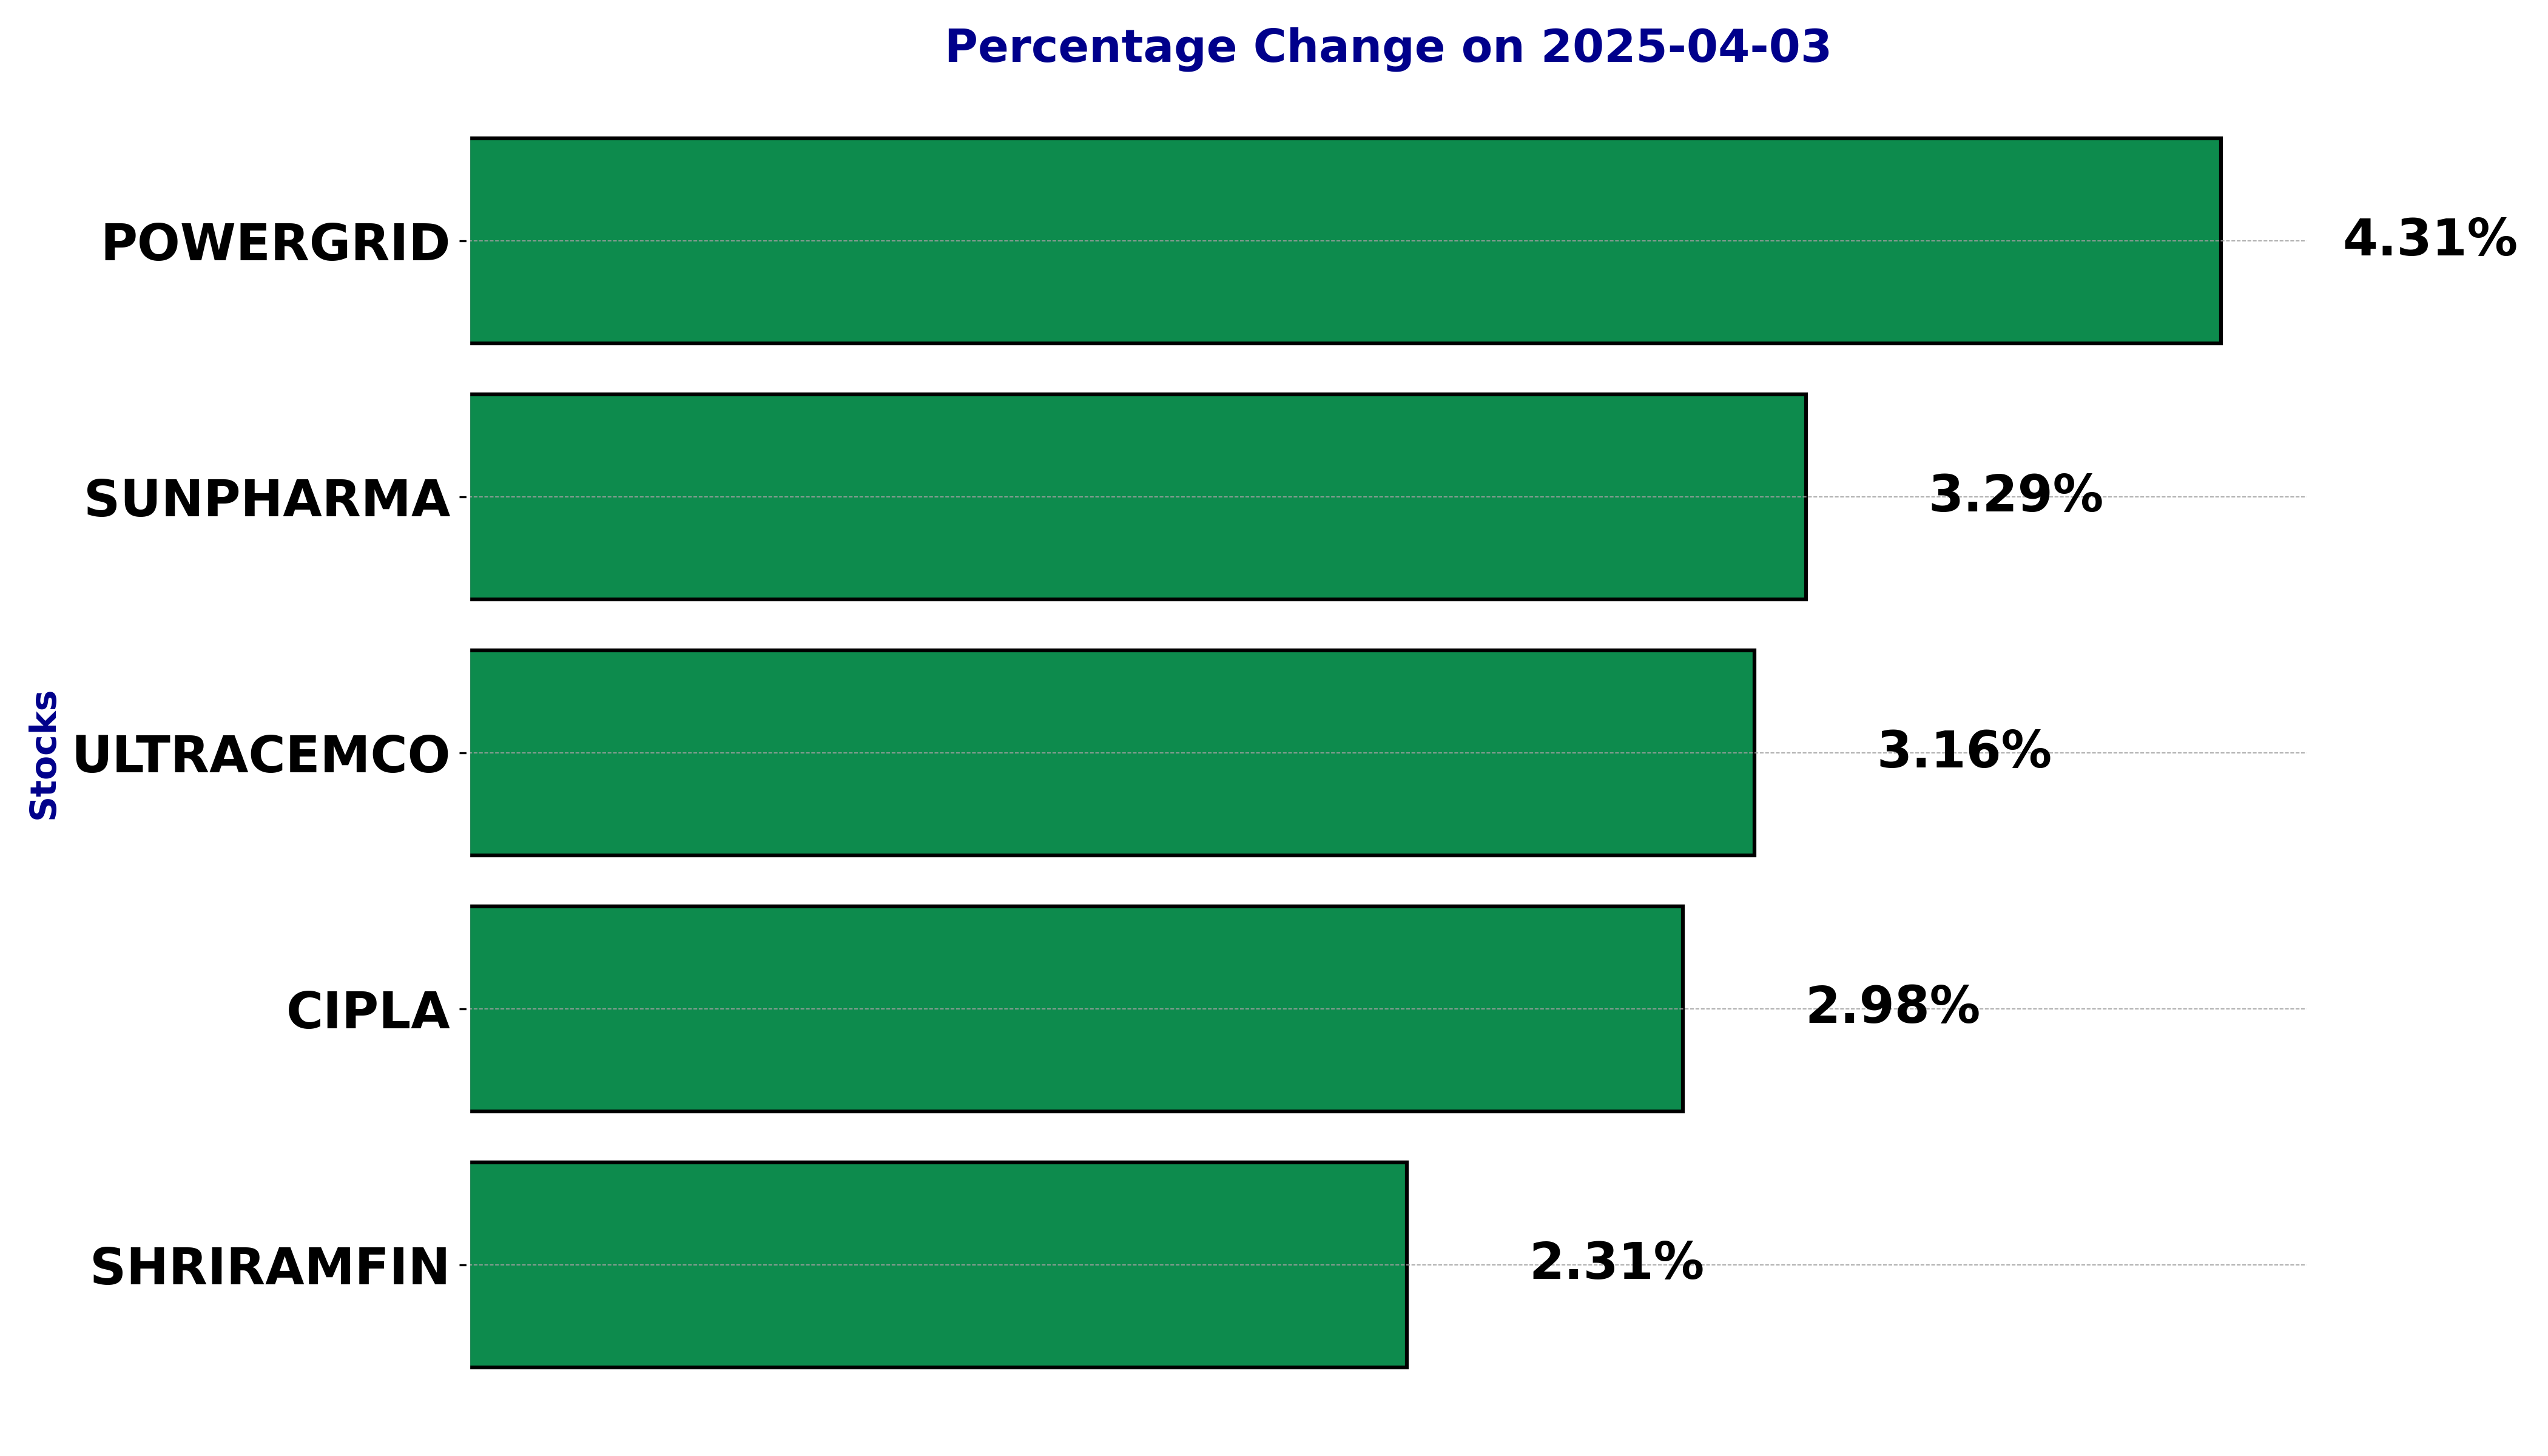
NSE Nifty 50 Top gainers: What are the 5 Biggest Stock gainers Today April 03, 2025
In this article, we will explore the technical indicators of some of the high-performing stocks on the Indian stock market, including CIPLA, POWERGRID, SHRIRAMFIN, SUNPHARMA, and ULTRACEMCO.
By looking at these stocks through the lens of key technical factors, we aim to better understand their price movements, trends, and potential future performance.
Analysis for Cipla - April 03, 2025
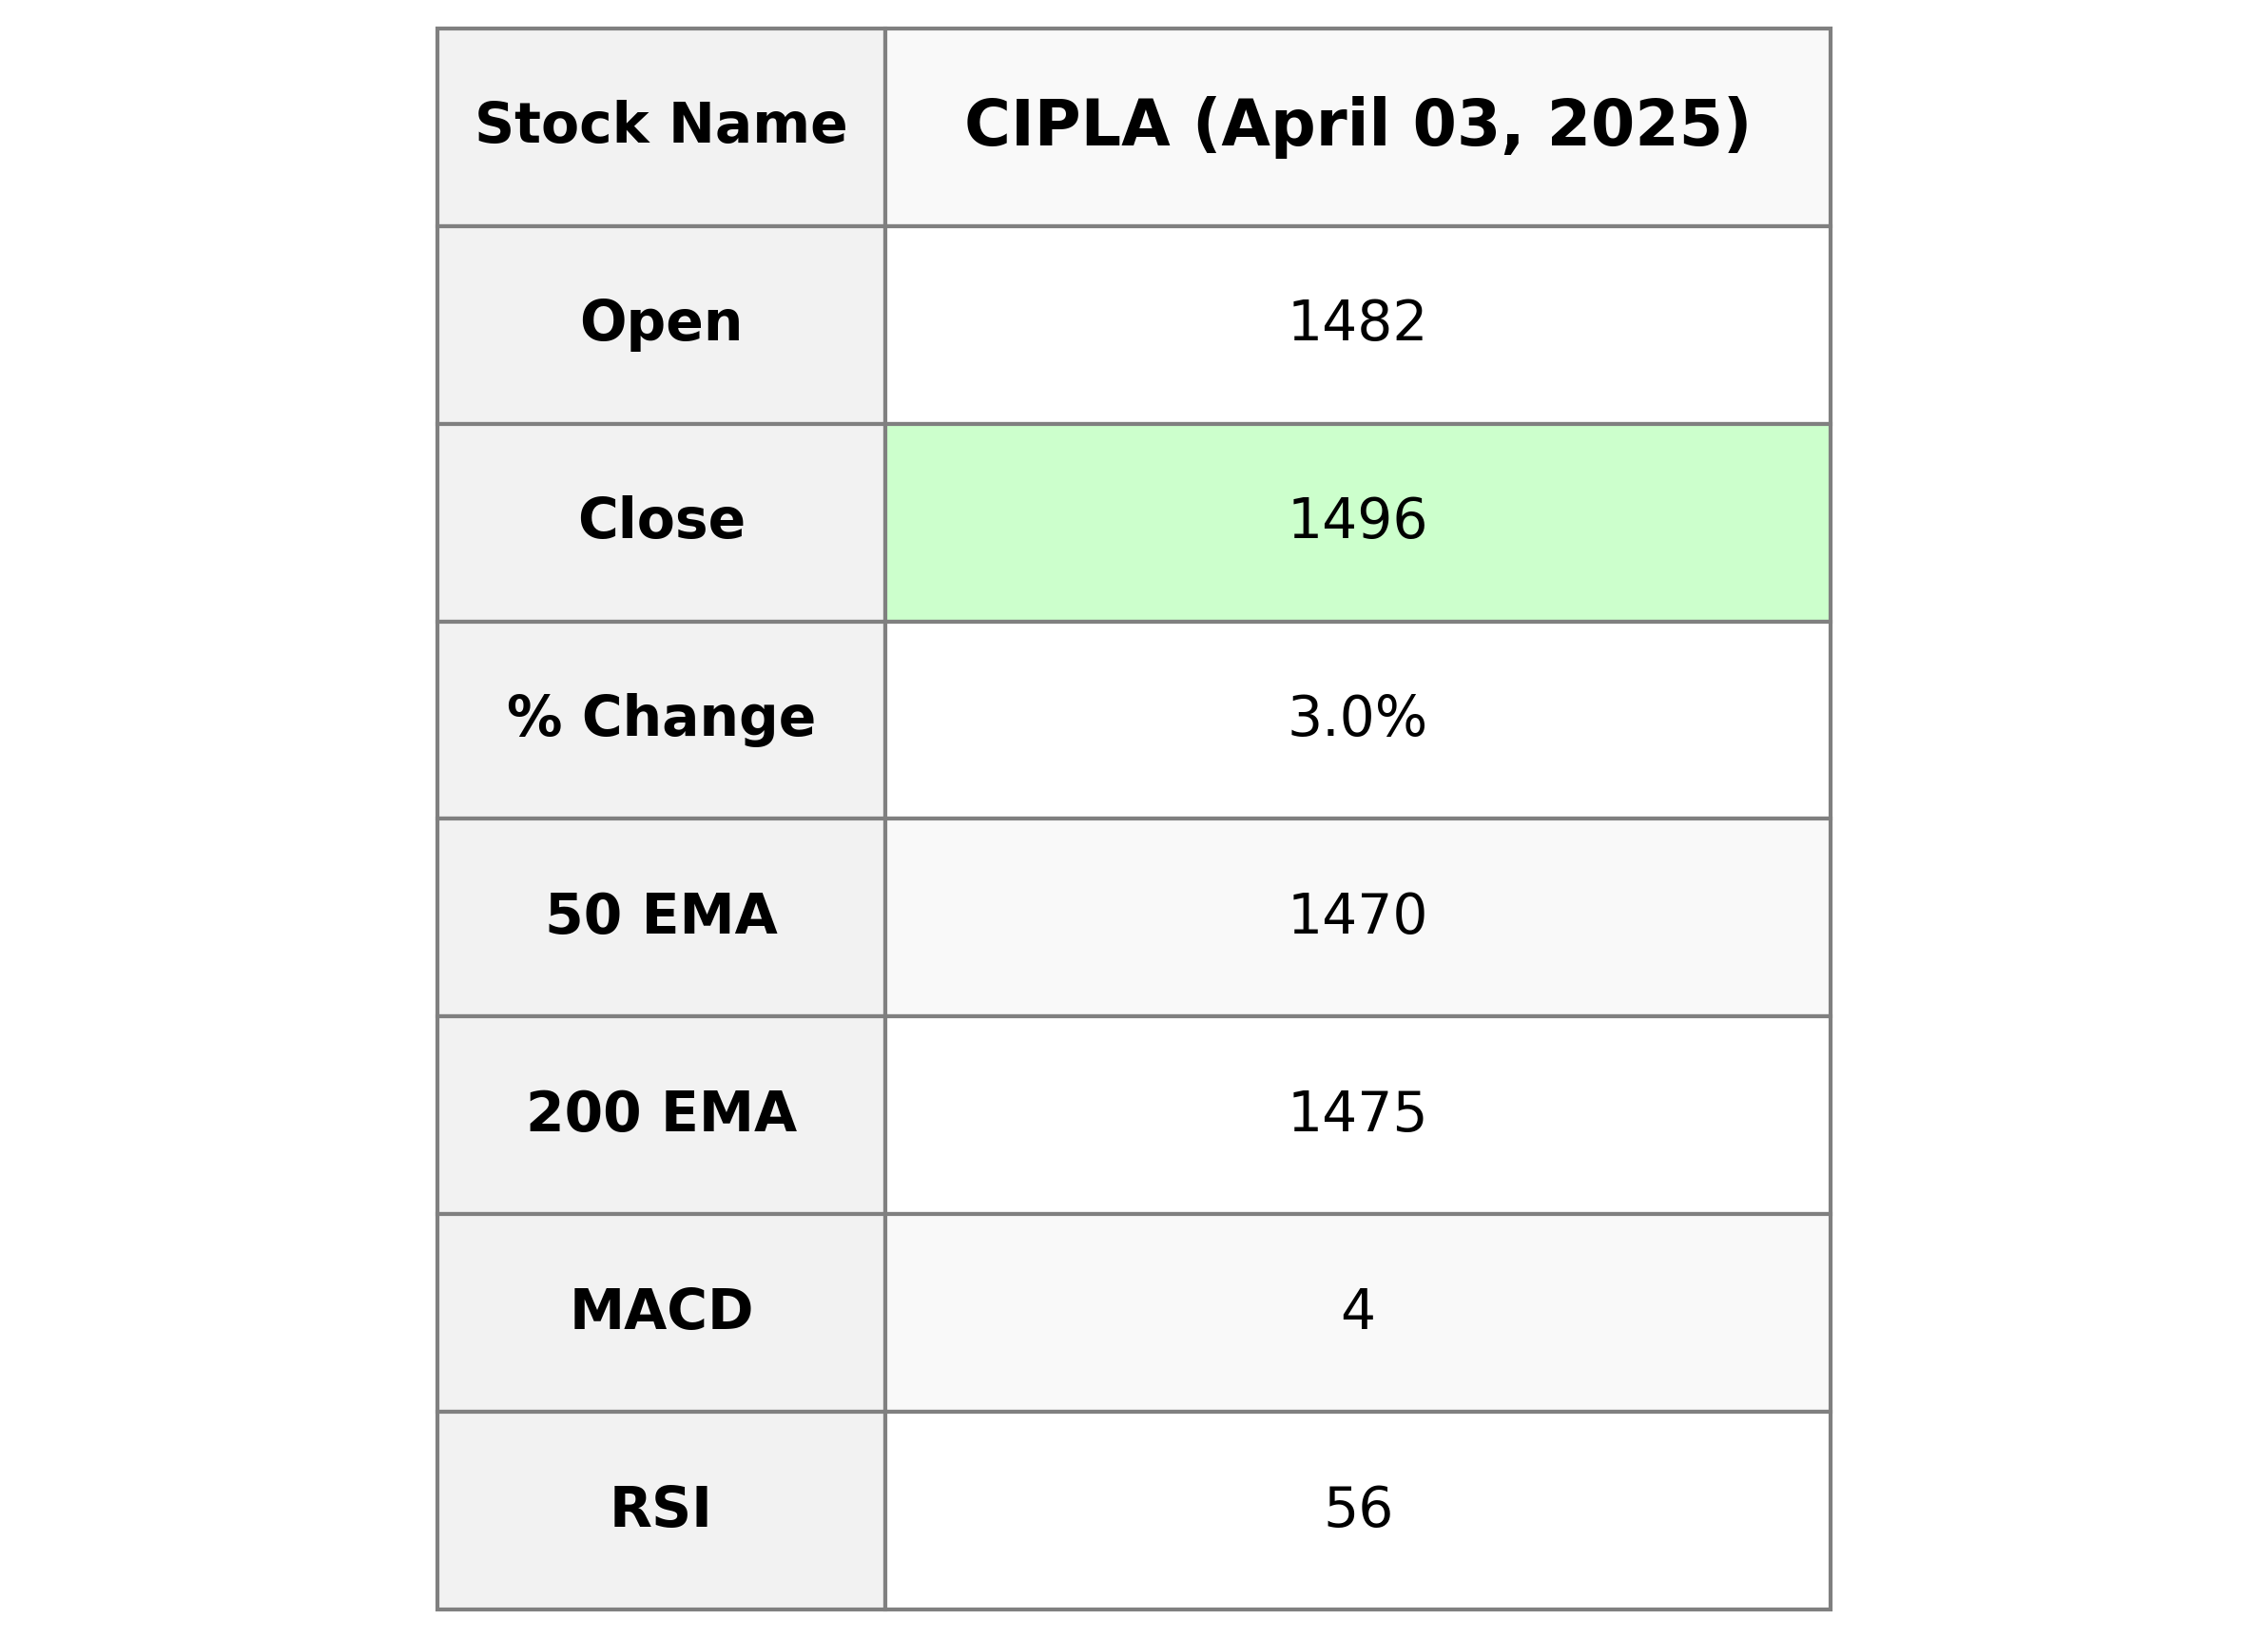
Cipla saw a positive performance with a close of 1495.70, marking a 2.98% increase from the previous close. The stock displayed a robust trading day with a high of 1523.30, backed by an above-average RSI of 55.76, suggesting moderate bullish momentum.
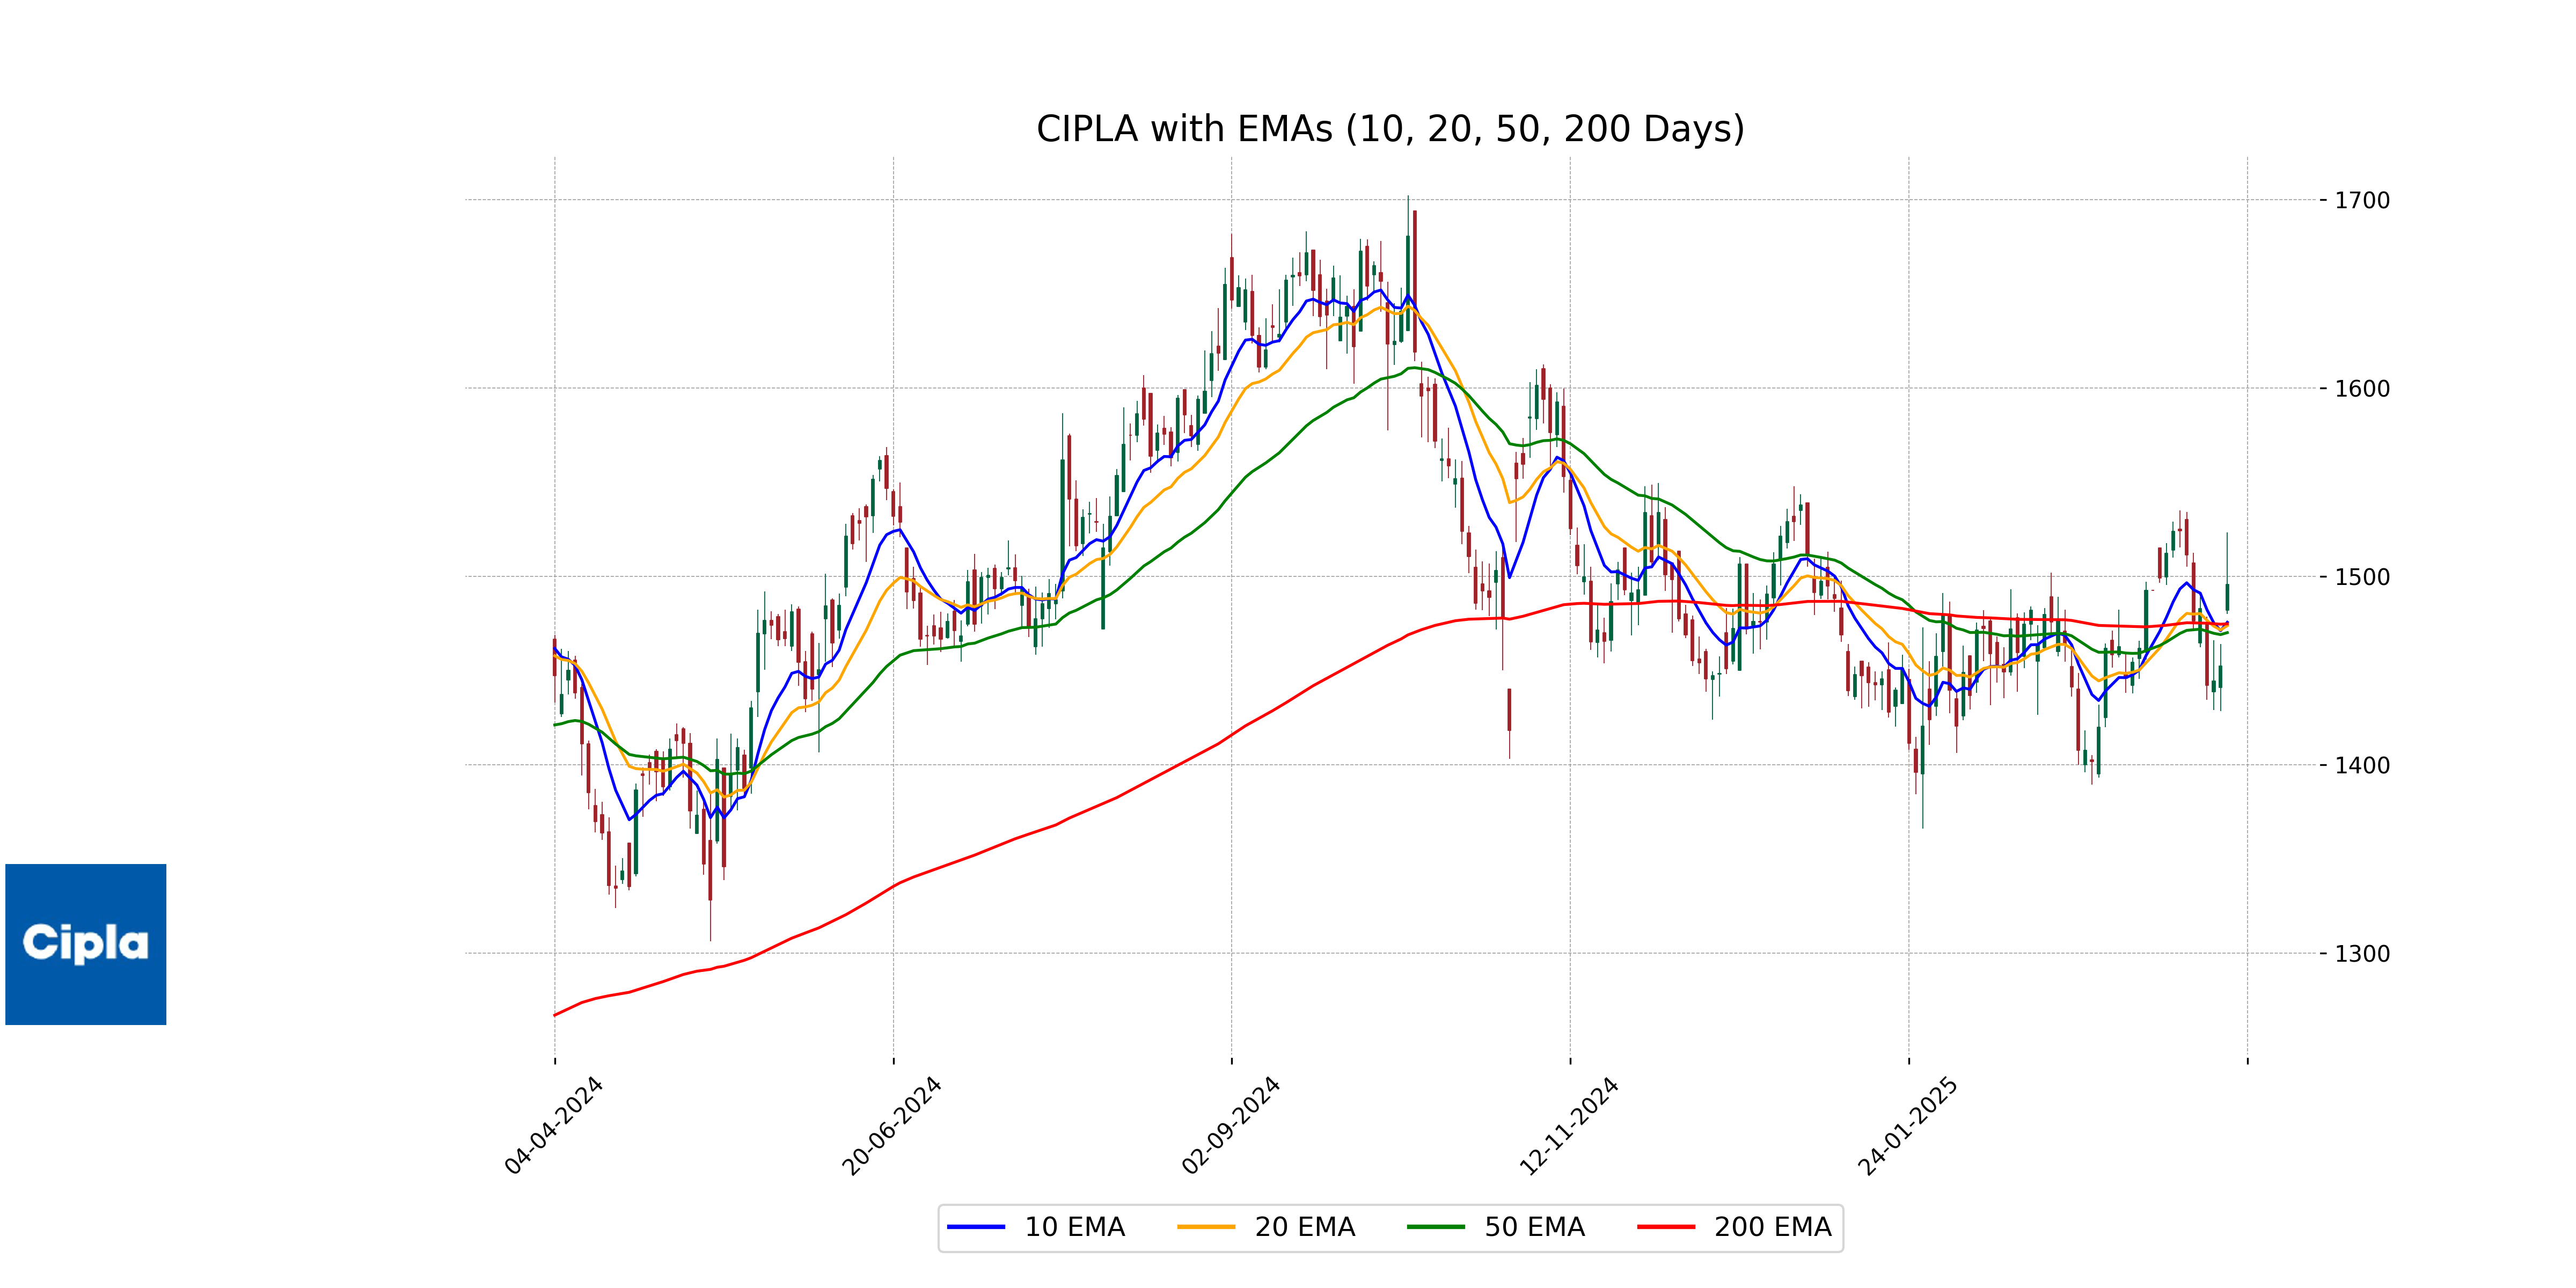
Relationship with Key Moving Averages
Cipla's stock closed at 1495.70, which is above its 50-day EMA of 1470.07, 200-day EMA of 1474.75, 10-day EMA of 1475.57, and 20-day EMA of 1473.78. This indicates a current strong performance compared to these key moving averages.
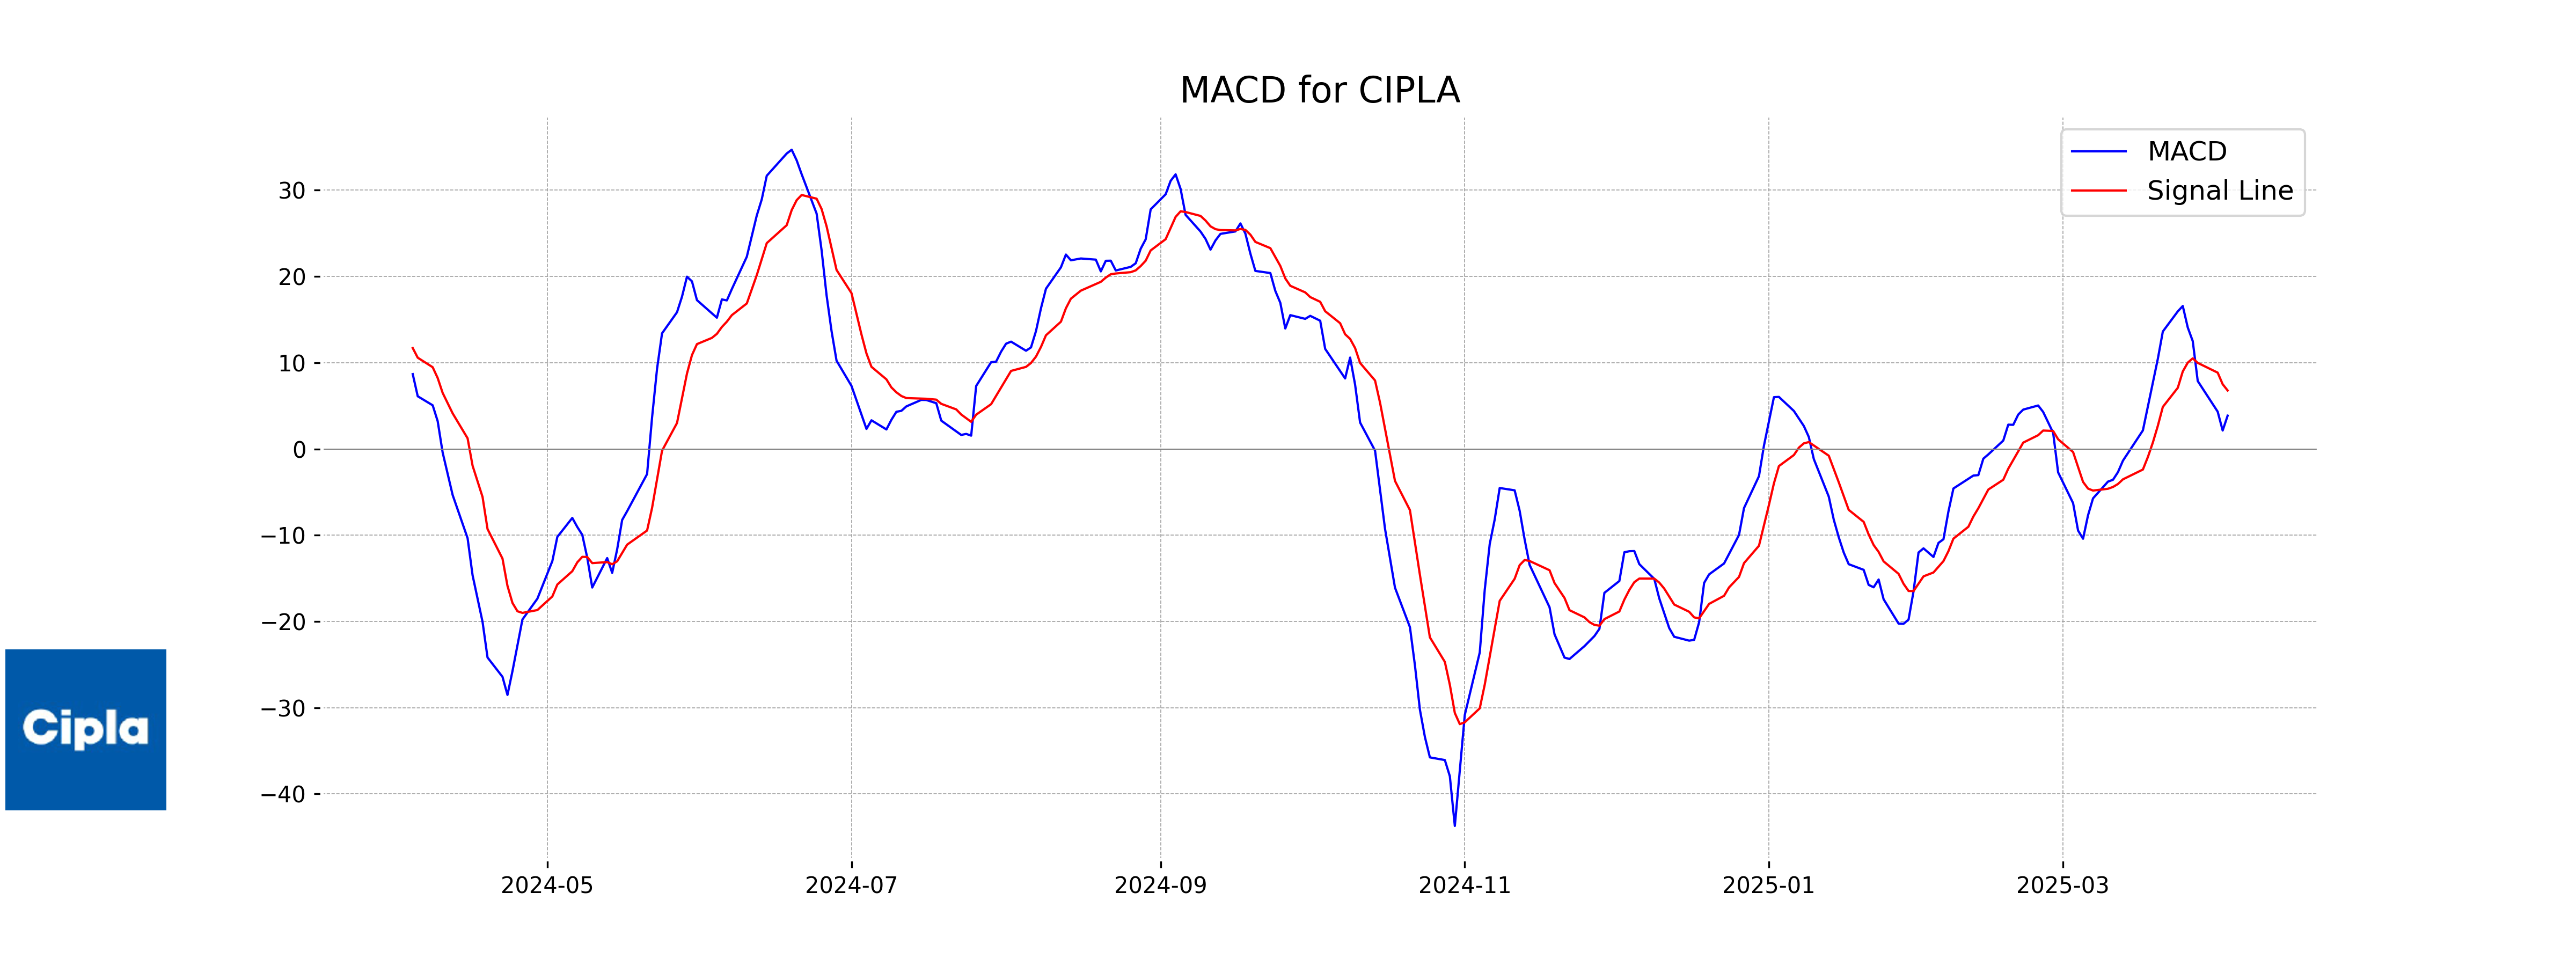
Moving Averages Trend (MACD)
MACD Analysis for Cipla: The MACD value for Cipla stands at 3.858, while the MACD Signal is higher at 6.774. This suggests a bearish trend, indicating that the stock may face potential downward pressure in the short term if the MACD line does not cross above the signal line.
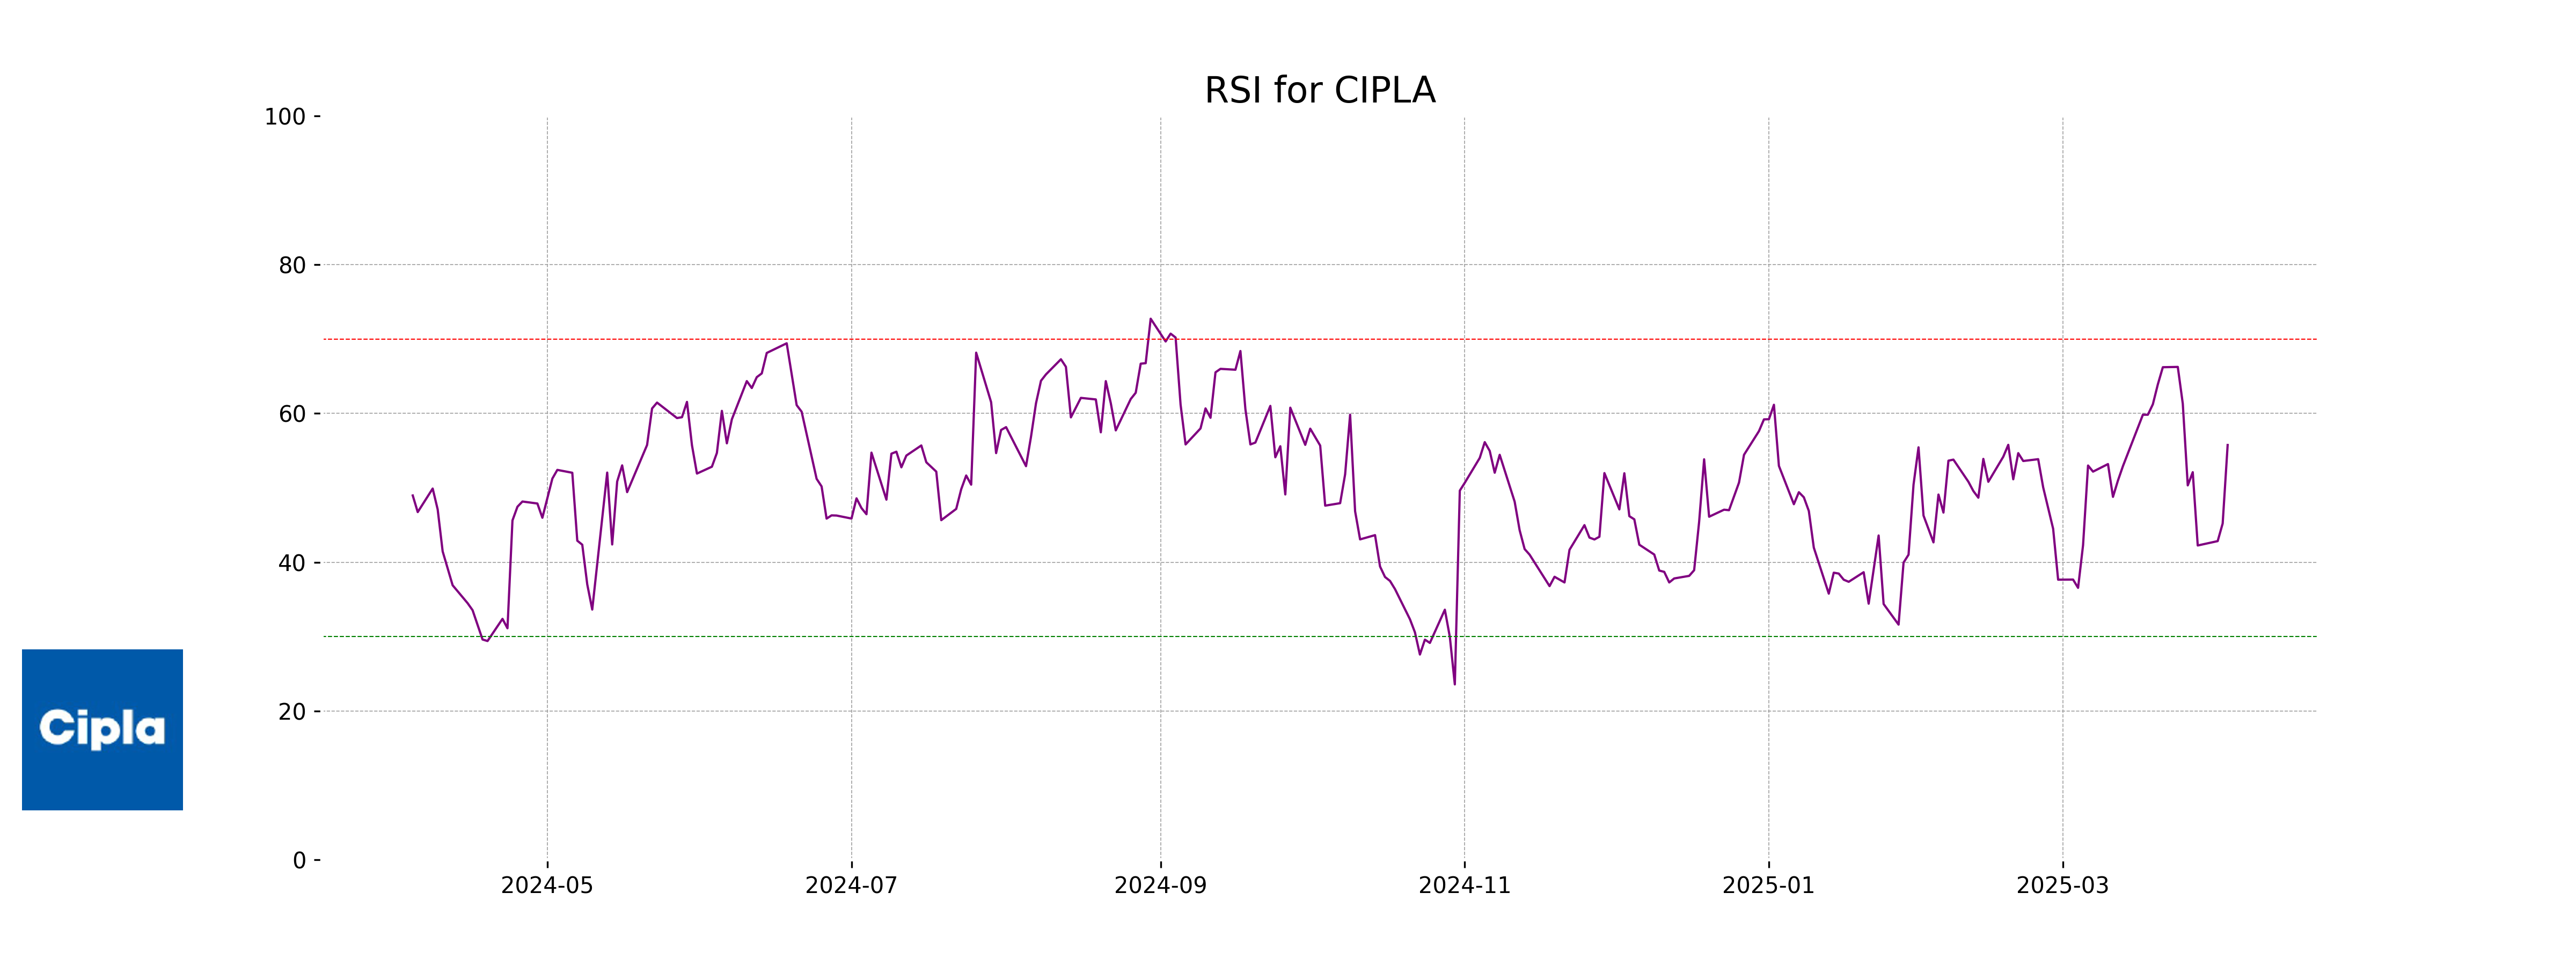
RSI Analysis
The RSI for Cipla is 55.76, which indicates a neutral position, suggesting that the stock is neither overbought nor oversold. This RSI level implies a balanced momentum in the stock's recent price changes.
Analysis for Power Grid - April 03, 2025
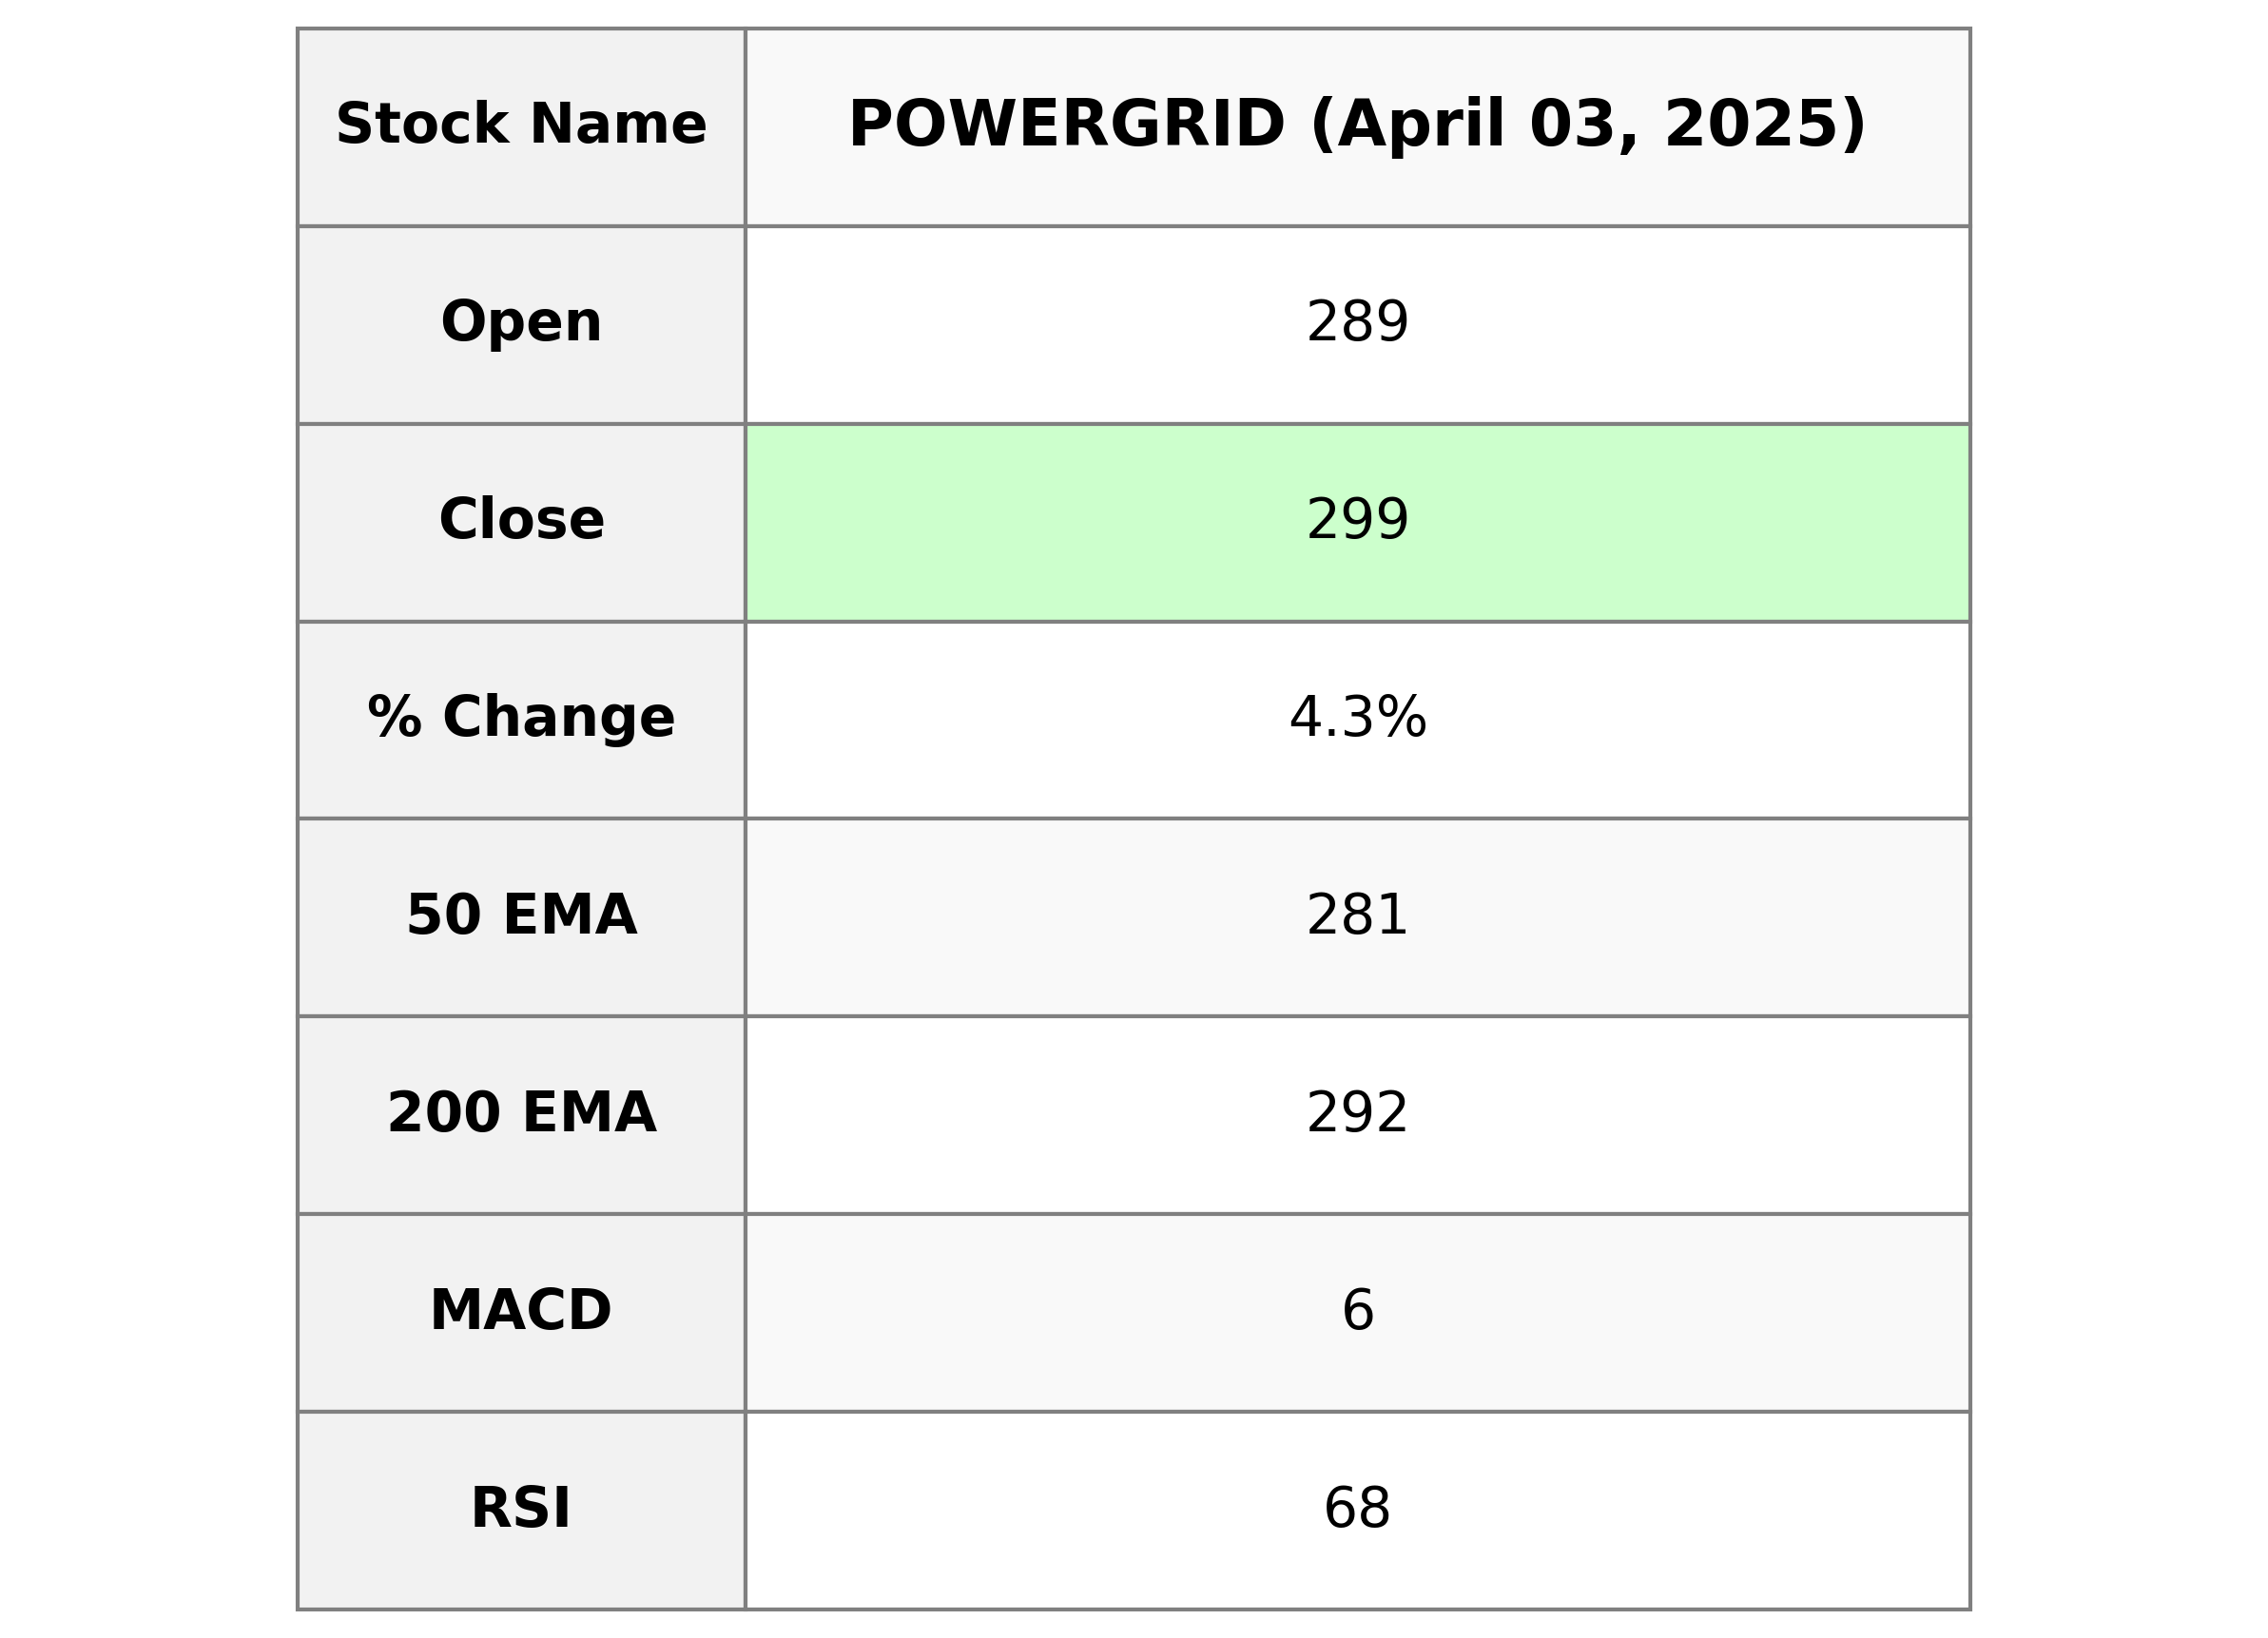
### Power Grid Performance Summary Power Grid has demonstrated strong performance with a closing price of 299.10, which represents a 4.31% increase from the previous close of 286.75. The stock's performance is highlighted by high trading volume and a positive MACD, suggesting bullish momentum. Operating in the Utilities sector, Power Grid exhibits robust fundamentals with a market cap of approximately 2.78 trillion and a PE ratio of 17.95, indicating a stable financial standing in the Utilities - Regulated Electric industry in India.
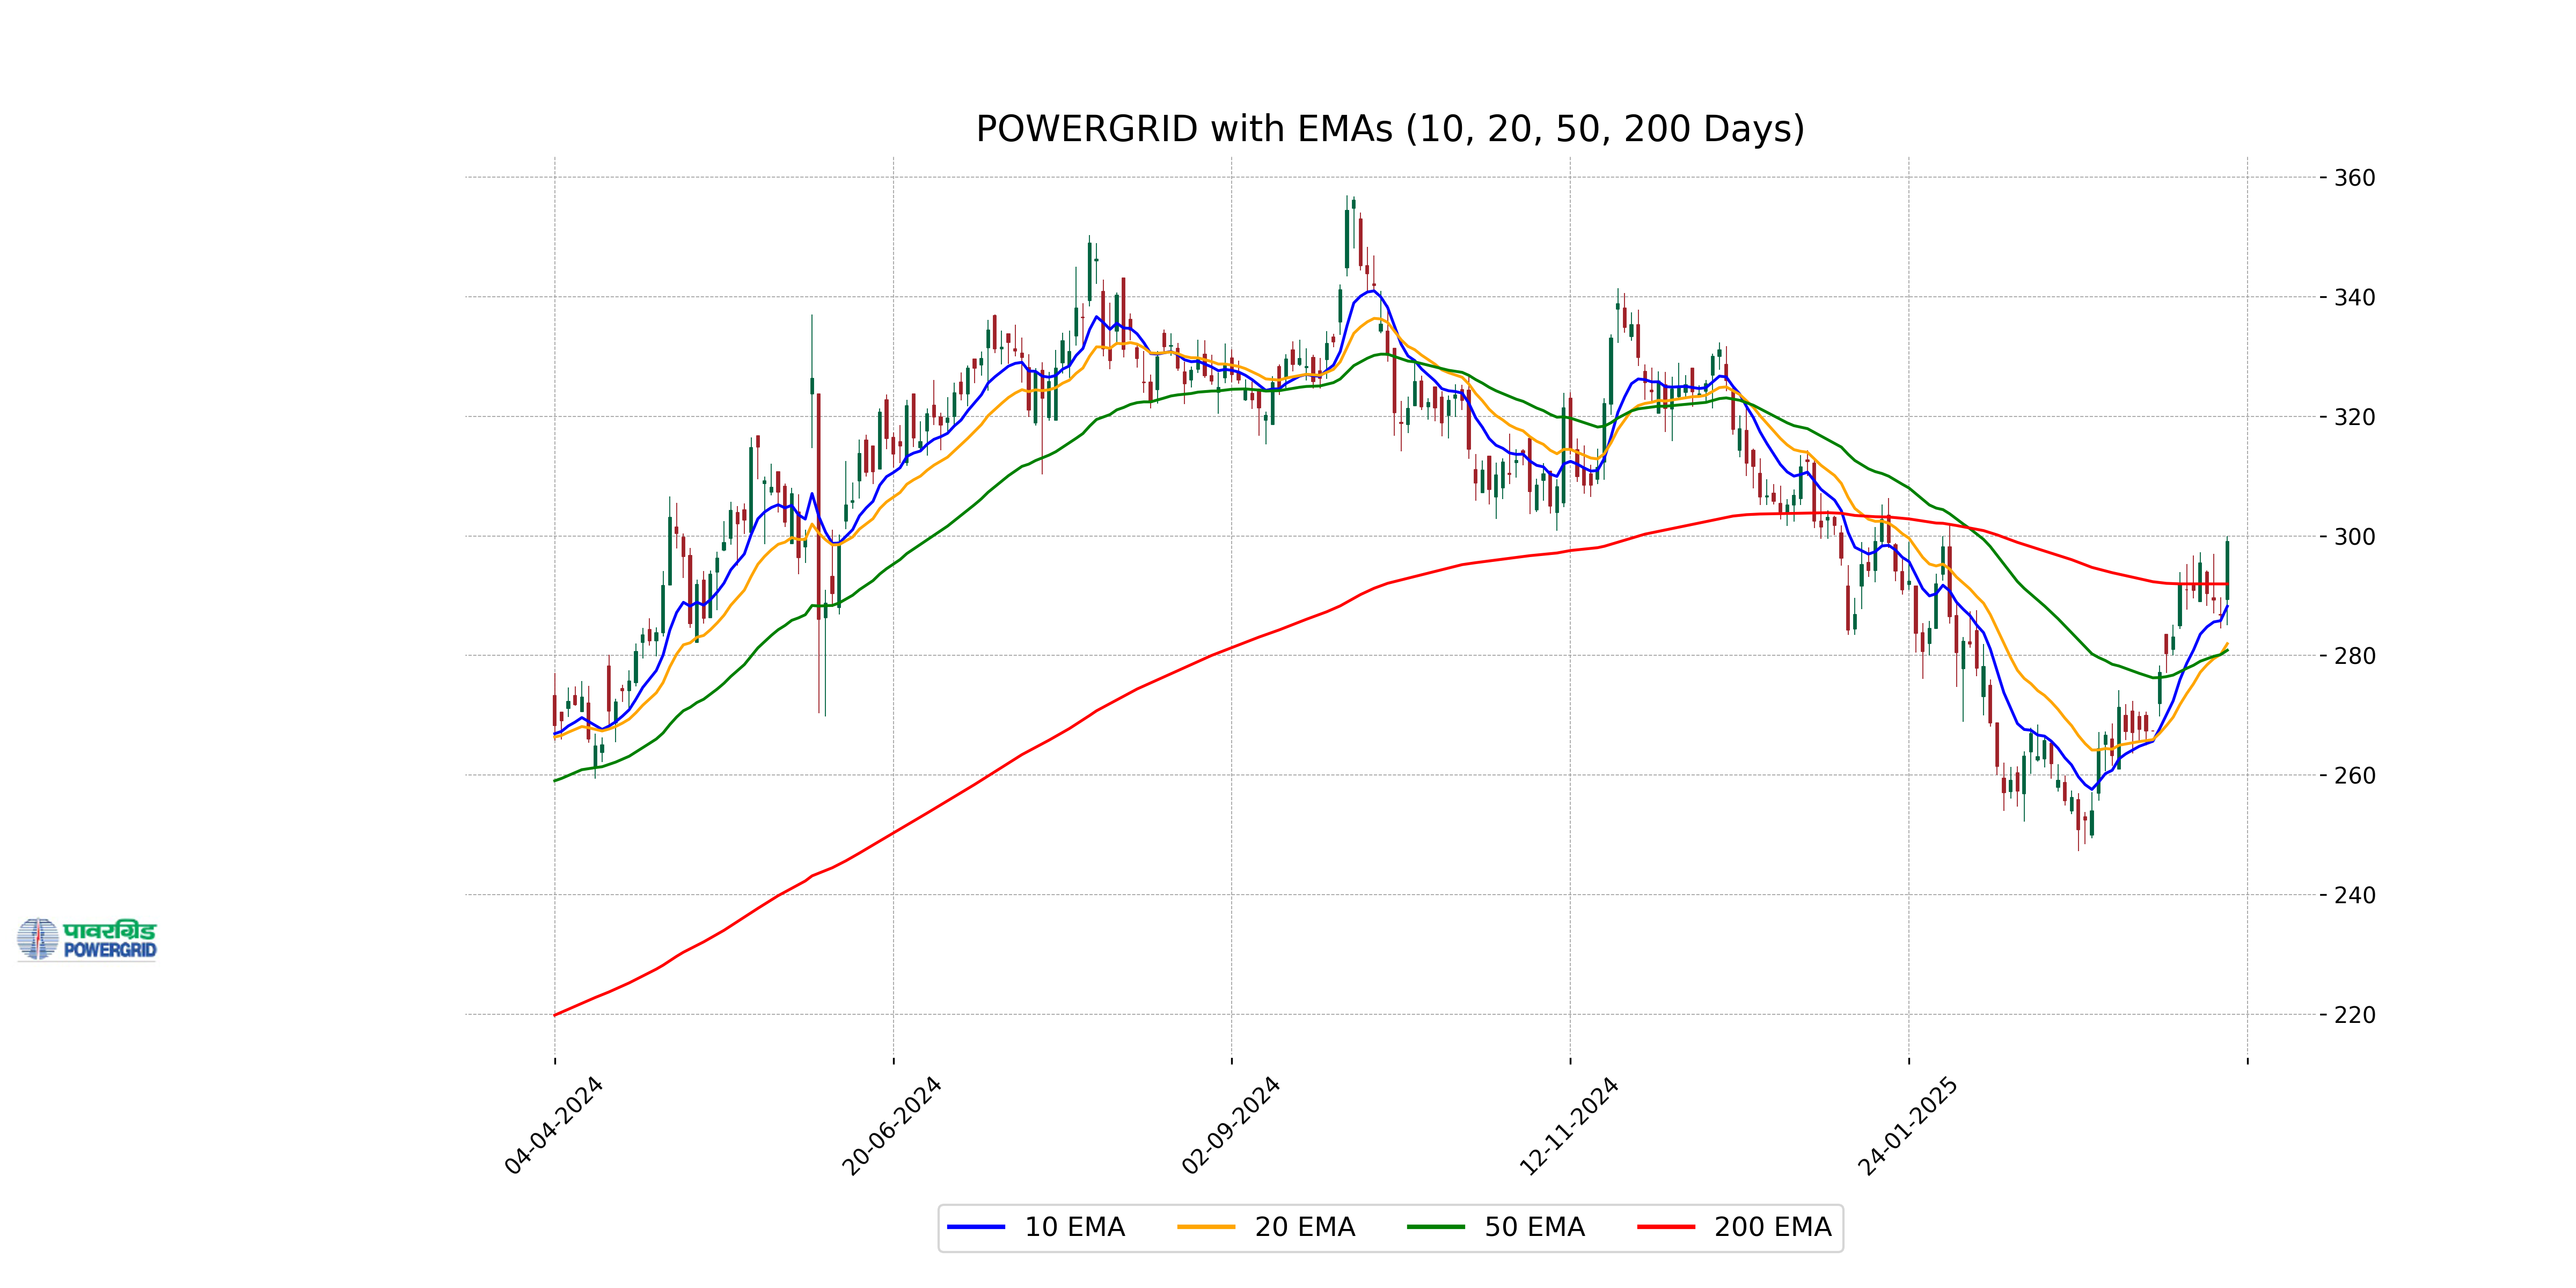
Relationship with Key Moving Averages
Power Grid's stock closed at 299.10, which is above its 50-day EMA of 280.88 and 200-day EMA of 291.97, indicating a strong upward trend. The close is also above the 10-day and 20-day EMAs, suggesting short-term bullish momentum.
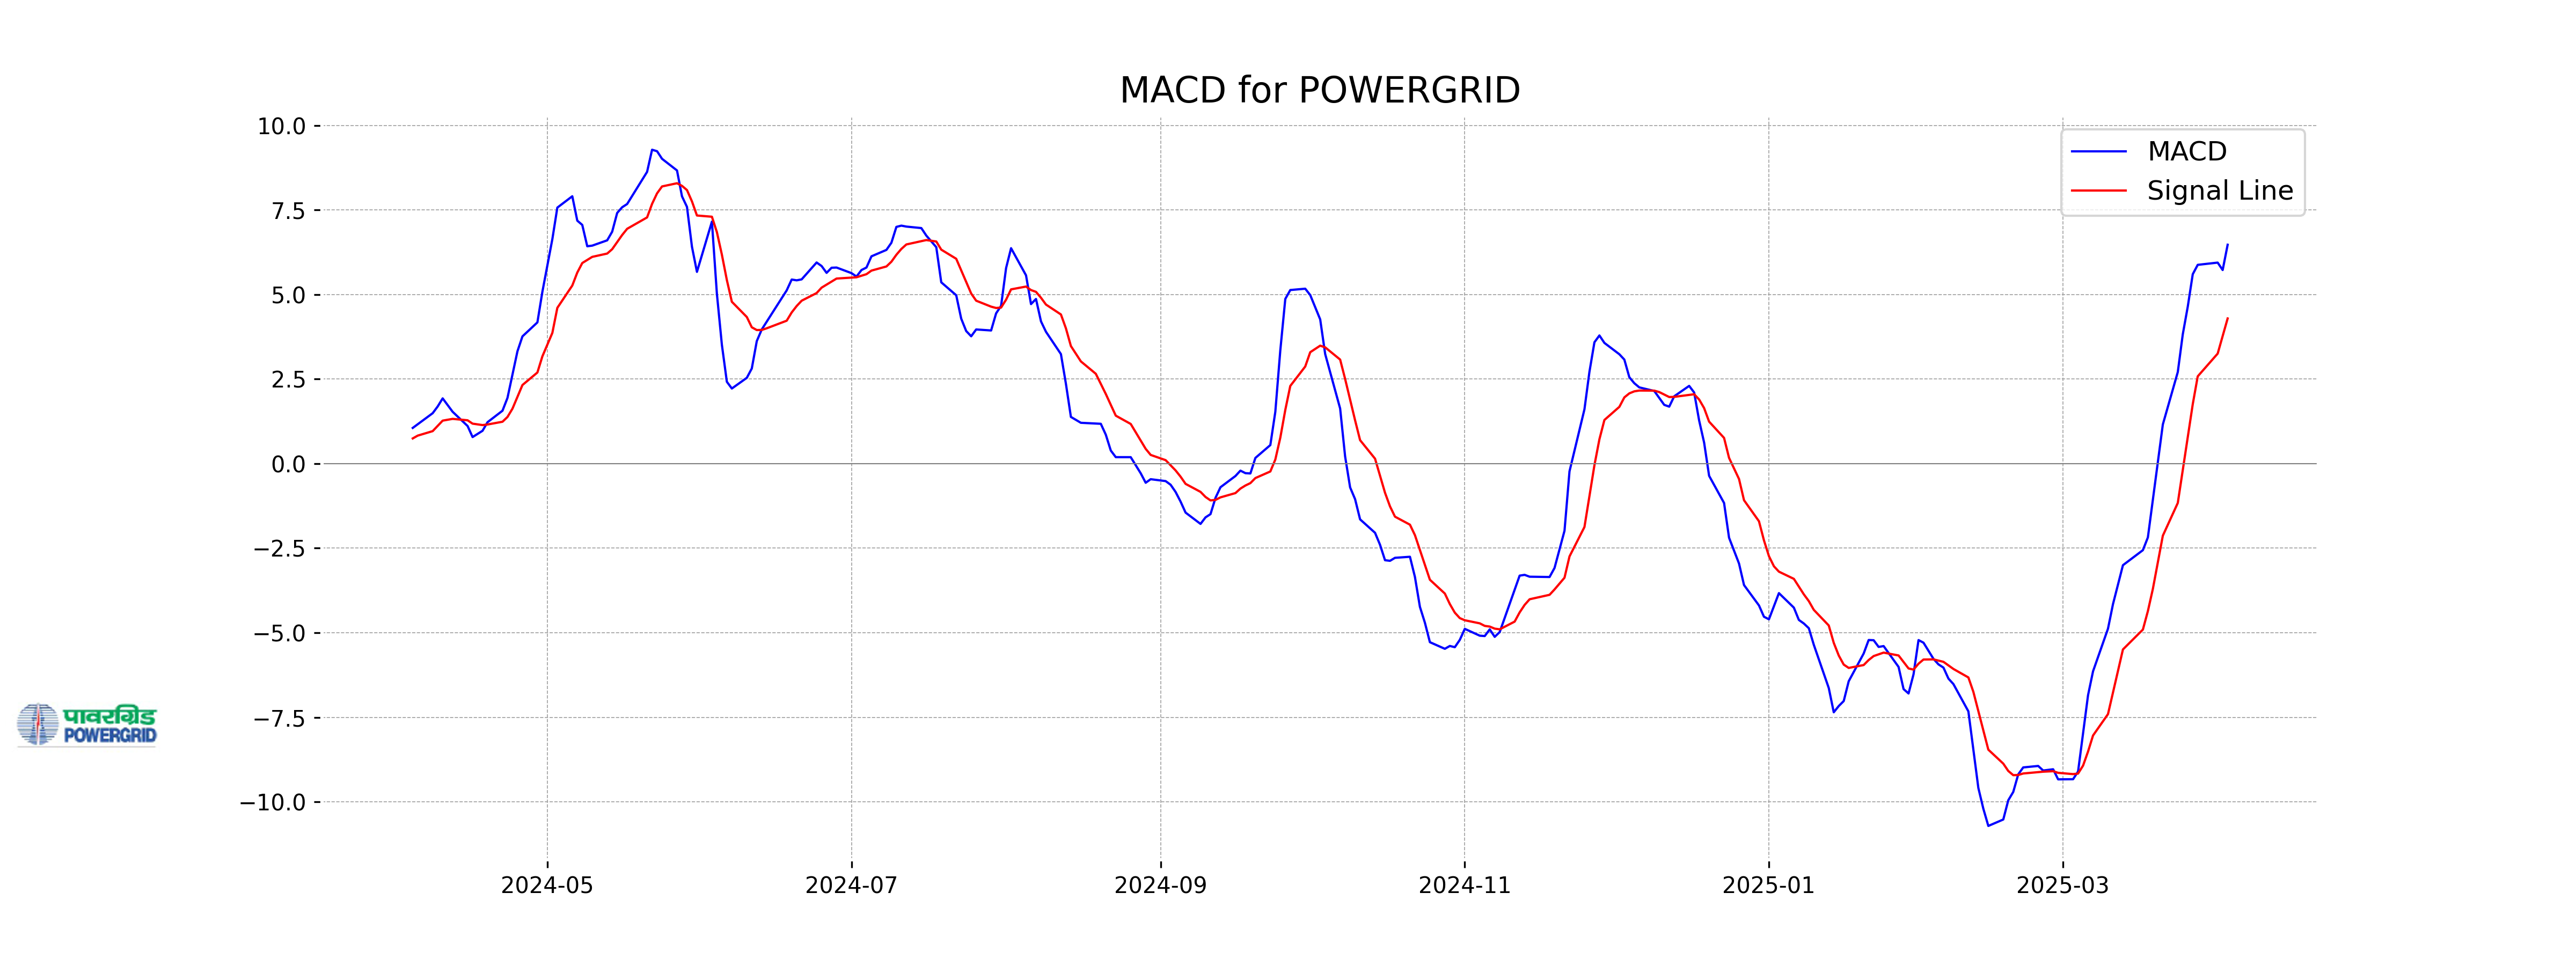
Moving Averages Trend (MACD)
The MACD for Power Grid is 6.47, significantly above its signal line of 4.29, indicating a bullish momentum. This suggests potential upward price movement as the MACD line diverges from the signal line.
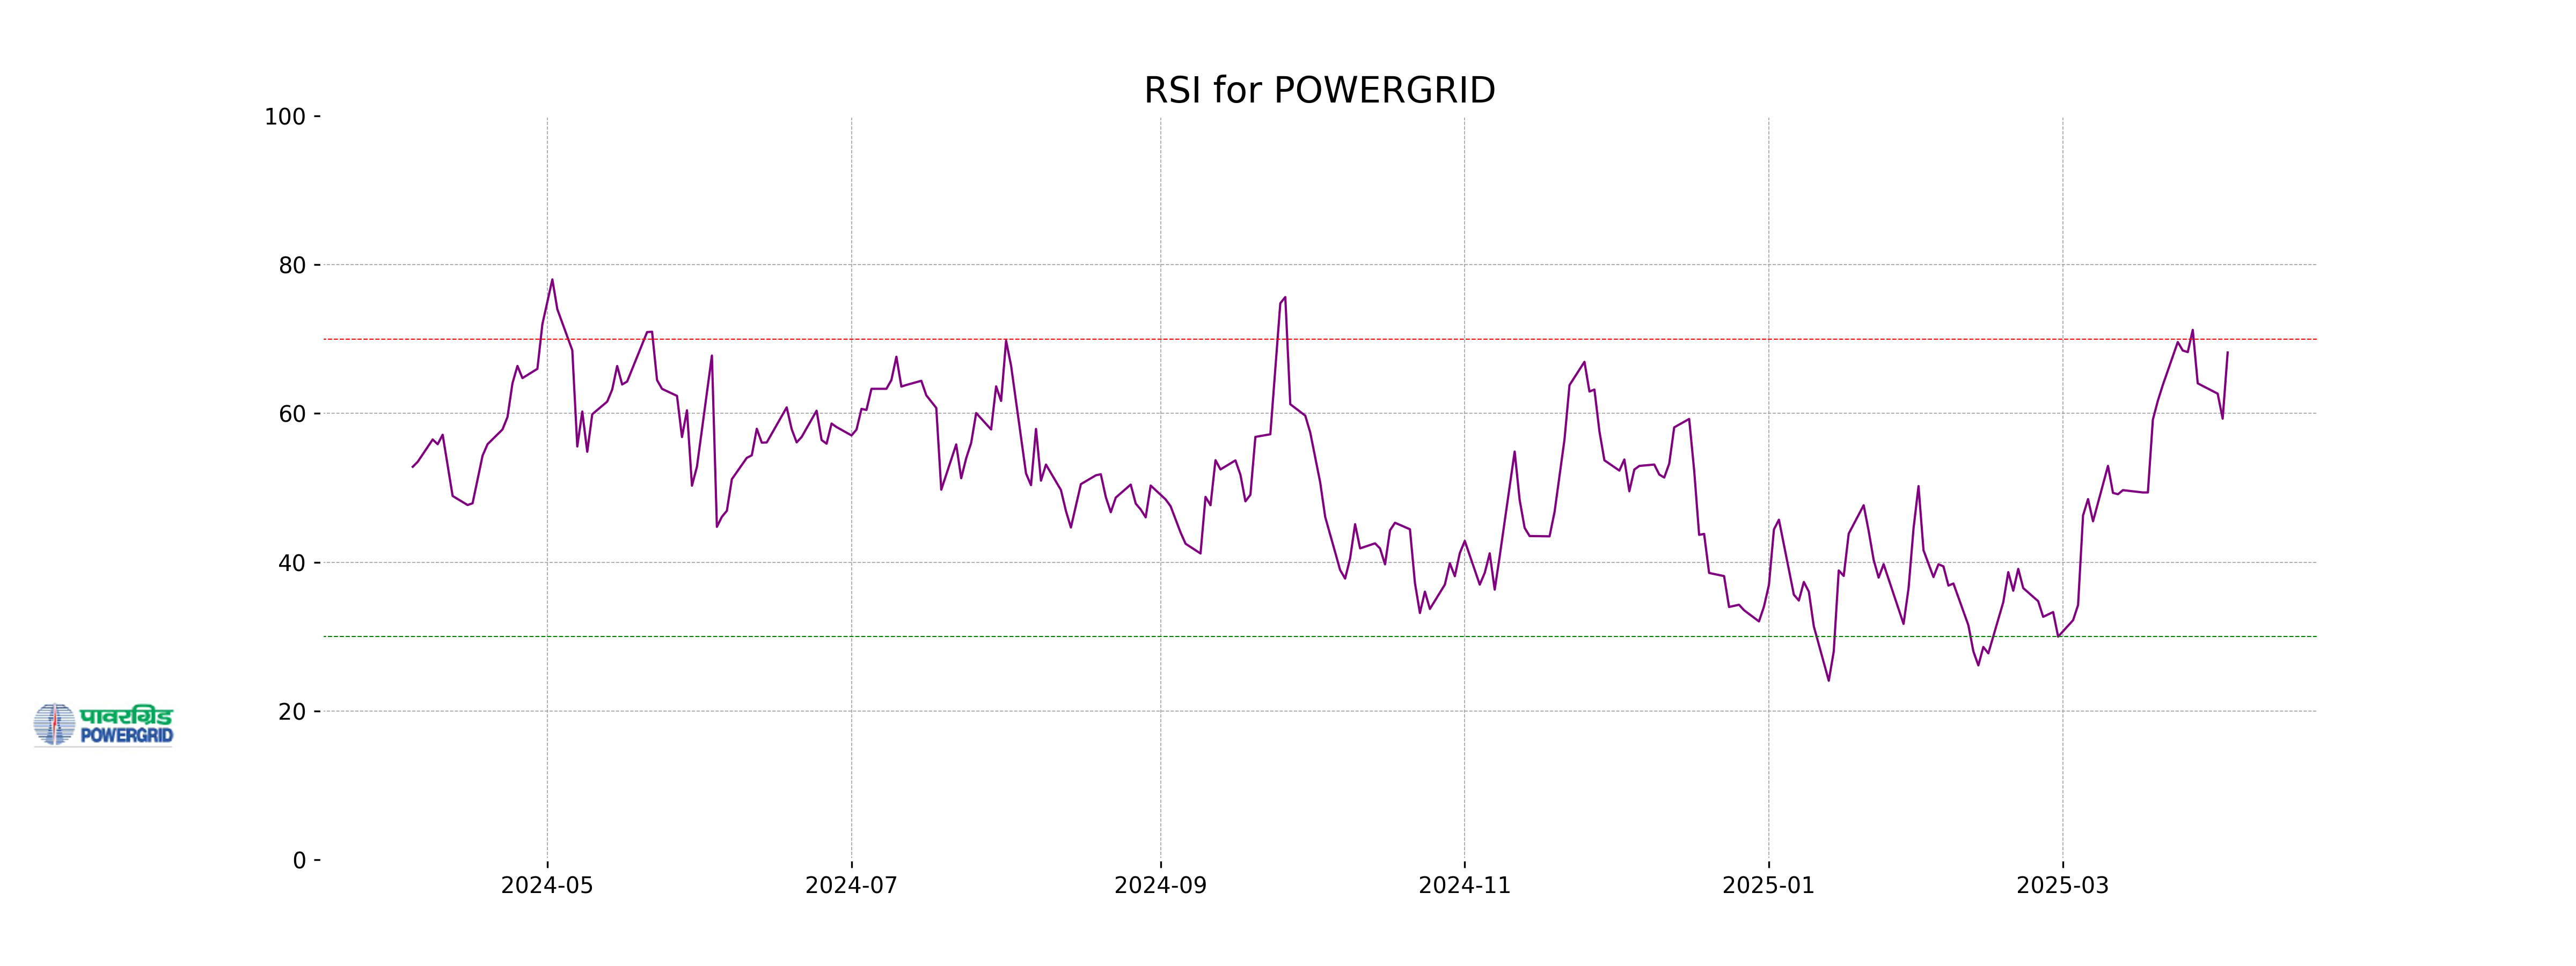
RSI Analysis
Power Grid's RSI is 68.20, which suggests that the stock is approaching overbought territory. This indicates strong recent buying momentum, but investors should be cautious as this level often precedes a potential price correction.
Analysis for Shriram Finance - April 03, 2025
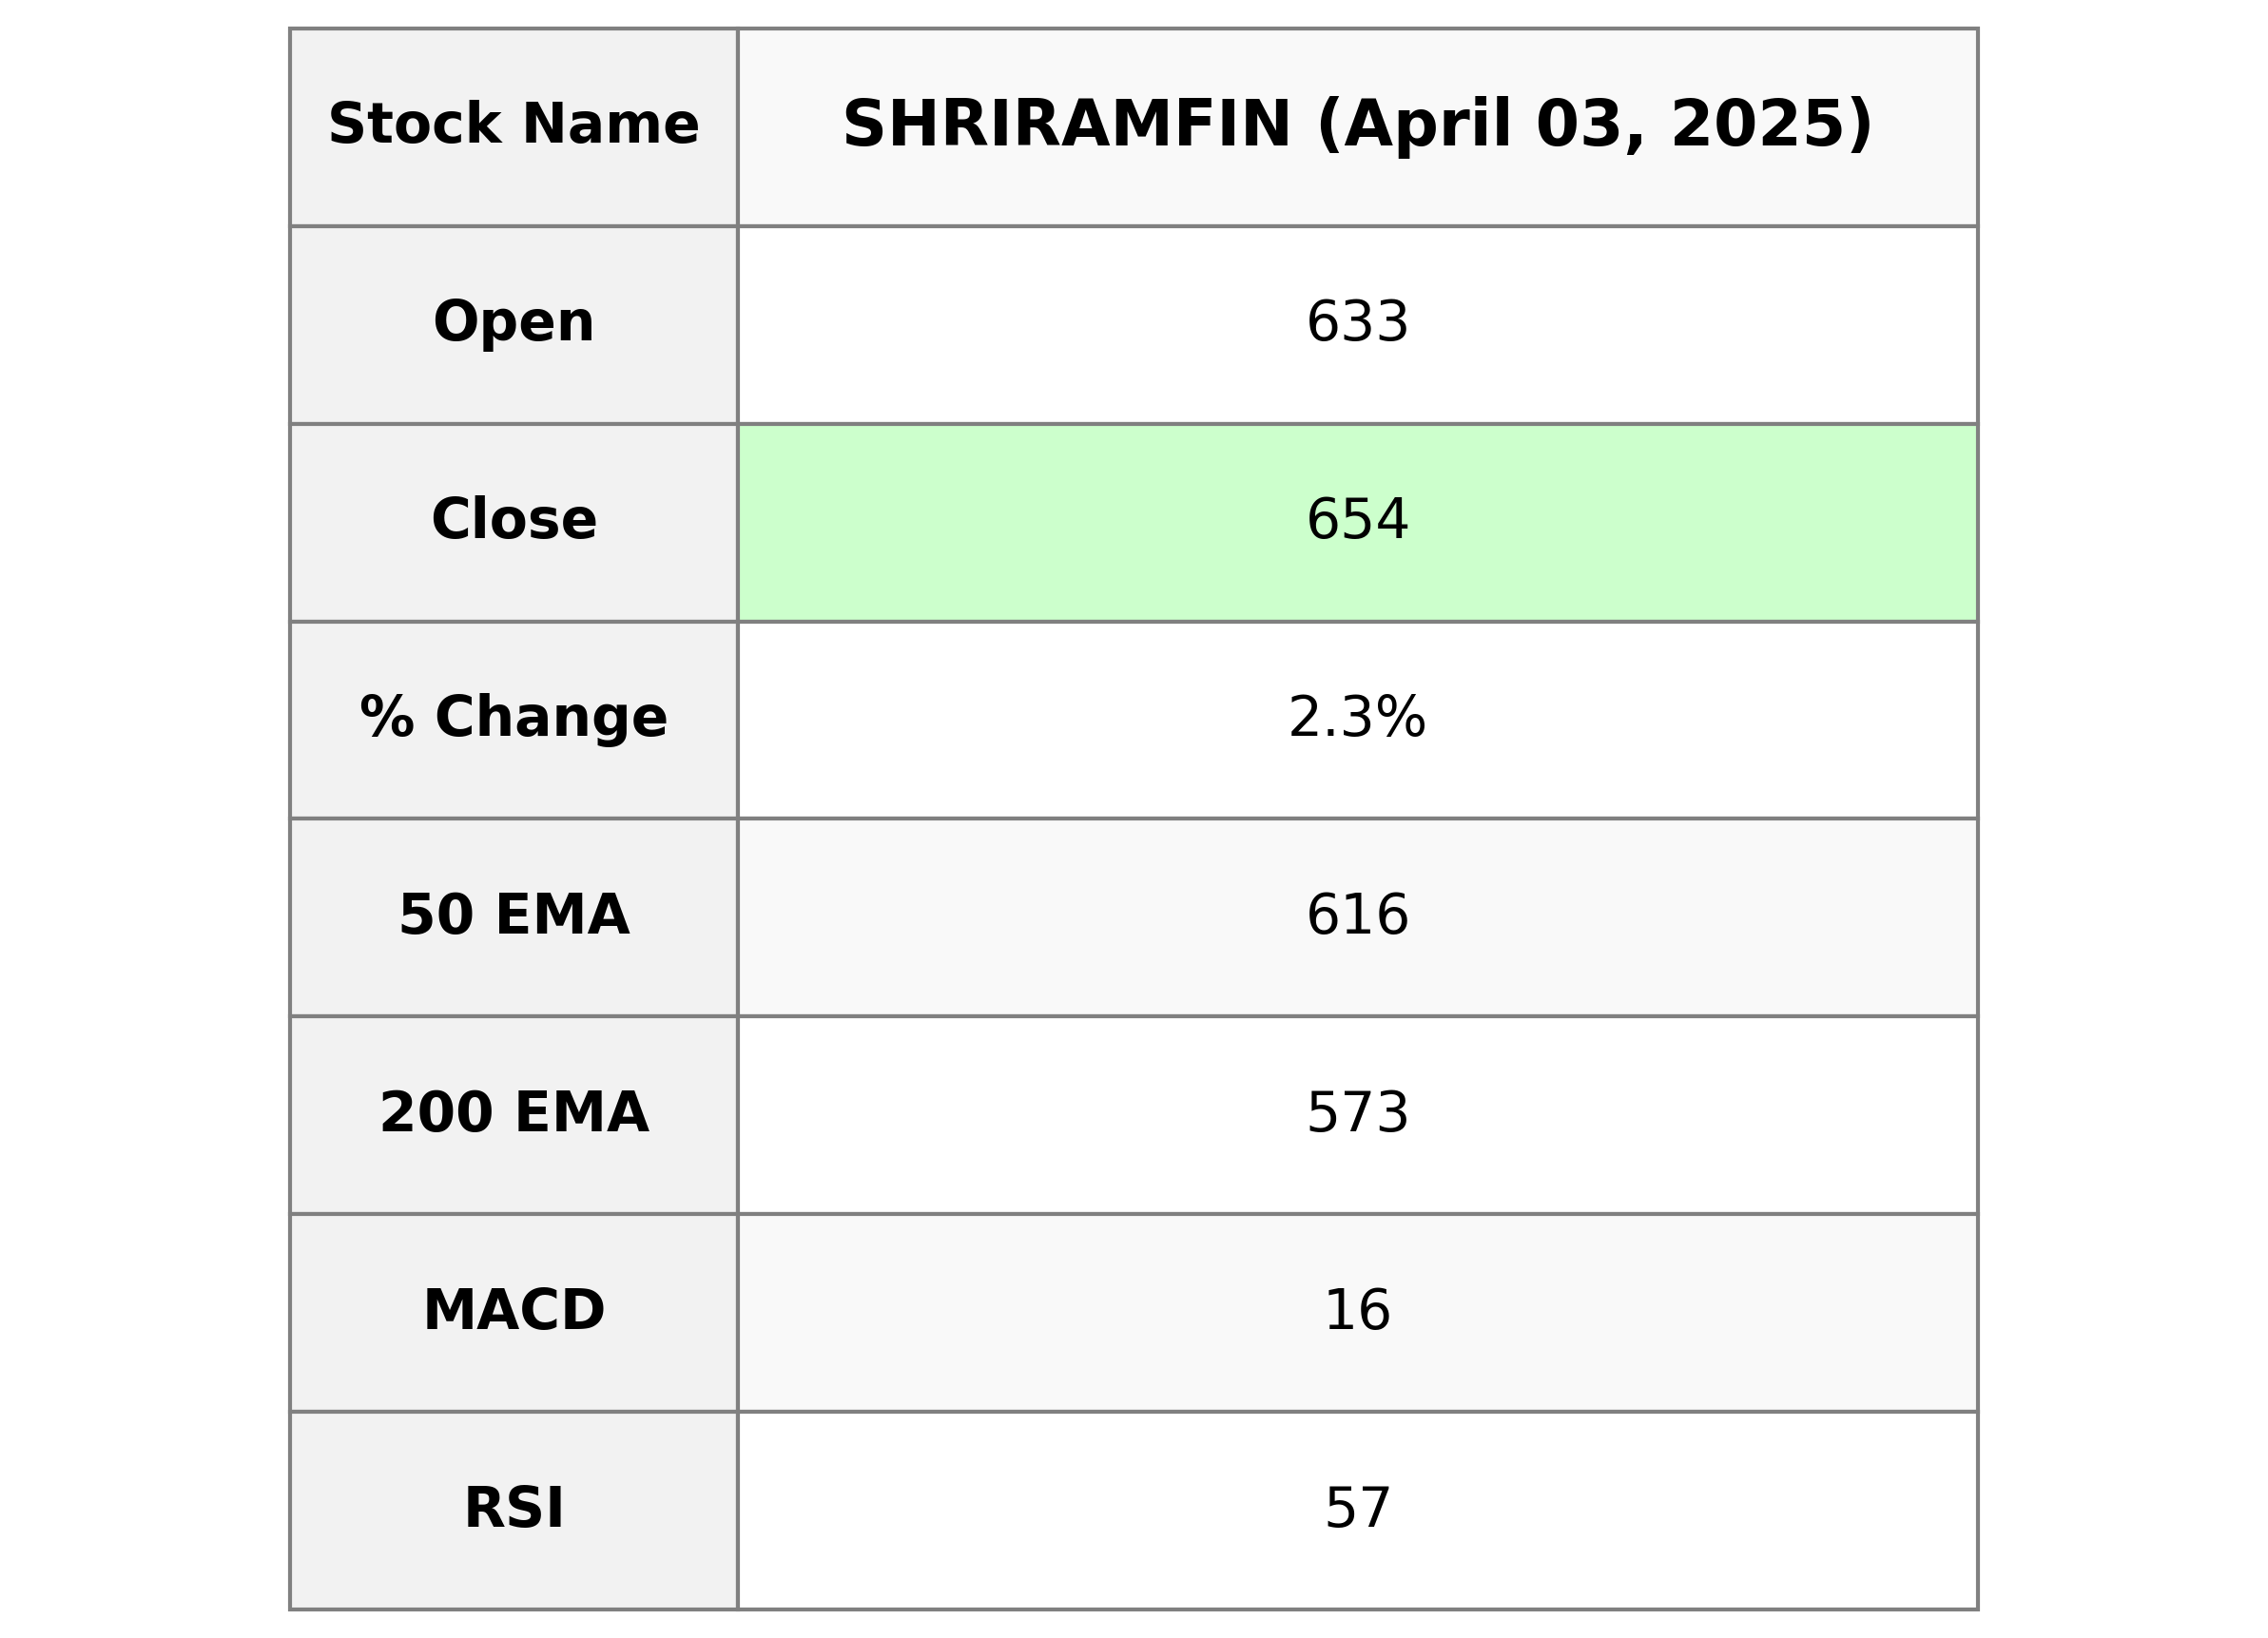
Shriram Finance has shown a positive performance with a closing price of 654.15, up by approximately 2.31% compared to the previous close. The company's stock is trading above both its 50 and 200-day EMAs, indicating a potentially strong trend in the short and long term. With a PE Ratio of 15.84 and a market cap of over 1.23 trillion INR, it is a key player in the Financial Services sector, specifically in Credit Services, within India.
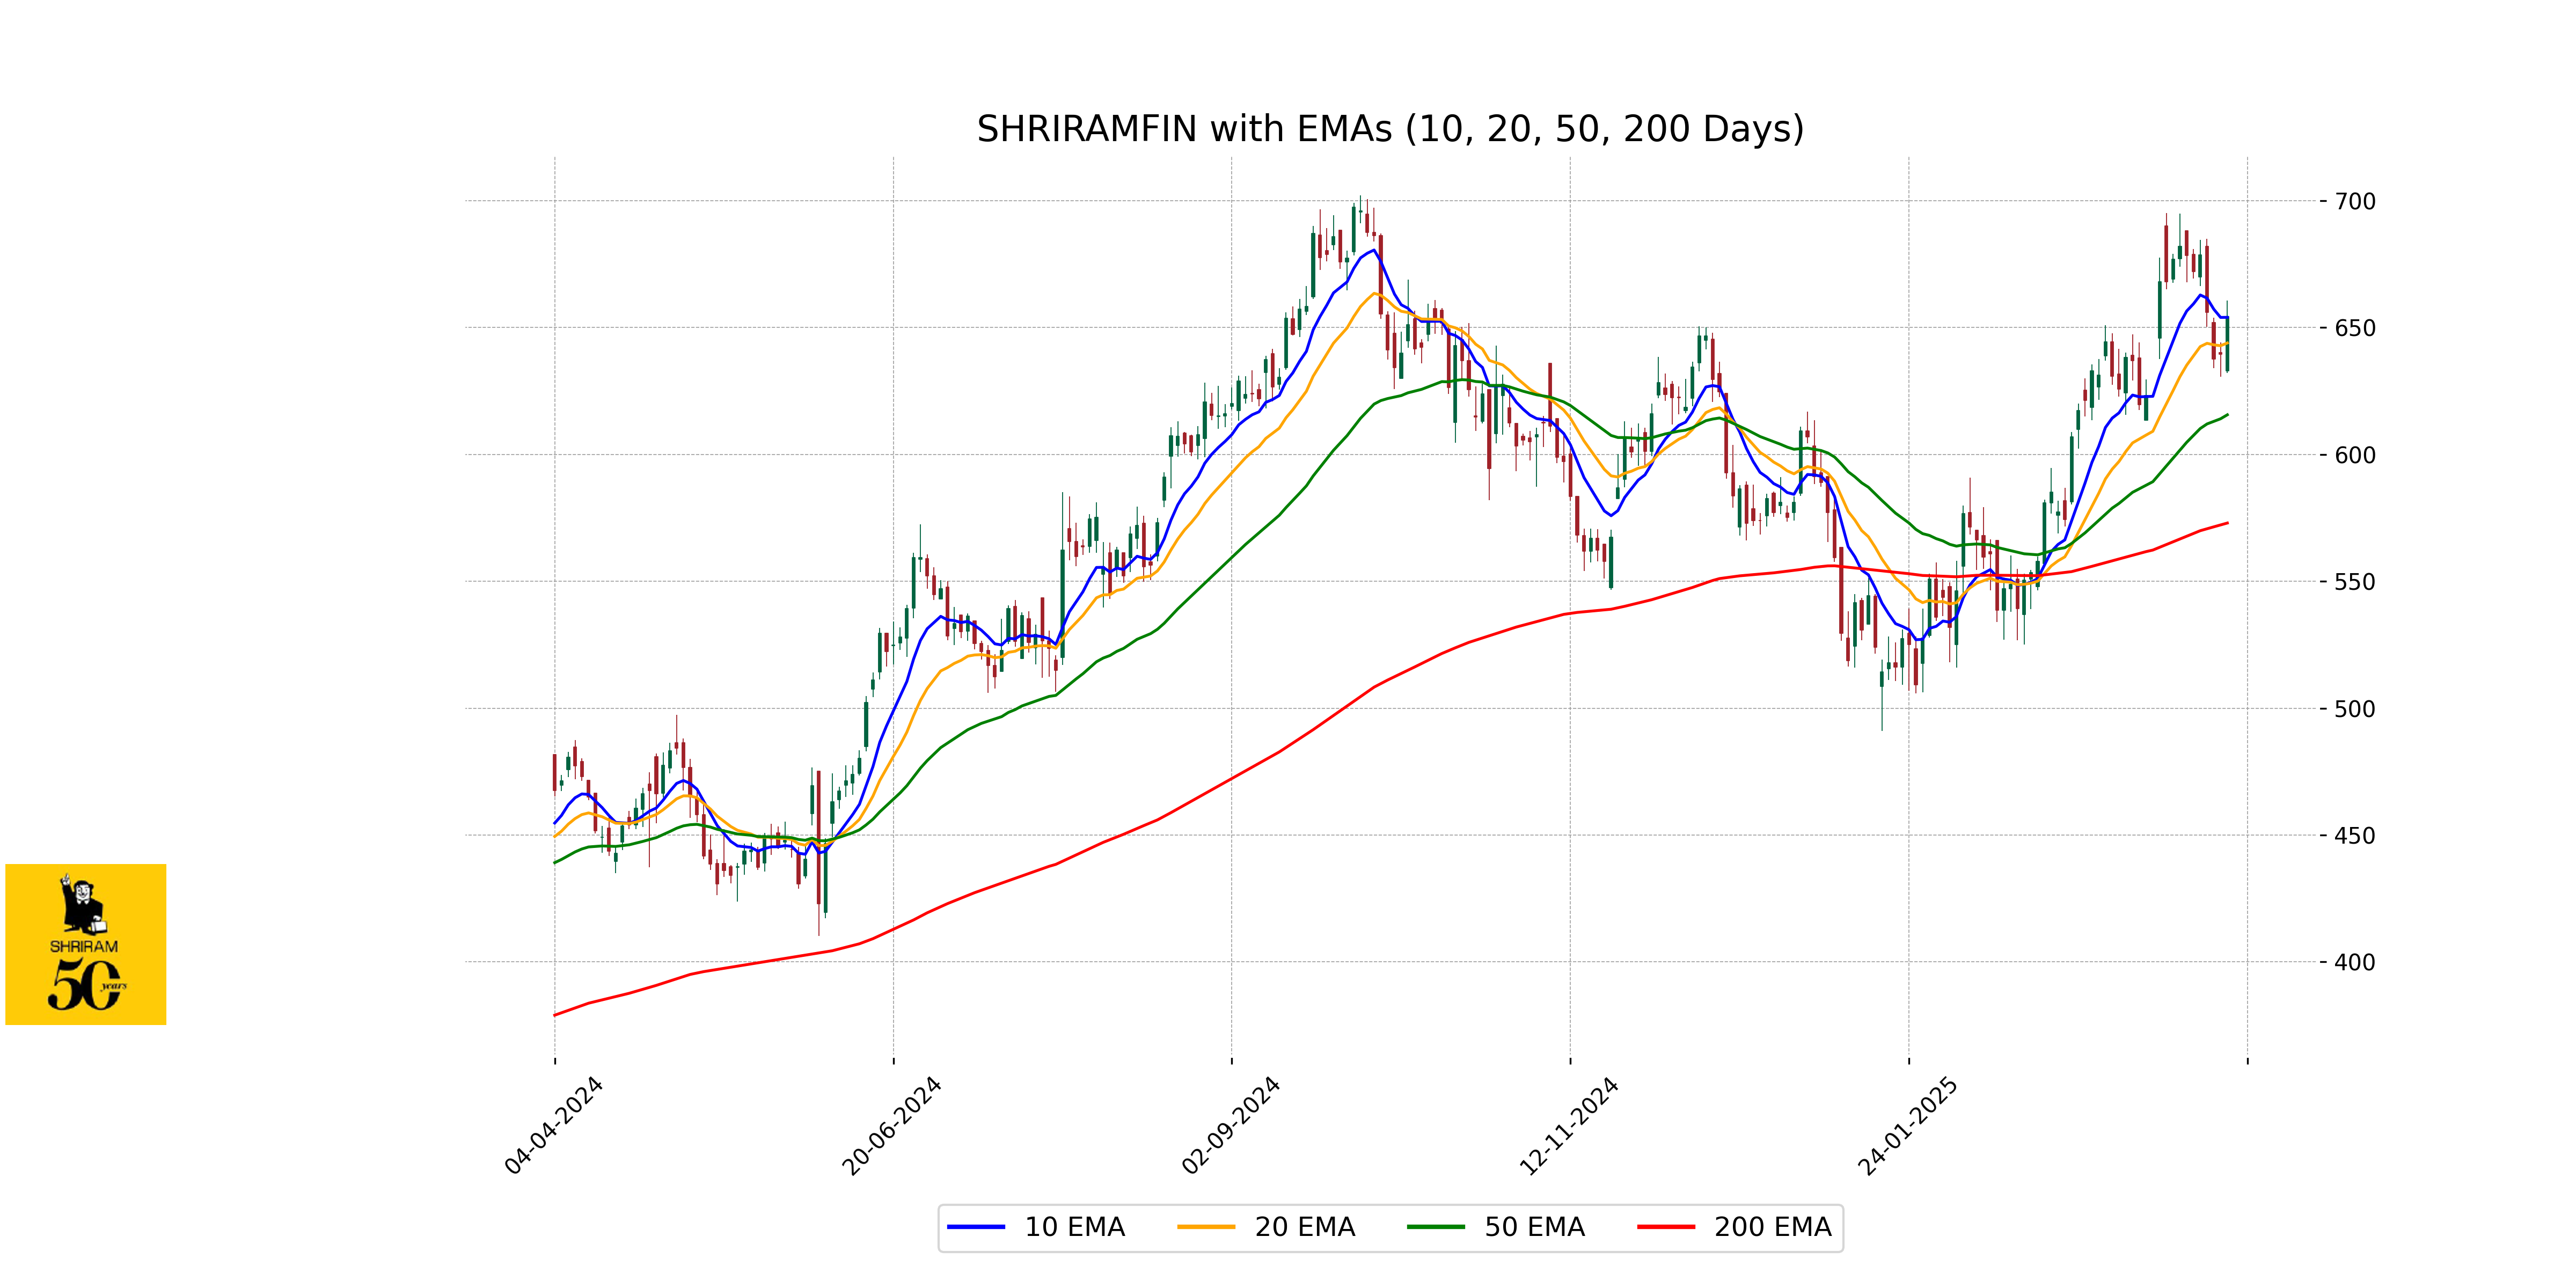
Relationship with Key Moving Averages
Shriram Finance is trading above its 50 EMA (615.58), 200 EMA (572.93), and close to its 10 EMA (653.98) and 20 EMA (643.87), indicating a strong upward trend in comparison to these moving averages. This suggests bullish market sentiment for the stock.
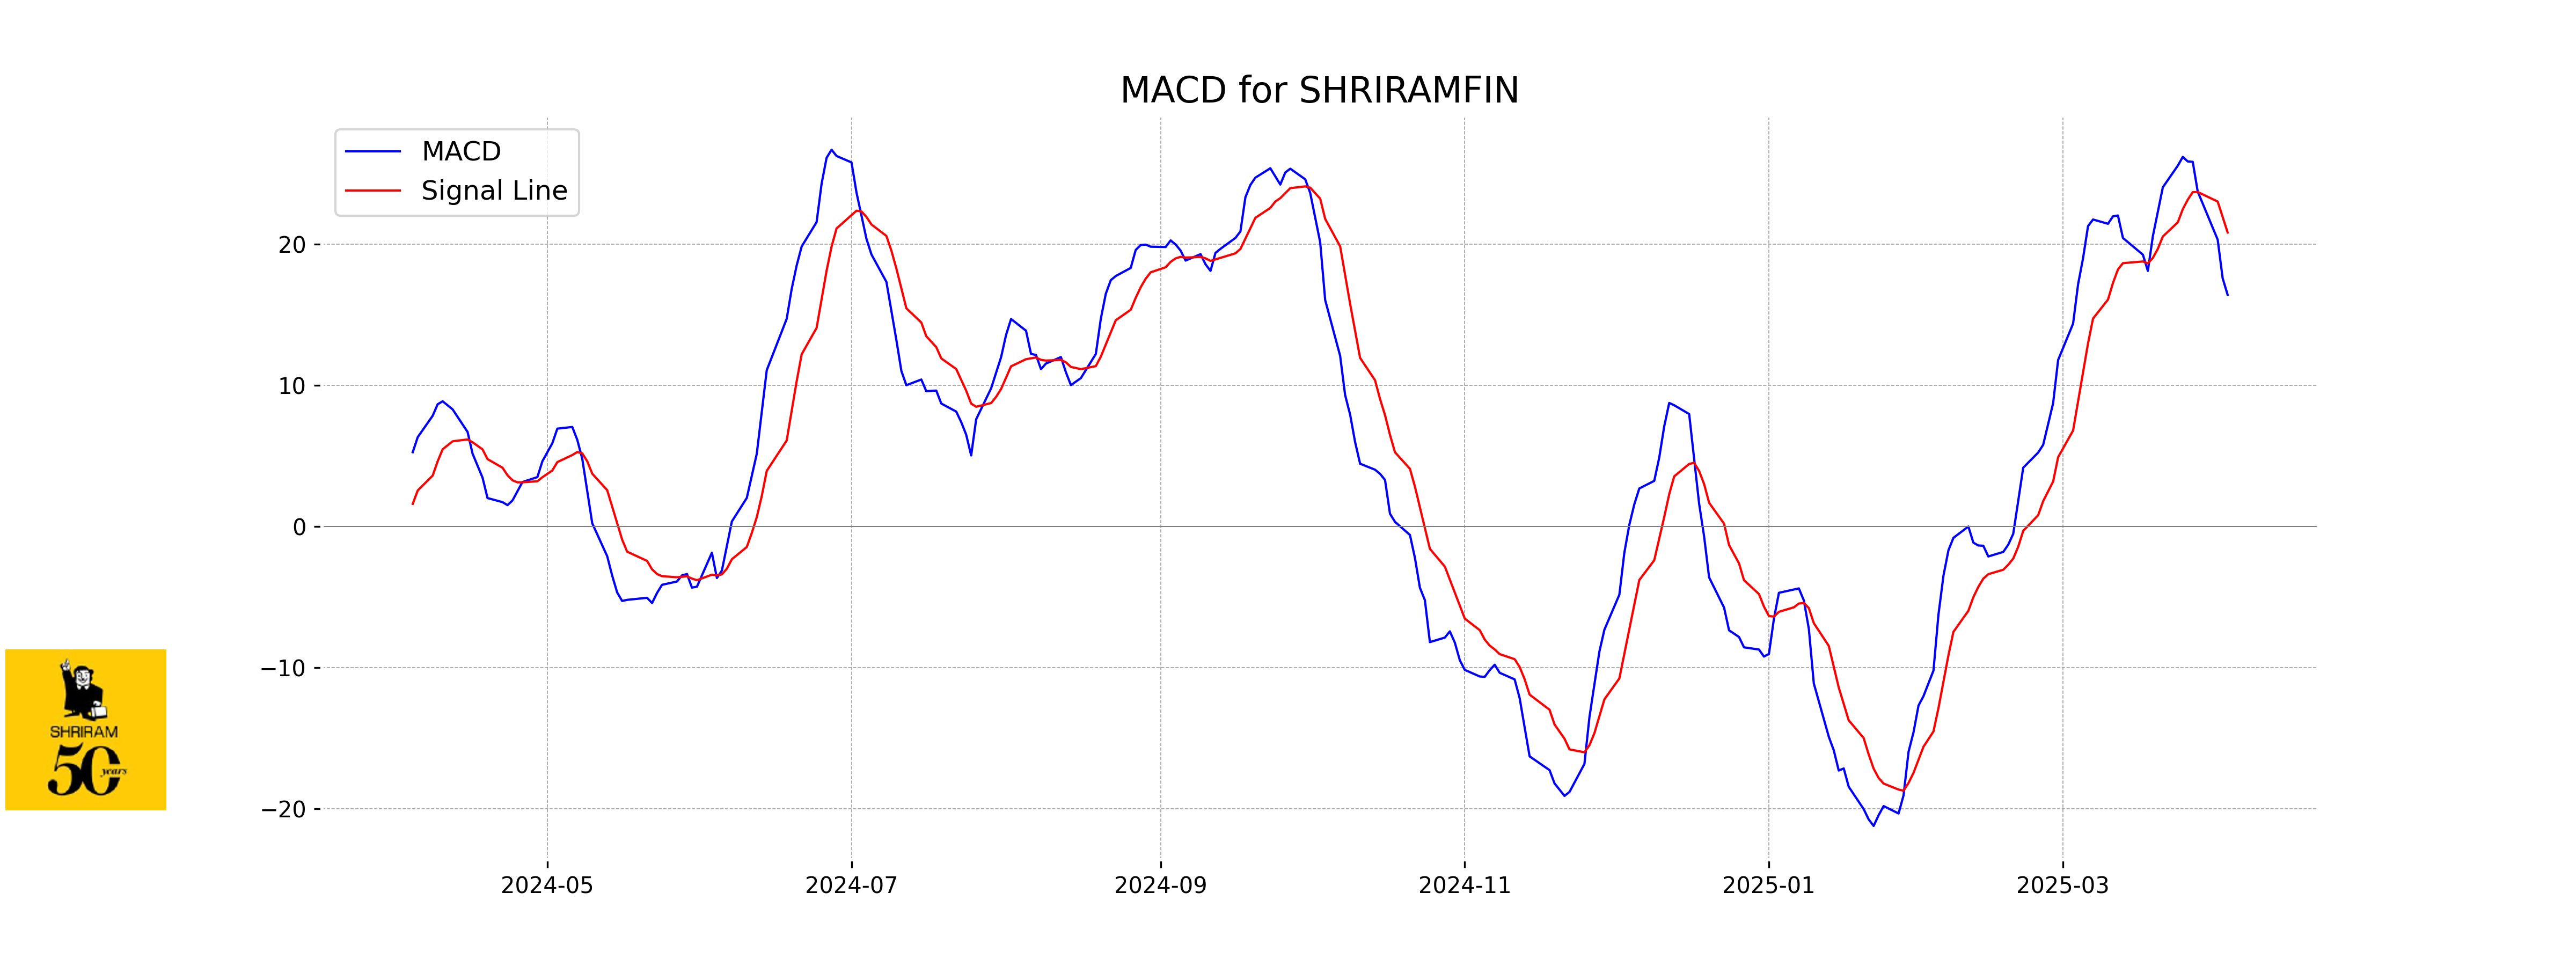
Moving Averages Trend (MACD)
MACD Analysis for Shriram Finance: The MACD value is 16.43, indicating a positive trend as it suggests the stock's momentum is currently bullish. However, the MACD Signal at 20.85 is higher than the MACD, which may suggest a possible slowing or slight decrease in momentum, and traders might watch for a potential crossover or confirm further direction from additional indicators.
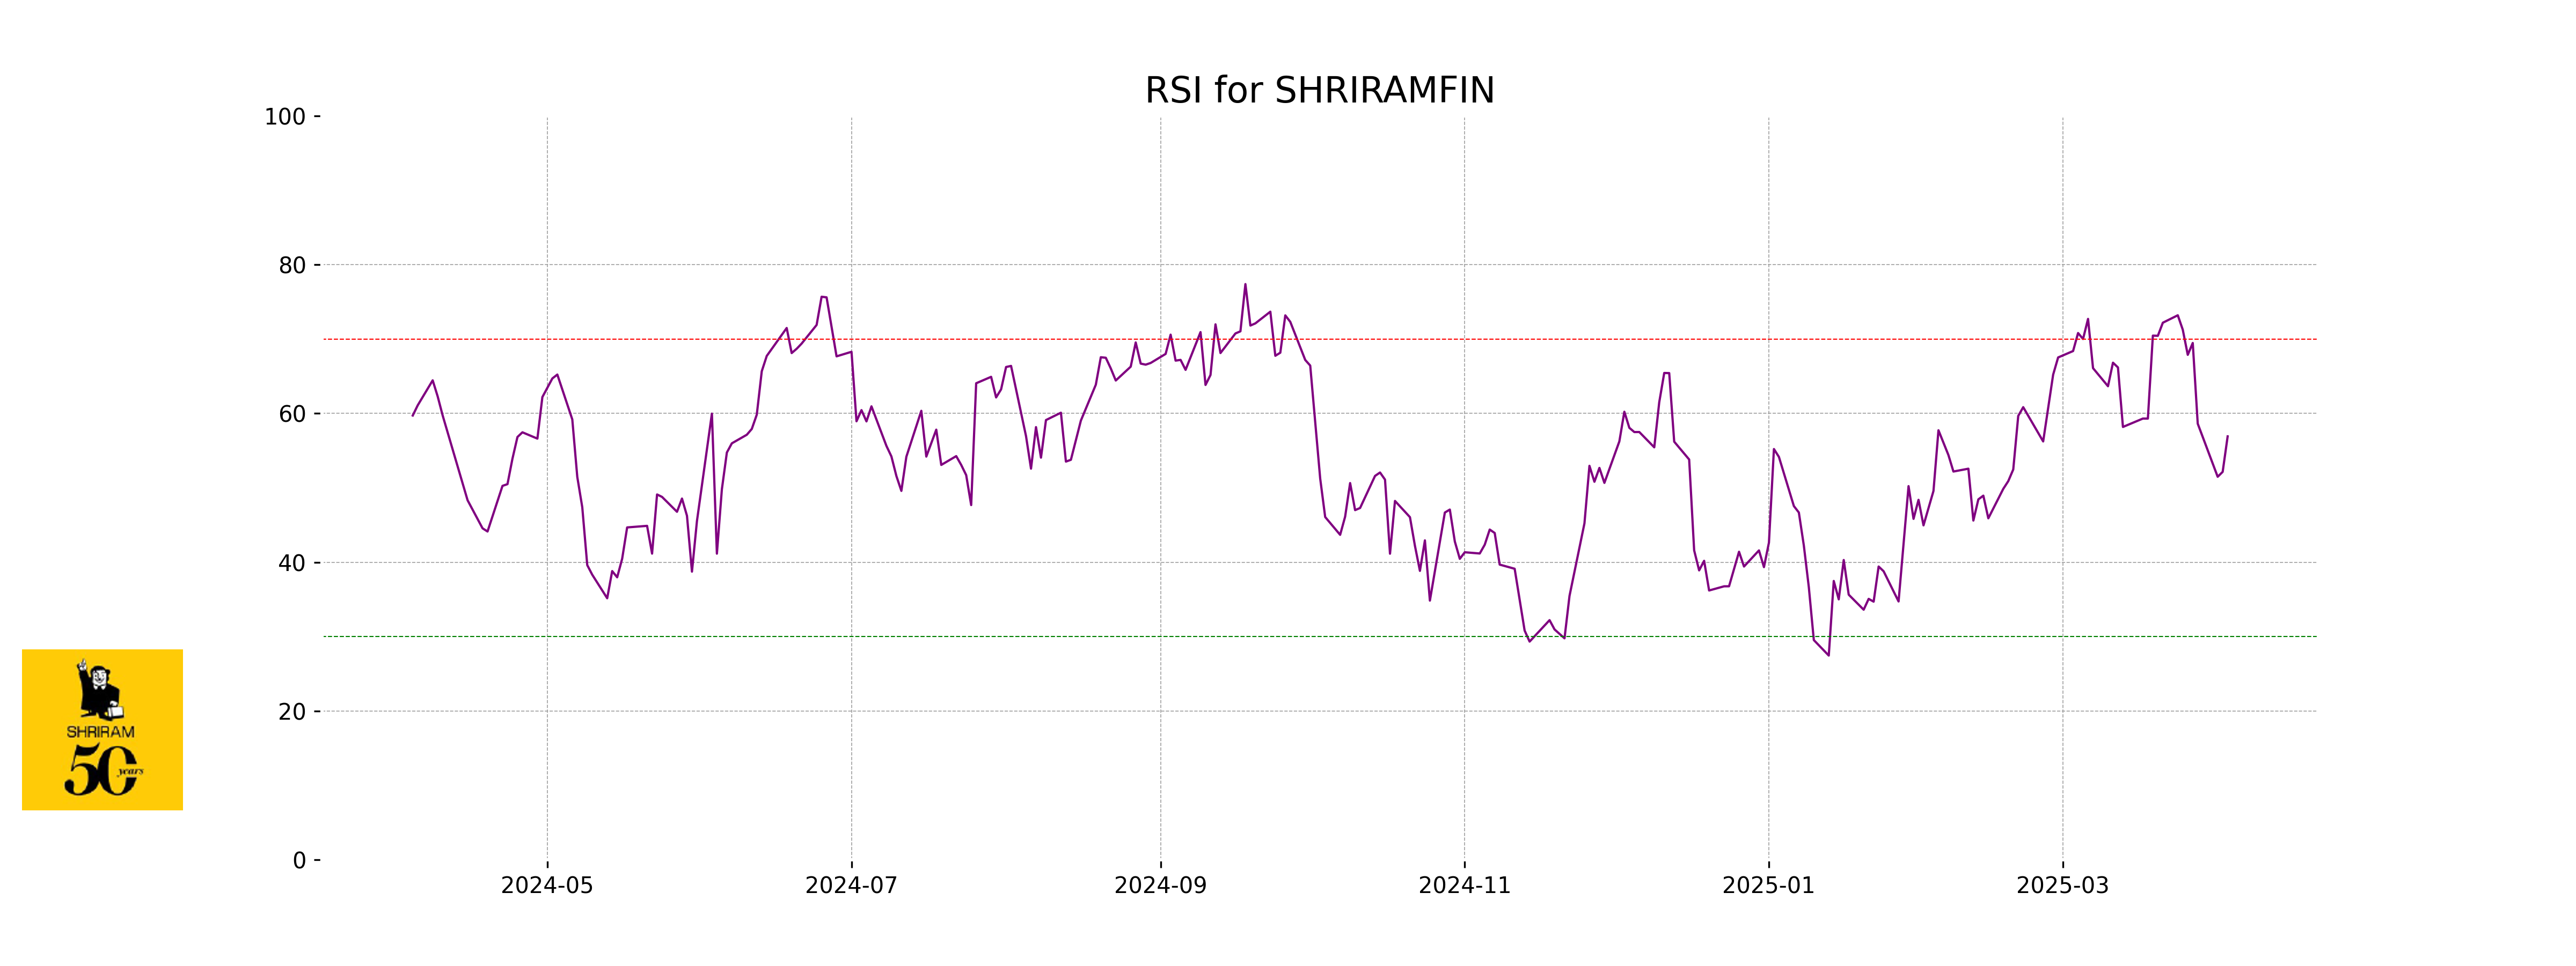
RSI Analysis
The RSI for Shriram Finance is currently at 56.92, which indicates that the stock is in the neutral zone. This suggests that it is neither overbought nor oversold, and there may not be immediate bullish or bearish momentum.
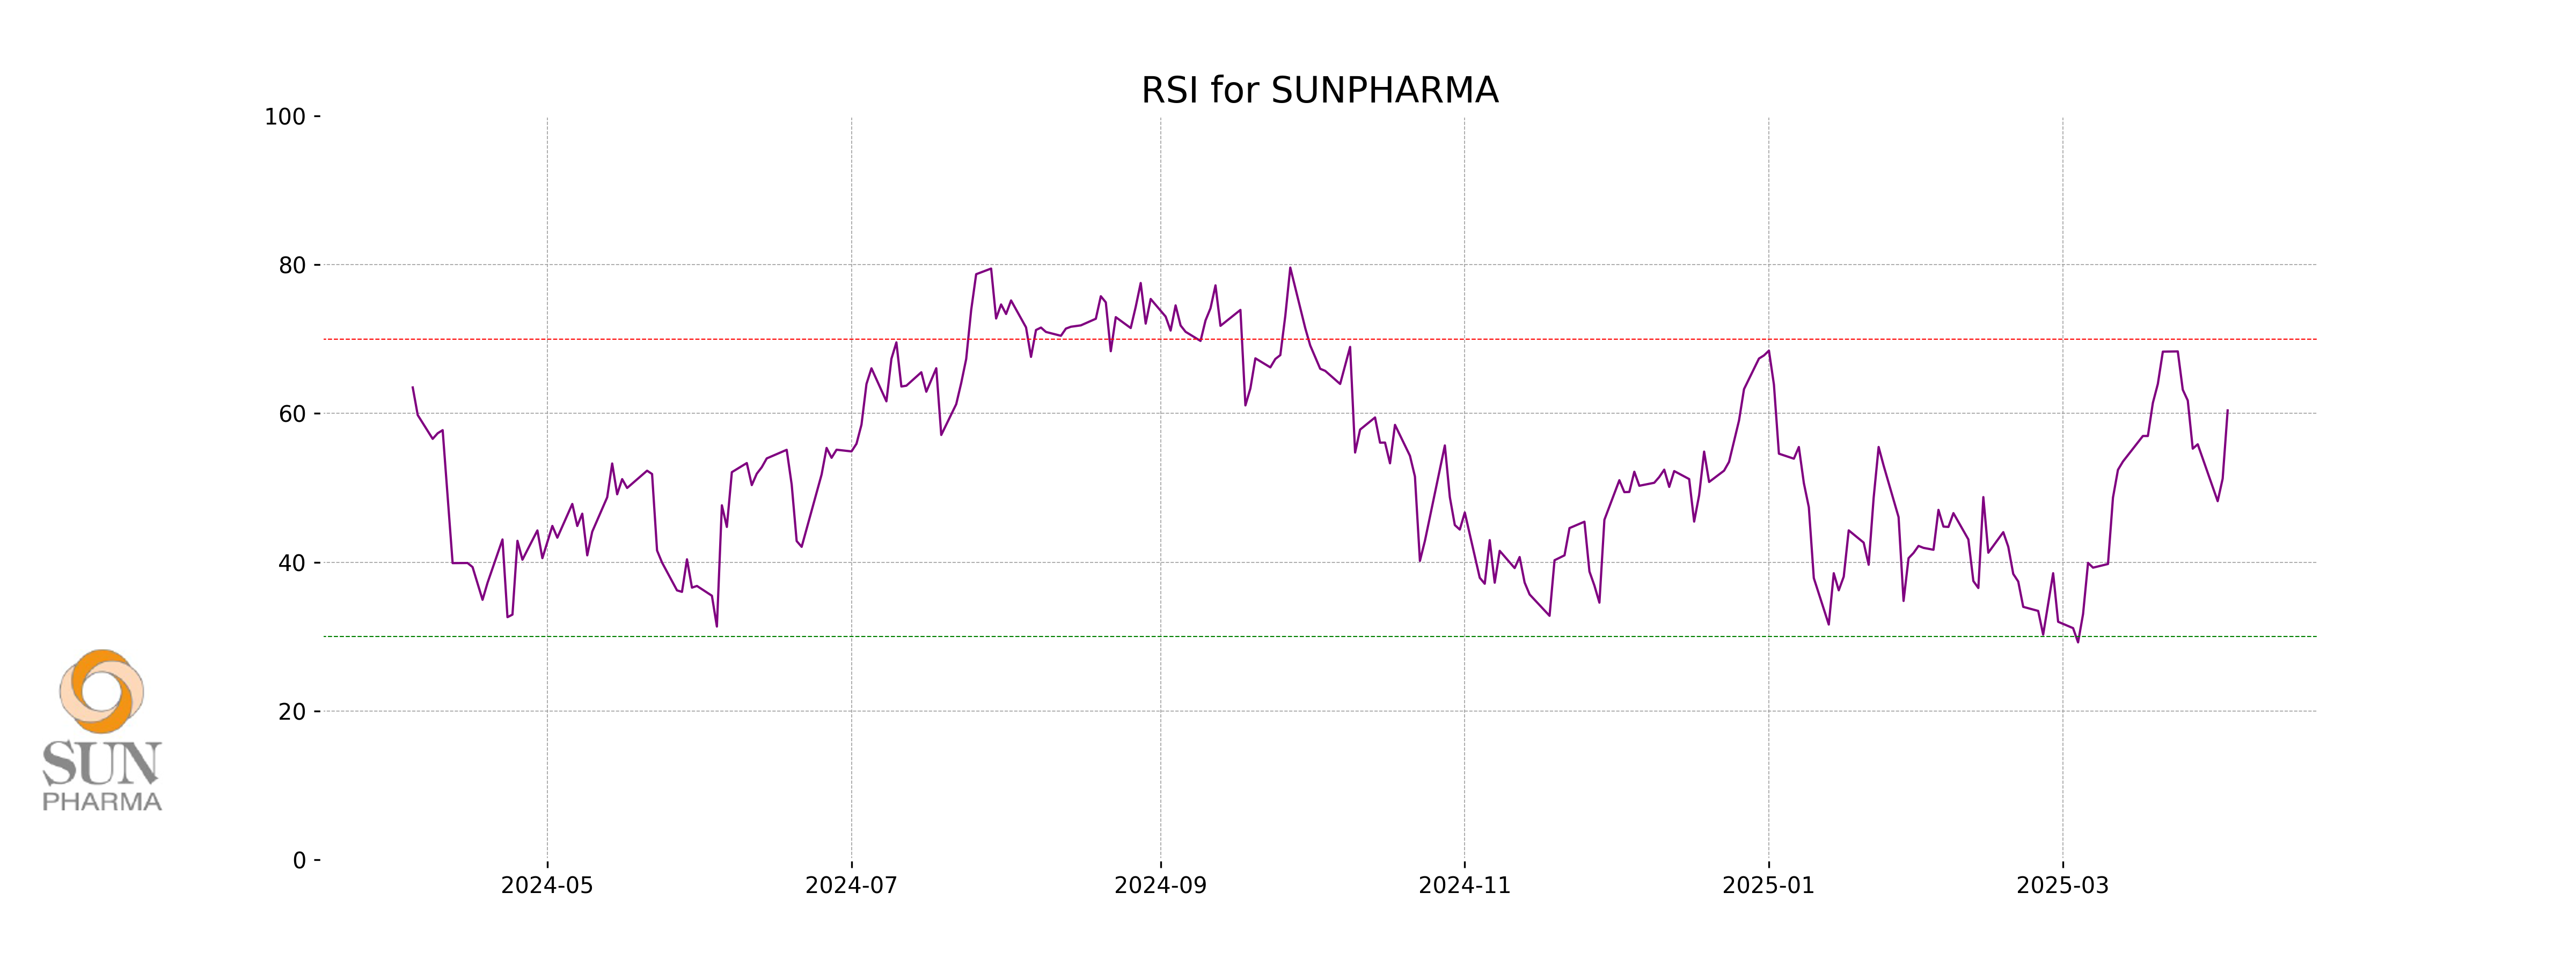
Analysis for SUN Pharma - April 03, 2025

SUN Pharma Performance Overview: SUN Pharma opened at 1755.0 and closed at 1770.0, marking a 3.29% increase from the previous close of 1713.65. With a market cap surpassing 4.2 trillion, the company operates in the healthcare sector, specifically within drug manufacturing. It exhibits a positive trend with a 60.41 RSI and a PE ratio of 37.15, suggesting potential growth against its EMAs.
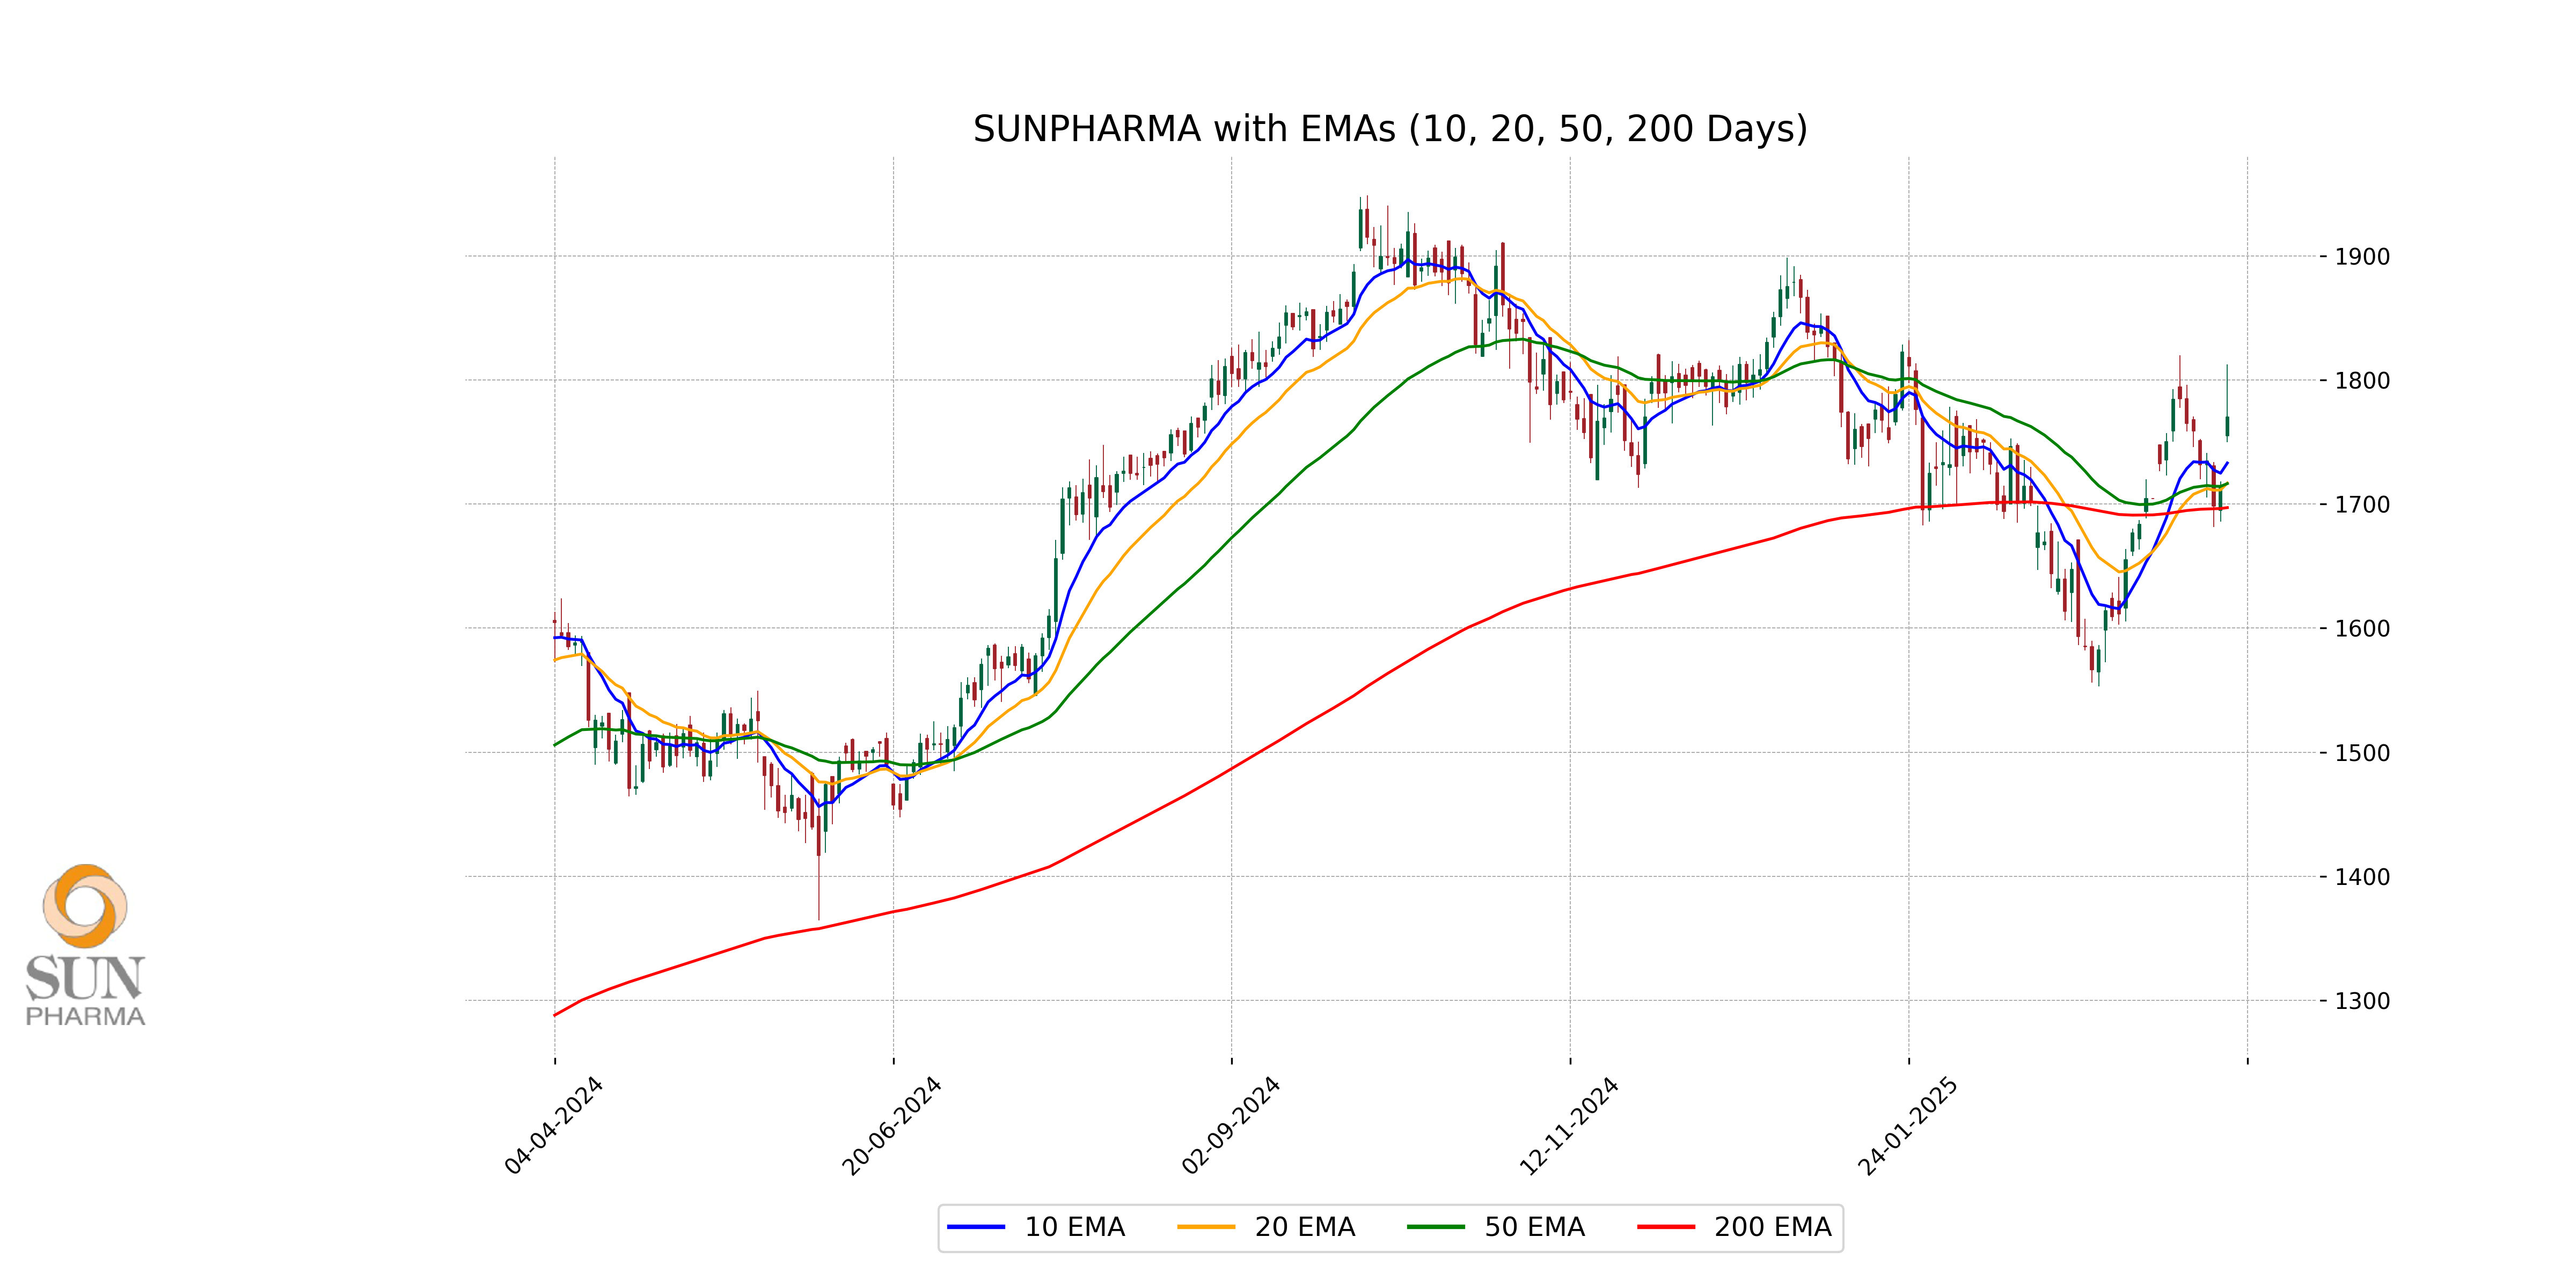
Relationship with Key Moving Averages
SUN Pharma's closing price of 1770.0 is above all key moving averages: the 50 EMA at 1716.47, the 200 EMA at 1697.12, and the 10 EMA at 1733.08, indicating a strong upward trend. This suggests positive momentum as the stock is trading higher than its recent averages.
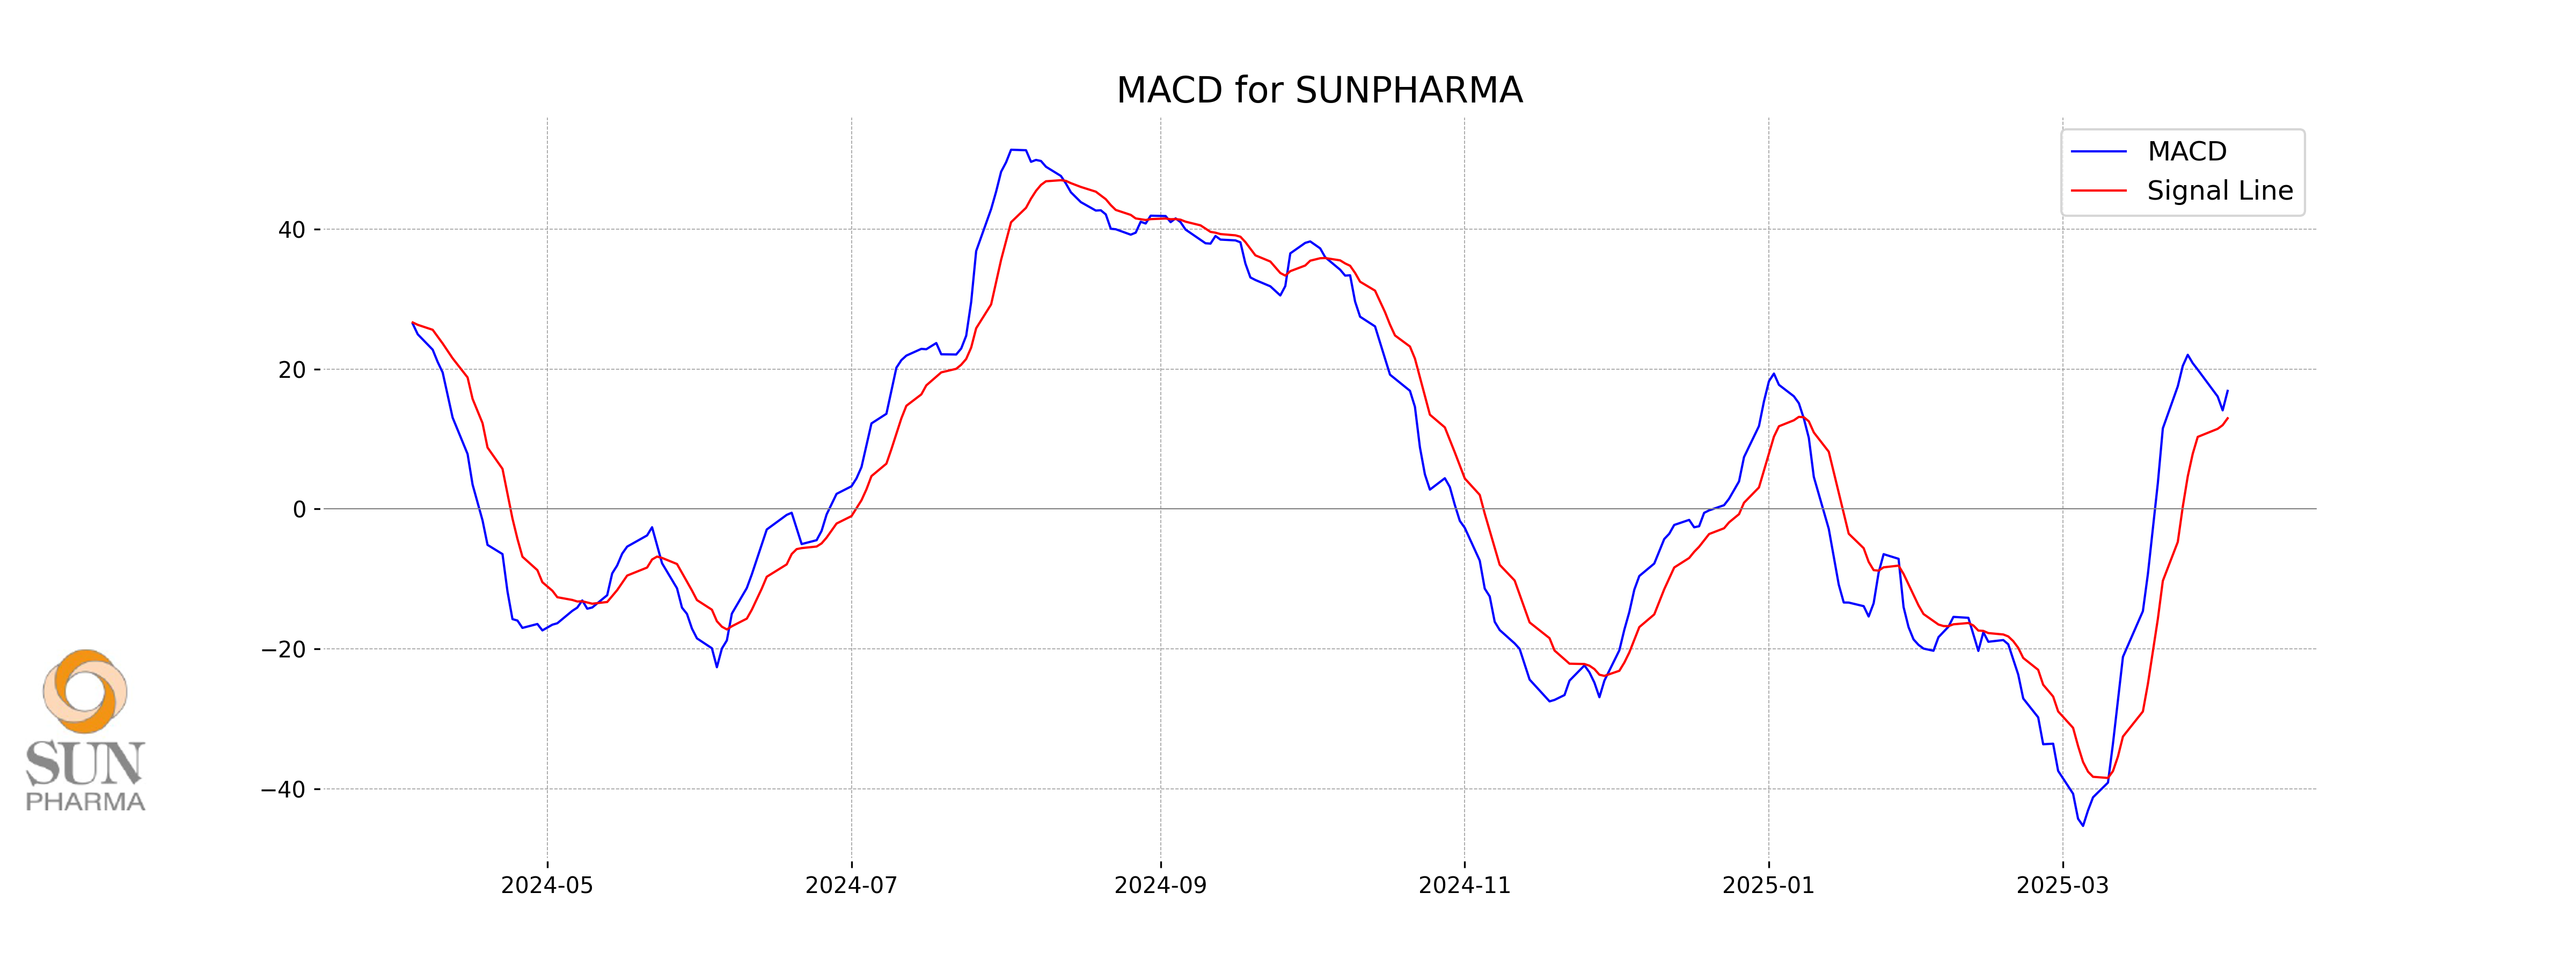
Moving Averages Trend (MACD)
The MACD for SUN Pharma is positioned at 16.88, above the MACD Signal line of 12.96, indicating a bullish momentum in the stock price. This suggests potential continued upward movement, as the MACD indicates growing strength in the current uptrend.
RSI Analysis
RSI Analysis for SUN Pharma The RSI for Sun Pharma is currently at 60.41, indicating that the stock is neither overbought nor oversold. It suggests some level of upward momentum but is still within a neutral range.
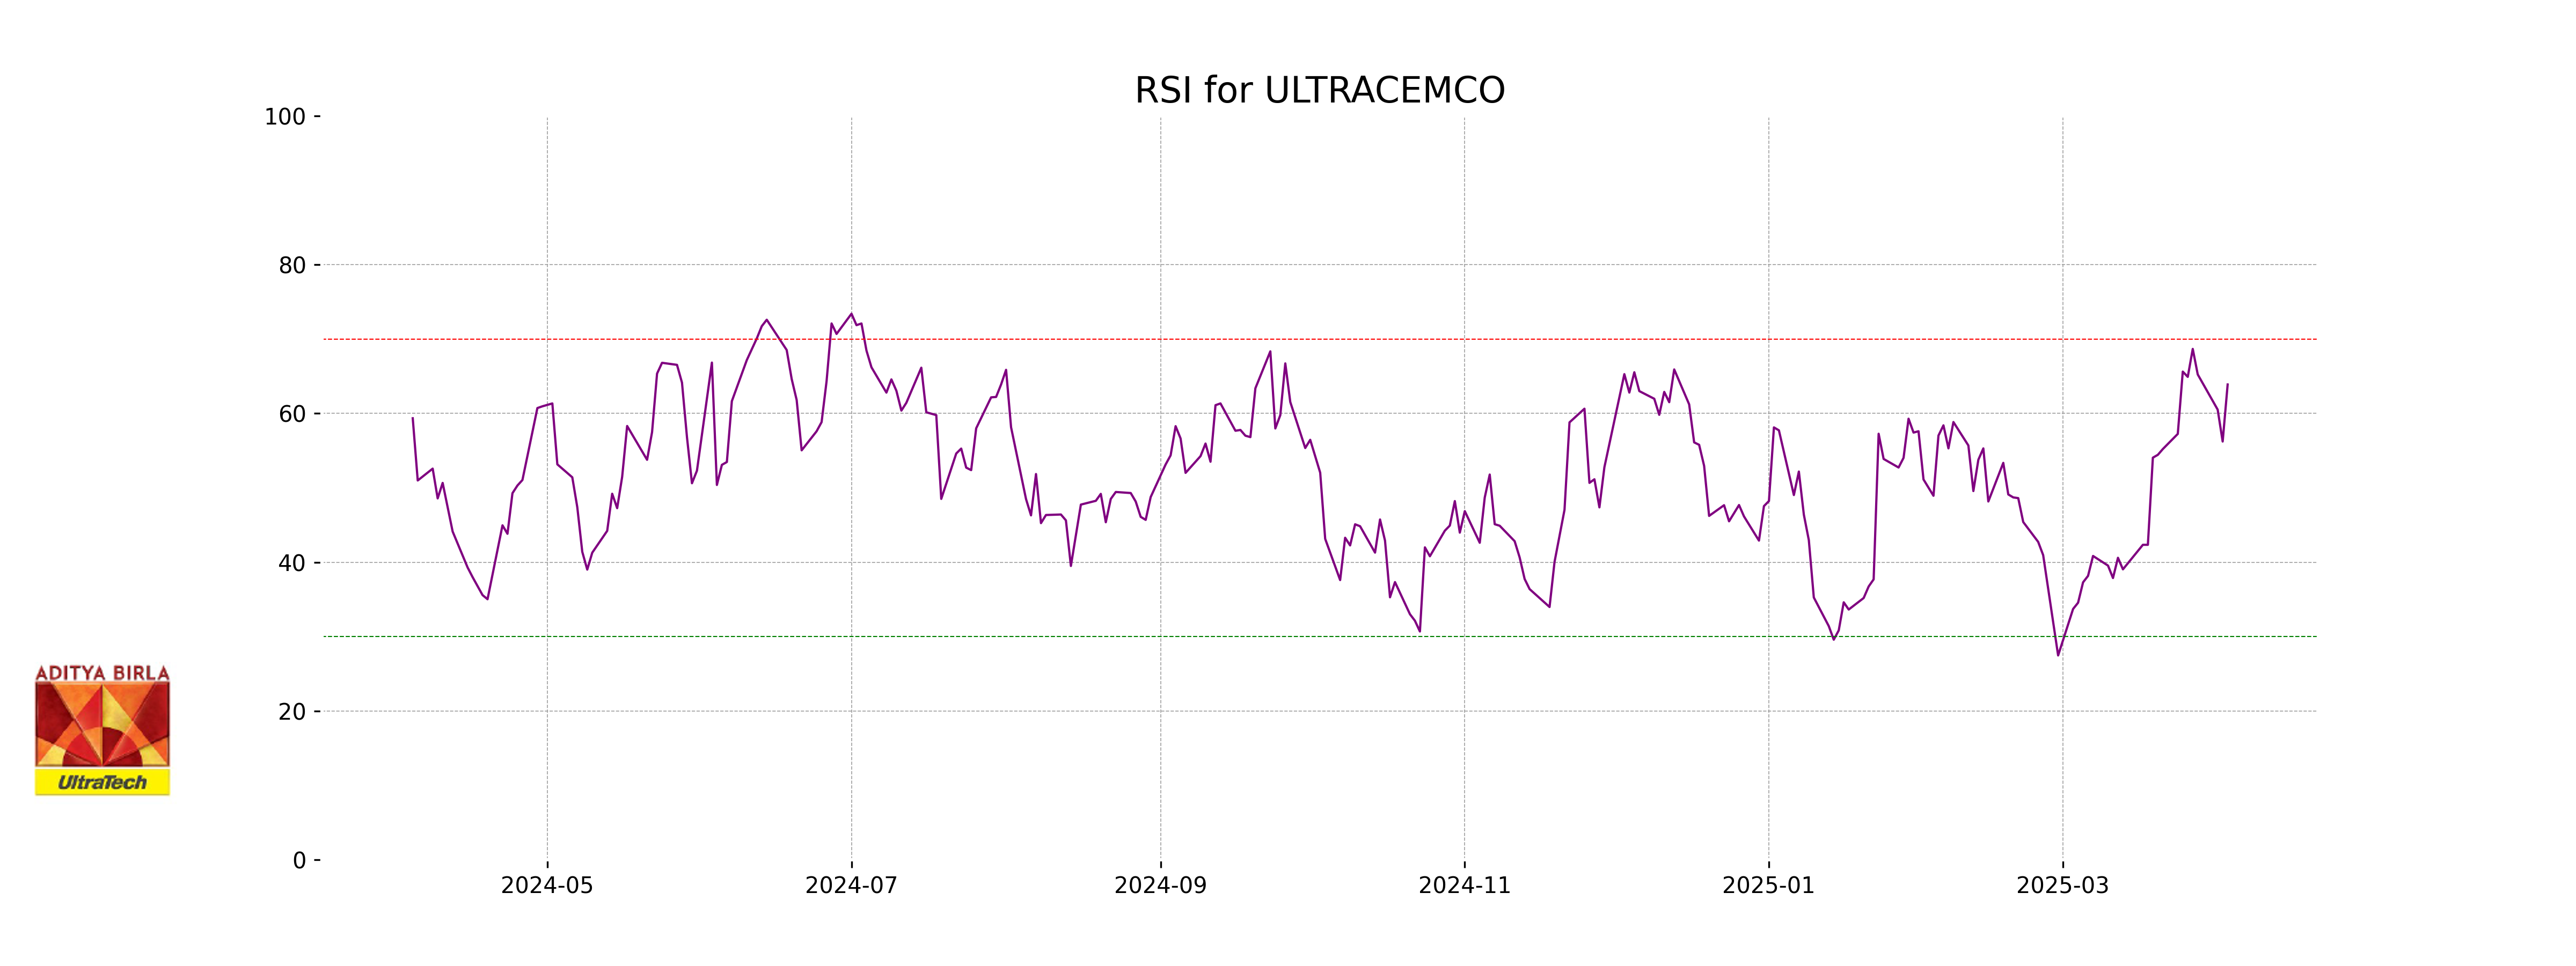
Analysis for UltraTech Cement - April 03, 2025
UltraTech Cement UltraTech Cement demonstrated an impressive performance with a significant closing price increase of 3.16%, reaching 11,606.60 from 11,250.95, accompanied by a robust trading volume of 361,851 shares. The company's RSI stands at 63.89, indicating a relatively strong momentum, while the positive MACD further supports its bullish trajectory. Despite the high PE Ratio of 53.73, UltraTech Cement maintains a strong market cap of approximately 3.4 trillion INR, reflecting its dominant stance in the Basic Materials sector, particularly within the Building Materials industry in India.
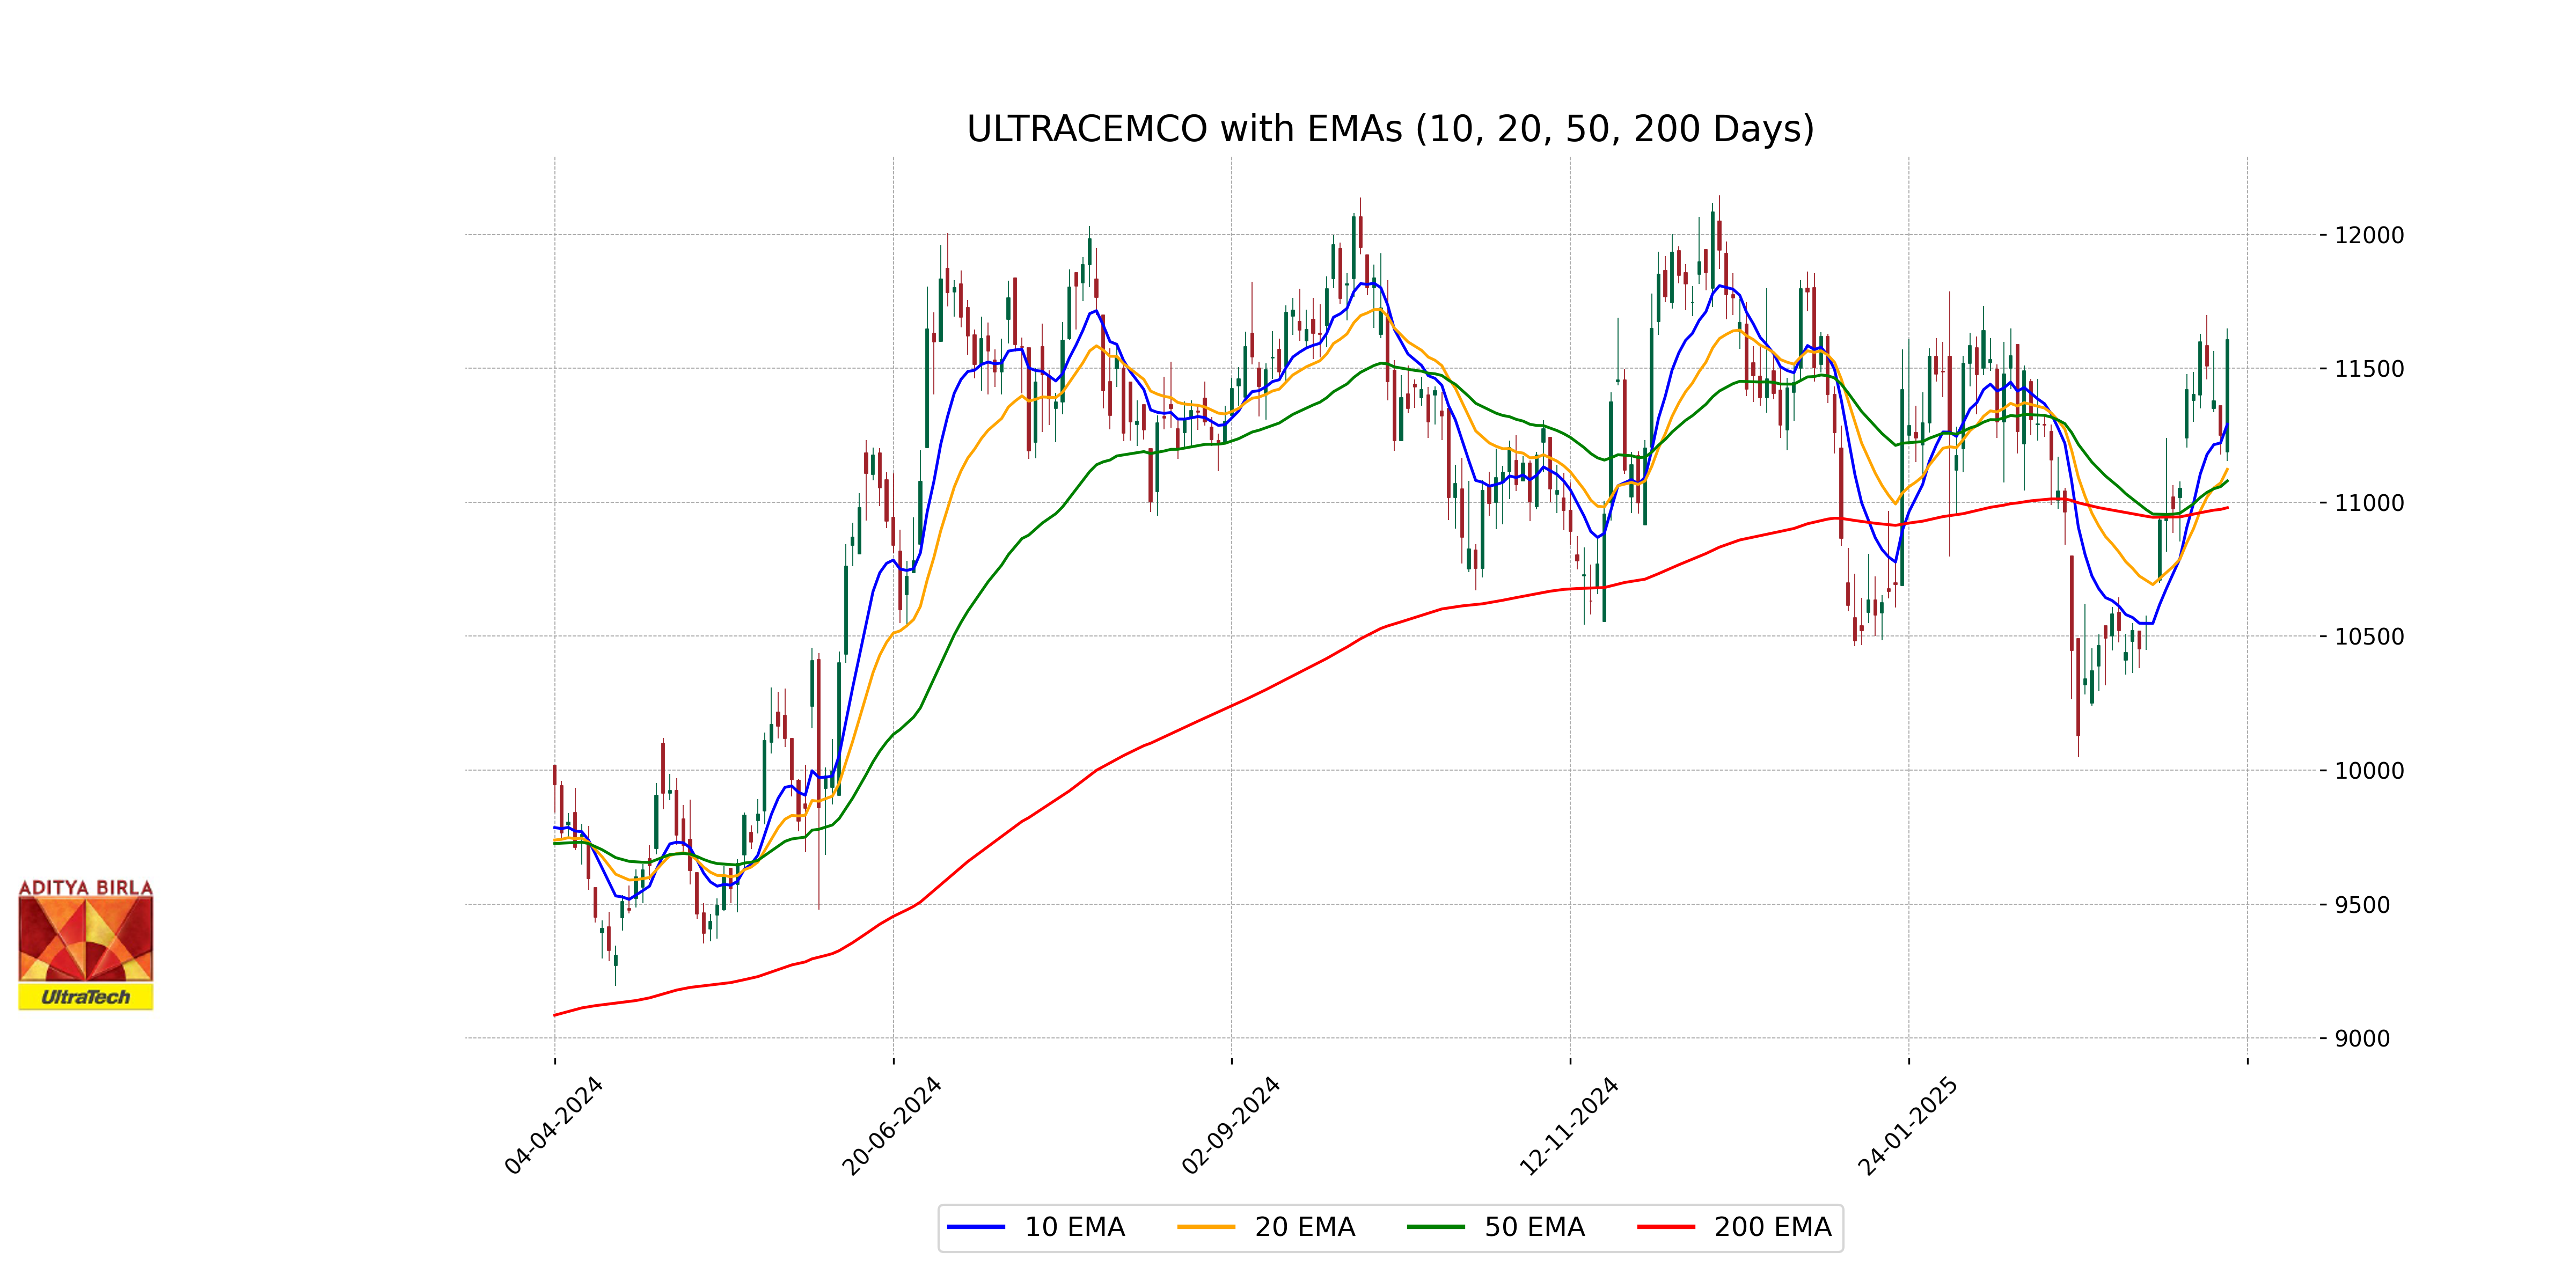
Relationship with Key Moving Averages
UltraTech Cement closed above key moving averages with a closing price of 11606.60, surpassing the 50 EMA of 11079.97, the 200 EMA of 10979.79, the 10 EMA of 11291.63, and the 20 EMA of 11123.21. The stock exhibits a positive short-term trend as reflected in the higher close relative to these averages.
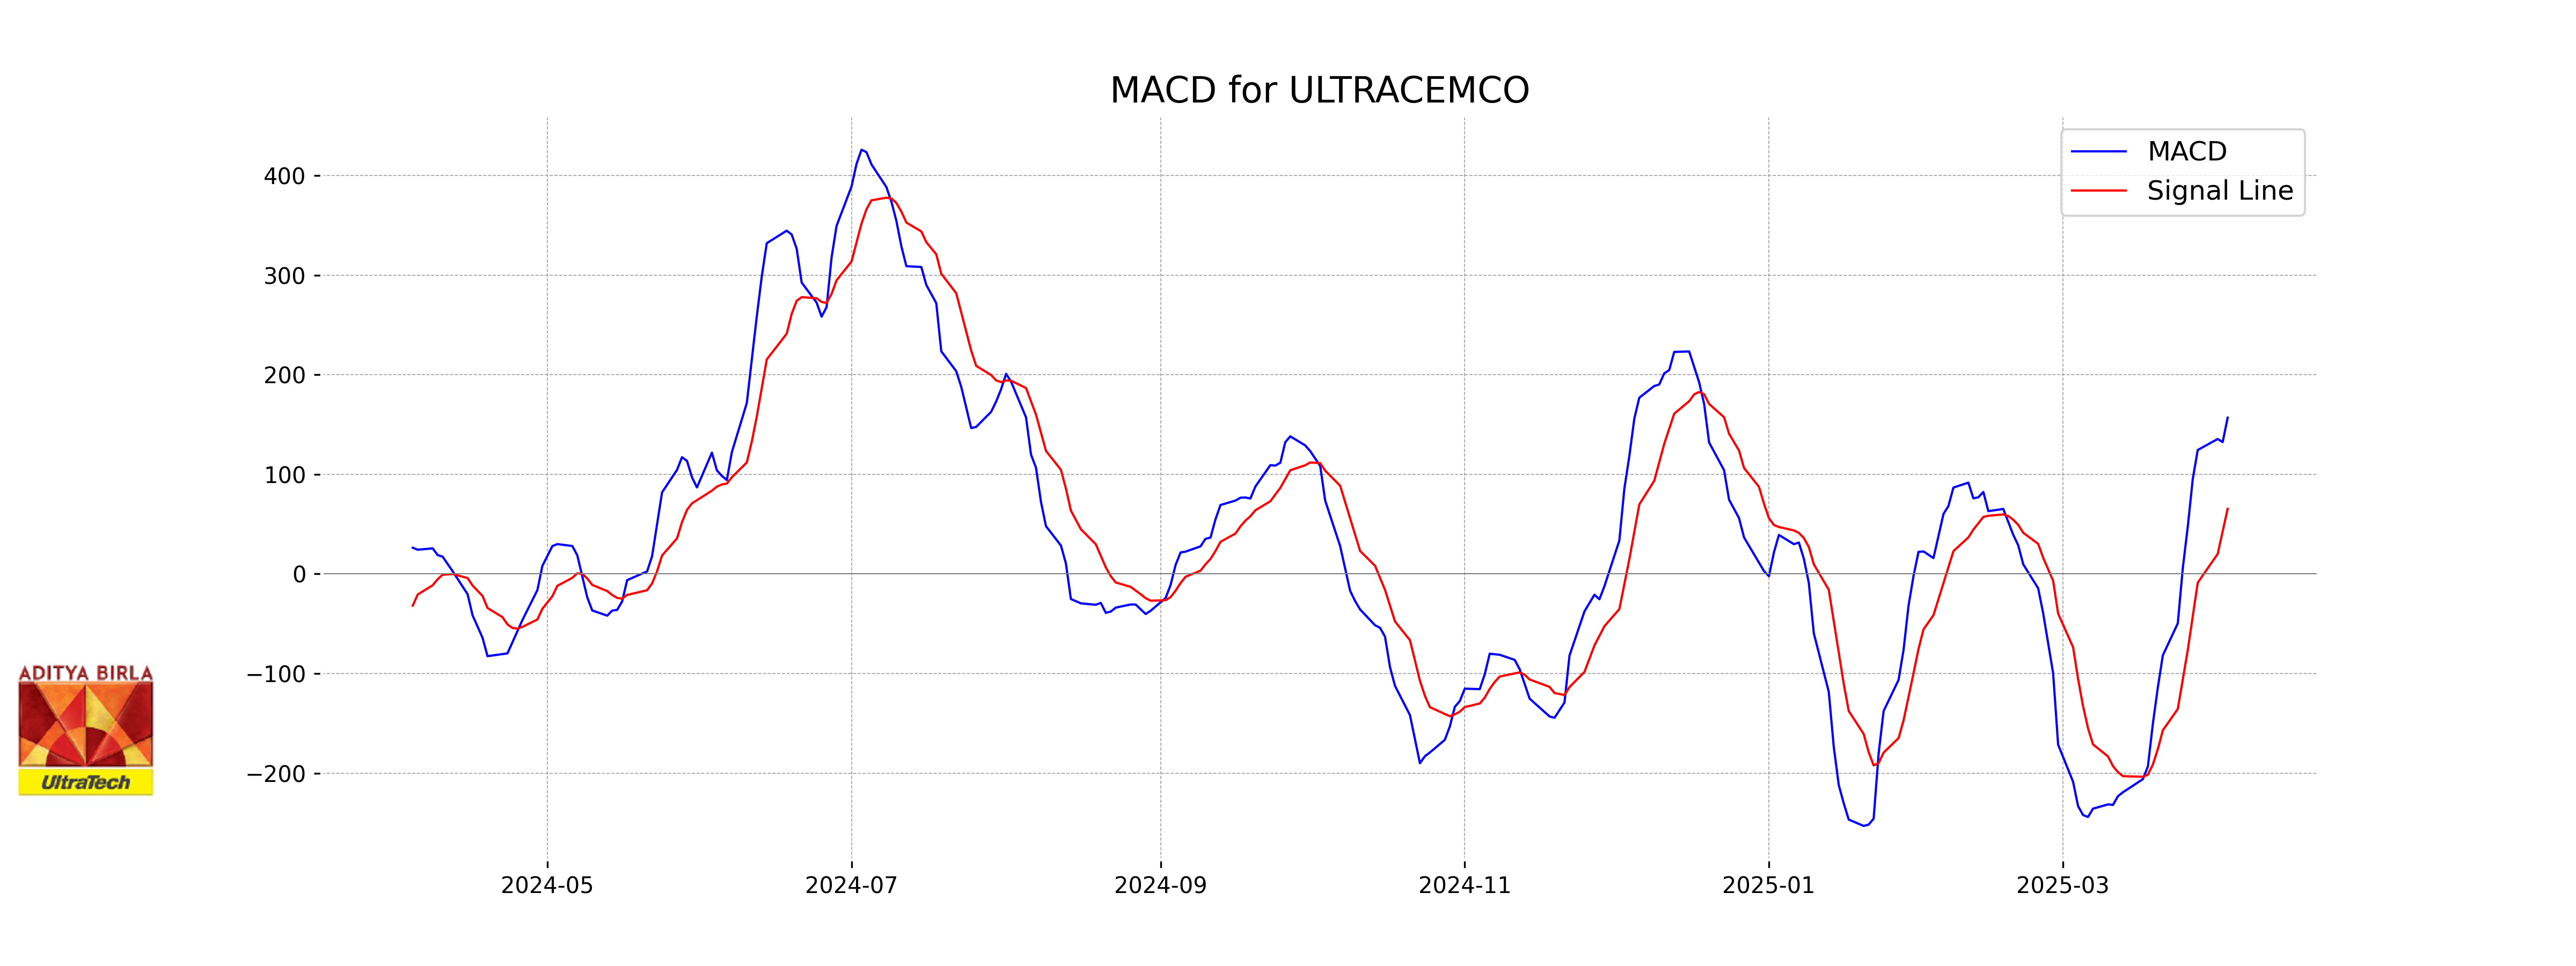
Moving Averages Trend (MACD)
MACD Analysis for UltraTech Cement: The MACD value is 156.88, which is significantly higher than the MACD Signal at 65.43. This indicates a strong bullish momentum for UltraTech Cement, suggesting potential upward movement in the stock price.
RSI Analysis
For UltraTech Cement, the RSI (Relative Strength Index) stands at 63.89, indicating that the stock is nearing an overbought condition but still within a neutral range. This suggests that while the stock has been seeing upward momentum, it is not yet in the overbought territory, typically above 70, where it might experience a downturn.