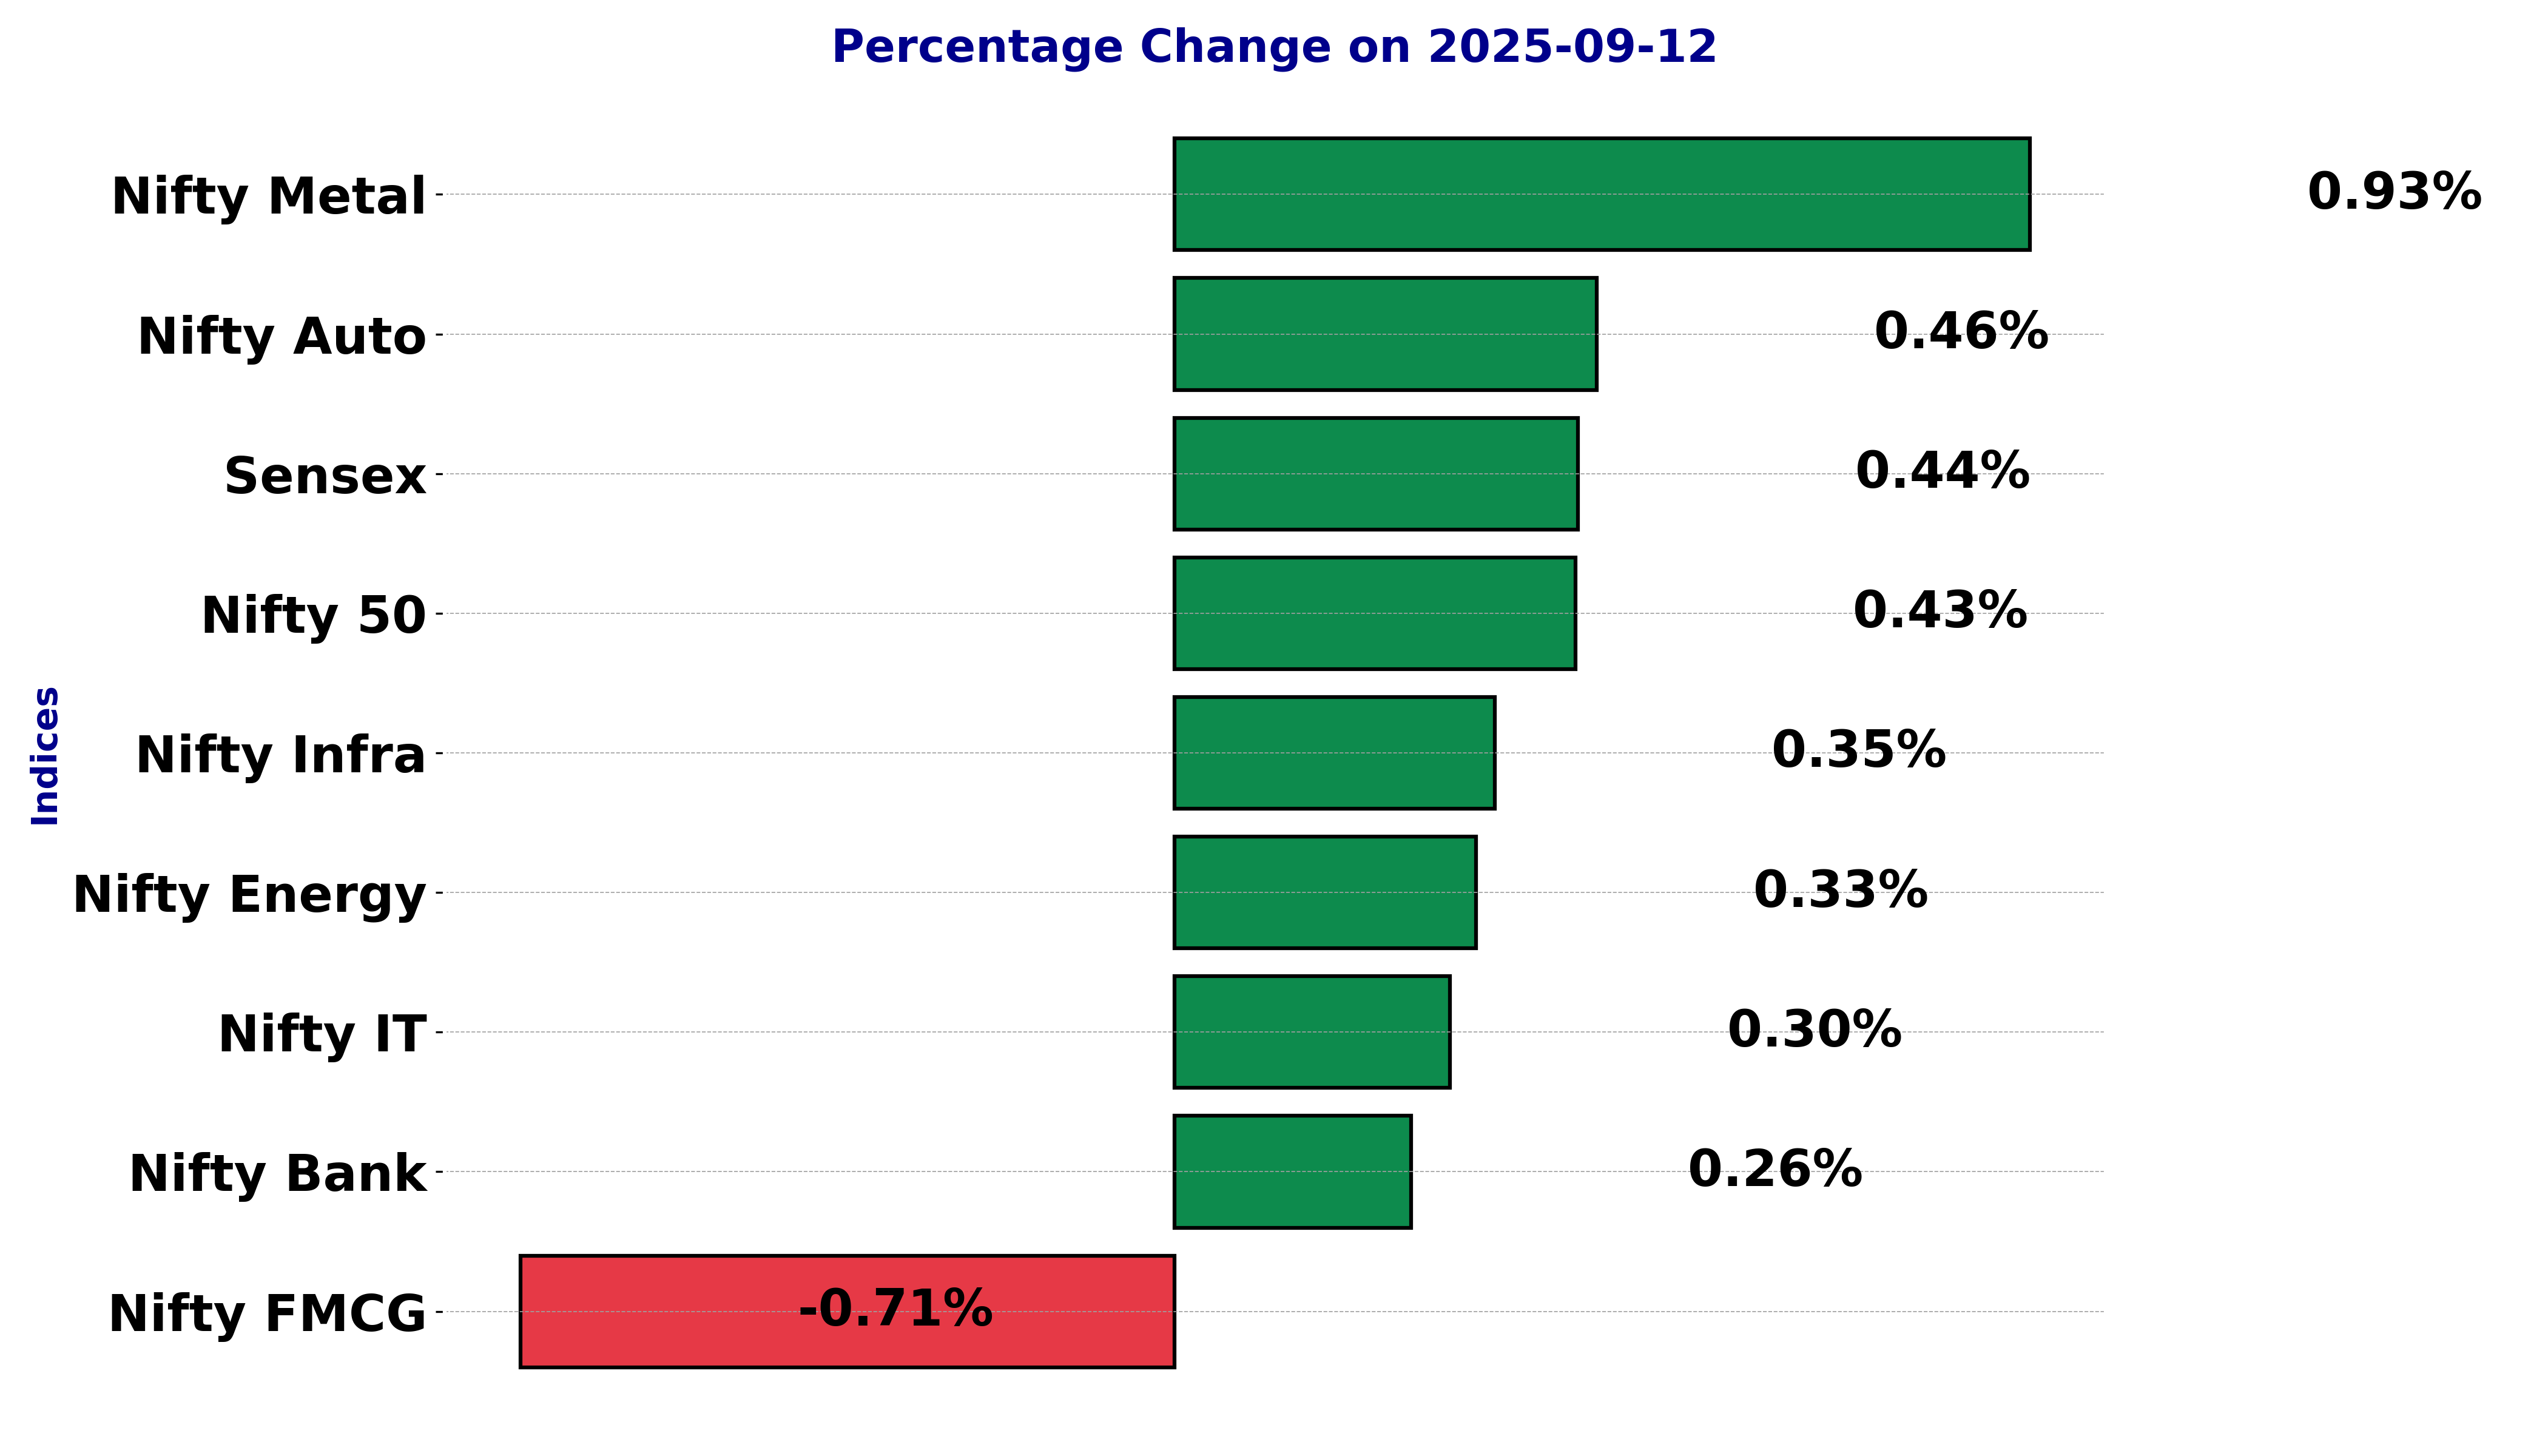
Indian stock market sector-wise performance today - September 12, 2025
The stock market on Friday (September 12, 2025) experienced varied movements across different sectors and indices, with some notable performances and fluctuations.
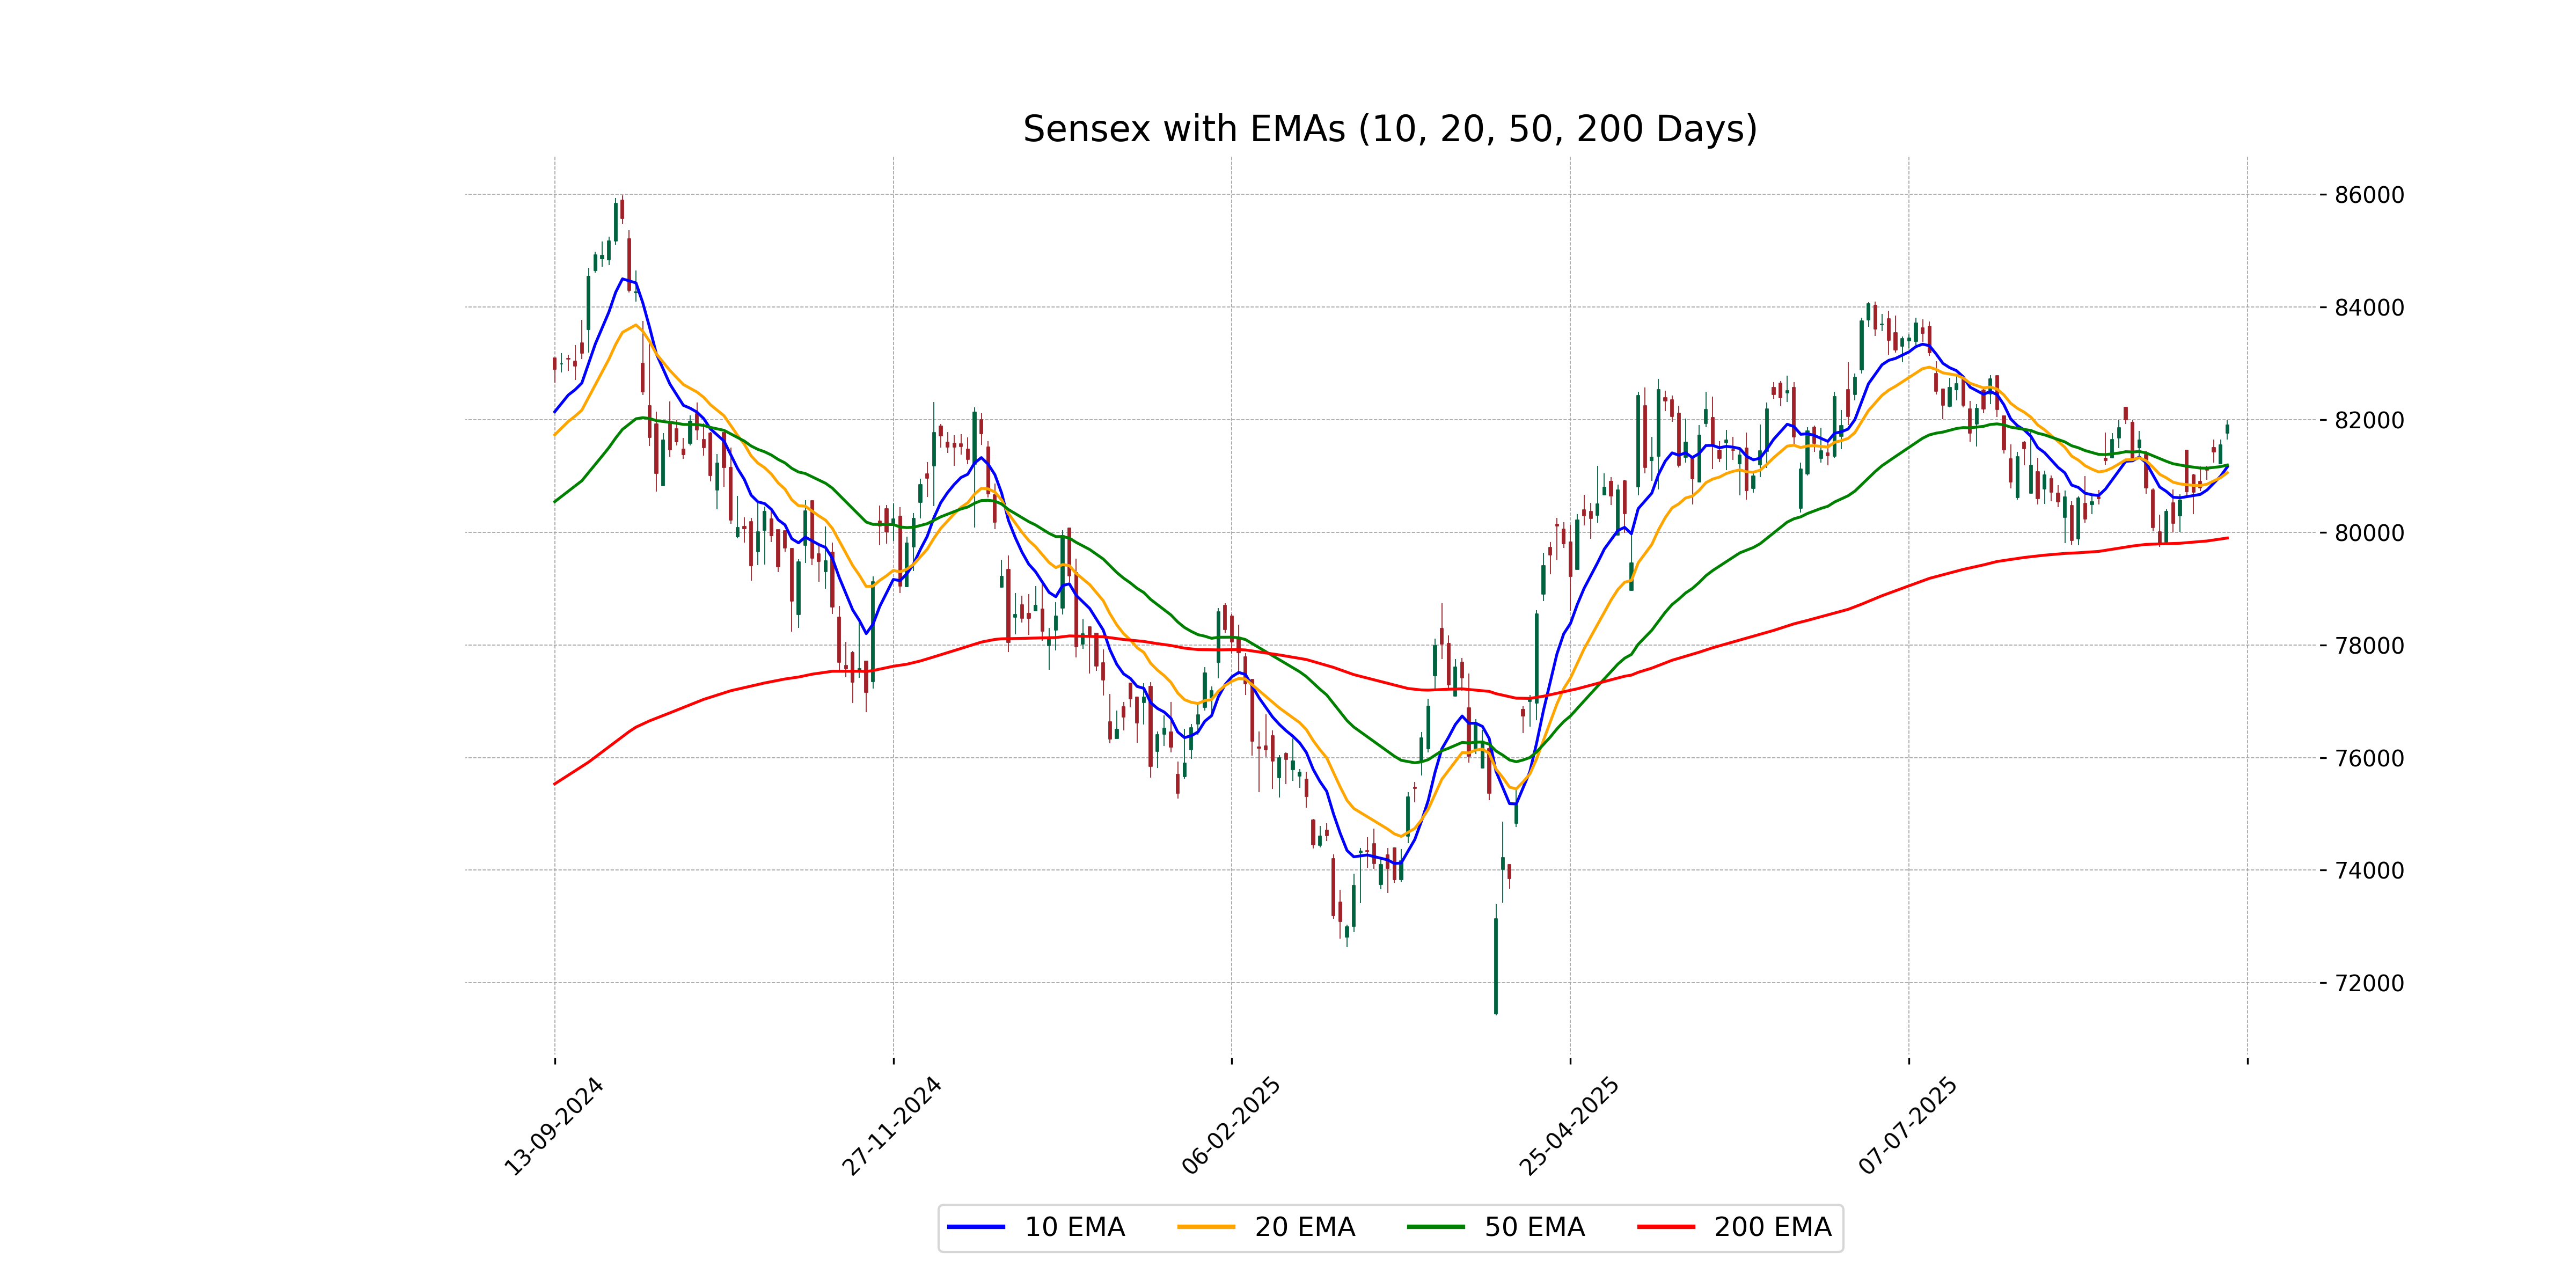
Starting with the Sensex, the index saw a modest gain, closing at 81,904.70, marking a percentage change of 0.44%. The market appeared stable, with a consistent upward trend supported by both the 50-day and 200-day EMA values being lower than the closing value.
In terms of specific sectors, the Auto Sector index showed an impressive rise with a percentage change of 0.46%, closing at 26,866.65.
The movement can be attributed to positive investor sentiment towards the automotive industry, likely driven by anticipated growth in the sector. Conversely, the FMCG sector underperformed, experiencing a decline of 0.71%, closing at 56,557.15. This drop is significant as it reflects potential profit-taking by investors after previous gains or a reaction to less favorable market conditions within the fast-moving consumer goods industry.
The Energy Sector index had a mild increase of 0.33%, closing at 34,940.30. The energy market's outlook remained steady, with the index closing slightly above its previous close.
The Metals Sector stood out with the highest positive movement, registering a substantial gain of 0.93% and closing at 9,883.60. This surge in the Metals Sector is indicative of increased demand or positive forecasts within the industry, attracting investor interest.
The Bank Sector index showed a small increase of 0.26%, closing at 54,809.30. The banking sector remained relatively stable, reflecting consistent growth momentum.
The Infra Sector had a positive shift of 0.35%, ending the day at 9,074.00. This steady increase corresponds to a gradual recovery or ongoing investments in infrastructure projects.
Nifty IT closed at 36,110.75, showing a slight increase of 0.30%. The technology sector continued to attract attention, potentially due to advancements in IT services and products contributing to growth.
Finally, the Nifty 50 index concluded the session with a 0.43% increase, closing at 25,114.00. Overall, the market sentiment appeared optimistic, with broad-based gains across multiple sectors.
Among the indices and sectors, the Metal Sector had the most significant positive change. The notable gain of 0.93% in this sector could be attributed to rising commodity prices or positive policy developments affecting the metal industry.
Additionally, an increase in industrial activity and export demand may have bolstered investor confidence, making it a focal point for market movements on this day. These varied performances across different sections of the market highlight the dynamic nature of financial markets, where industry-specific trends and macroeconomic factors can significantly impact investor behavior and market outcomes.
Analysis for Sensex - September 12, 2025
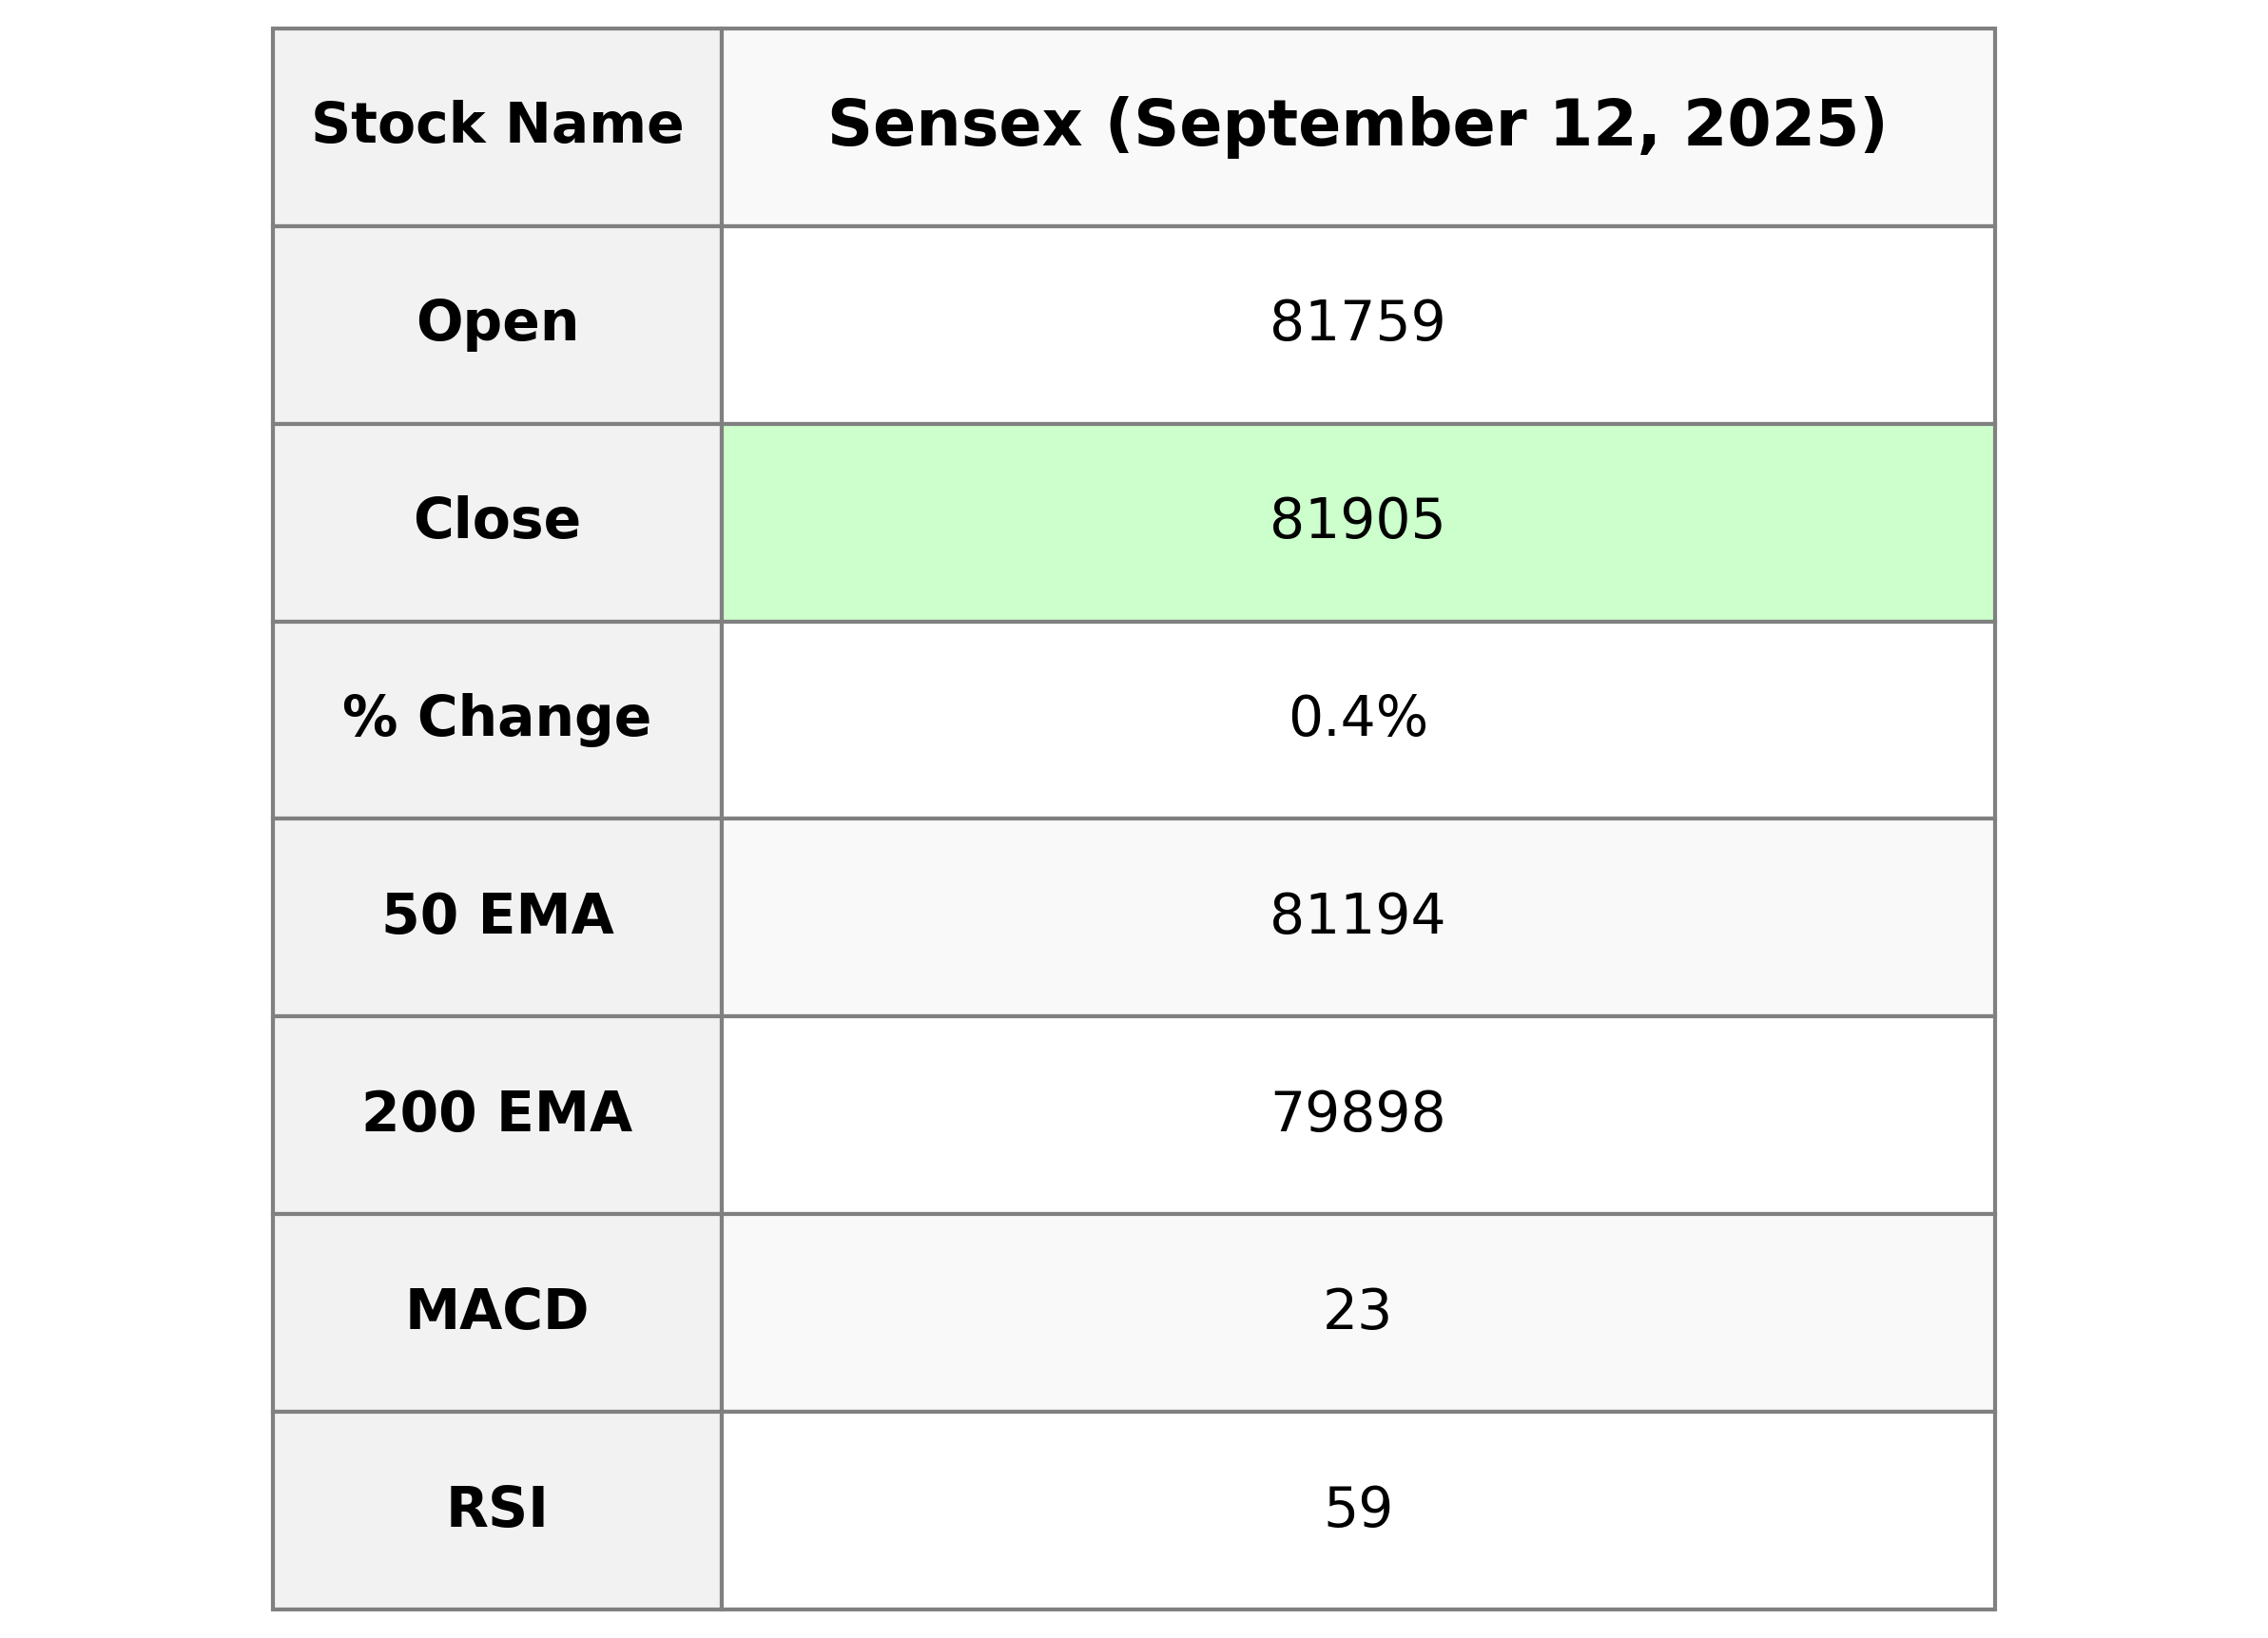
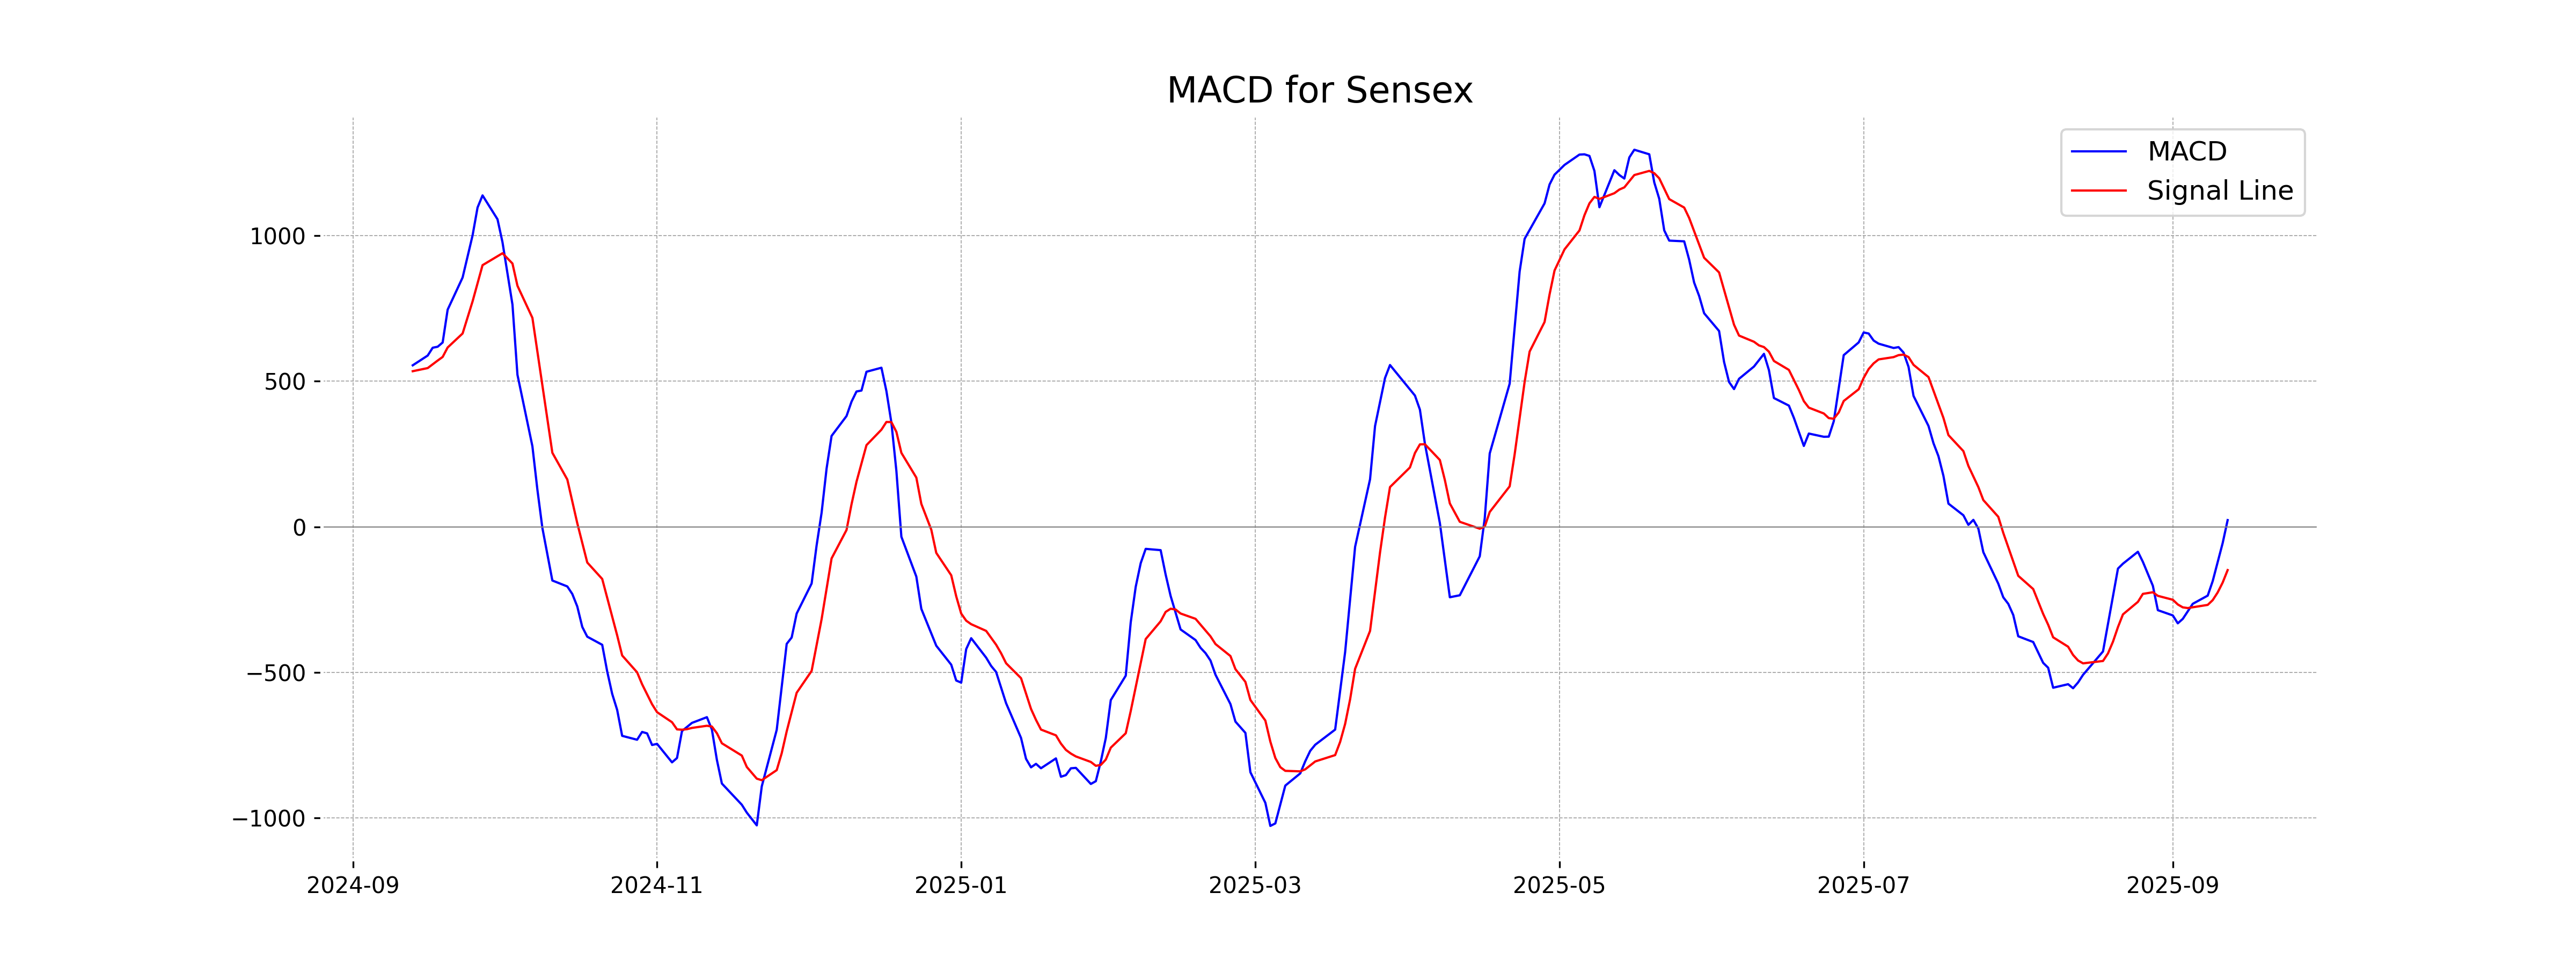
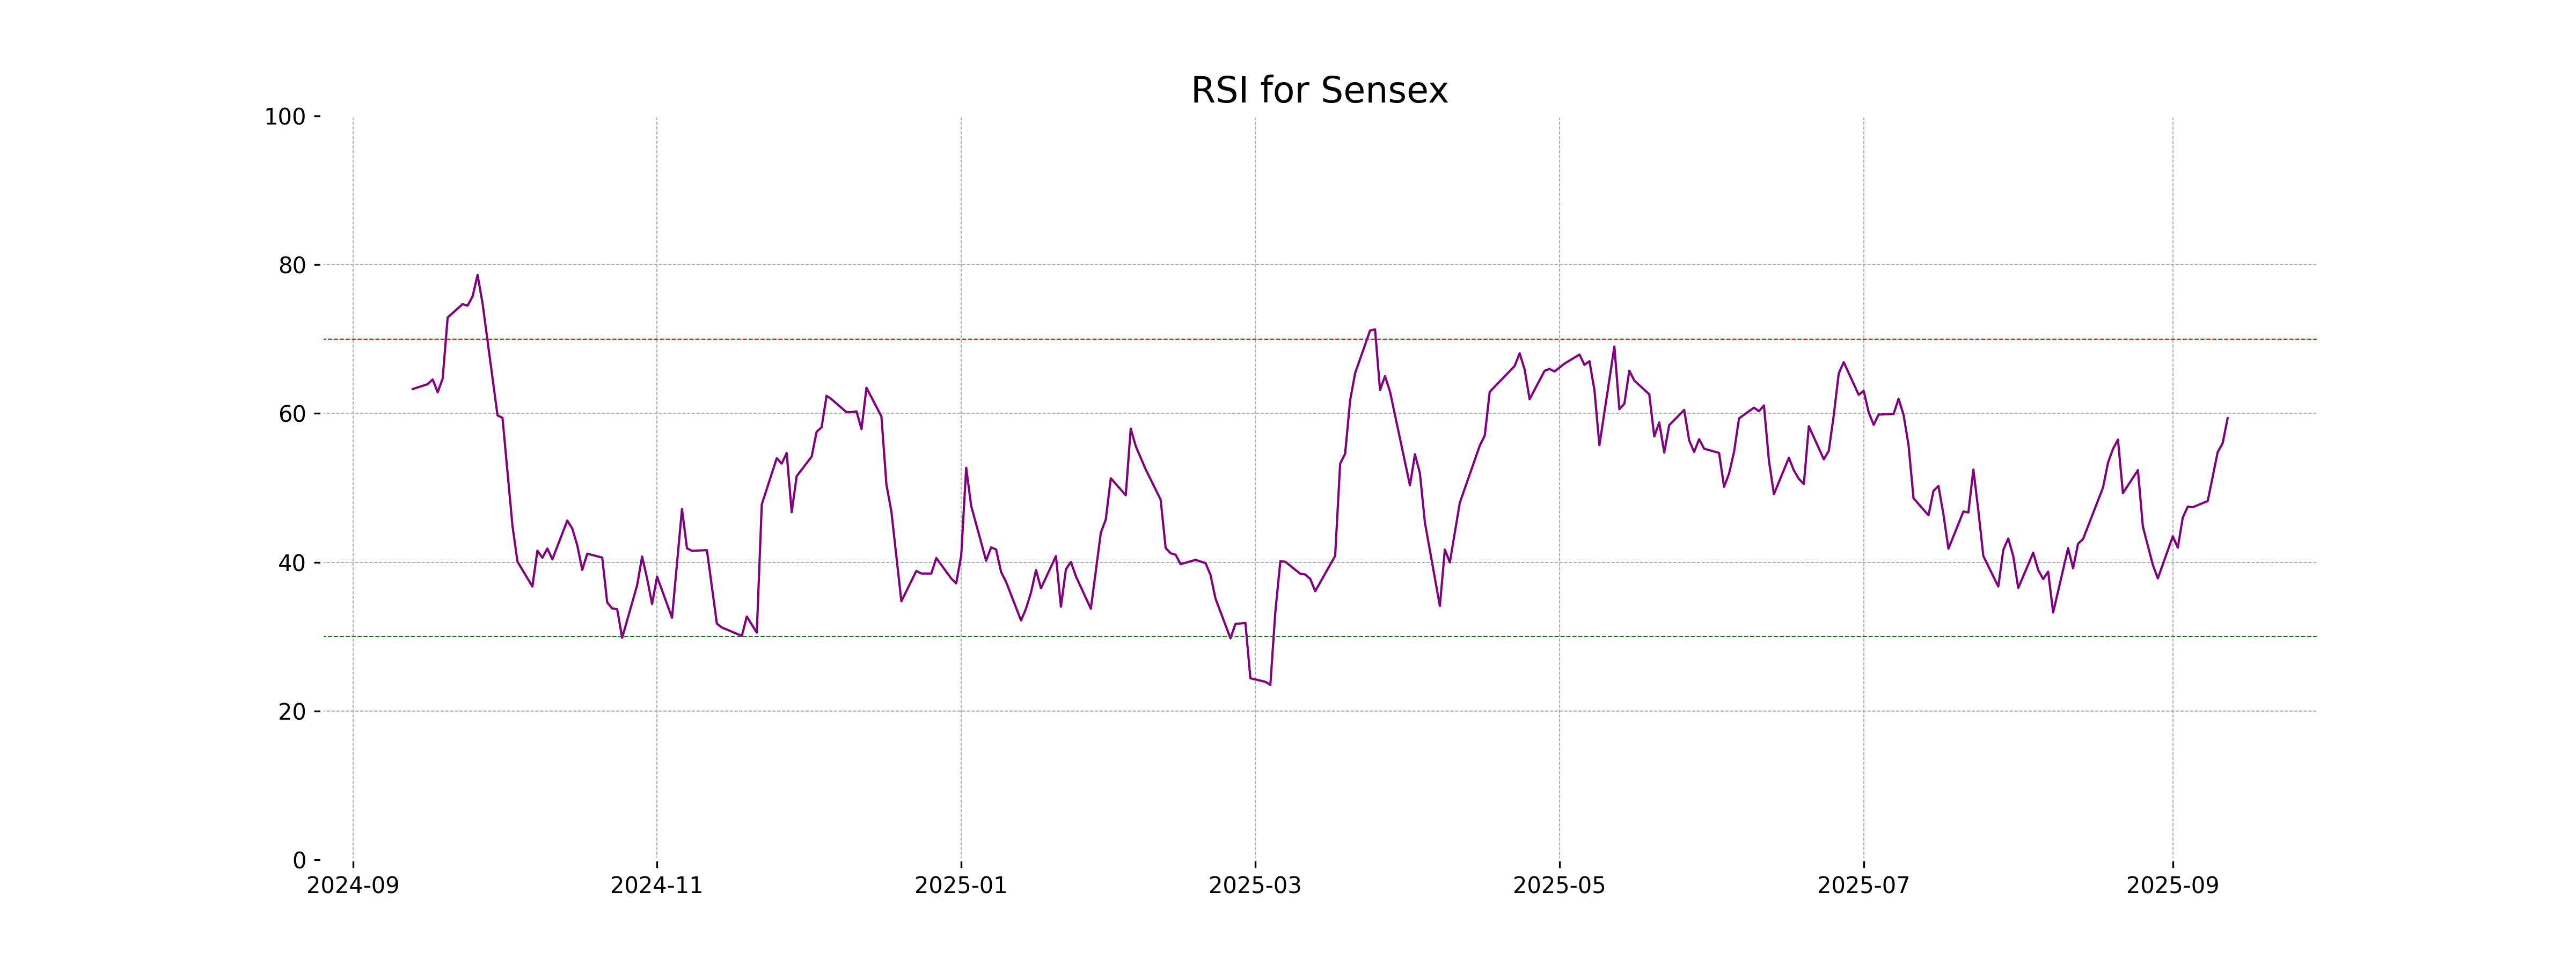
Sensex Performance The Sensex opened at 81,758.95 and closed at 81,904.70, marking a gain with a point change of 355.98 and a percentage change of 0.44%. With an RSI of 59.37, it indicates a moderately positive market sentiment. The MACD at 22.99 shows potential uptrend momentum against a significantly low MACD Signal of -148.64.
Relationship with Key Moving Averages
The close of Sensex at 81904.7031 is above the 50-day EMA of 81193.8942 and the 200-day EMA of 79897.5306, indicating a possible bullish trend. The current price is also above the 10-day and 20-day EMAs, suggesting short-term positive momentum.
Moving Averages Trend (MACD)
The MACD for the Sensex currently stands at 22.99, which is higher than the MACD Signal of -148.64. This positive MACD value suggests a bullish momentum, indicating that the Sensex might experience upward movement in the short term.
RSI Analysis
The RSI for Sensex is 59.37, indicating that the stock is approaching an overbought territory, but it is still below the typical overbought threshold of 70. This suggests there may still be room for upward movement before any major corrective actions might be expected.
Analysis for Nifty Auto - September 12, 2025

Nifty Auto opened at 26796.0 and closed at 26866.65, showing a 0.46% gain with a points increase of 122.20 from its previous close of 26744.45. The Relative Strength Index (RSI) of 71.56 indicates it's in overbought territory. The MACD of 703.62 suggests a positive trend as it stands above the MACD Signal line of 605.87.
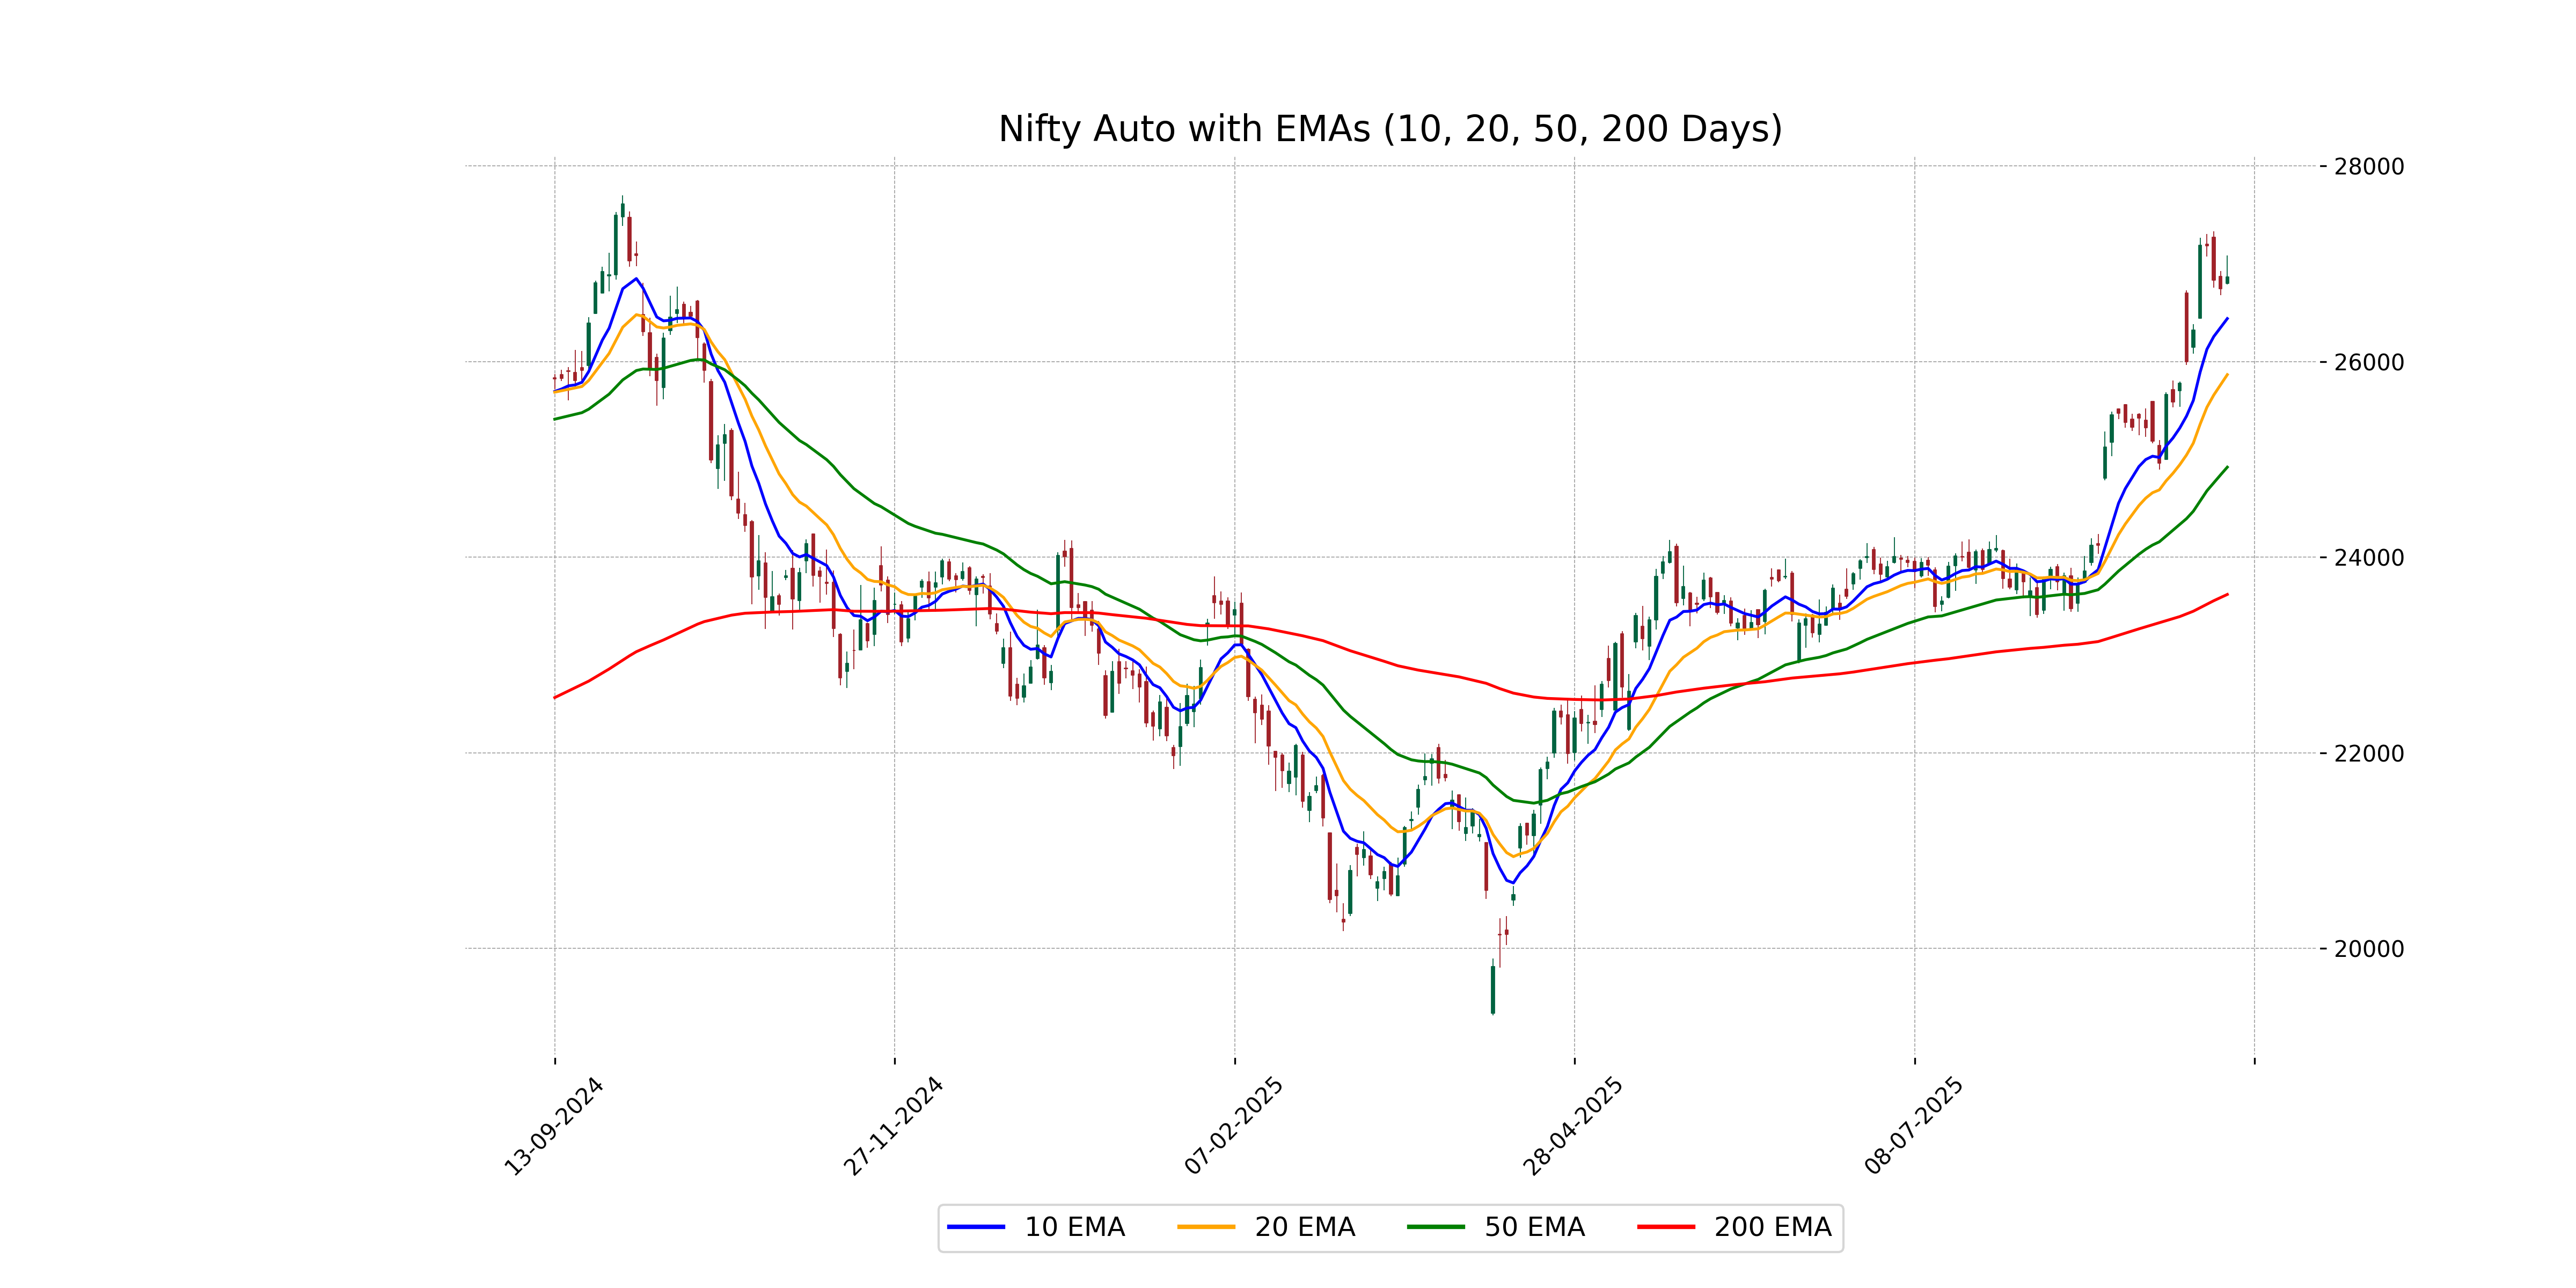
Relationship with Key Moving Averages
The closing price of Nifty Auto is above its 10 EMA, 20 EMA, 50 EMA, and 200 EMA, indicating a bullish trend. Additionally, the RSI is above 70, suggesting that the index might be overbought. The MACD also shows bullish momentum with the MACD line above the signal line.
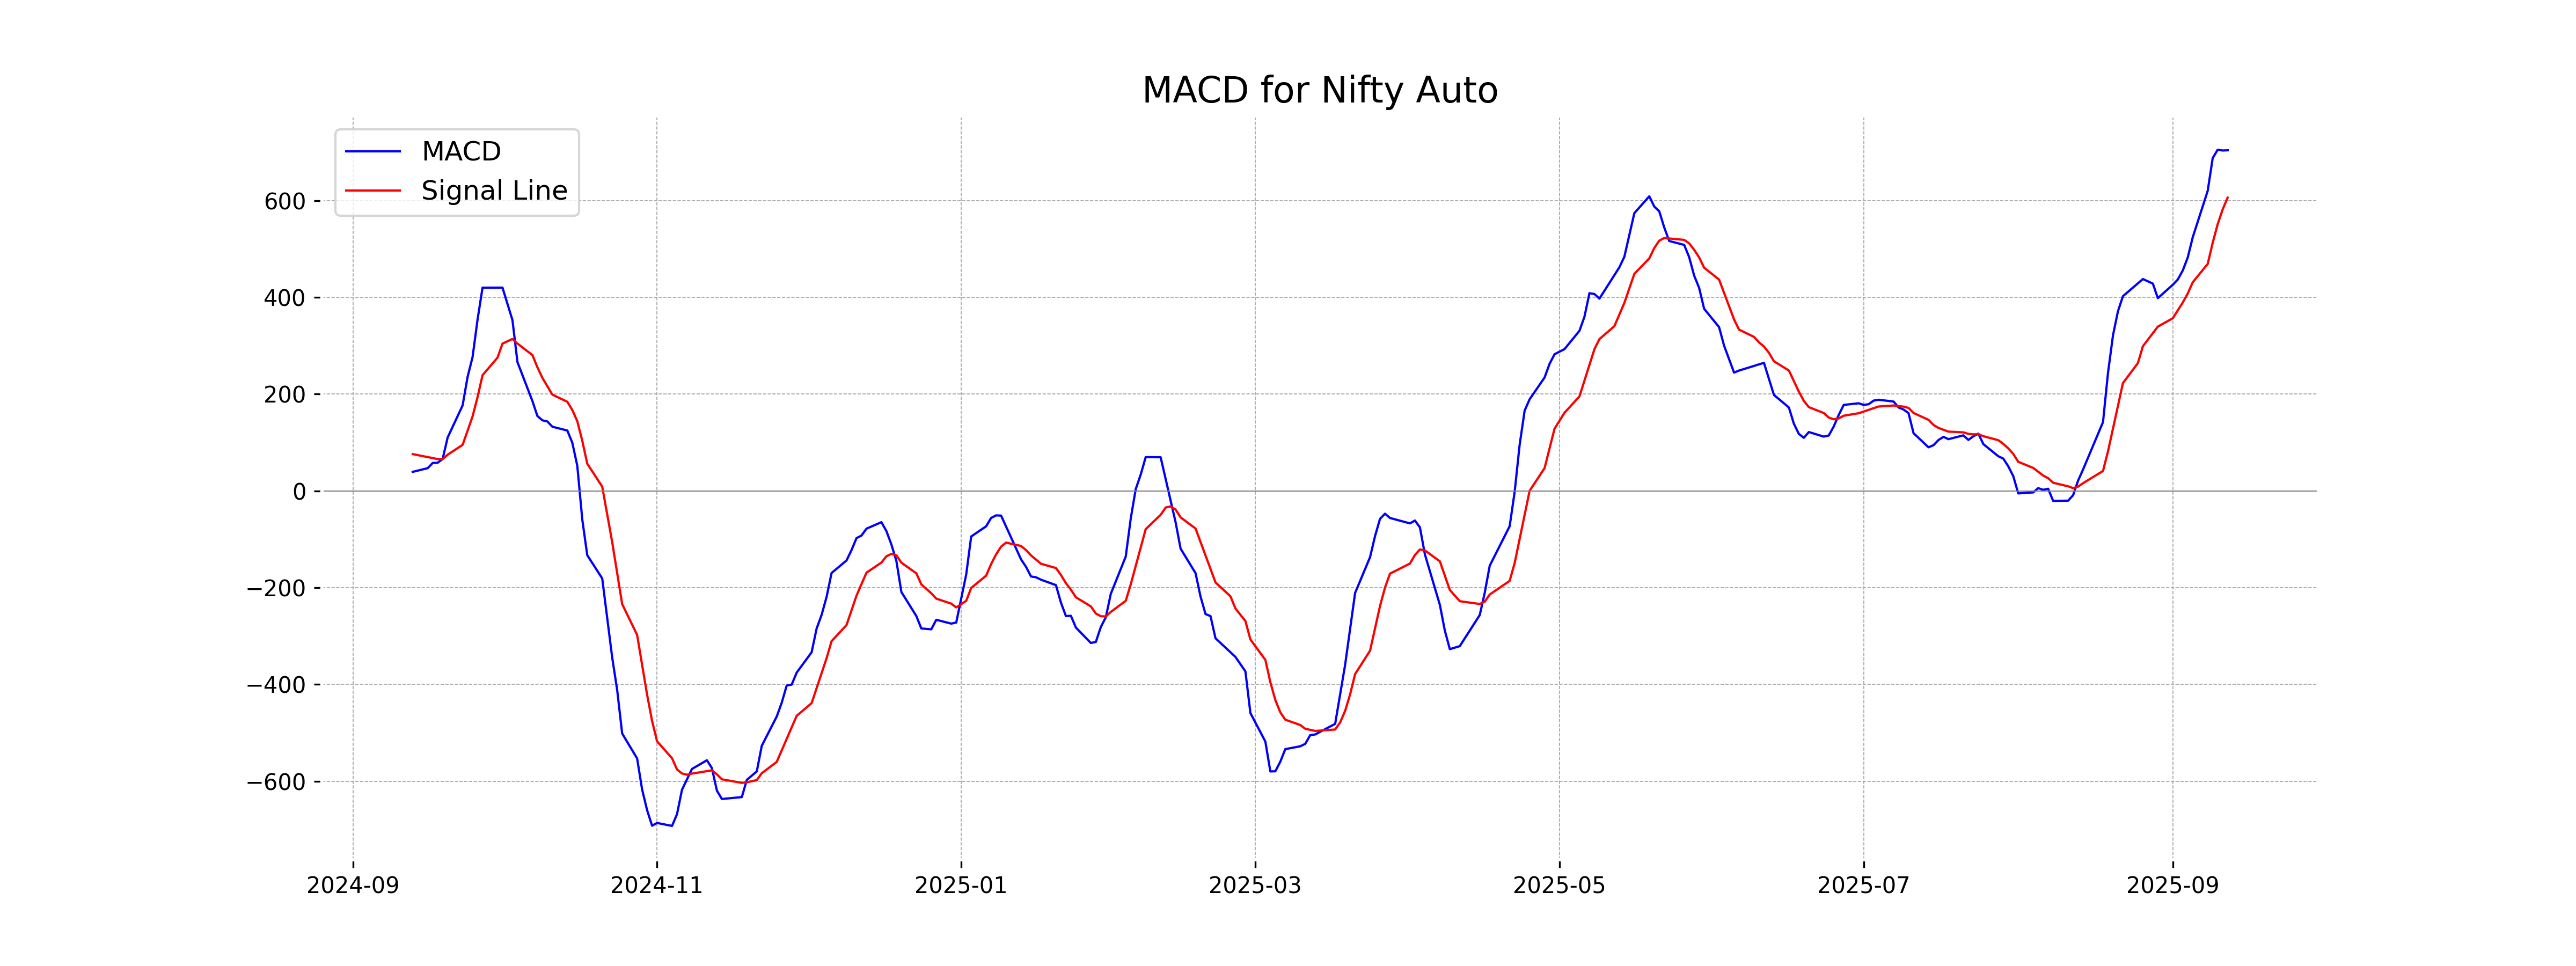
Moving Averages Trend (MACD)
The MACD value for Nifty Auto is 703.62, which is above the MACD Signal line of 605.87, indicating bullish momentum. This suggests potential upward movement in the near term, especially considering the current RSI of 71.56, which is in the overbought range.
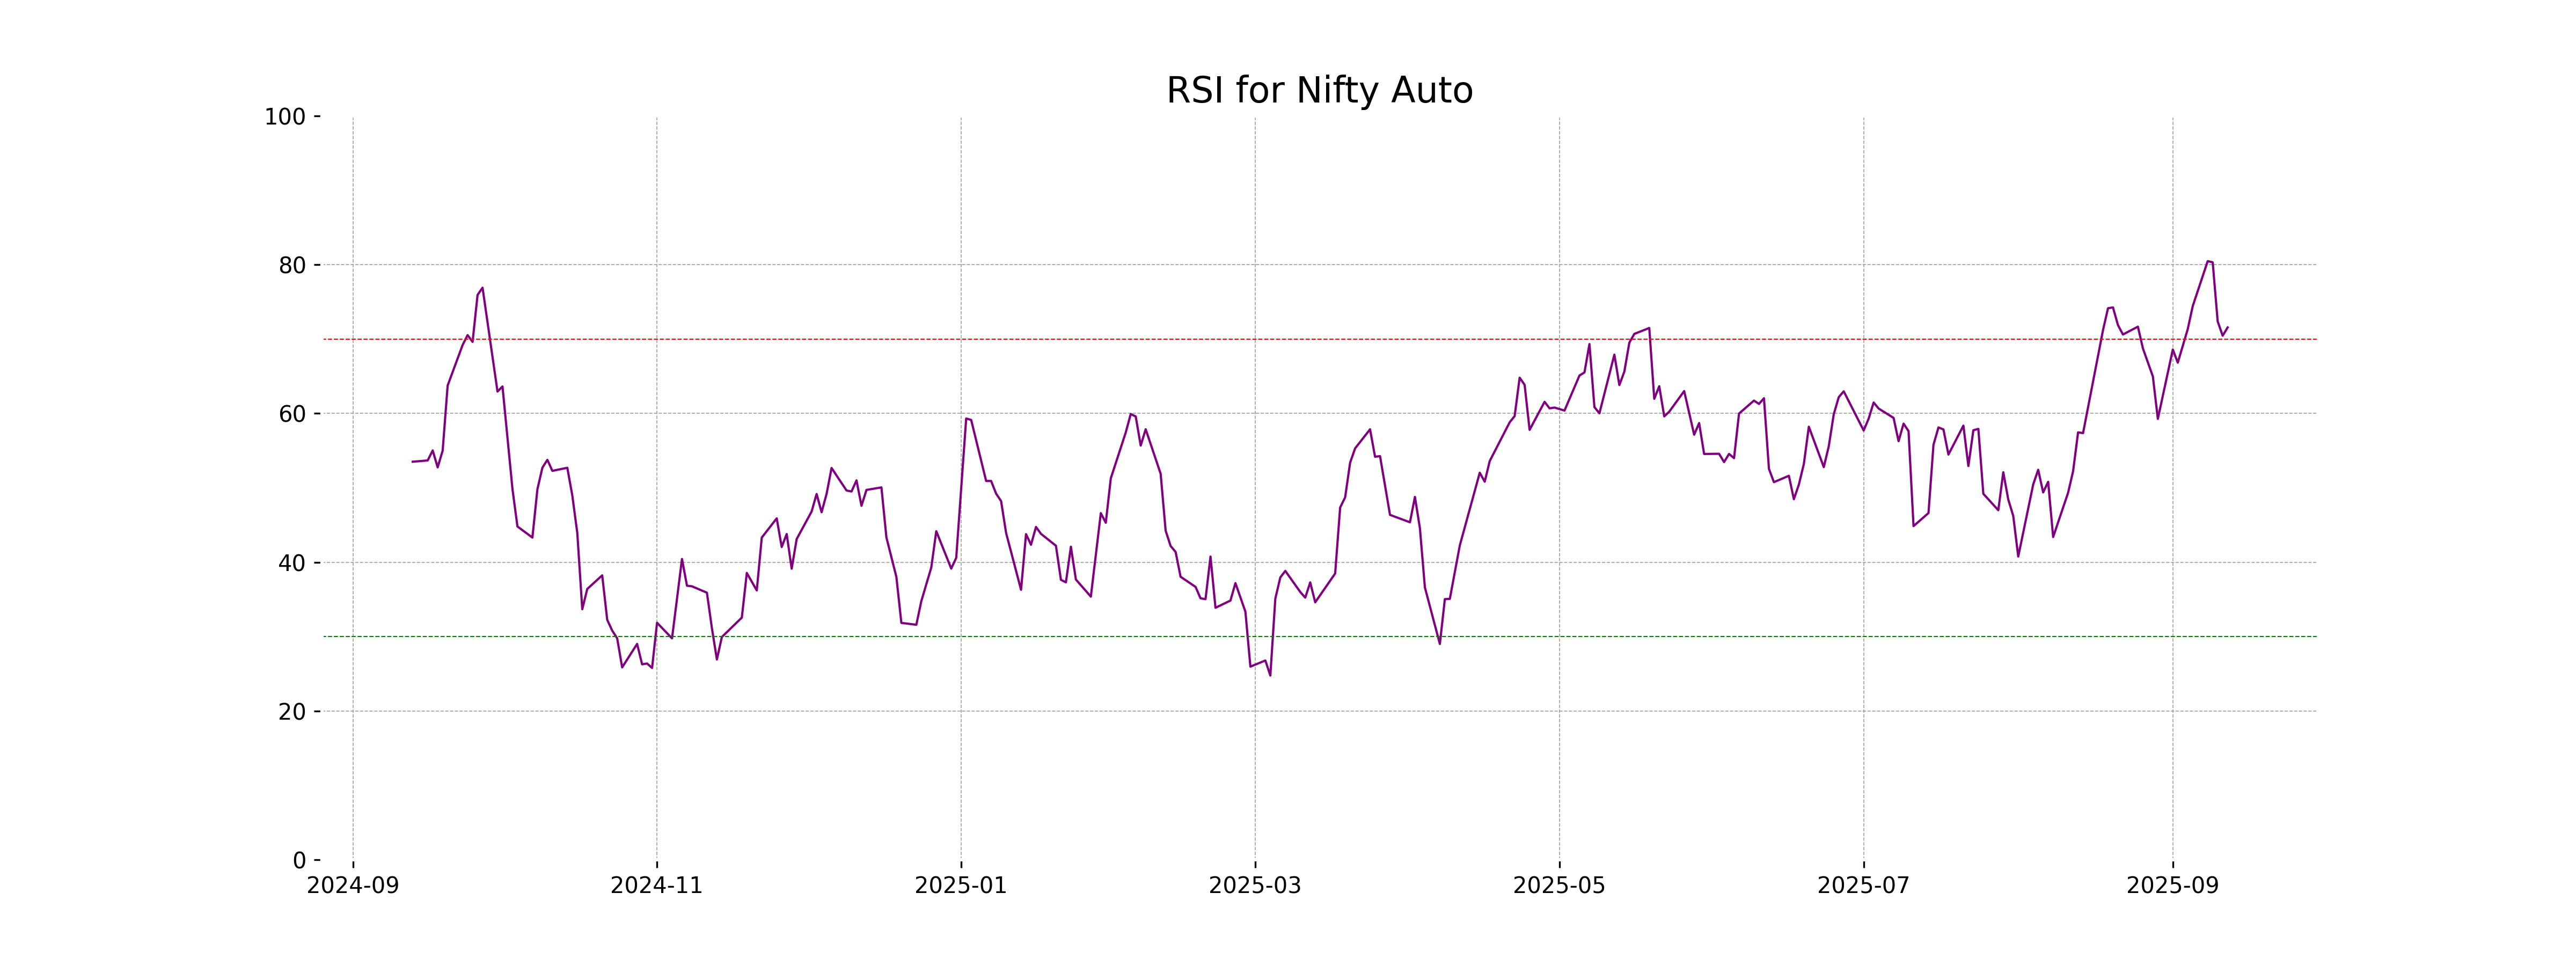
RSI Analysis
Nifty Auto RSI Analysis: The RSI of Nifty Auto is currently at 71.56, which positions it in the overbought territory, indicating that the index may be experiencing strong upward momentum. Traders often interpret this as a signal that the index could be due for a correction or a period of consolidation. However, it is essential to consider other indicators and market conditions before making any trading decisions.
Analysis for Nifty Energy - September 12, 2025
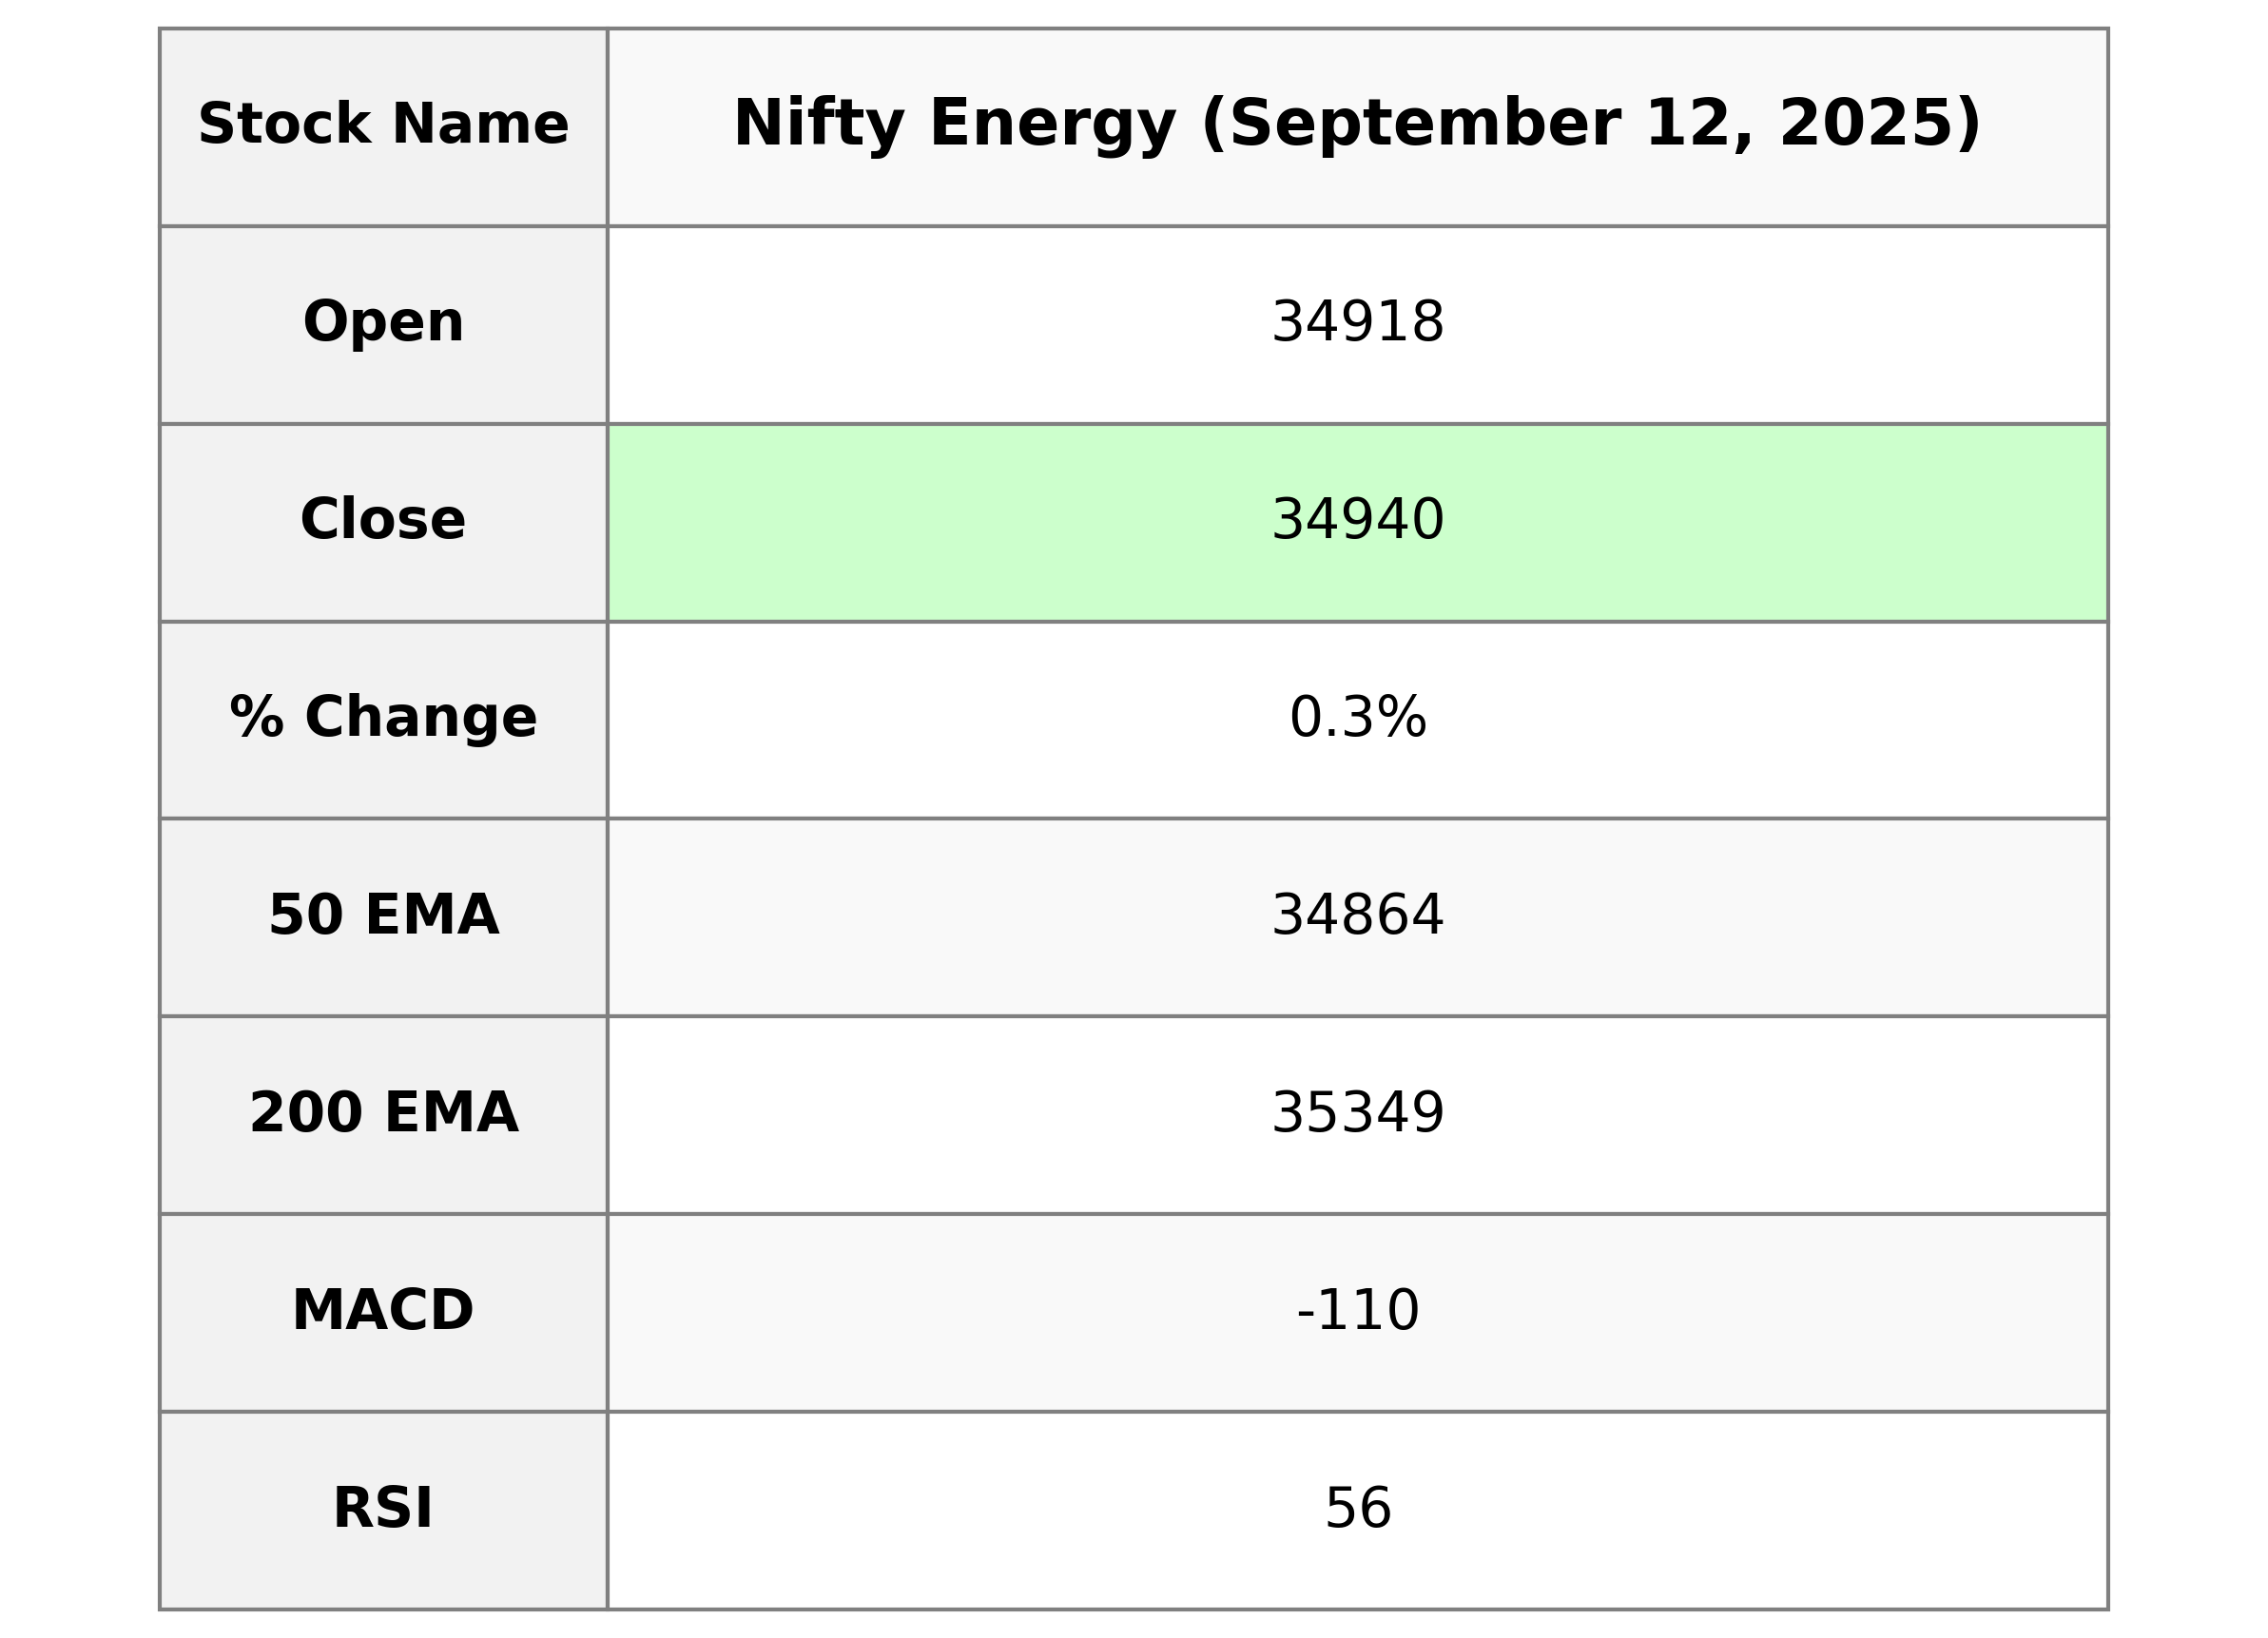
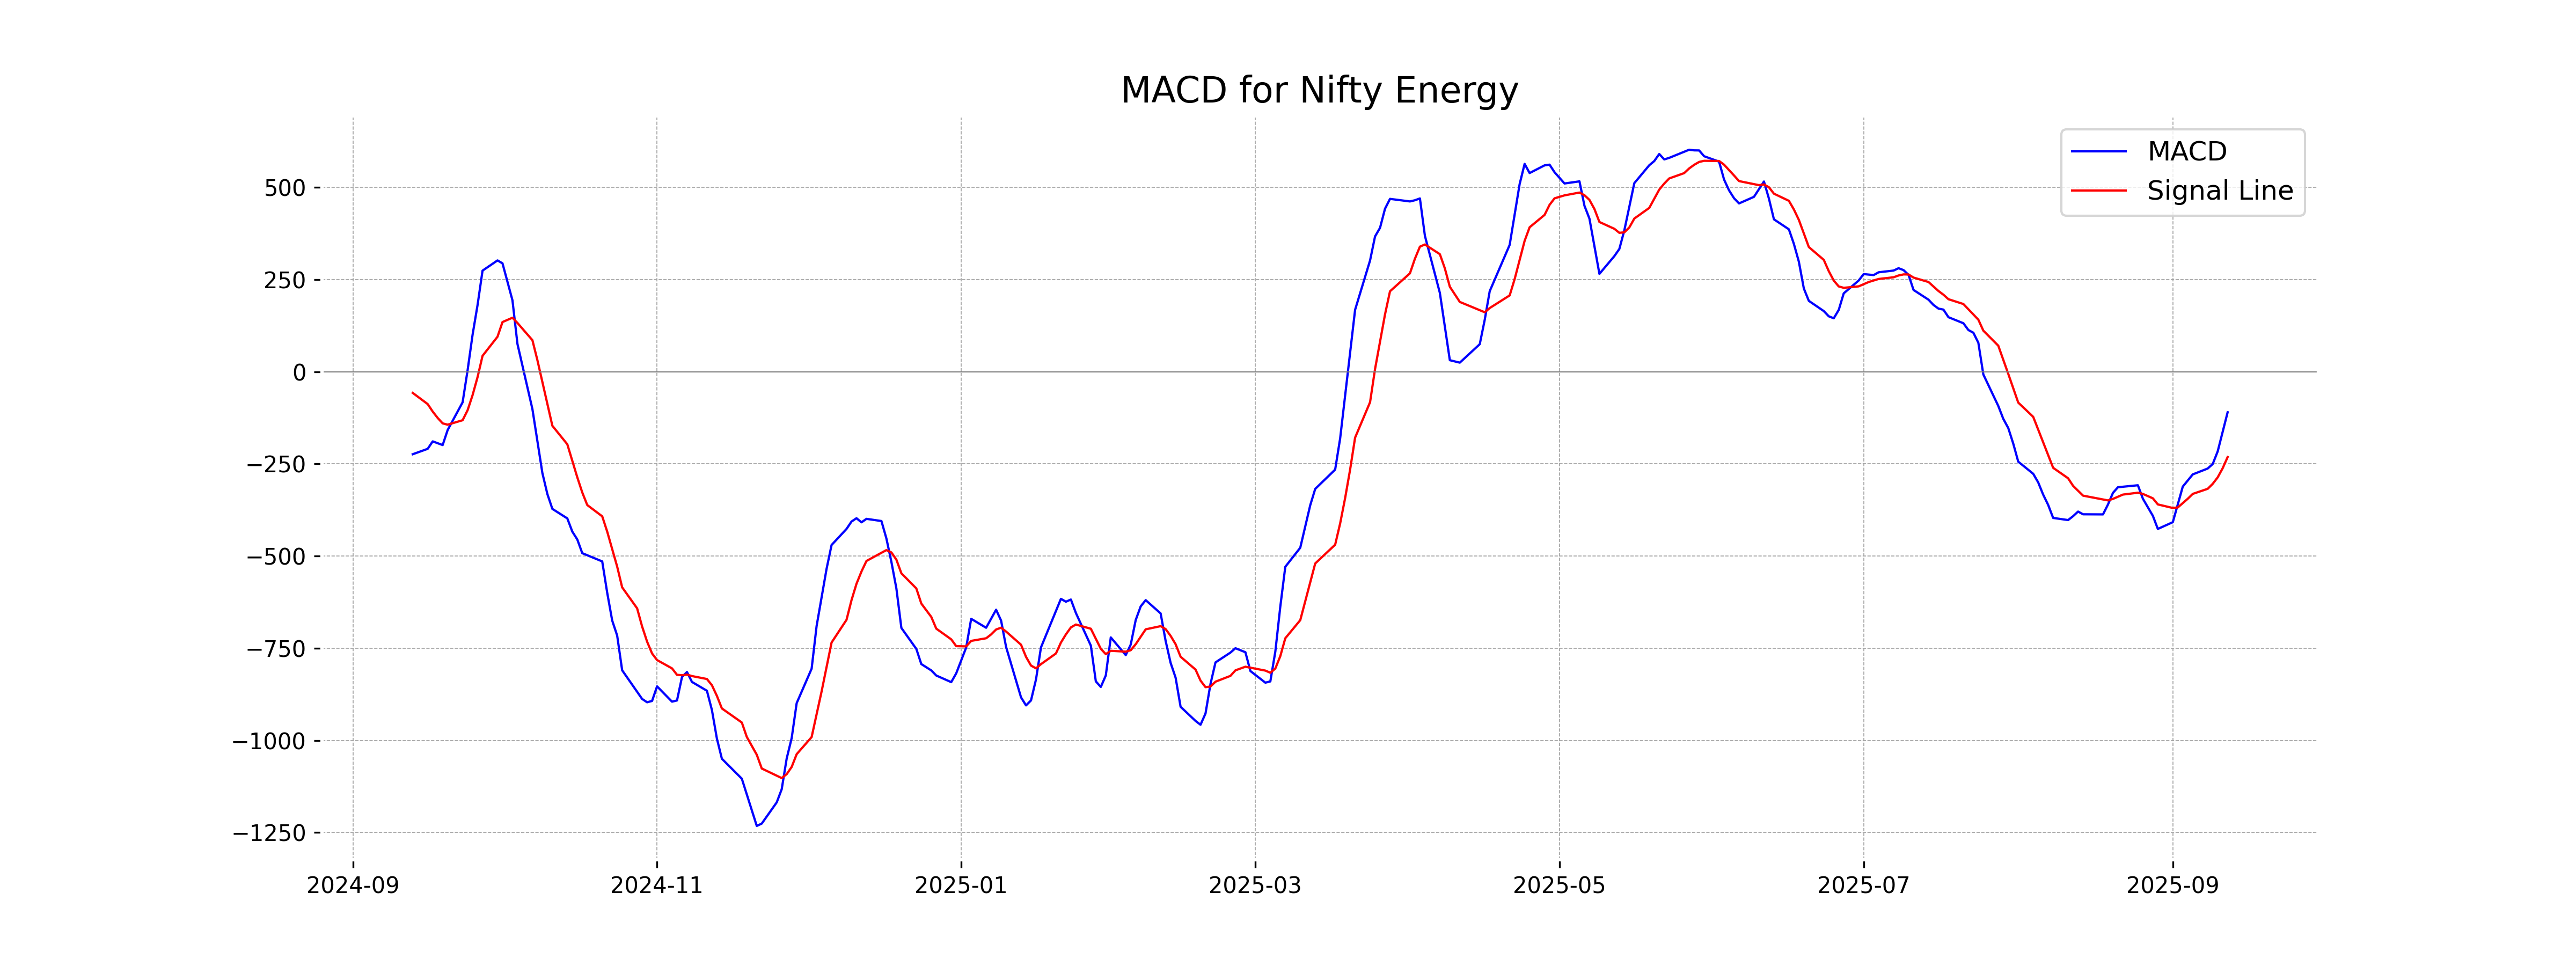
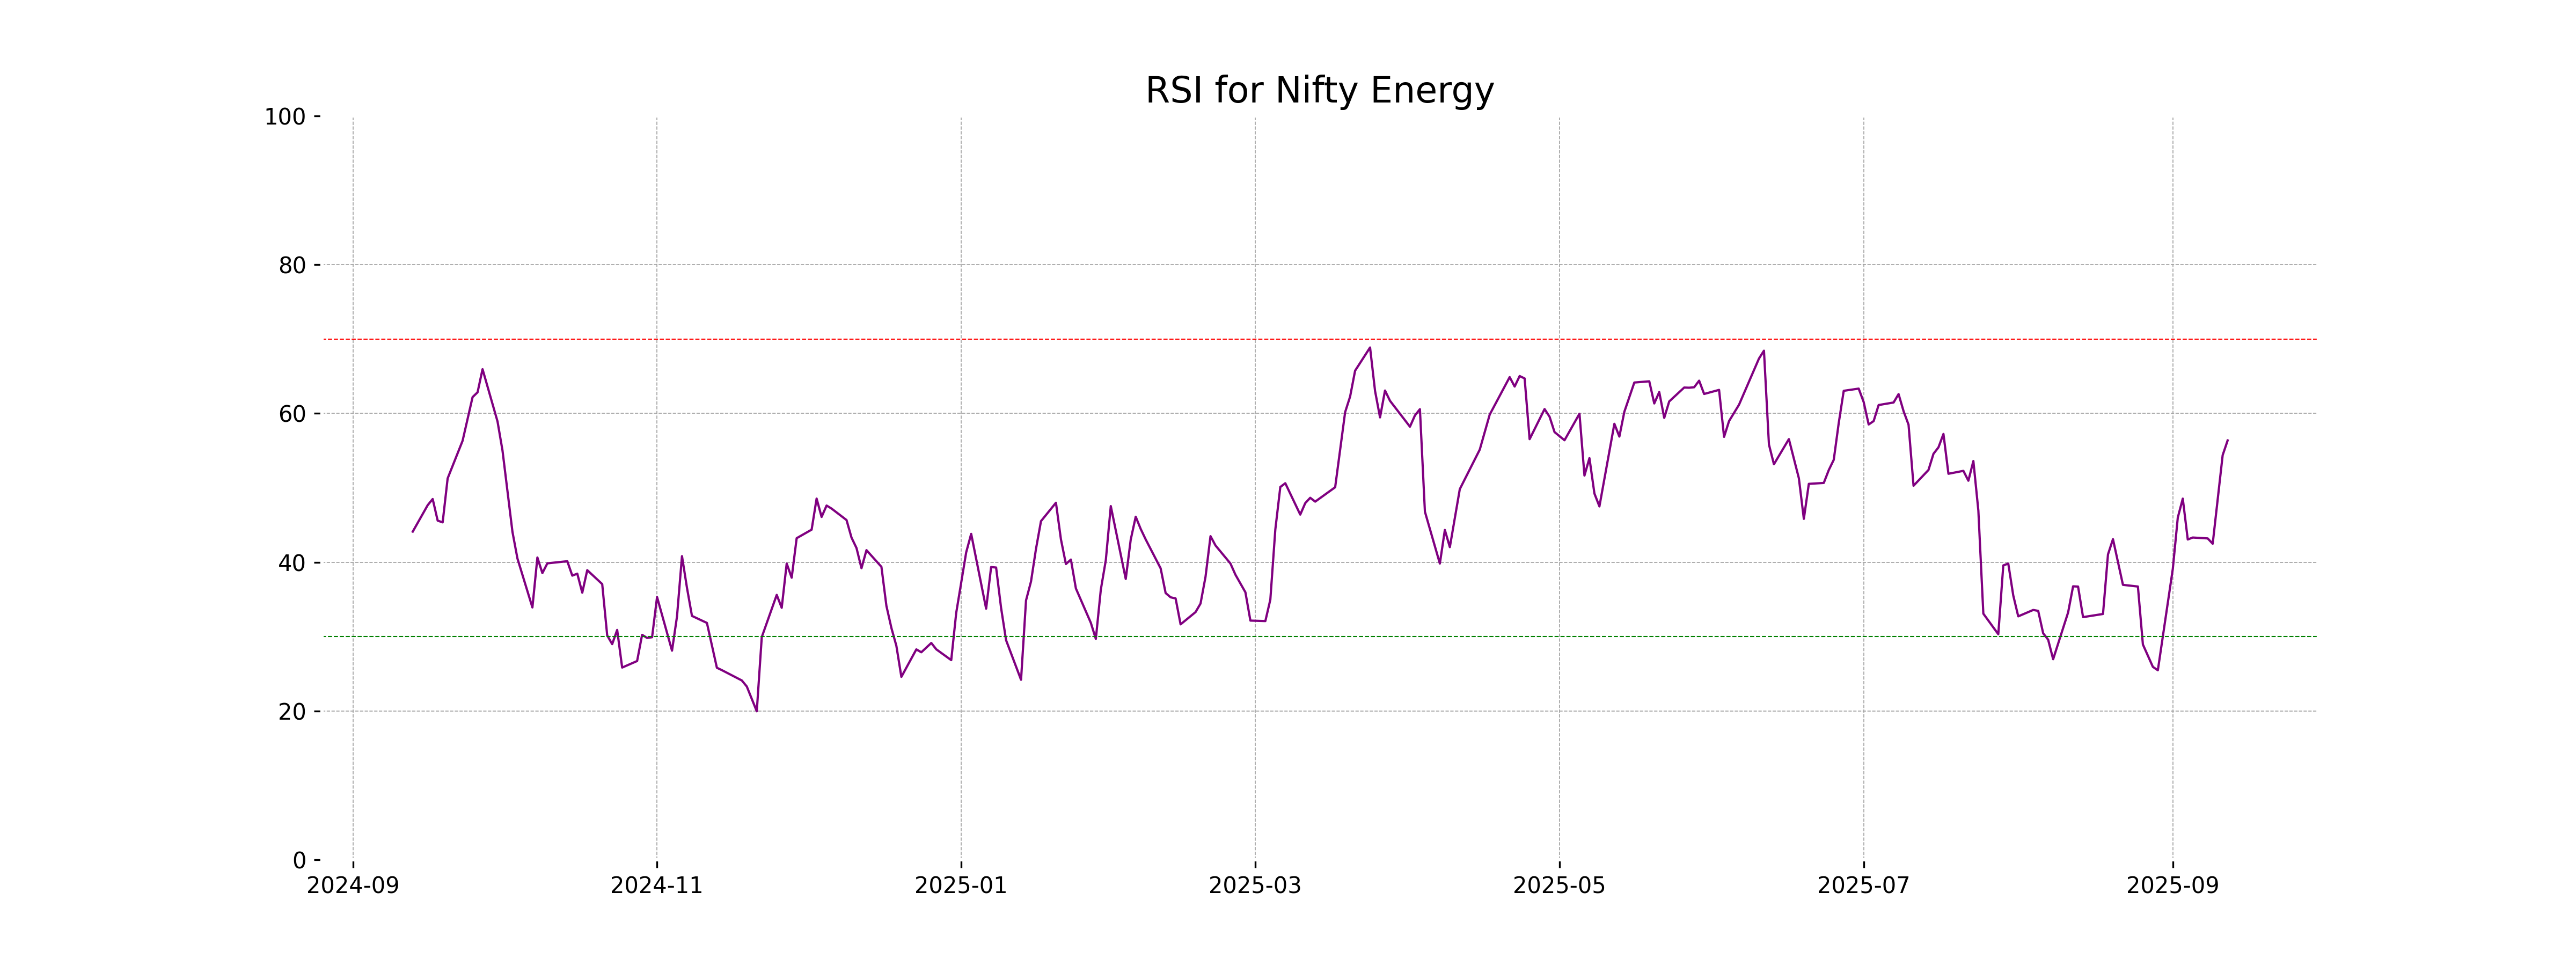
Nifty Energy Performance: Nifty Energy opened at 34,918.20, reached a high of 35,021.85, and closed at 34,940.30, showing a positive percentage change of 0.33% from the previous close. The RSI of 56.37 indicates a moderate momentum, while the MACD value of -109.81 suggests a bearish trend but with a signal indicating potential movement towards recovery.
Relationship with Key Moving Averages
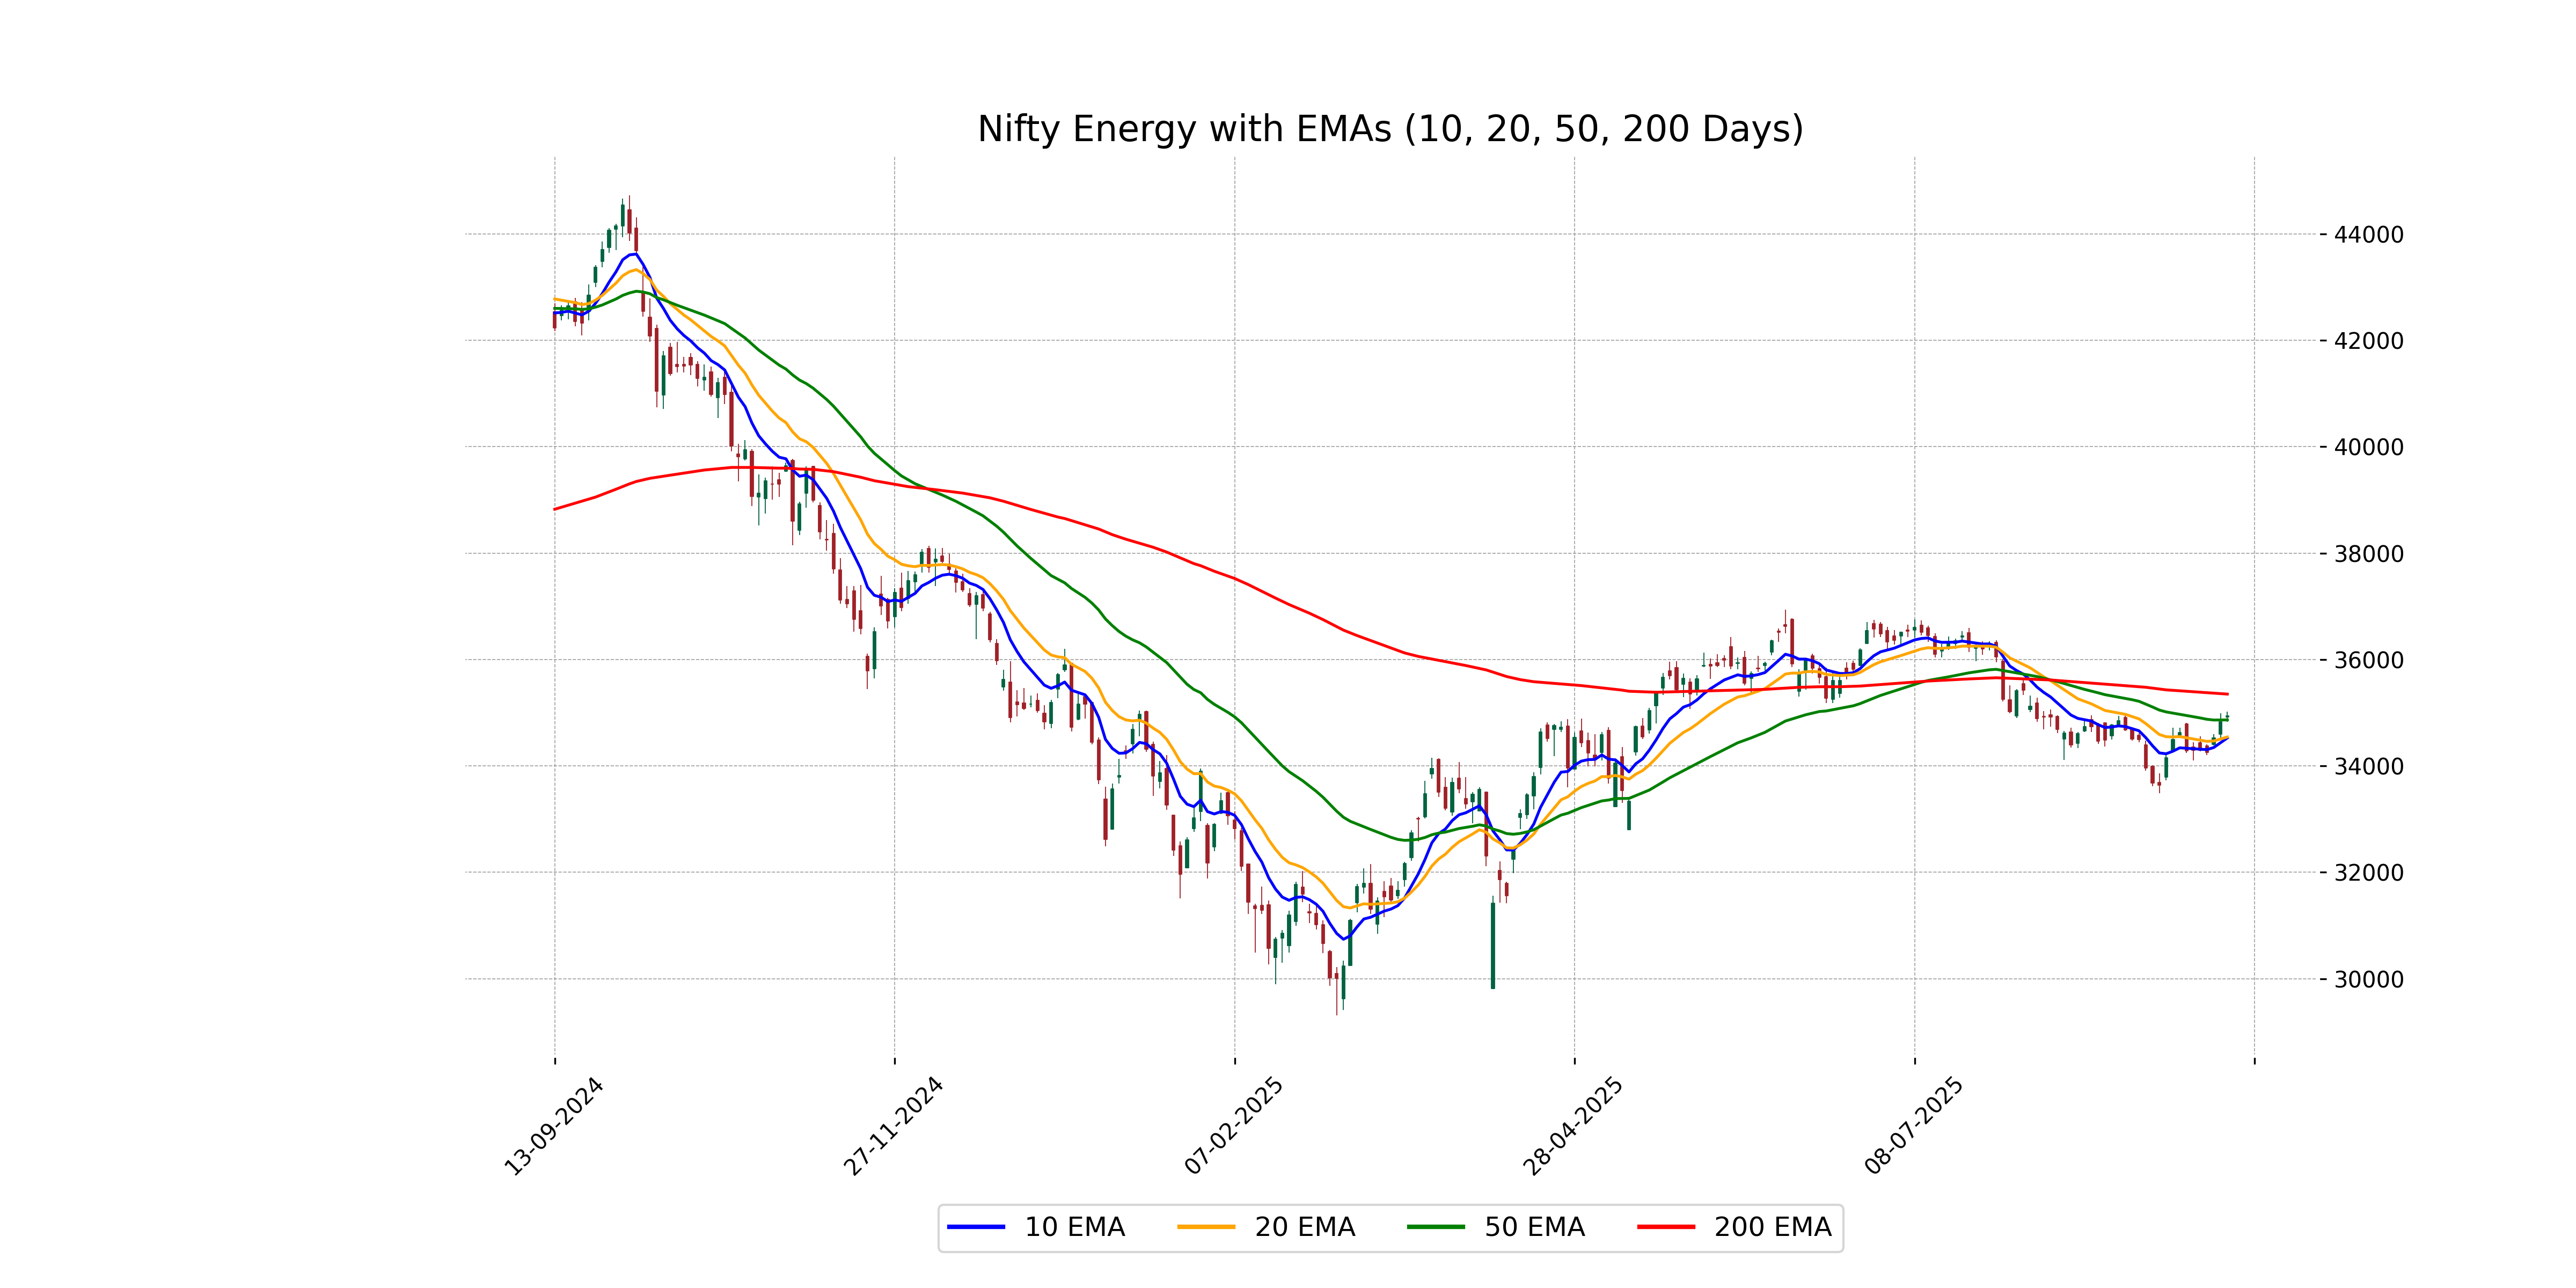
Nifty Energy closed at 34,940.30, which is above its 50 EMA of 34,863.61, indicating a short-term bullish trend. However, it remains below the 200 EMA of 35,349.24, suggesting a long-term bearish outlook. The 10 EMA and 20 EMA are both below the closing price, supporting the recent upward momentum.
Moving Averages Trend (MACD)
The MACD for Nifty Energy is -109.81, which is above the MACD Signal of -231.35, suggesting a potential bullish momentum build-up. Although still negative, the upward crossover indicates that bearishness might be decreasing.
RSI Analysis
The RSI value for Nifty Energy is 56.37, indicating a neutral momentum as it is between the typical overbought (70) and oversold (30) thresholds. This suggests that the index is neither in an overbought nor in an oversold condition, pointing towards a balanced market sentiment.
Analysis for Nifty FMCG - September 12, 2025
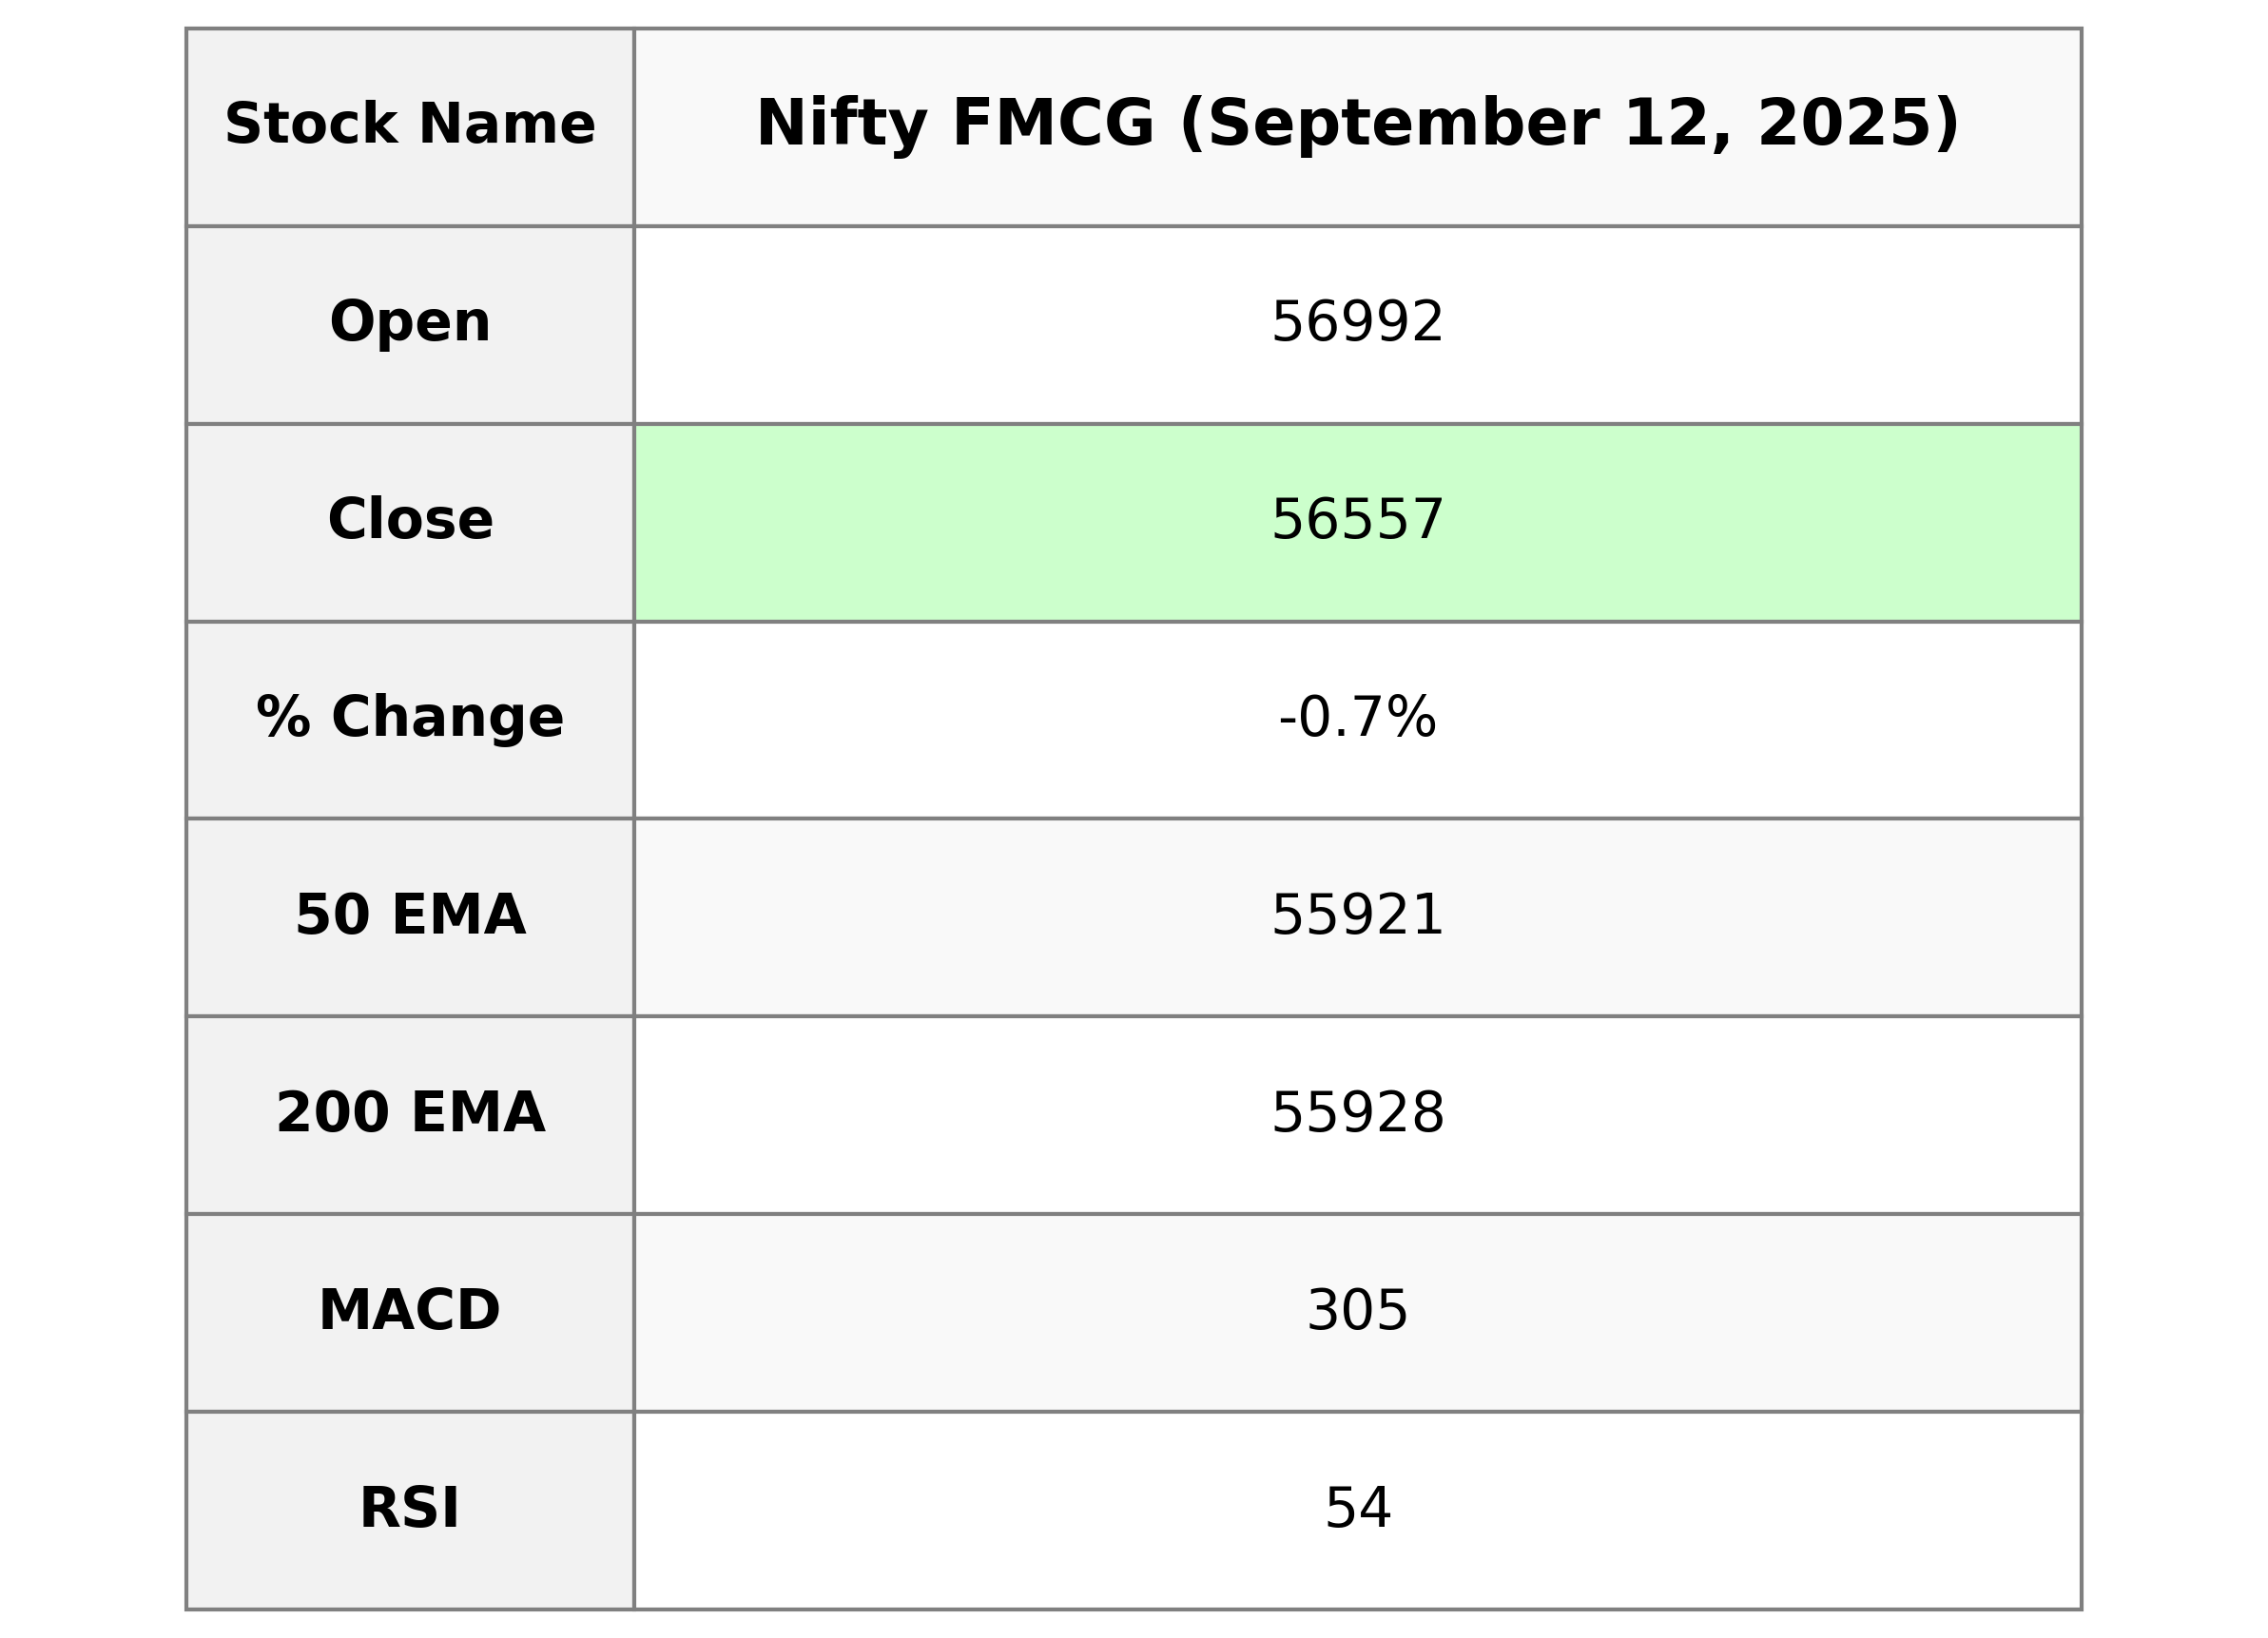
Nifty FMCG opened at 56991.8 and closed at 56557.15, marking a decline with a percentage change of -0.71%. The index saw a points change of -403.45 and traded between a high of 57065.5 and a low of 56430.5. The RSI stands at 54.21, suggesting the index is relatively neutral, while the MACD of 305.44 indicates a positive trend above the signal line.
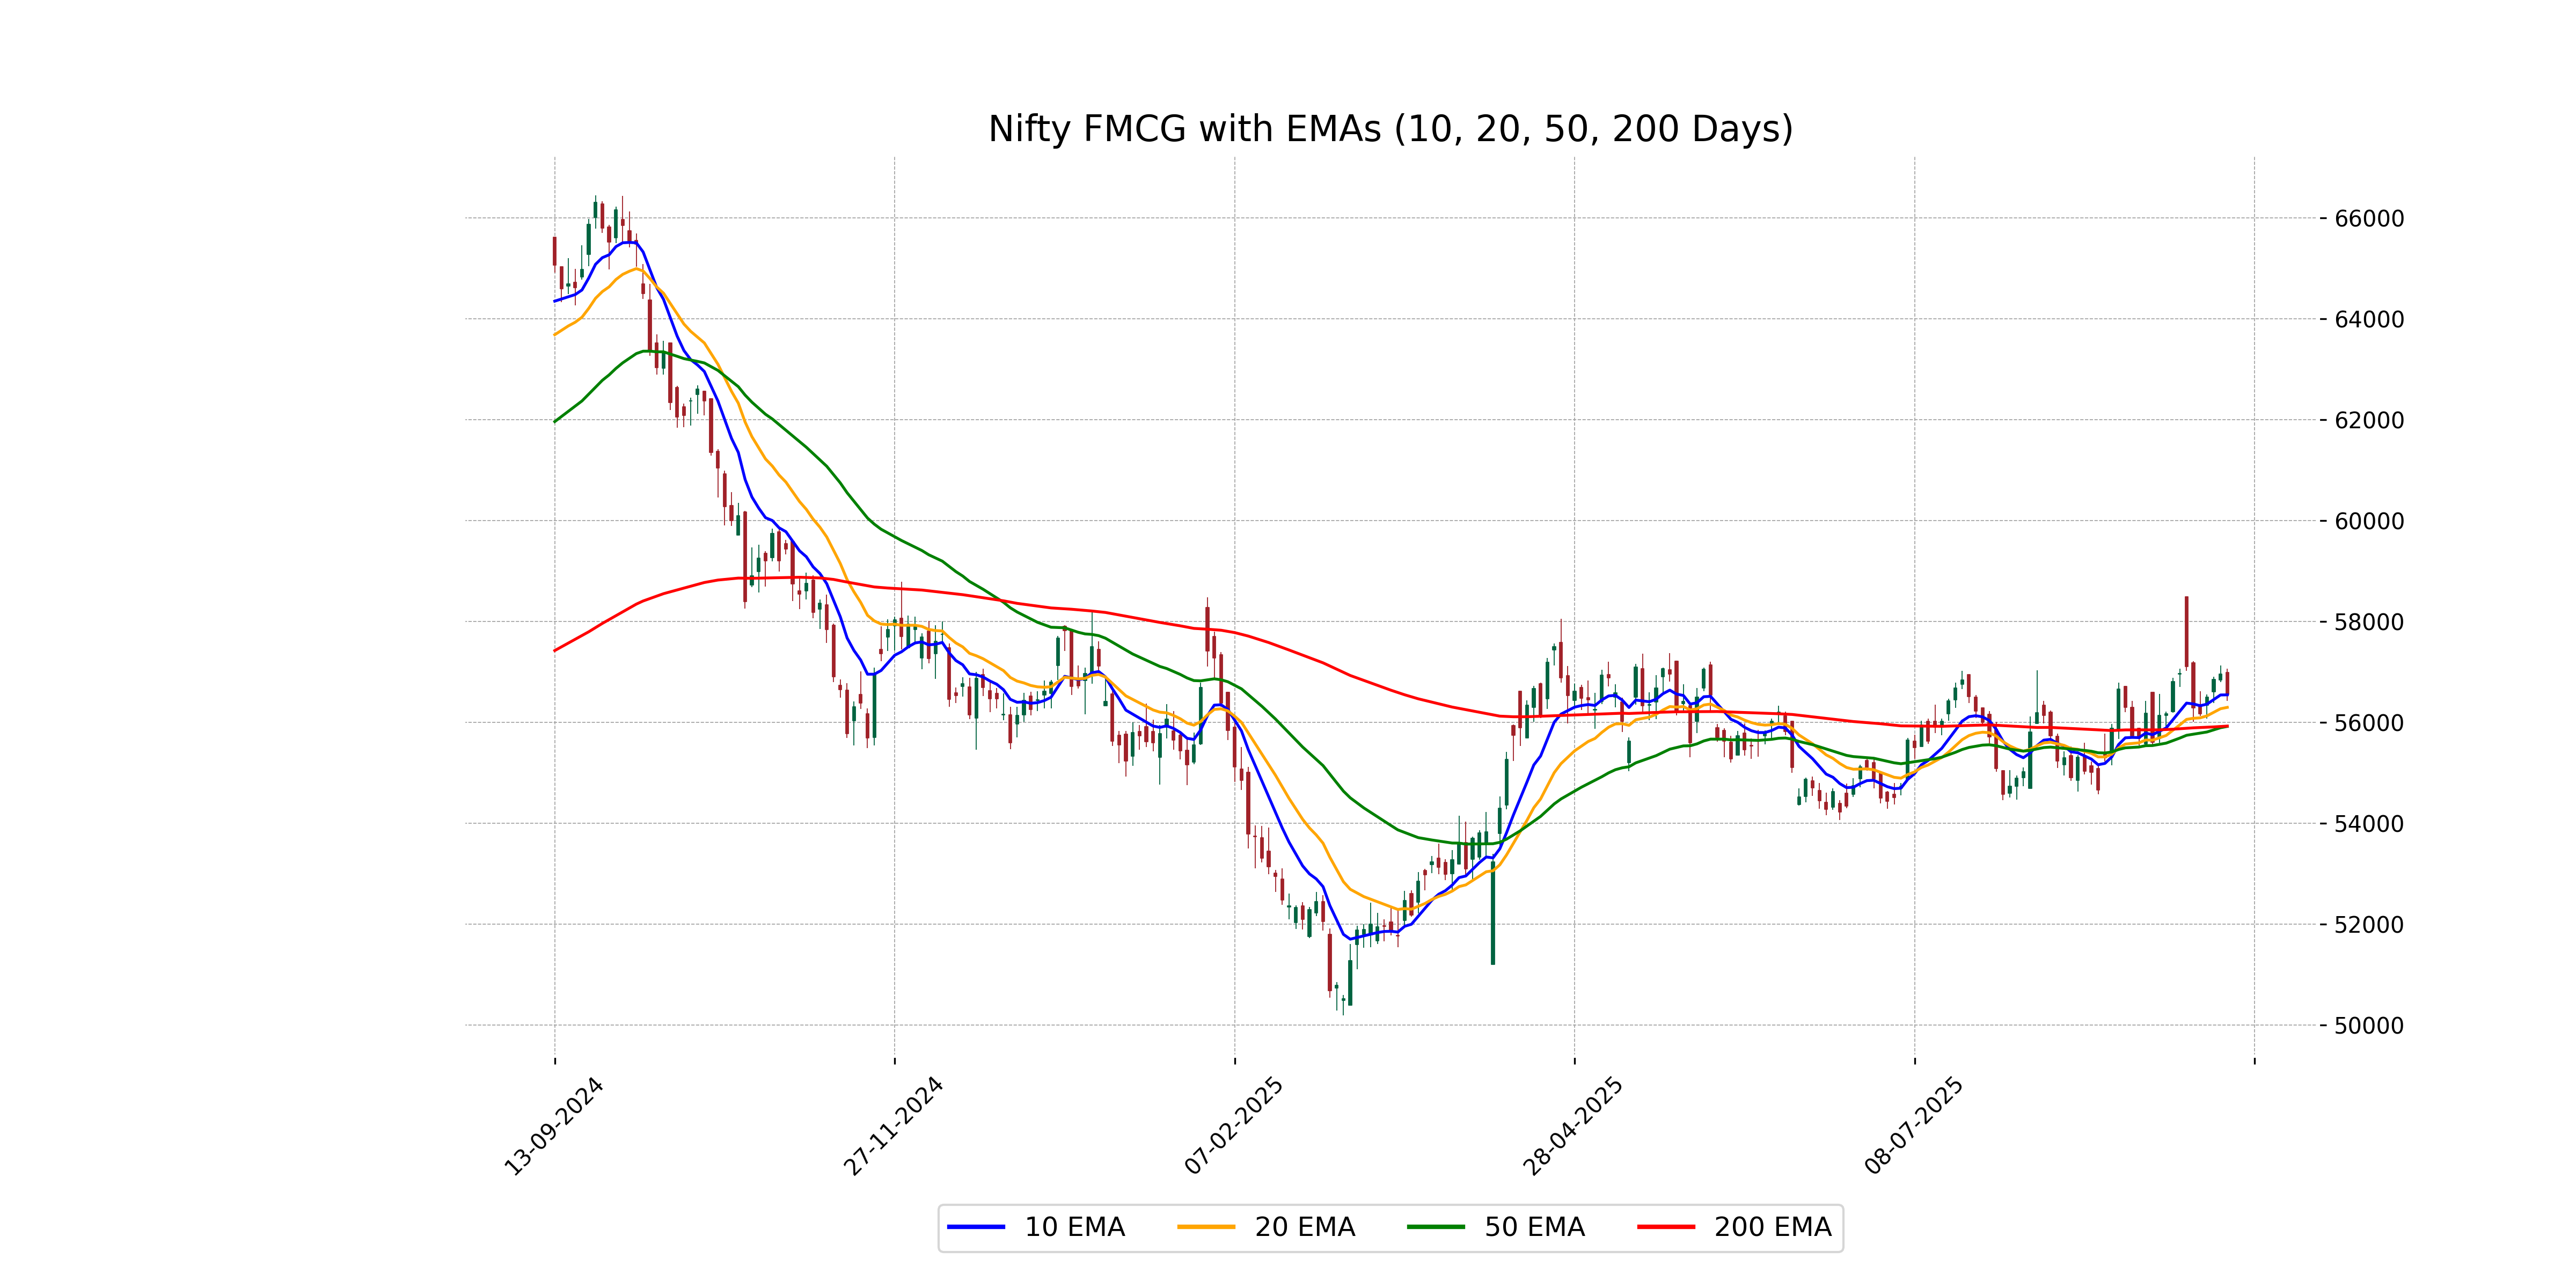
Relationship with Key Moving Averages
Nifty FMCG closed at 56557.15, which is slightly above its 10 EMA of 56546.21 and above its 50 EMA and 200 EMA, both around 55920.52 and 55927.65 respectively. This indicates a slightly bullish short-term trend, yet the closing is below the previous close, showing a potential corrective move.
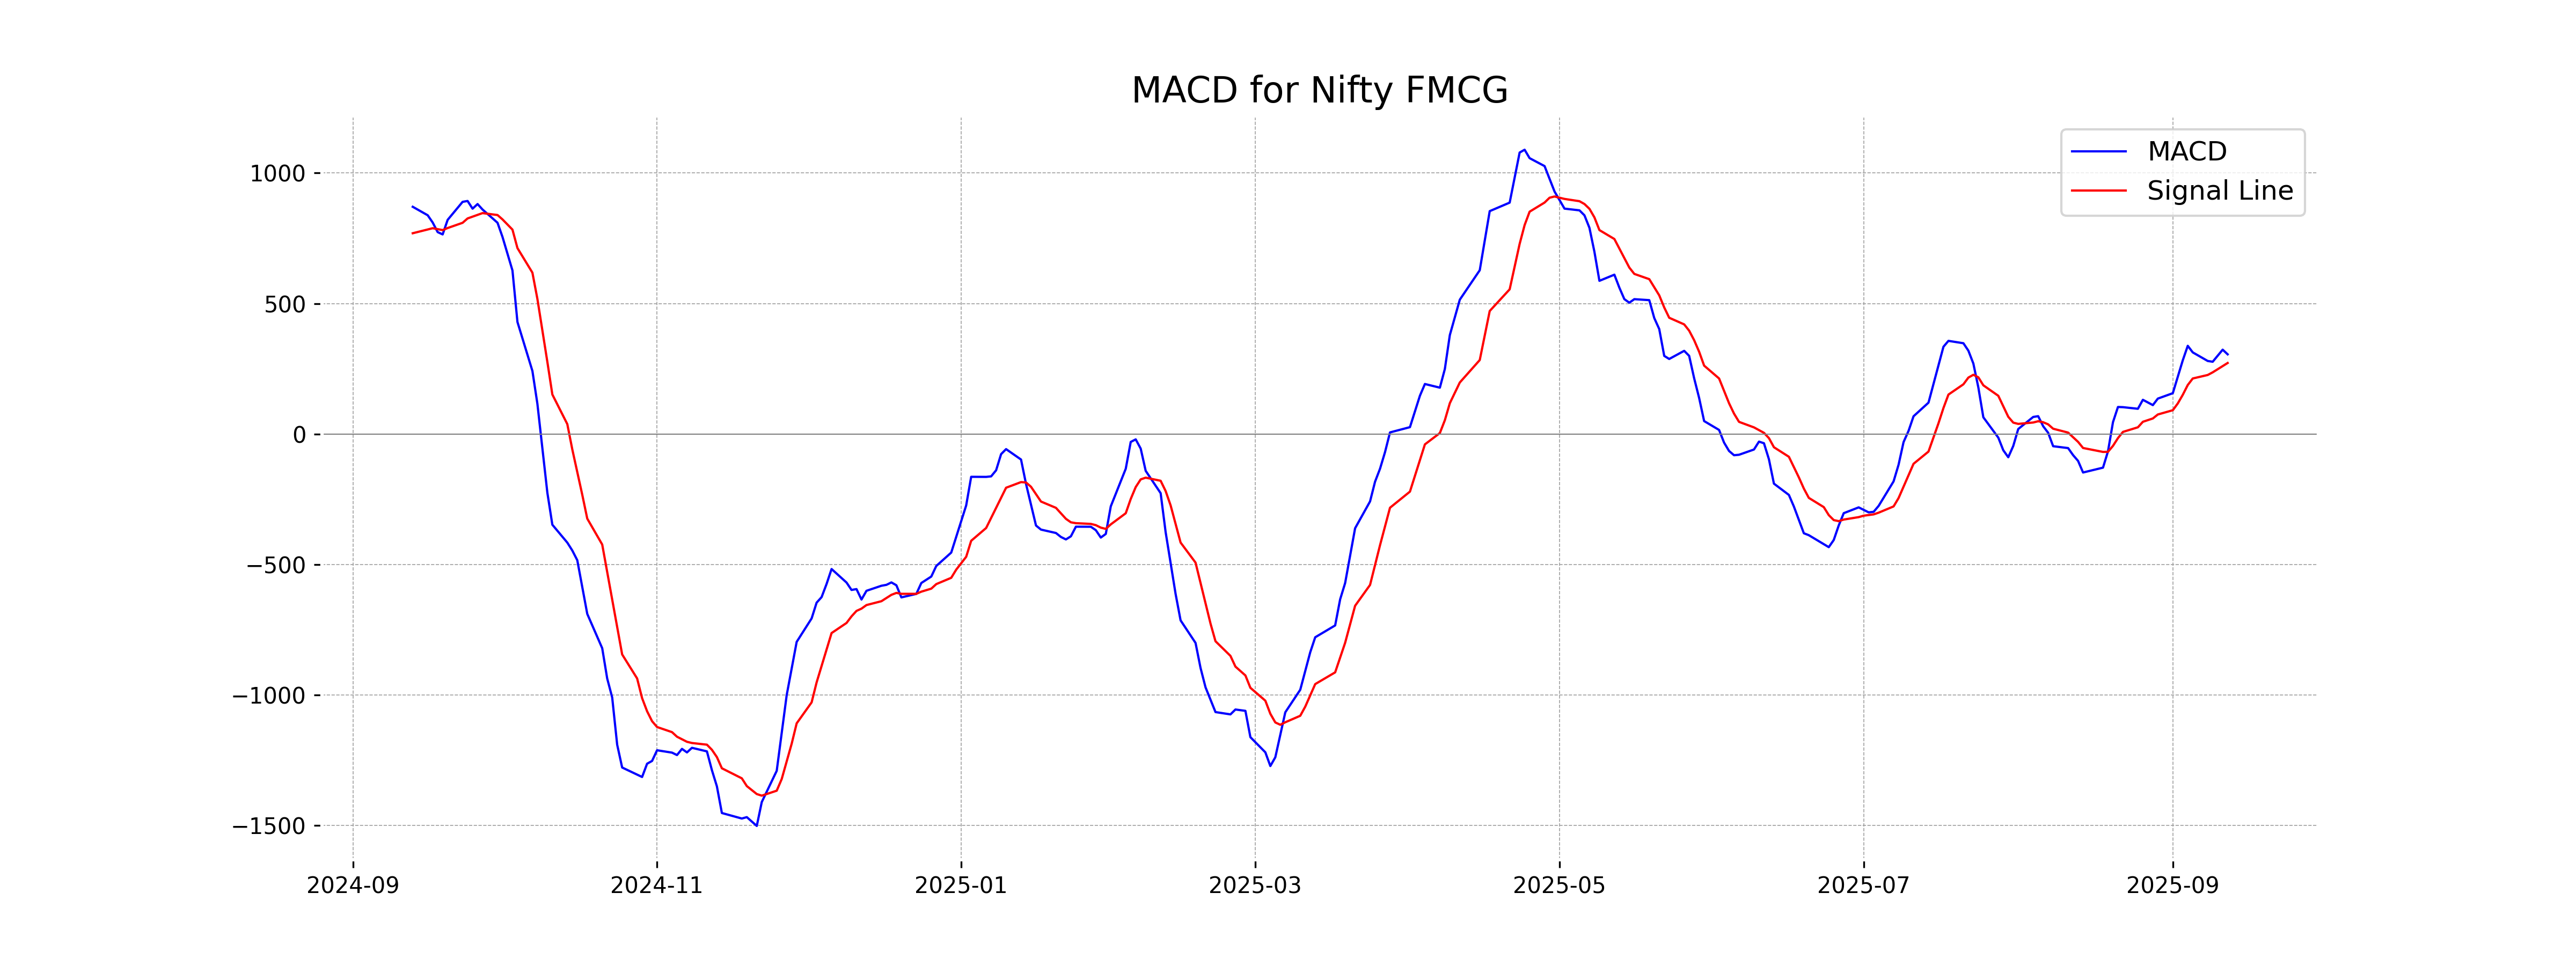
Moving Averages Trend (MACD)
MACD Analysis for Nifty FMCG: The MACD line (305.44) is above the signal line (272.30), which indicates a bullish trend. This suggests that the momentum for Nifty FMCG might continue to be positive, despite the recent price drop.
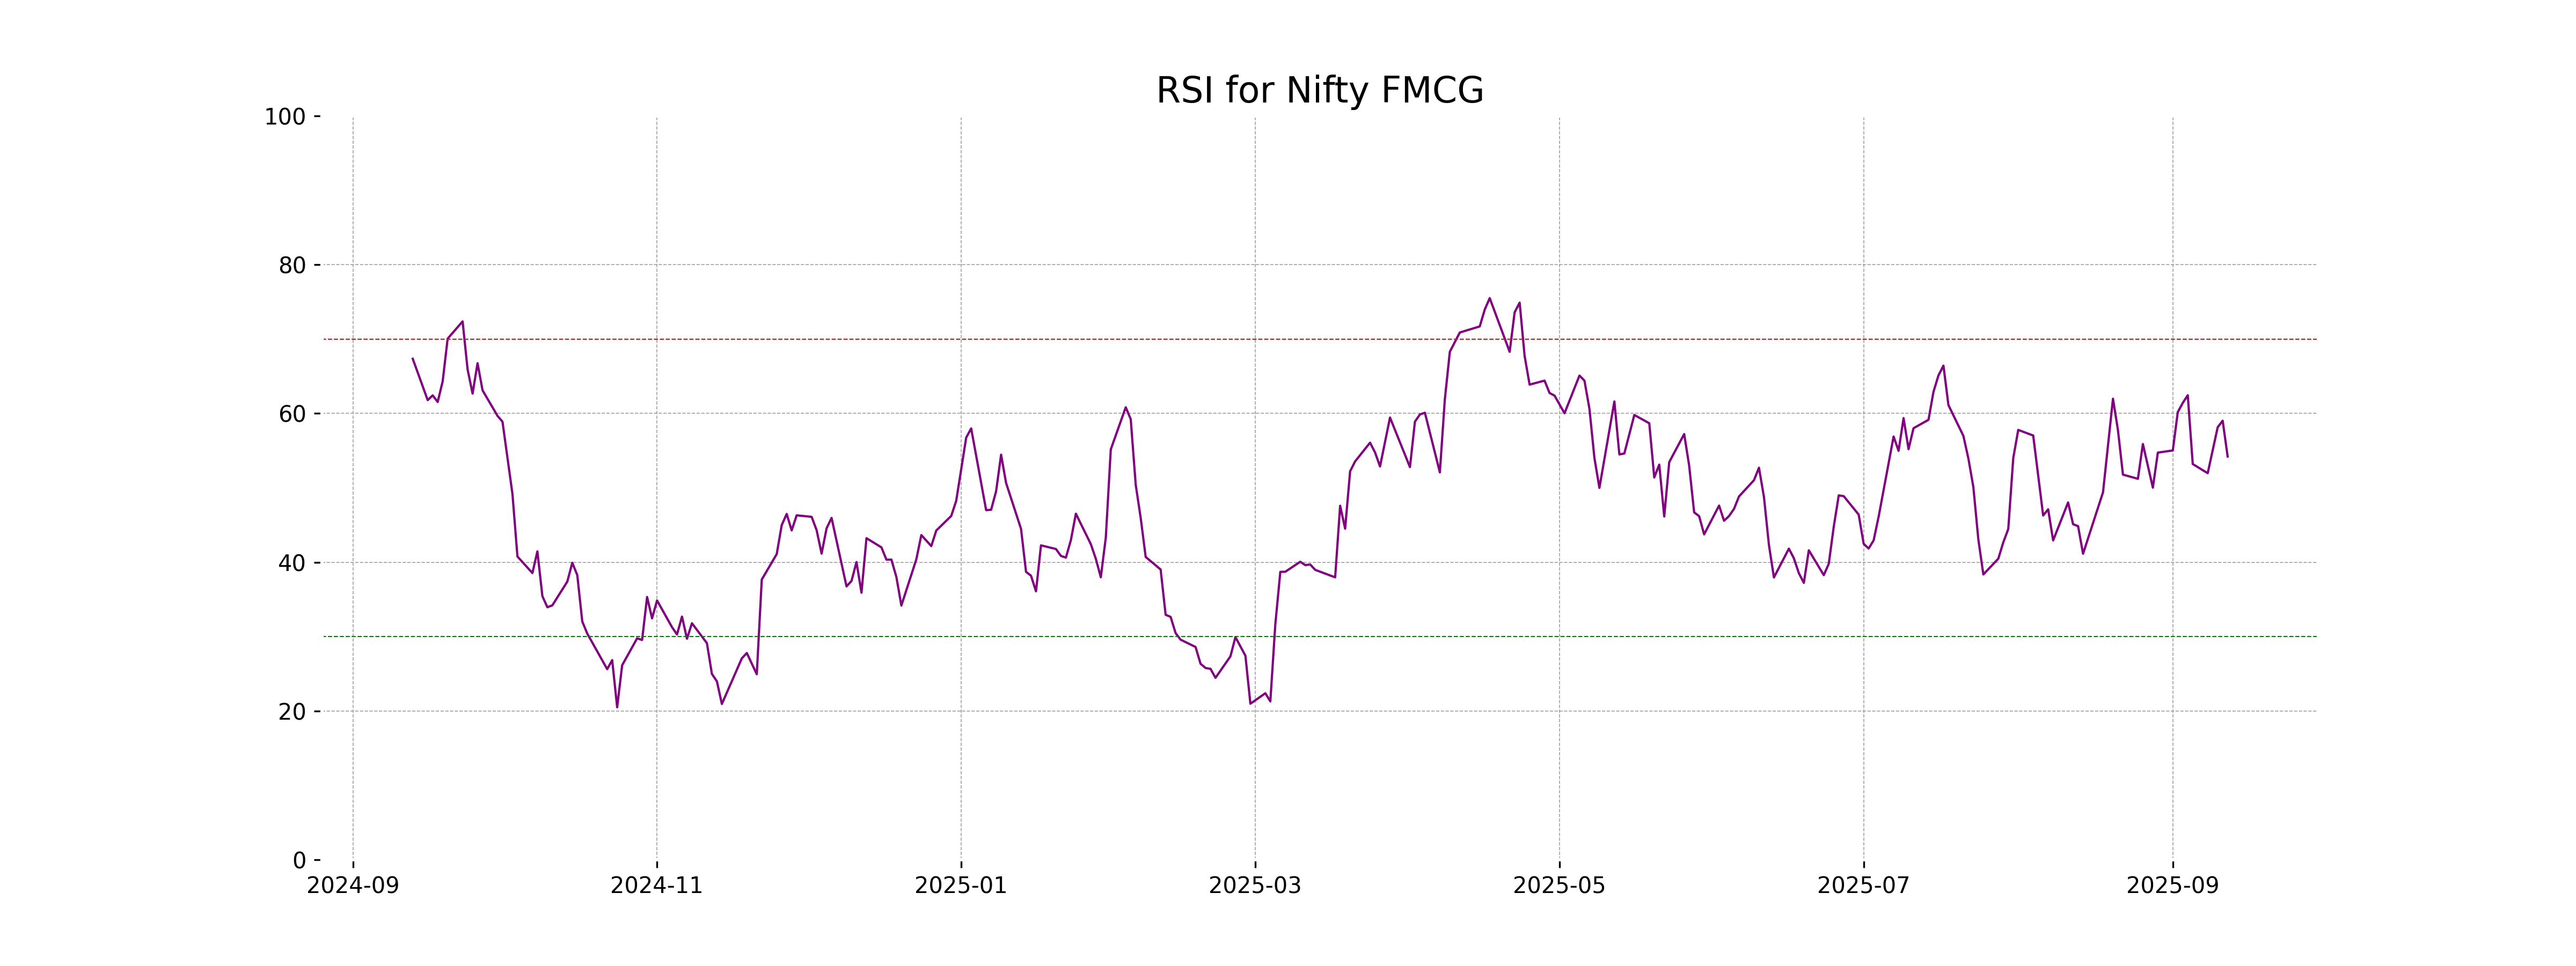
RSI Analysis
The RSI (Relative Strength Index) for Nifty FMCG is 54.21, which suggests that the index is in the neutral range and not indicating any strong overbought or oversold conditions. This balanced RSI level suggests that there might not be significant immediate price action based on momentum, but monitoring for potential upward or downward trends could be beneficial.
Analysis for Nifty Infra - September 12, 2025
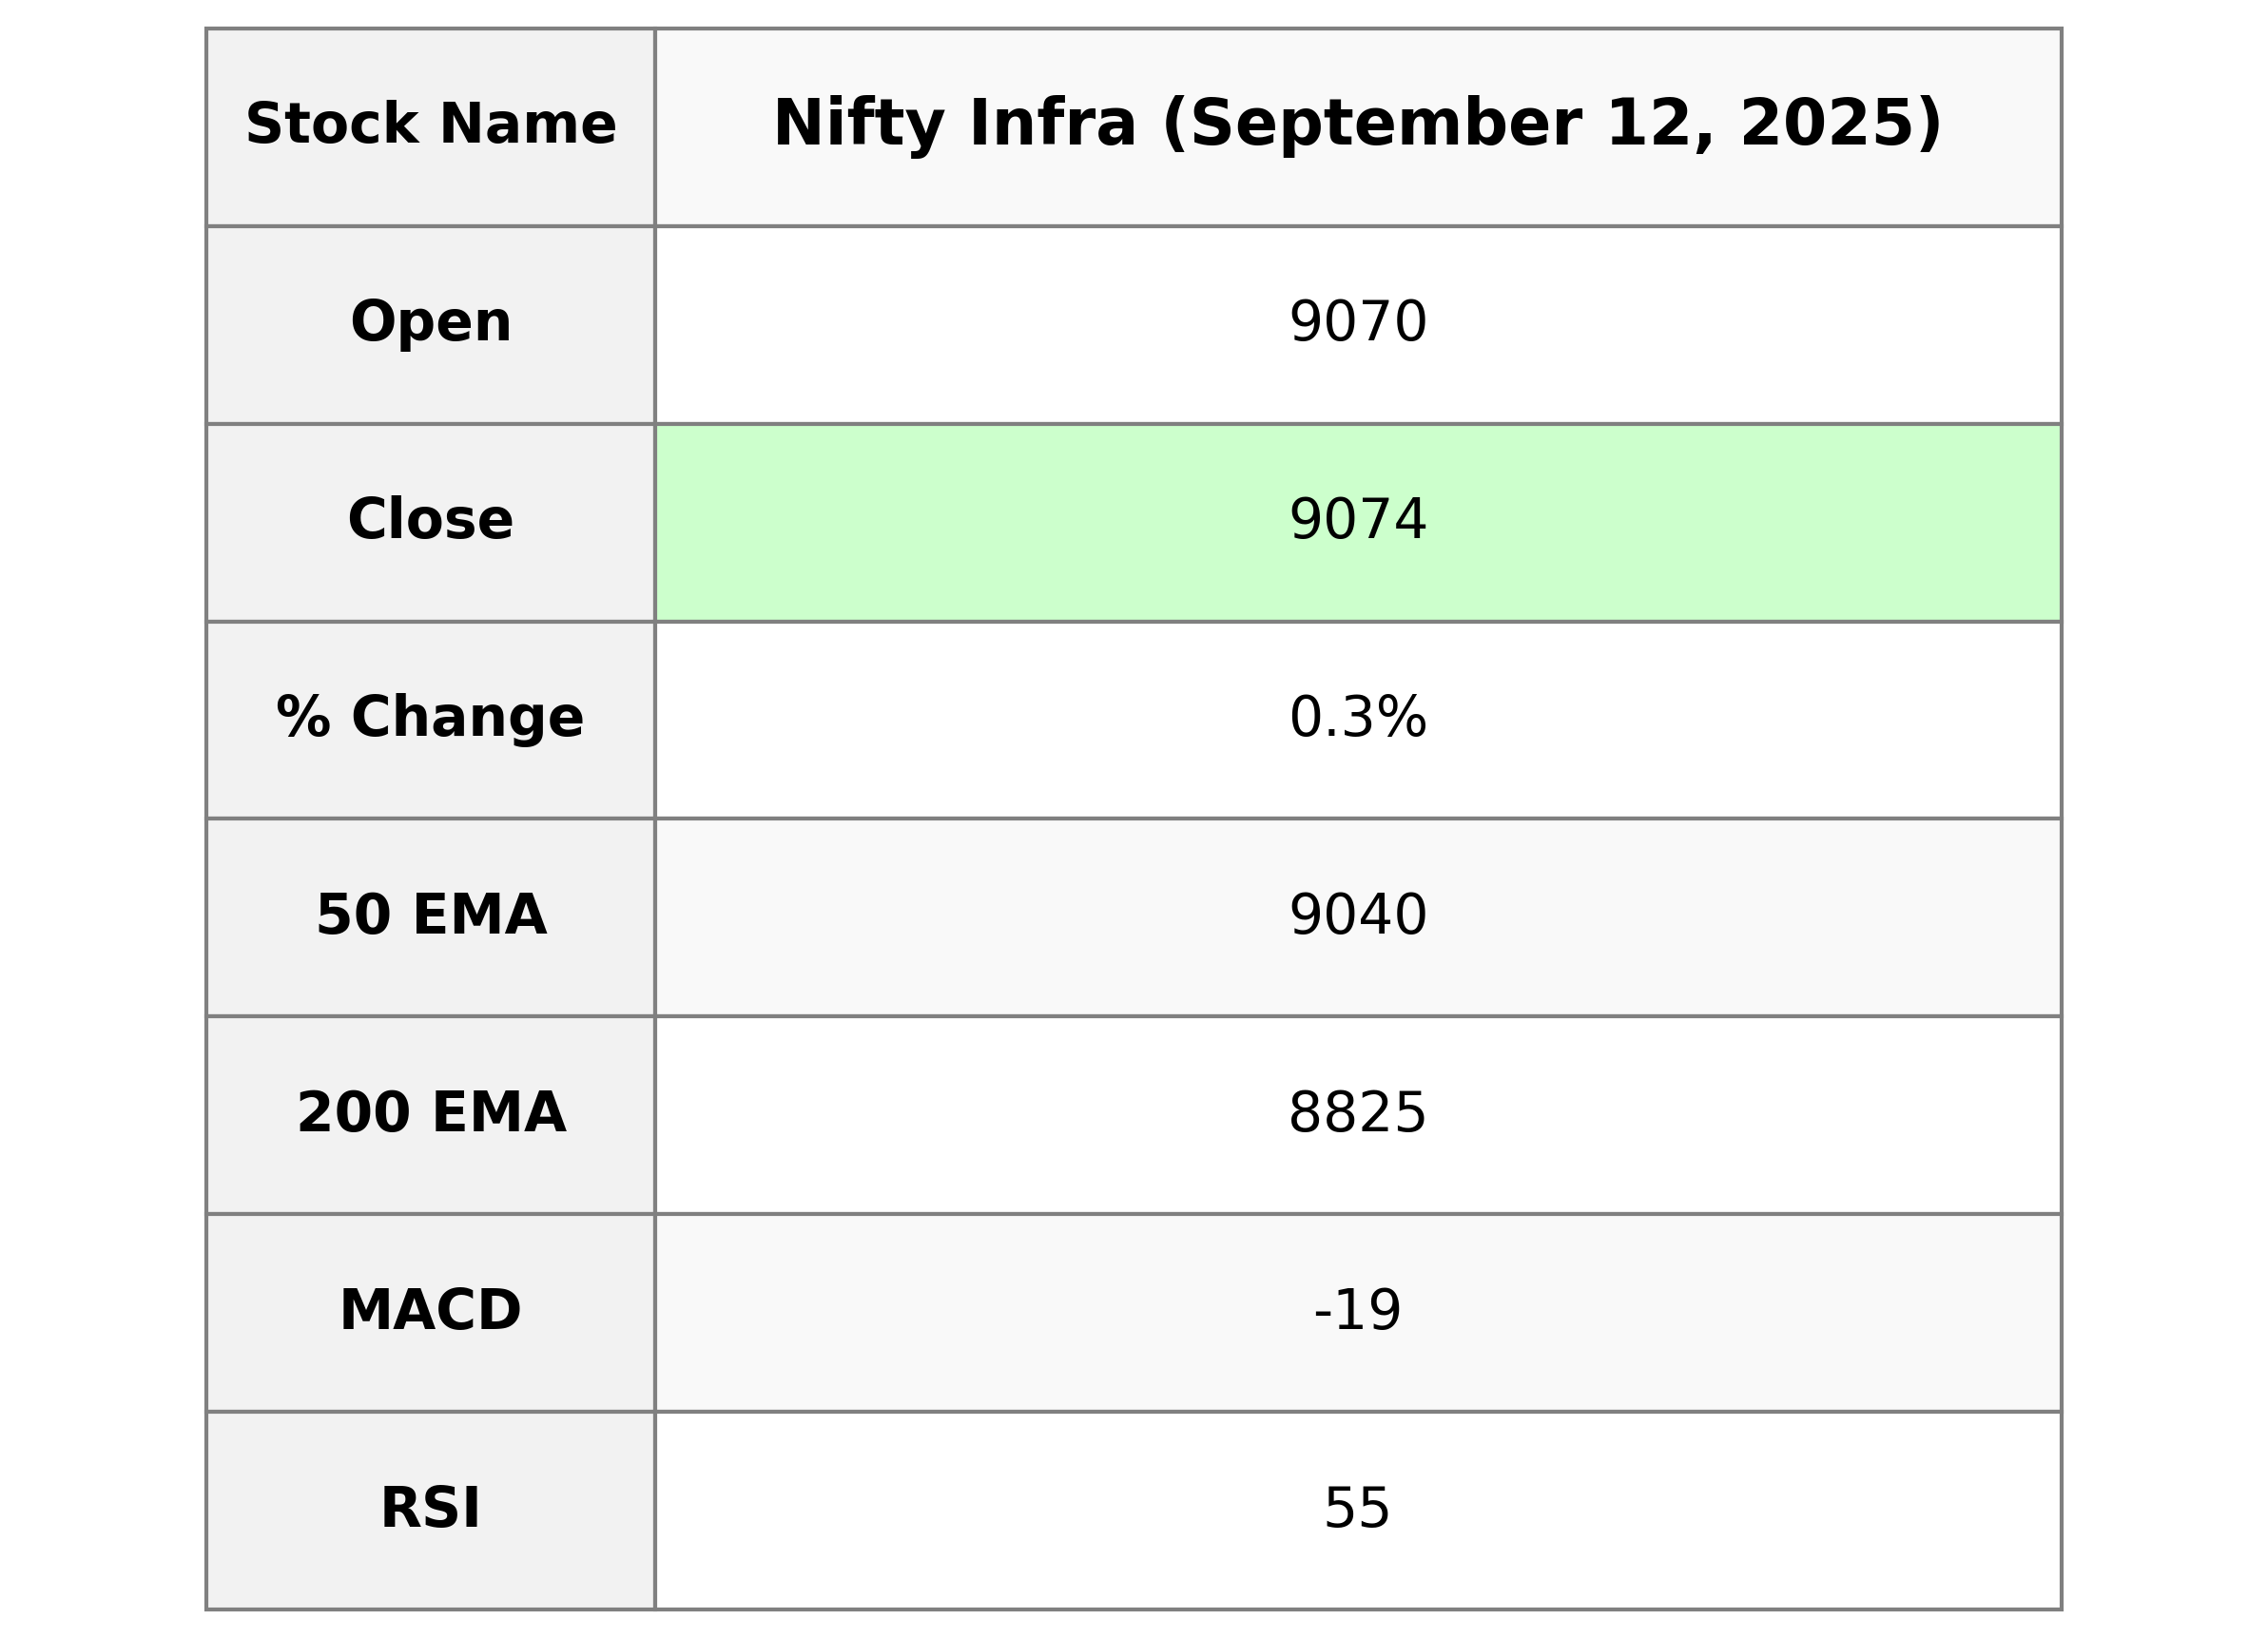
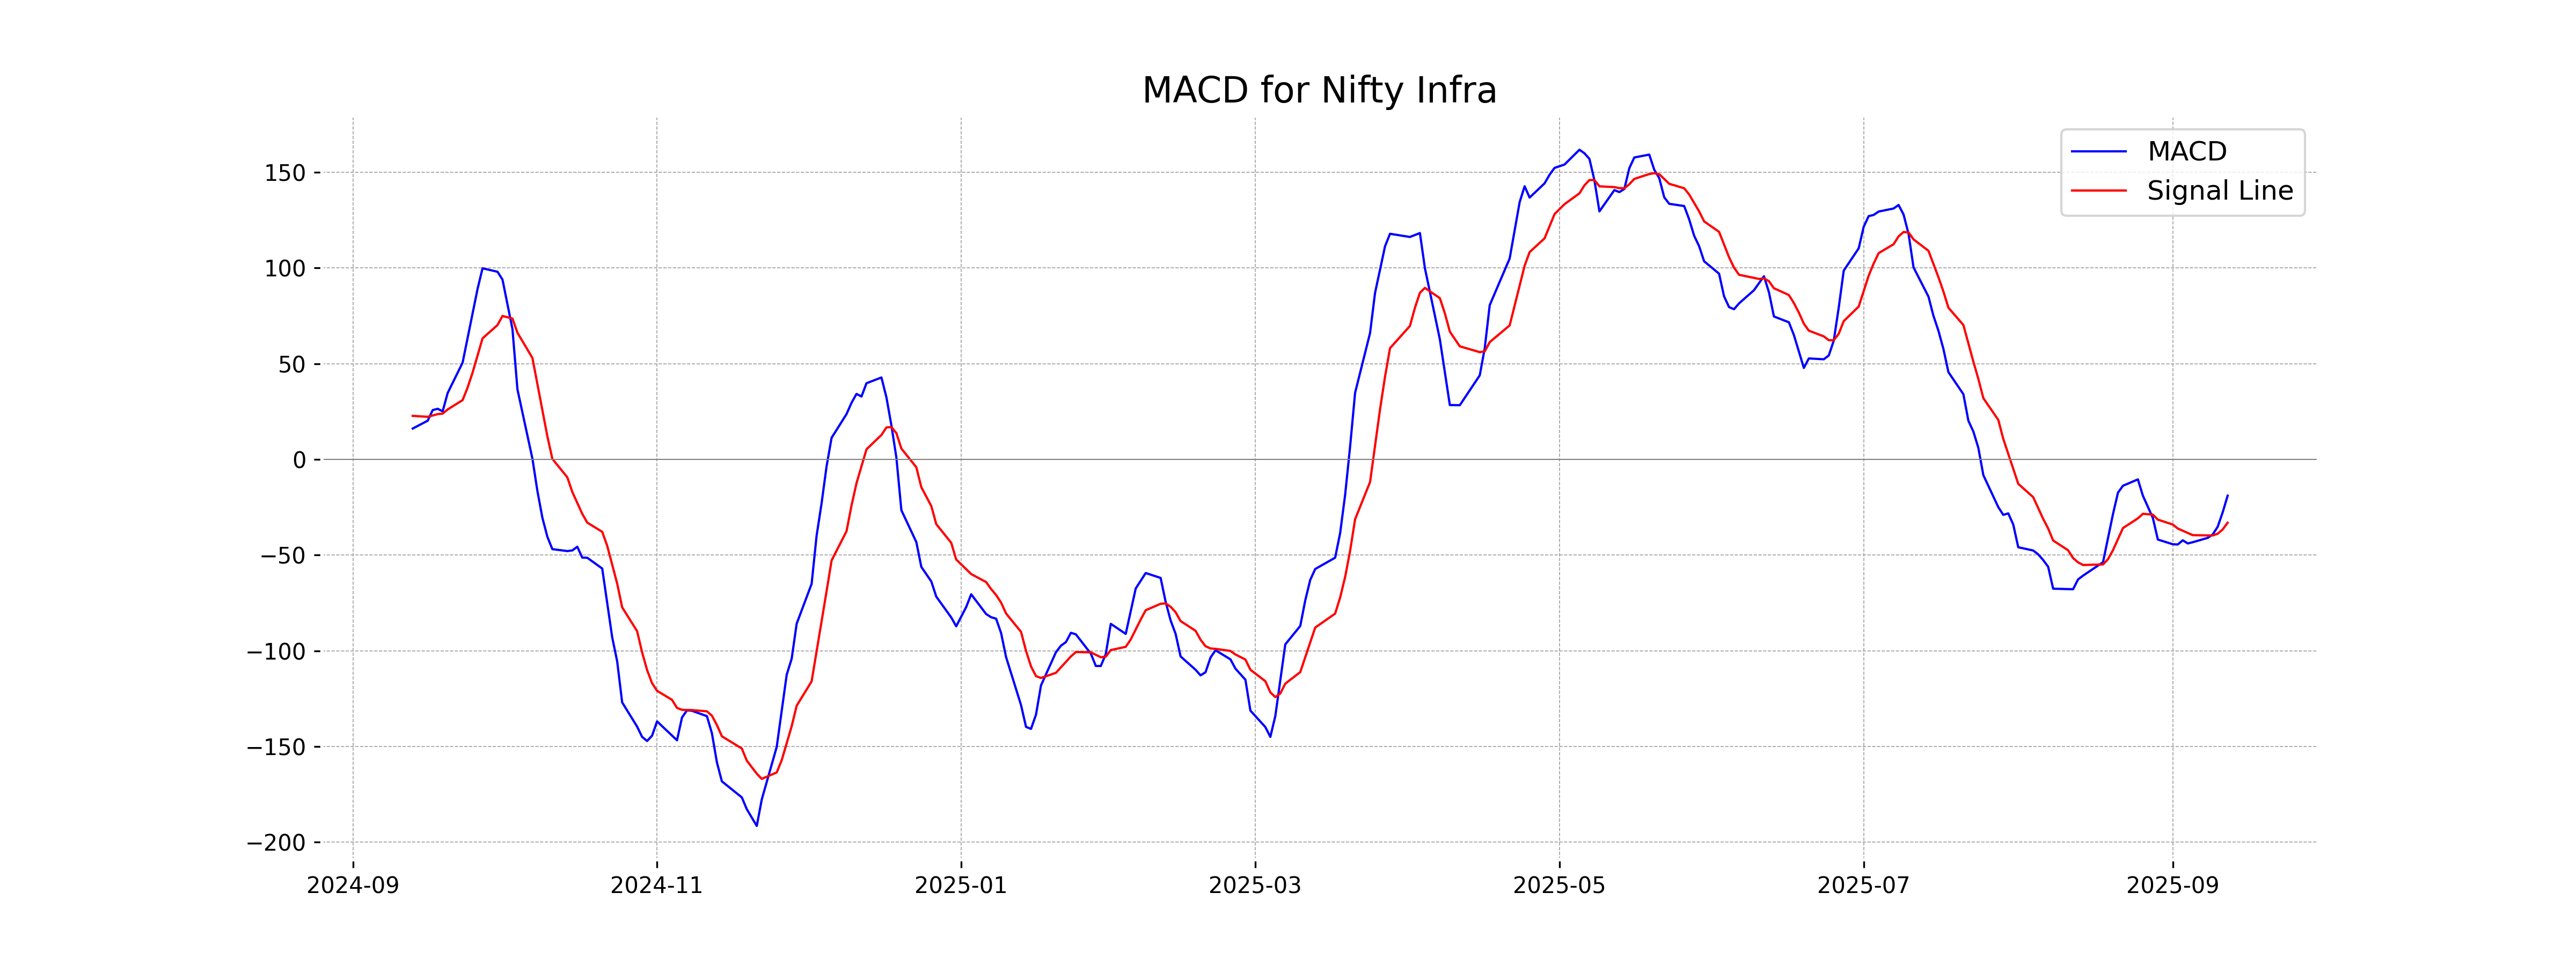
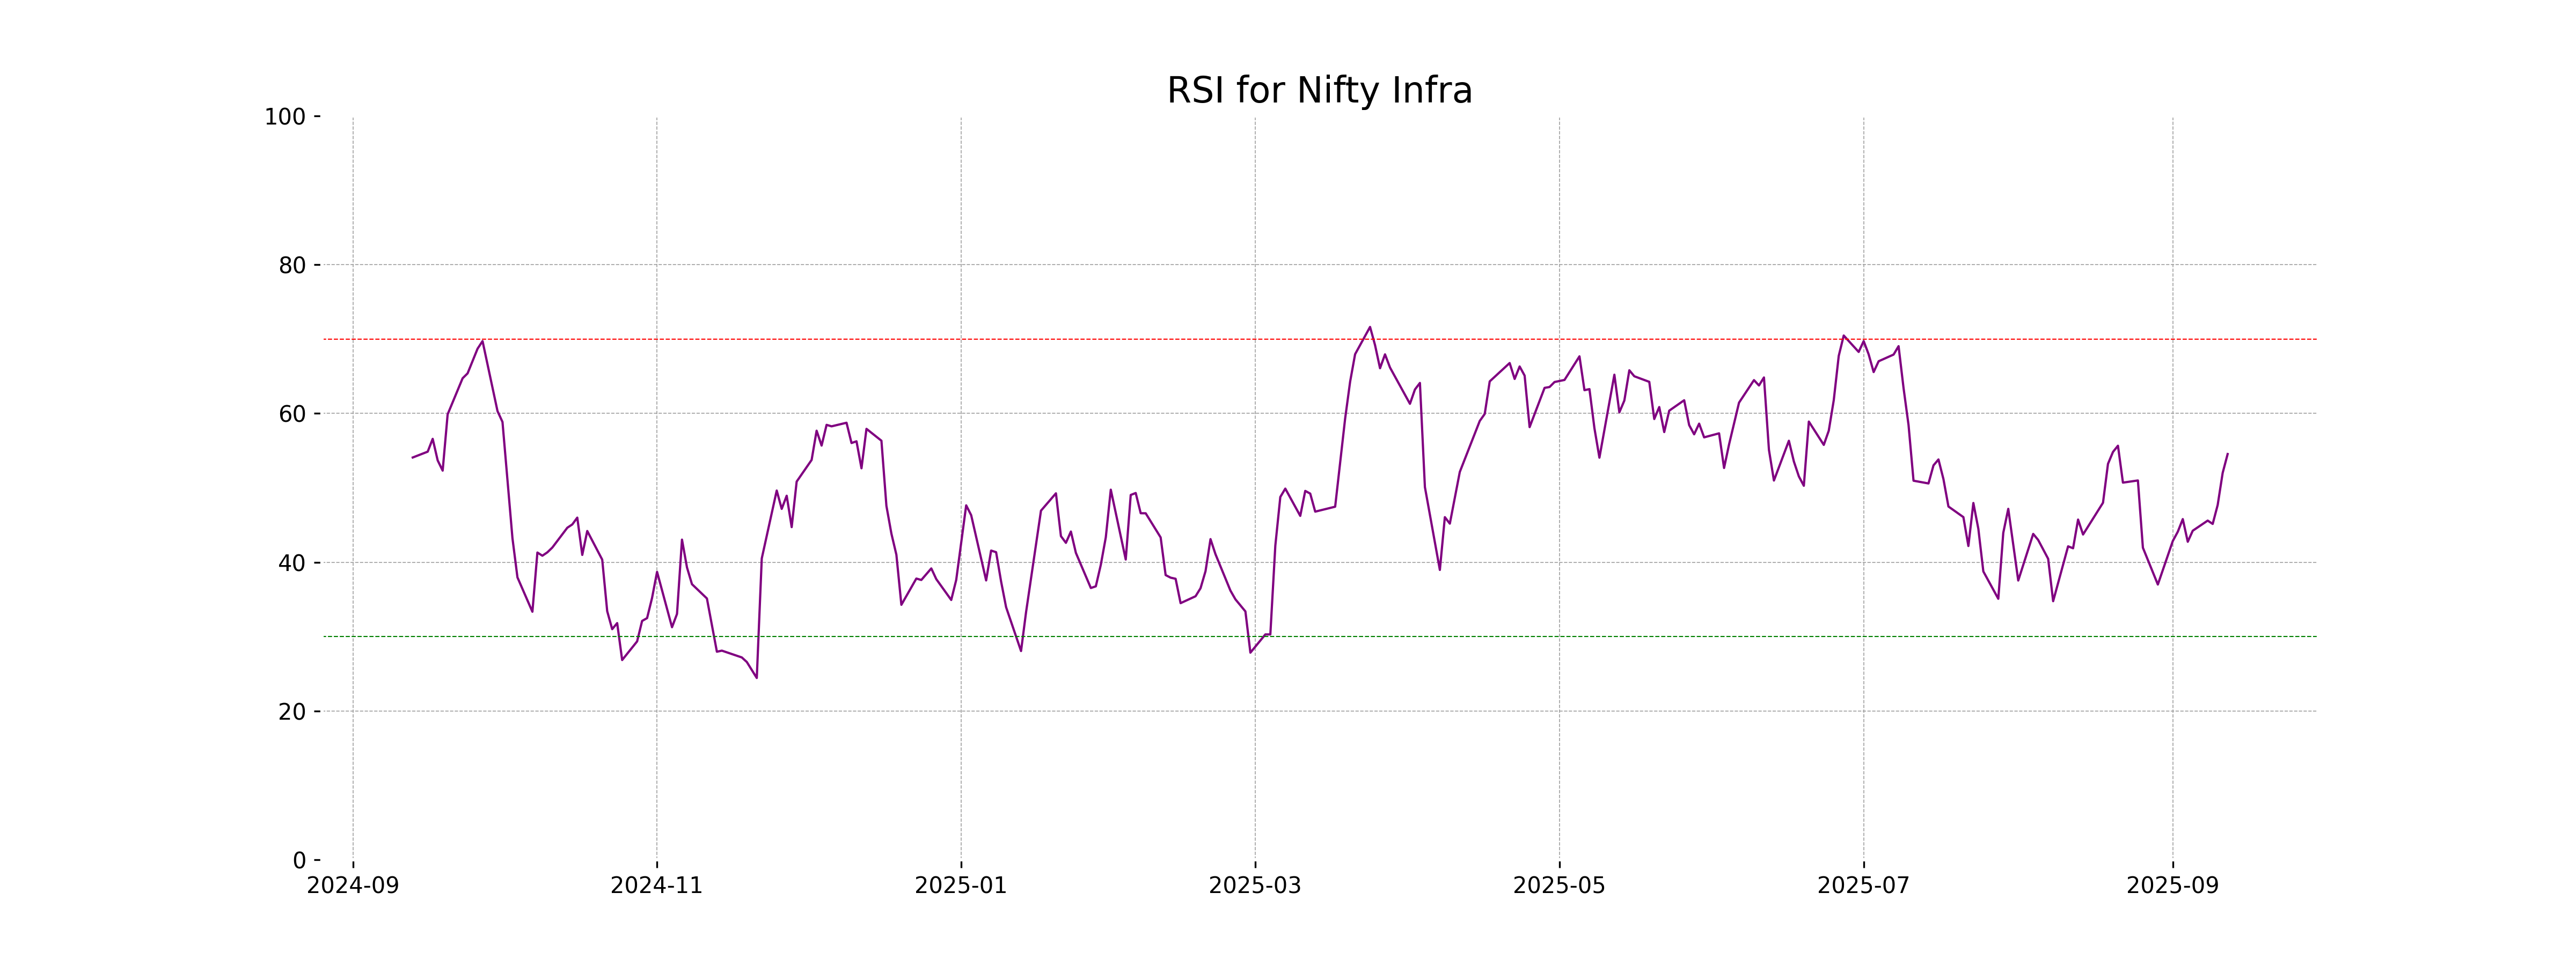
Nifty Infra started the day at 9069.95 and closed at 9074.0, marking a slight increase of 0.35% from its previous close of 9042.70. The index witnessed a day's high of 9100.20. With an RSI of 54.55, Nifty Infra indicates moderate strength, and with the MACD below the signal line, there is a potential bearish momentum.
Relationship with Key Moving Averages
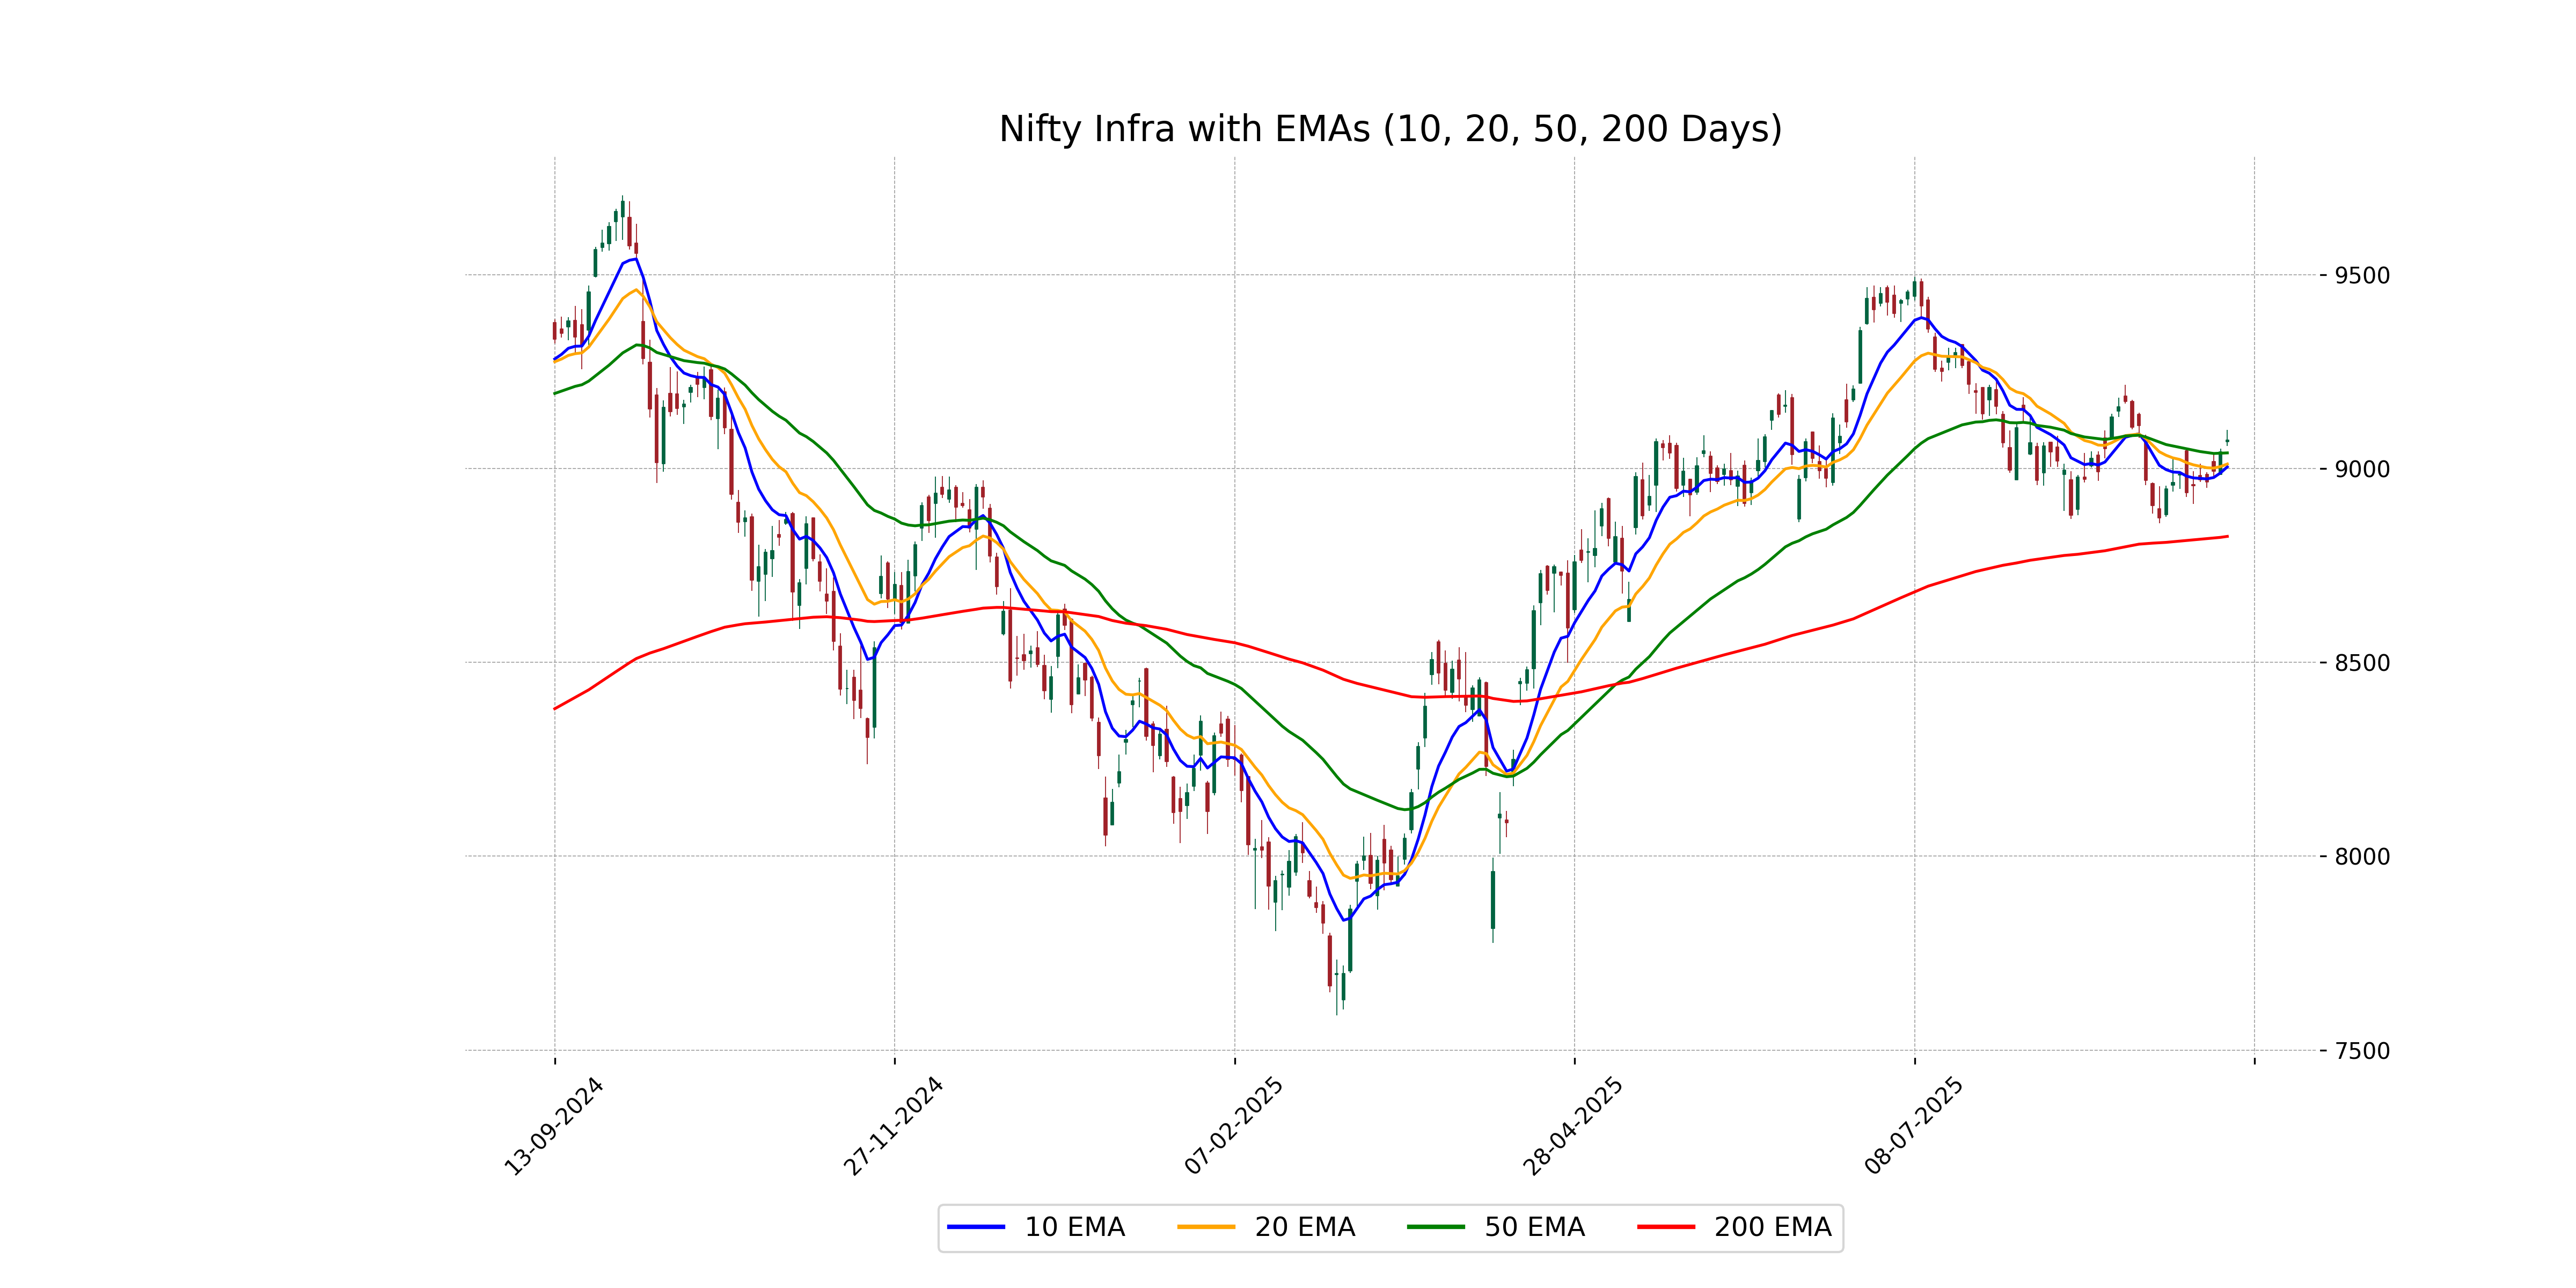
The Nifty Infra index is trading above its 50-day EMA of 9040.39 and its 10-day EMA of 9004.31, but remains below the 200-day EMA of 8824.99. This indicates a potential upward momentum in the short term while still being in a longer-term bearish trend.
Moving Averages Trend (MACD)
The MACD for Nifty Infra is currently at -18.99, while the MACD Signal is -33.10, indicating a potential bullish signal as the MACD is moving closer to the signal line. This suggests that bearish momentum may be weakening, and a possible trend reversal could occur if the MACD line crosses above the signal line.
RSI Analysis
The Relative Strength Index (RSI) for Nifty Infra is 54.55, which suggests a neutral momentum. An RSI above 70 generally indicates that the stock might be overbought, while below 30 indicates it might be oversold. At 54.55, Nifty Infra is neither overbought nor oversold, signifying balanced market conditions.
Analysis for Nifty IT - September 12, 2025

Nifty IT opened at 36,331.45 and closed at 36,110.75, marking a slight increase of 0.30% or 107.25 points from the previous close of 36,003.50. The index has a 50-day EMA of 35,951.08, indicating a position above the short-term trend, while the 200-day EMA at 37,583.52 suggests it's below the long-term trend. The Relative Strength Index (RSI) is at 55.42, showing a moderately bullish sentiment.
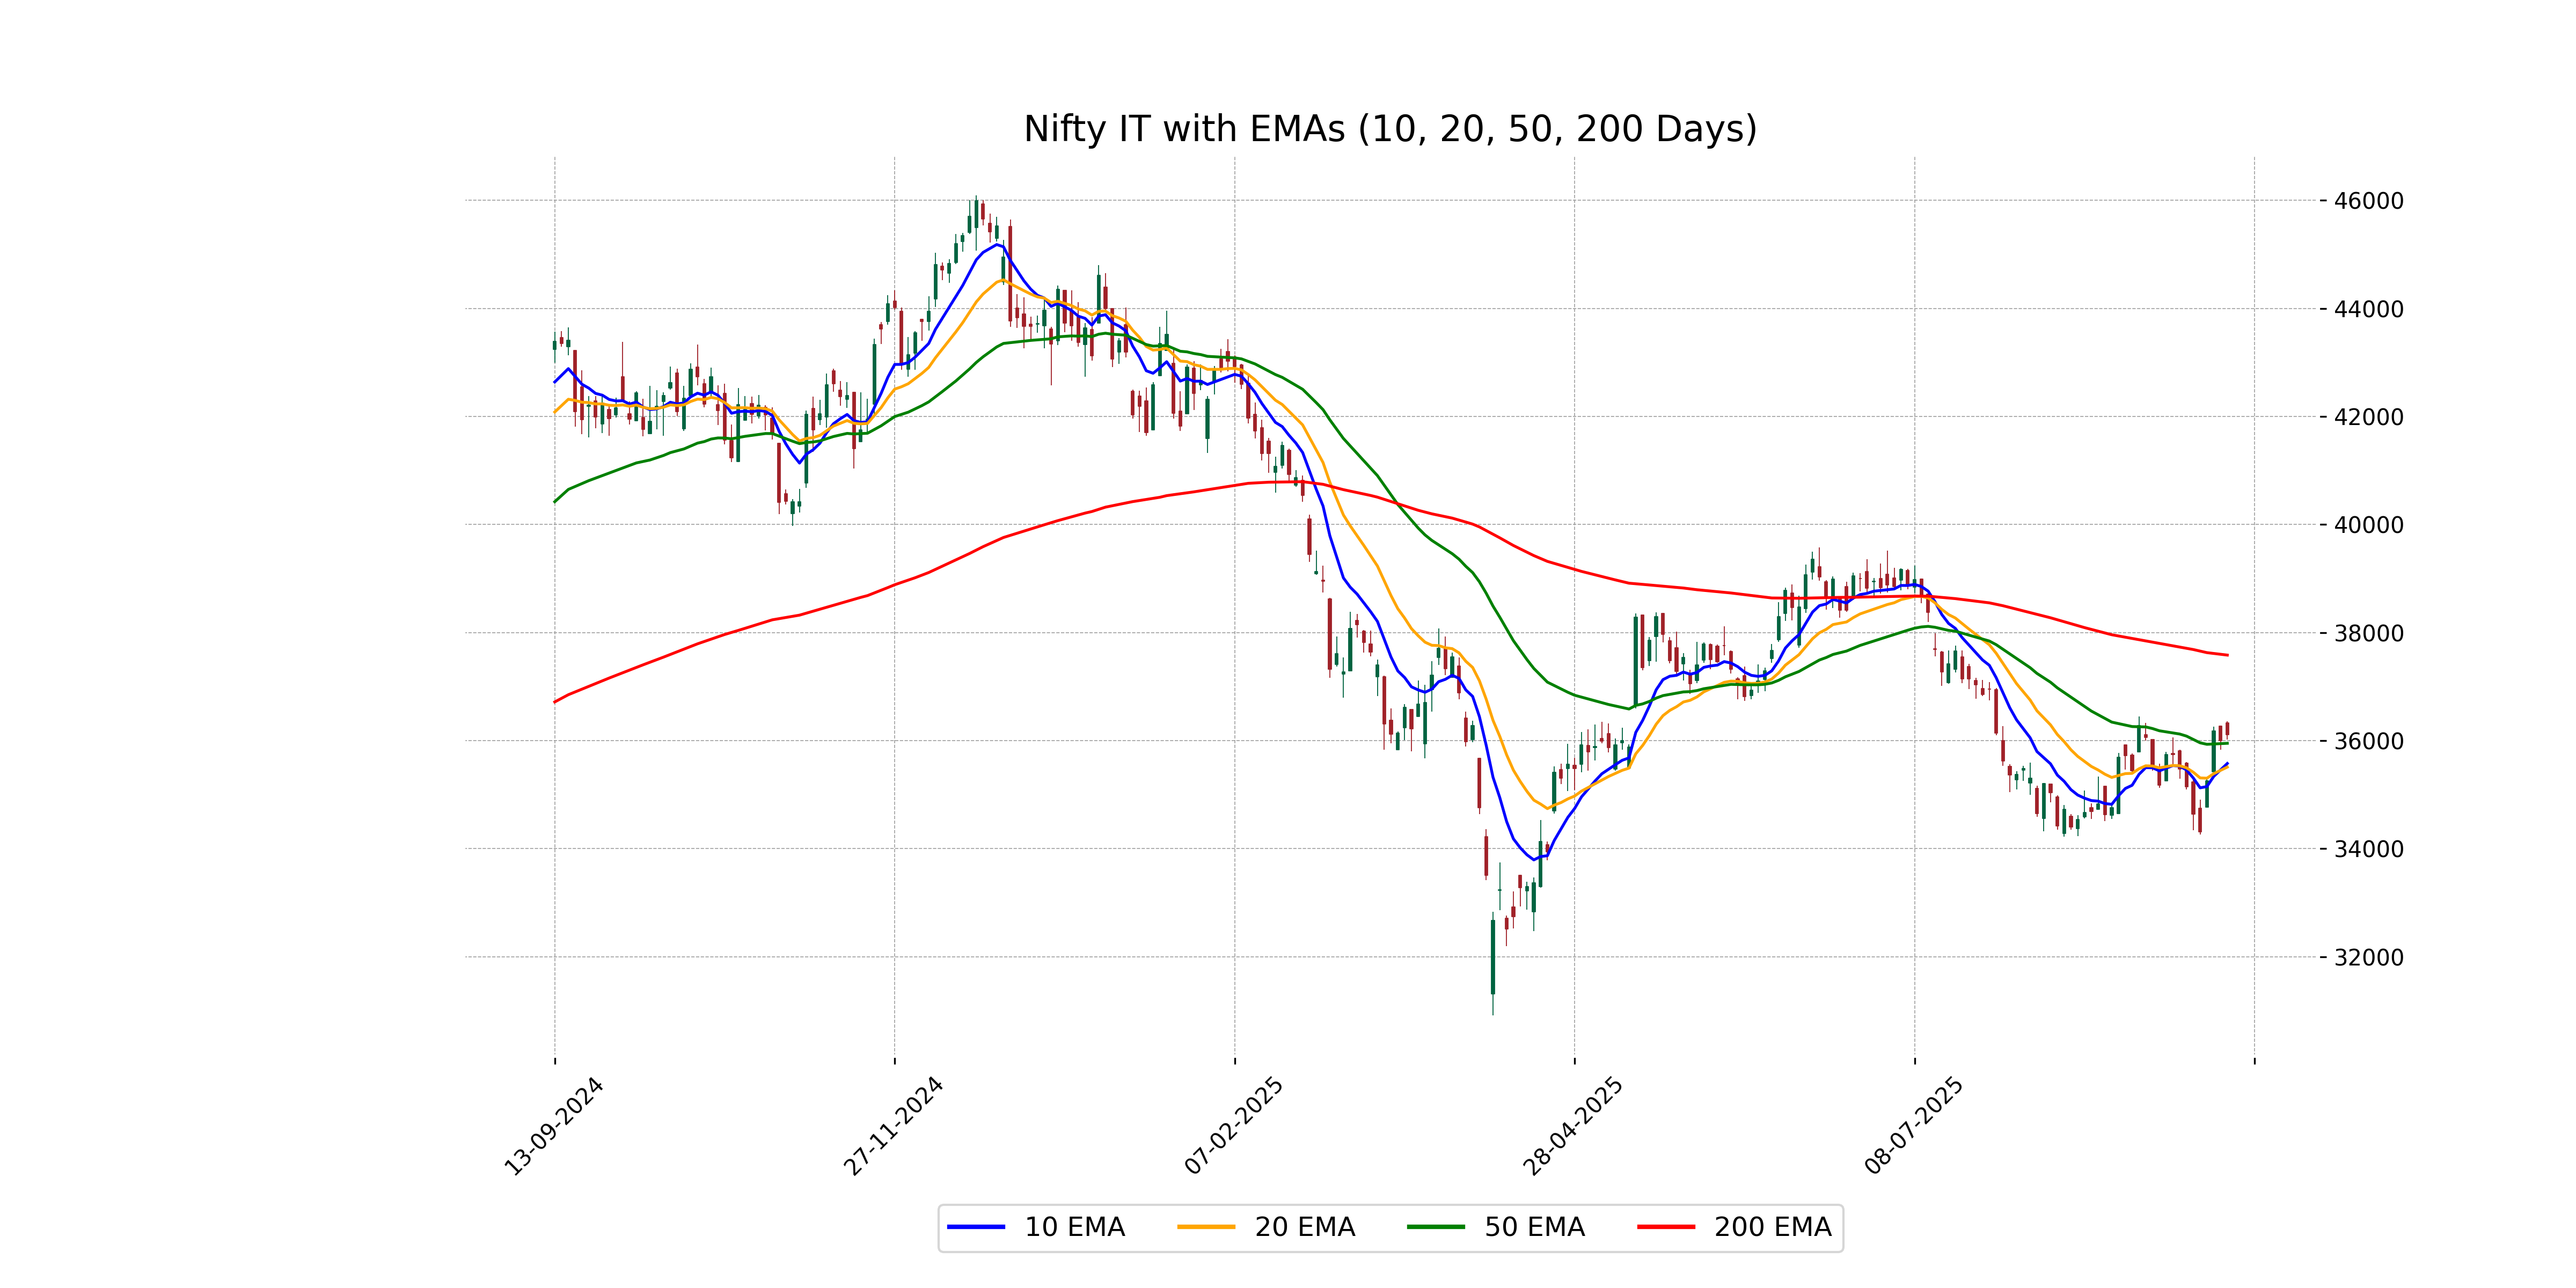
Relationship with Key Moving Averages
The Nifty IT index closed at 36110.75, slightly above its 50-EMA of 35951.08, indicating recent upward momentum. However, it remains below the 200-EMA of 37583.52, suggesting a longer-term bearish trend. Additionally, the close is above the 10-EMA and 20-EMA, which signals short-term strength.
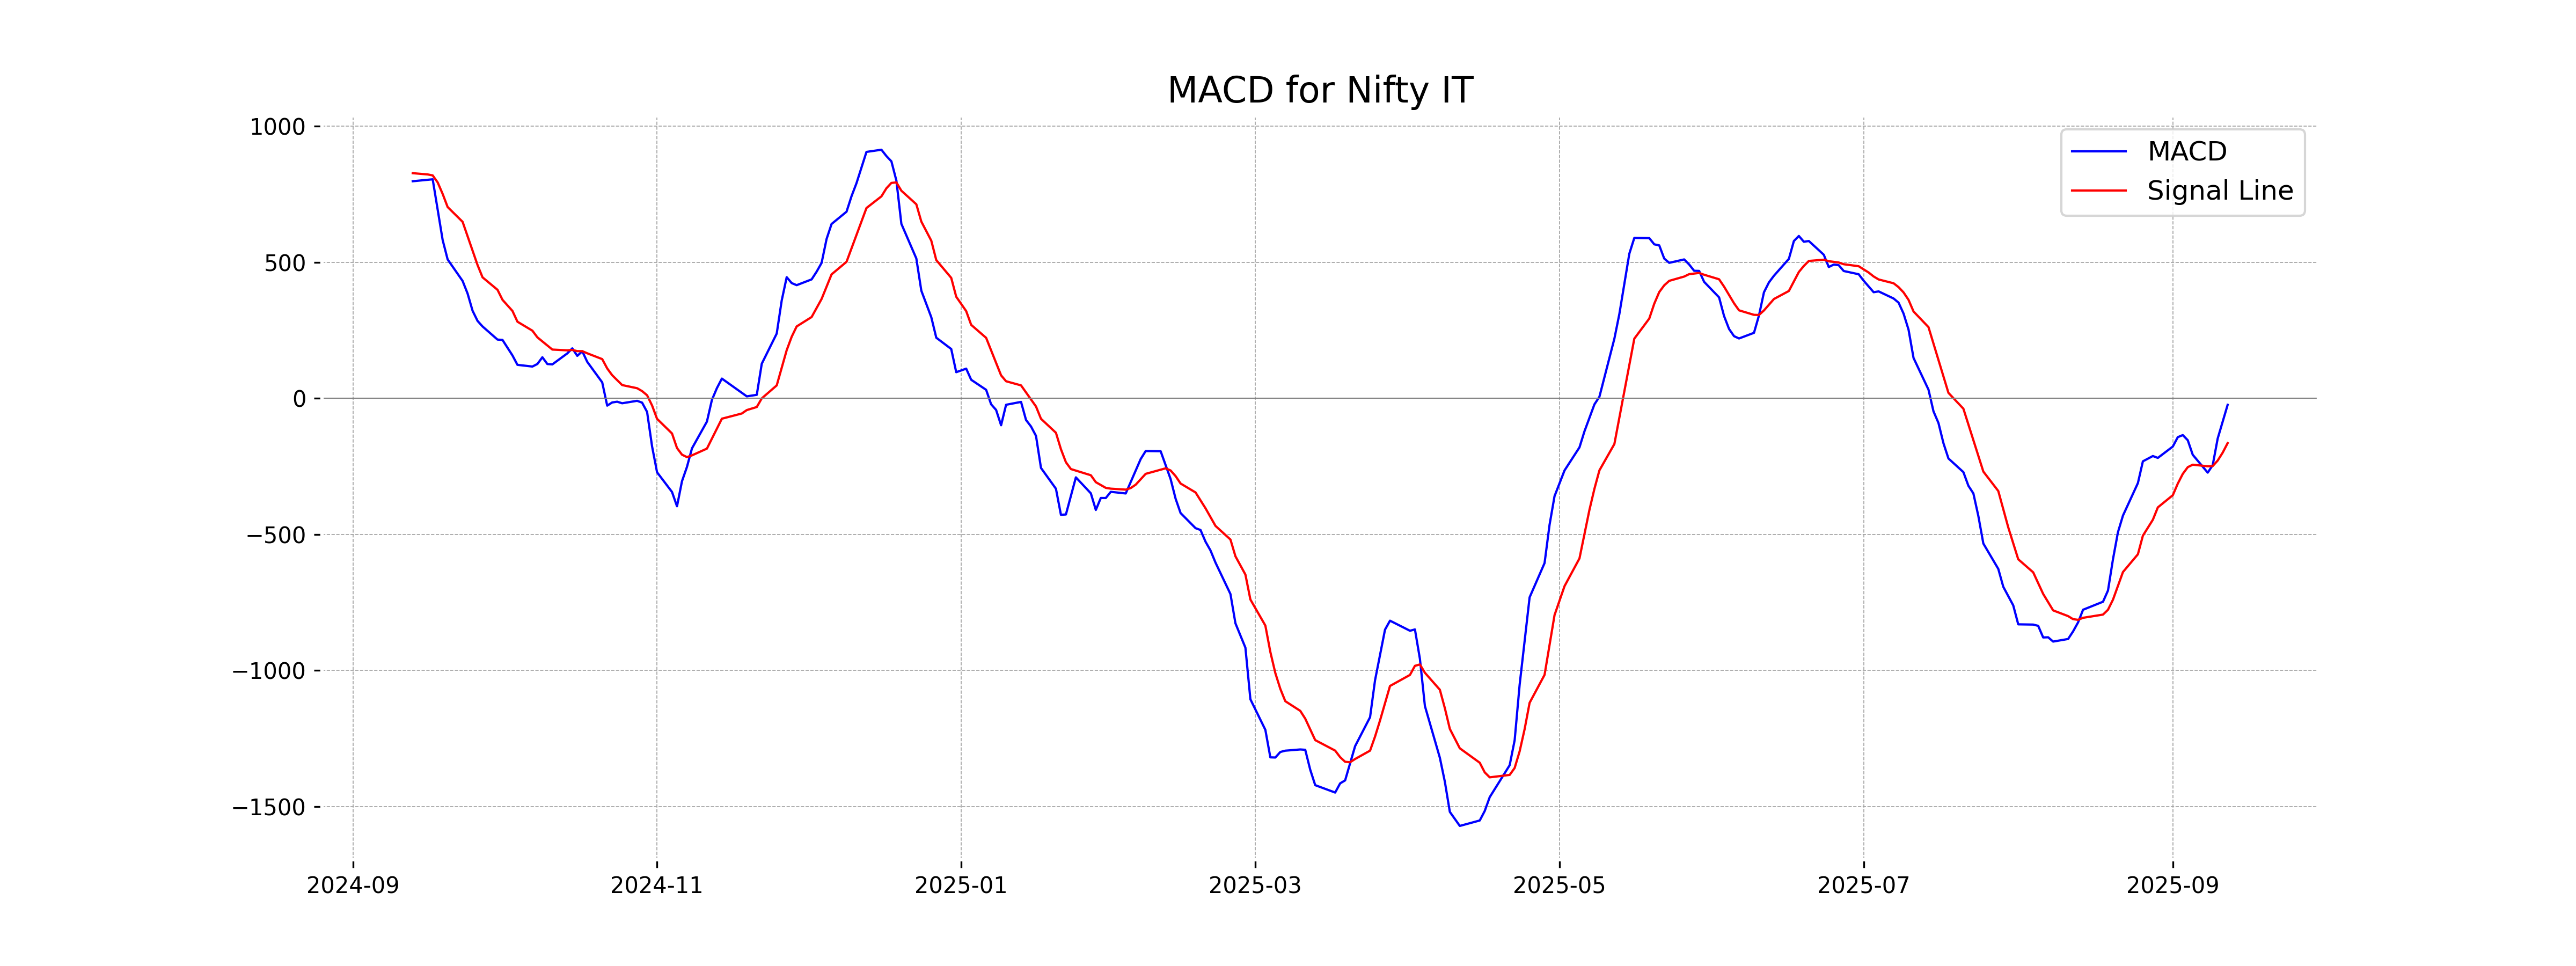
Moving Averages Trend (MACD)
The MACD for Nifty IT is -23.606, which is above the MACD Signal of -164.303. This indicates a potential bullish momentum in the short term, as the MACD line has crossed above the signal line, although both values are still in negative territory.
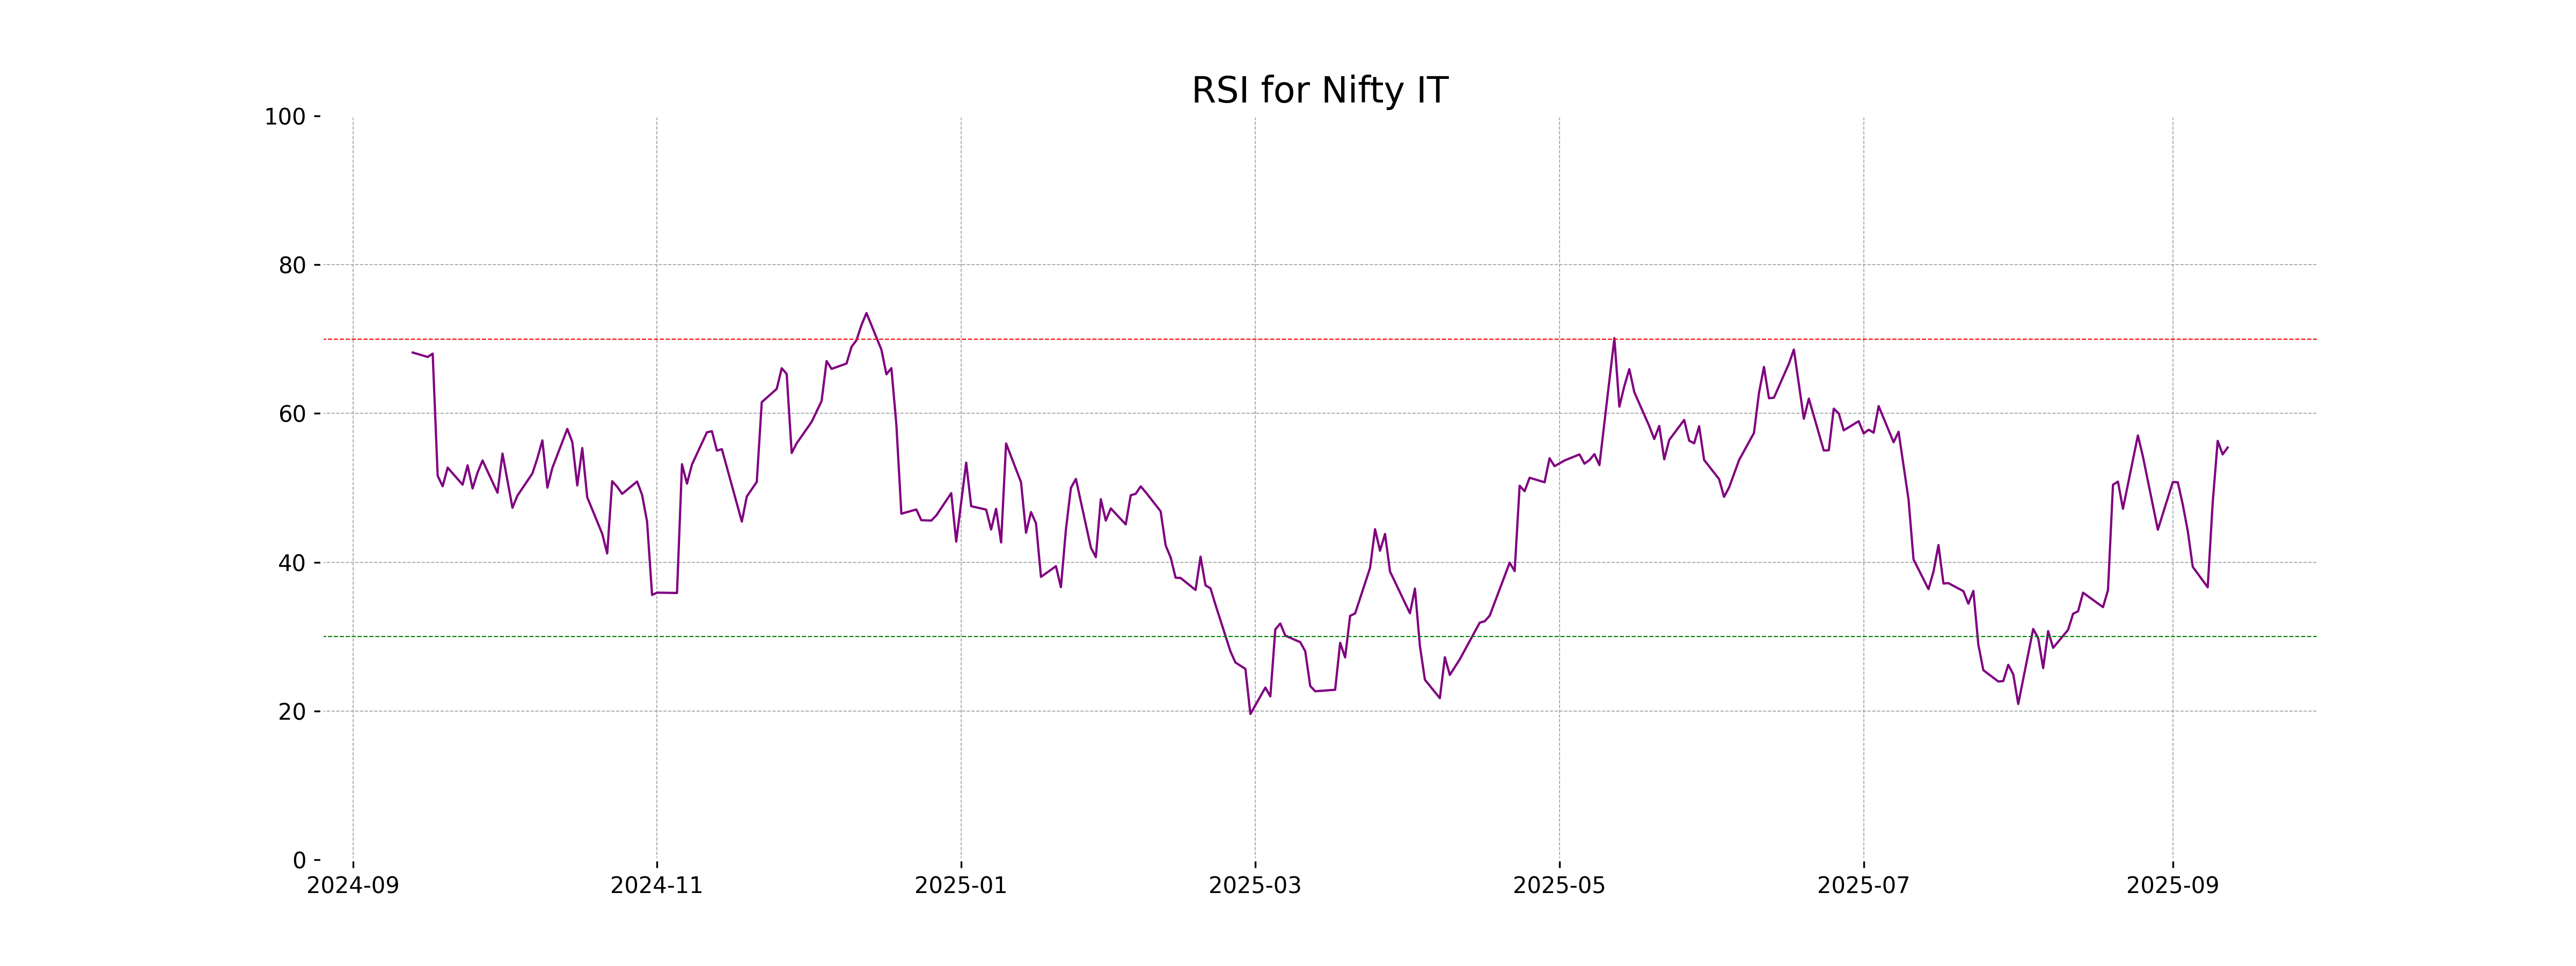
RSI Analysis
The RSI value for Nifty IT is 55.42, indicating that the stock is in a neutral zone. This suggests neither overbought nor oversold conditions, which could imply potential stability or consolidation in price action.
Analysis for Nifty Metal - September 12, 2025
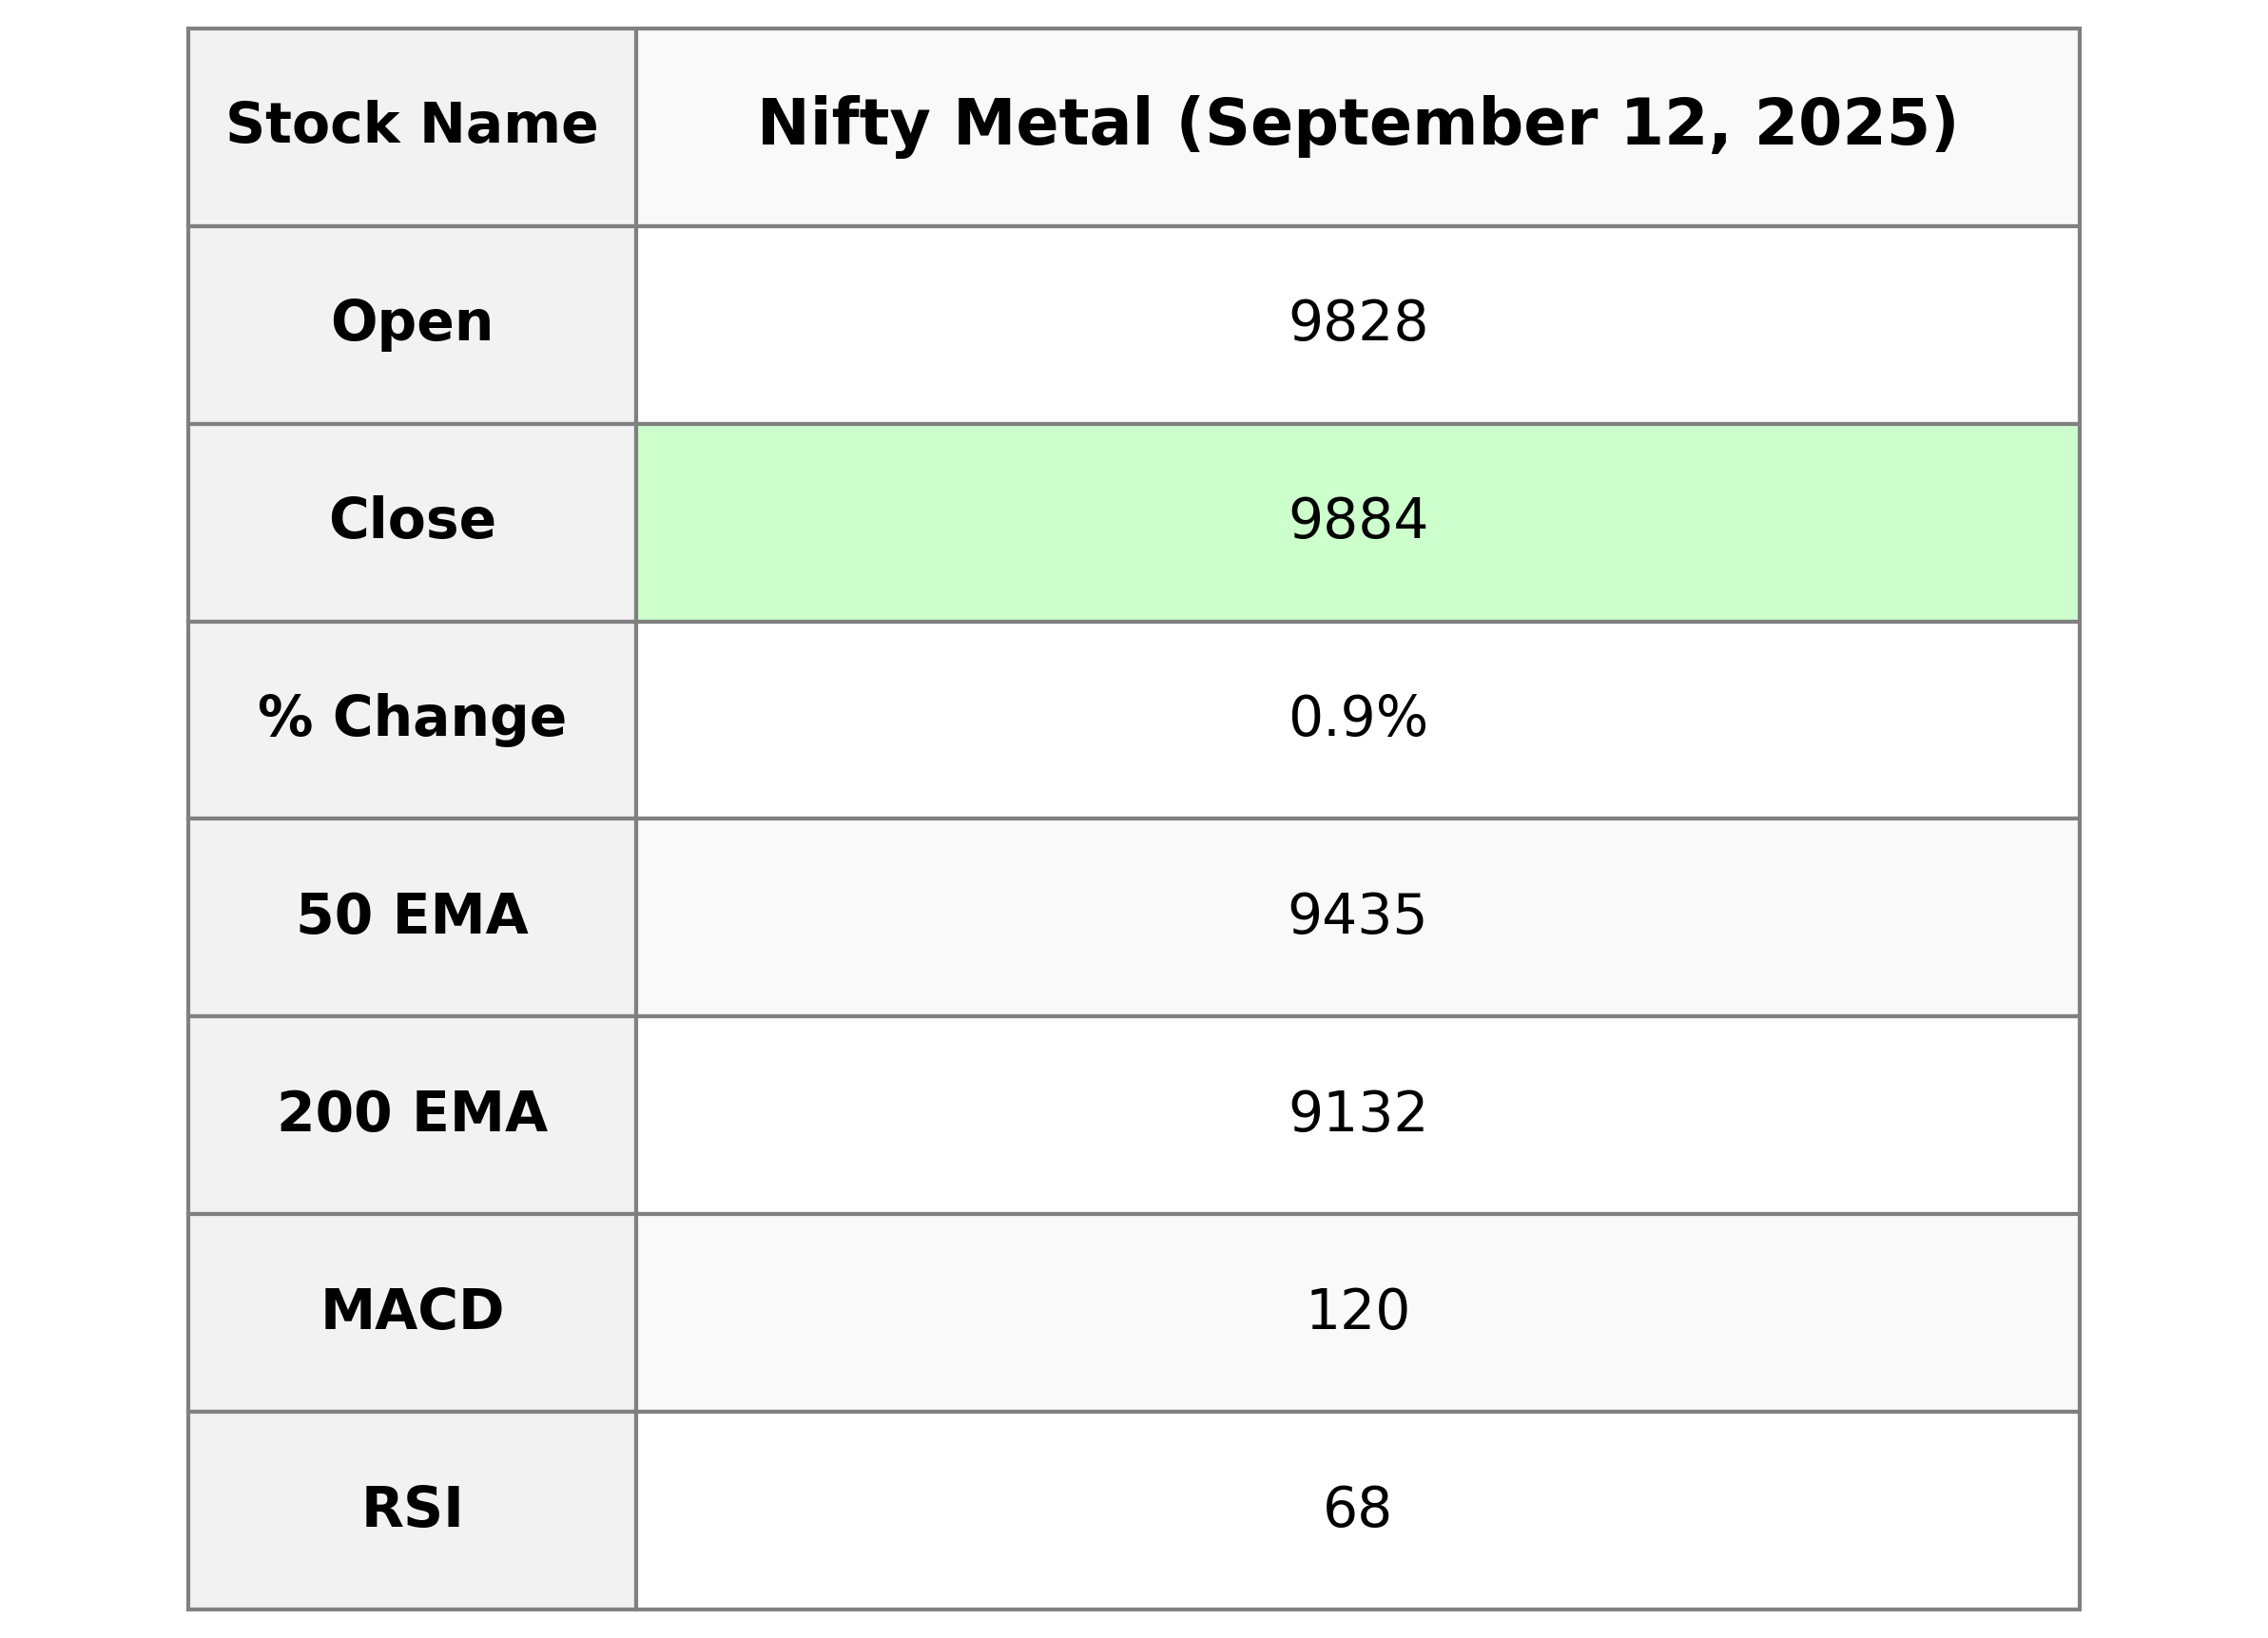
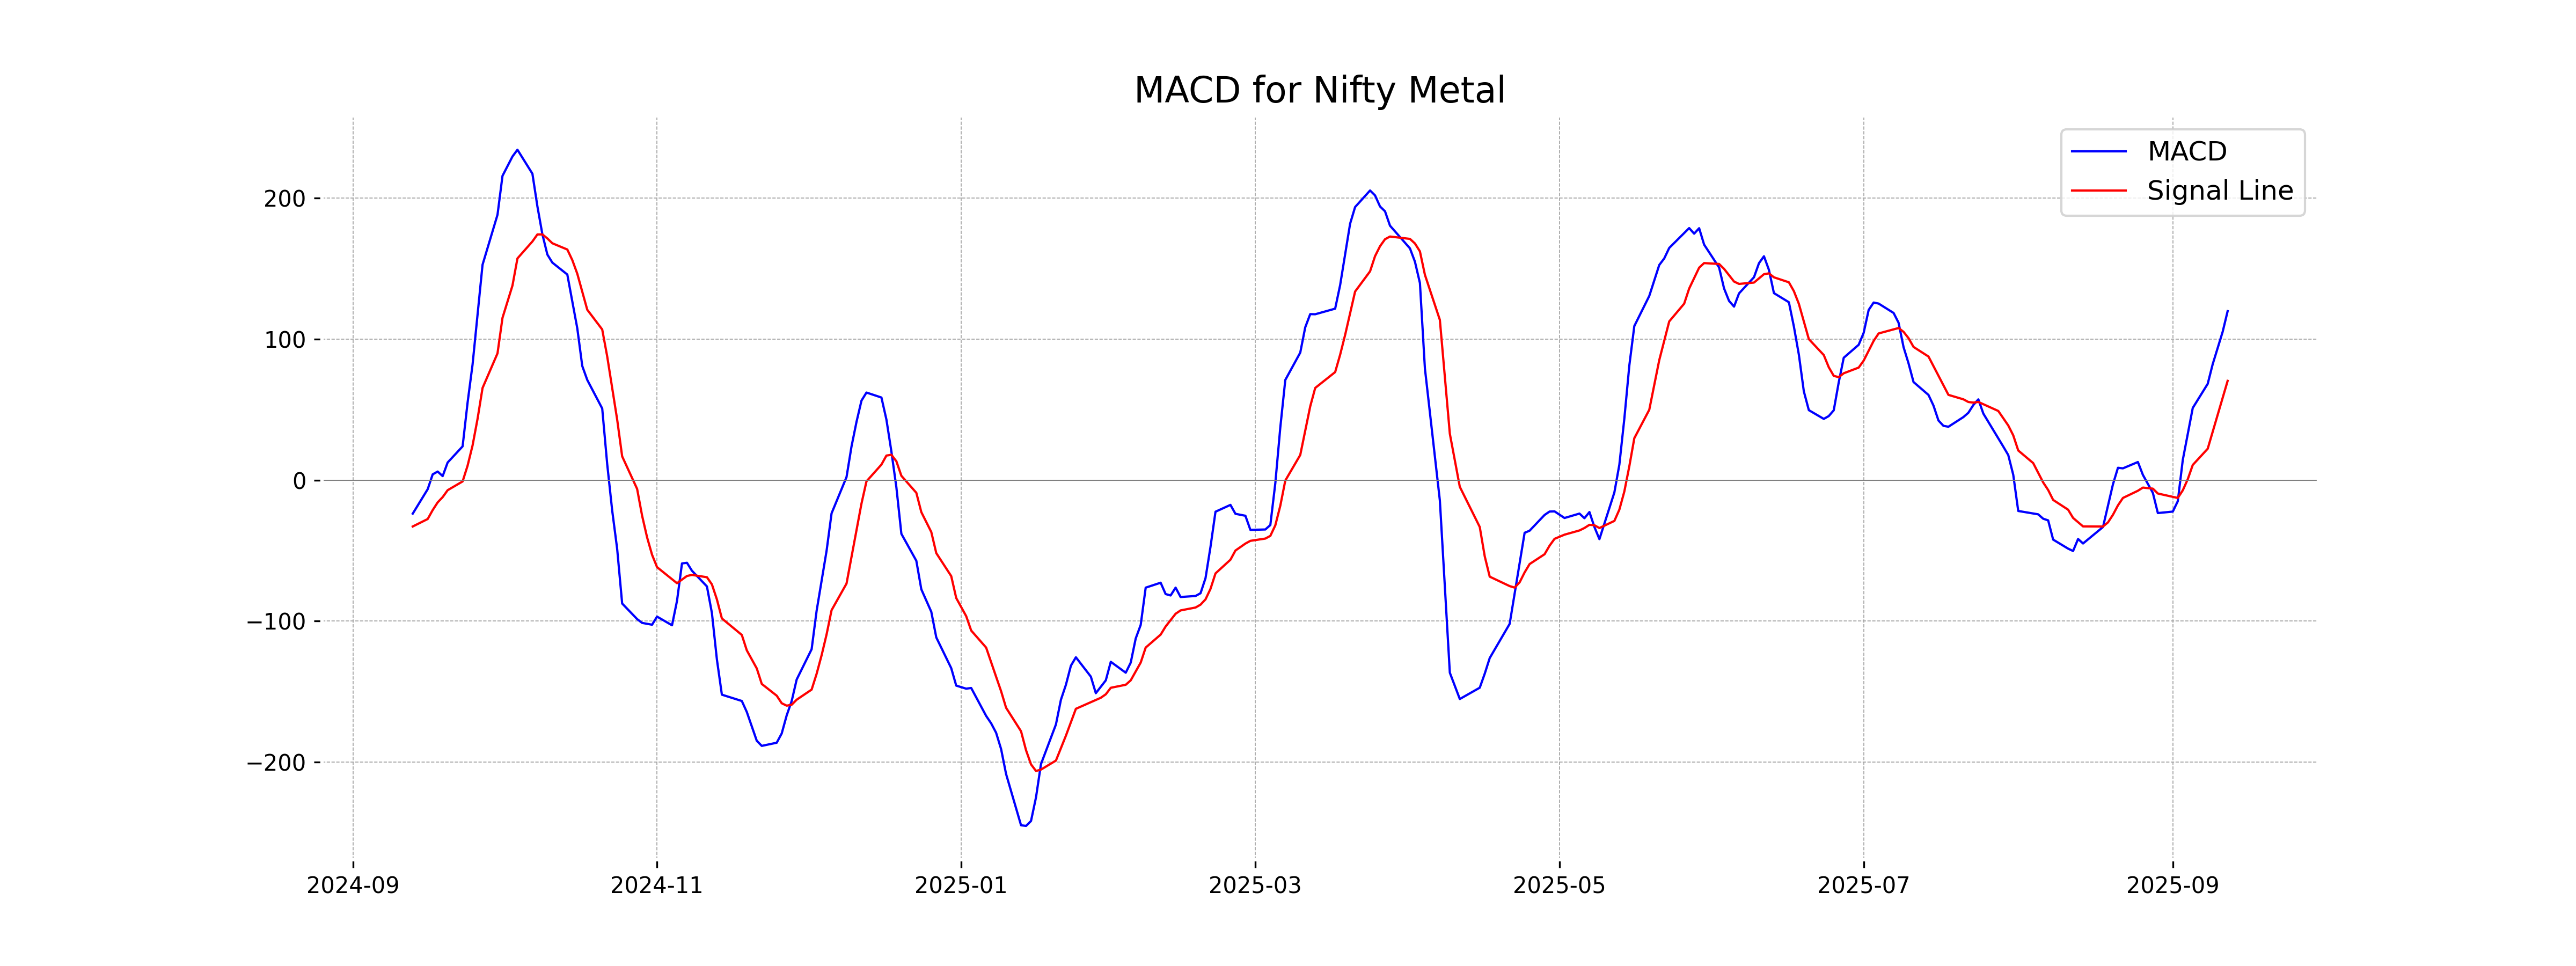
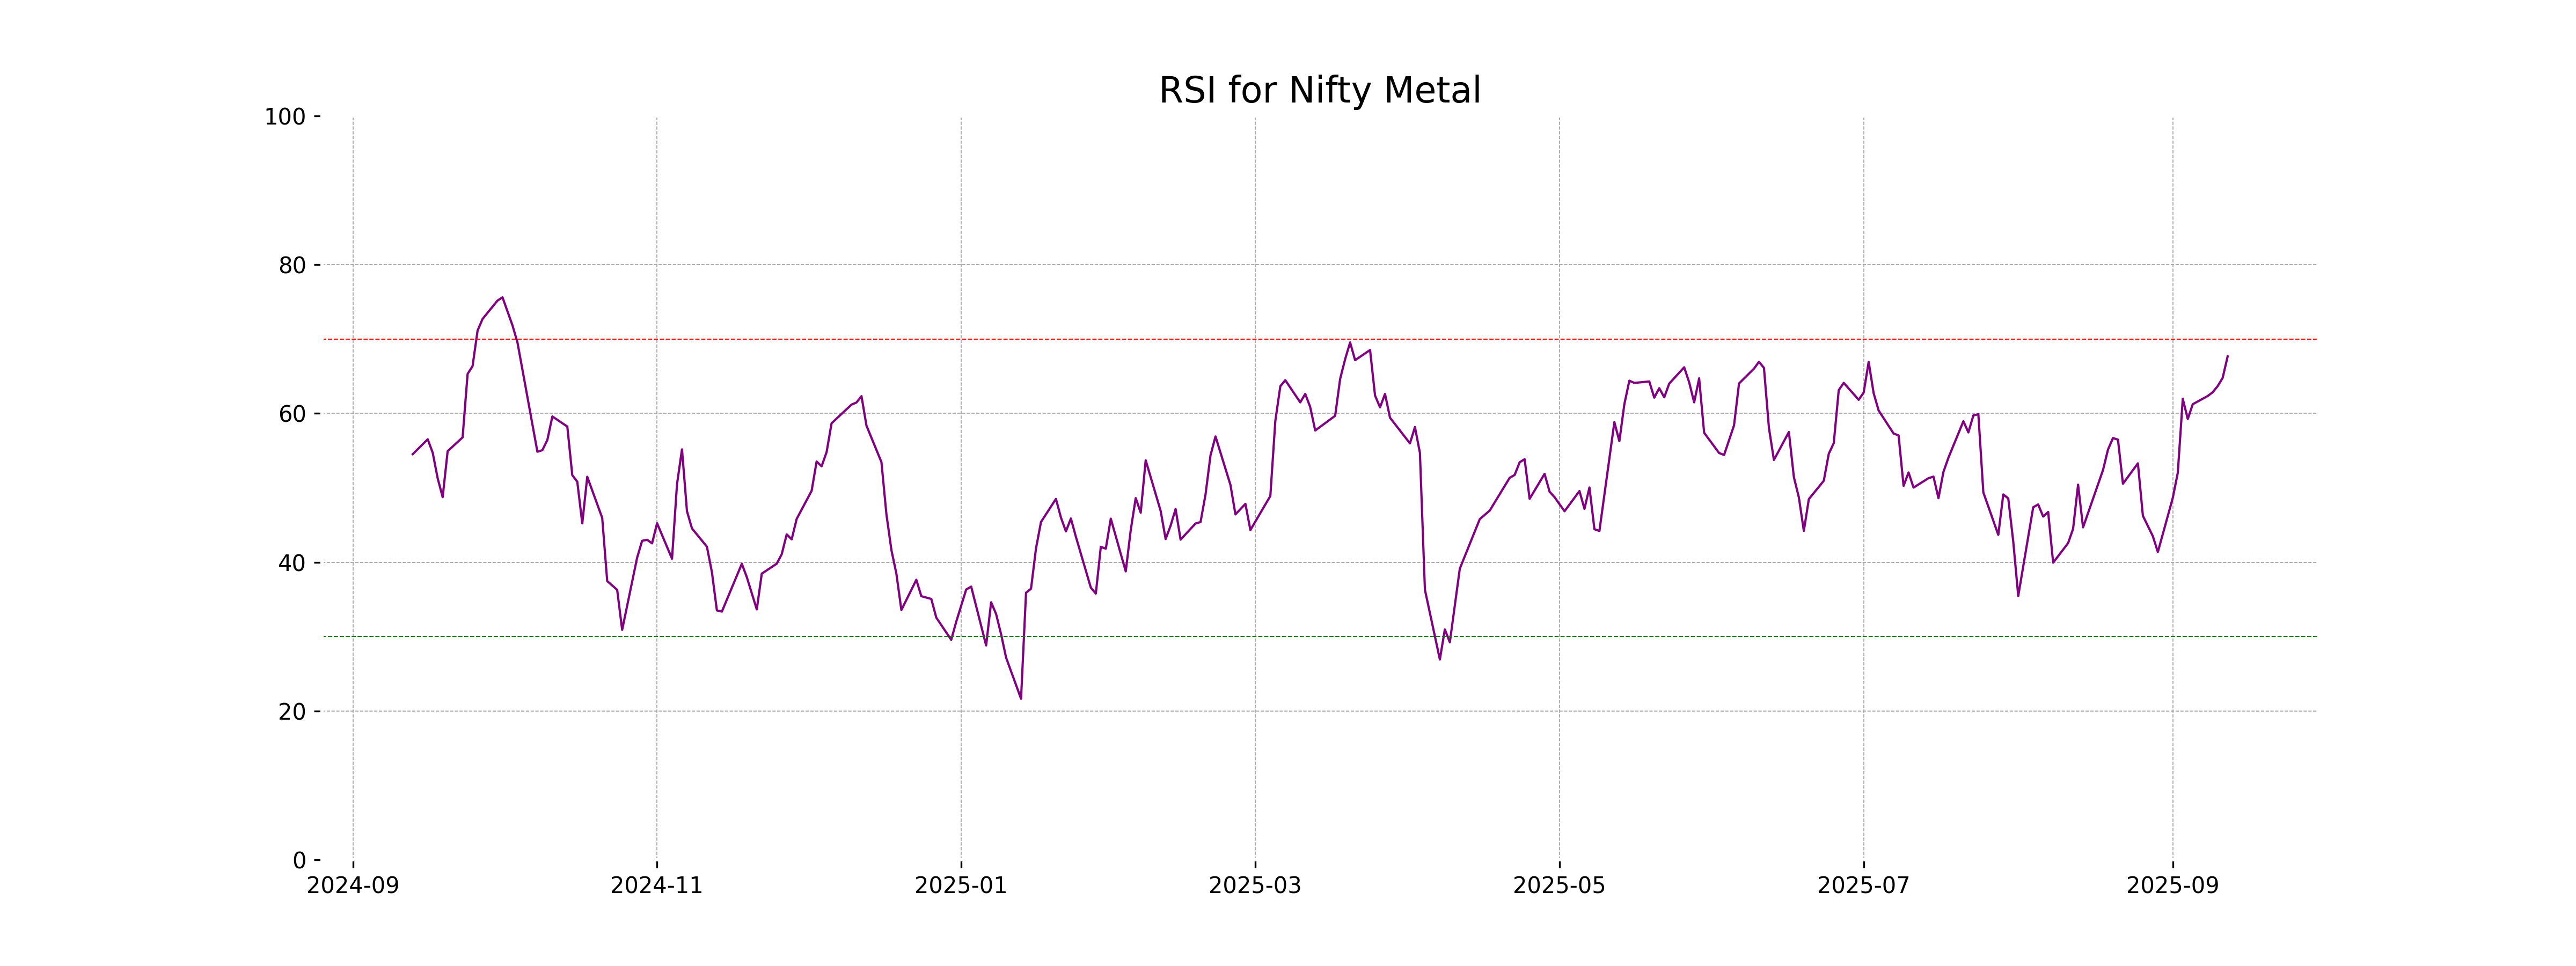
The Nifty Metal index opened at 9828.35 and closed at 9883.60, marking a positive change of approximately 0.93%. The index showed a strong performance above its 50-day and 200-day exponential moving averages. Additionally, the relative strength index of 67.67 indicates bullish momentum, and the MACD also supports this positive trend with a notable difference from its signal line.
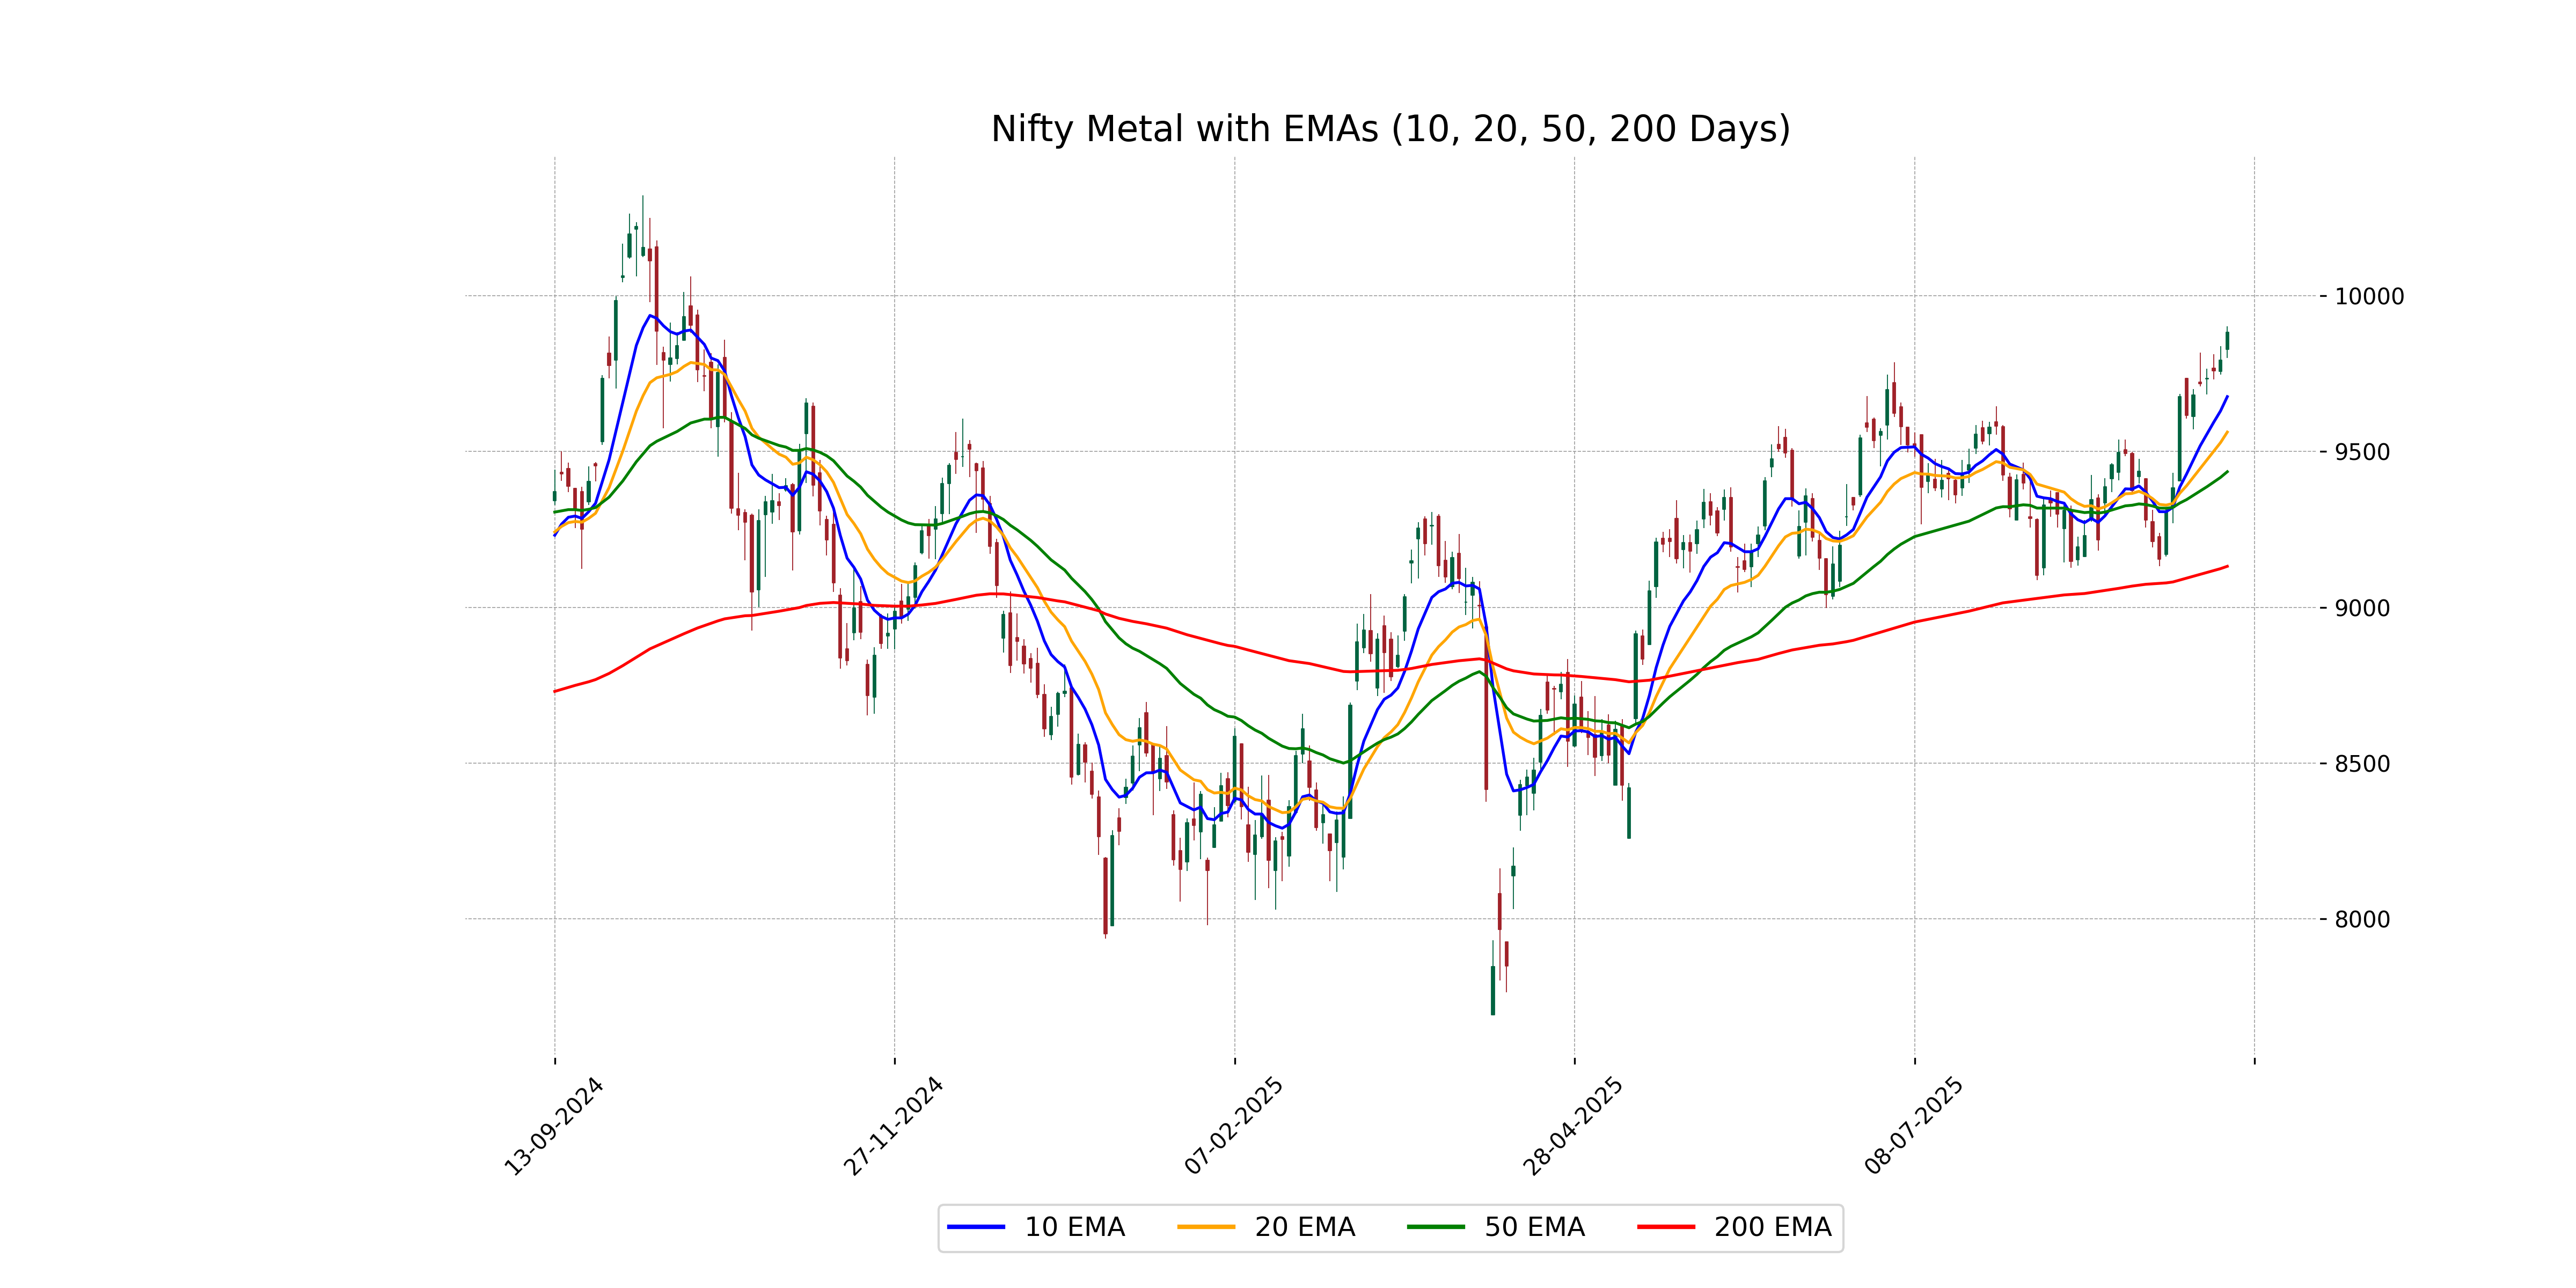
Relationship with Key Moving Averages
The Nifty Metal index closed above its 10-day, 20-day, 50-day, and 200-day EMAs, suggesting strong bullish momentum. The close at 9883.60 shows that the index is maintaining its upward trend, as evidenced by the MACD being above the signal line. The position above these key averages reflects positive market sentiment.
Moving Averages Trend (MACD)
The MACD for Nifty Metal from the given data is 119.94, with a signal line of 70.47. Since the MACD is above its signal line, this suggests a bullish trend. The increasing divergence also indicates potential upward momentum in the stock's price.
RSI Analysis
The RSI value for Nifty Metal is 67.67, indicating strong momentum, though it is approaching overbought territory. If the RSI continues to rise above 70, it might suggest that the stock is becoming overbought, potentially hinting at a pullback or consolidation phase. Monitoring price movement and RSI changes can provide insights into future trend directions.
Analysis for Nifty Bank - September 12, 2025
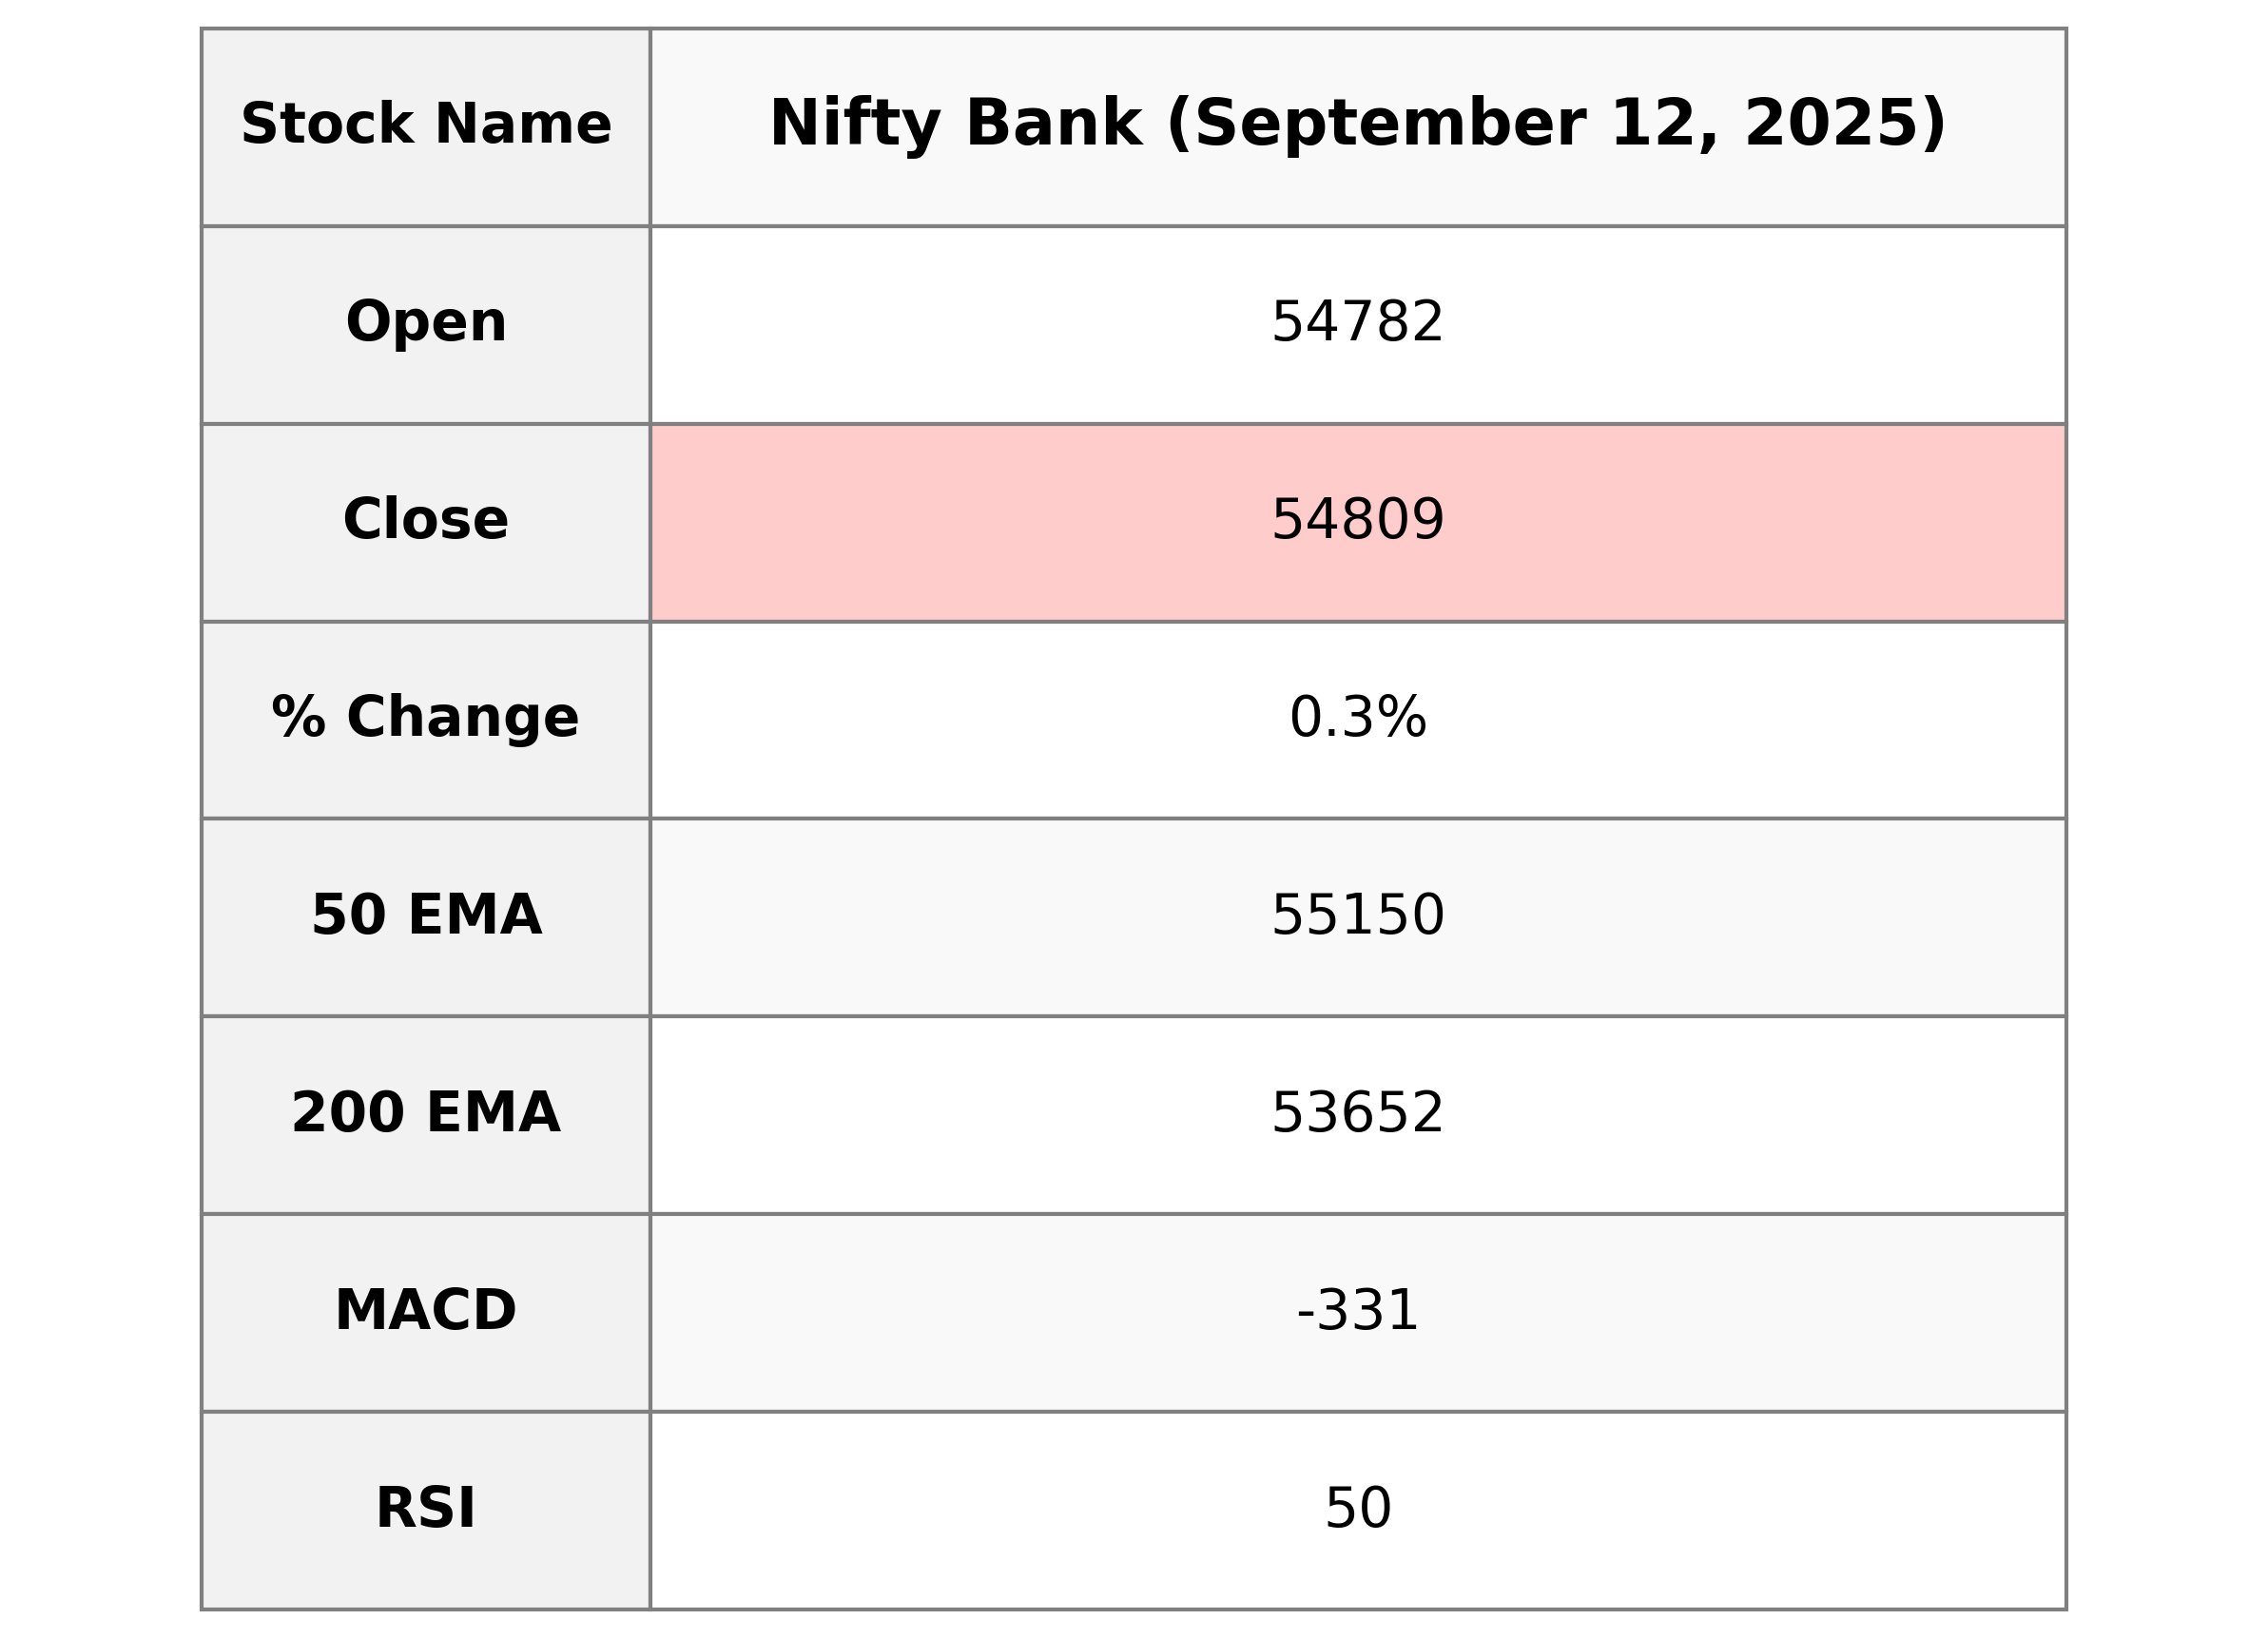
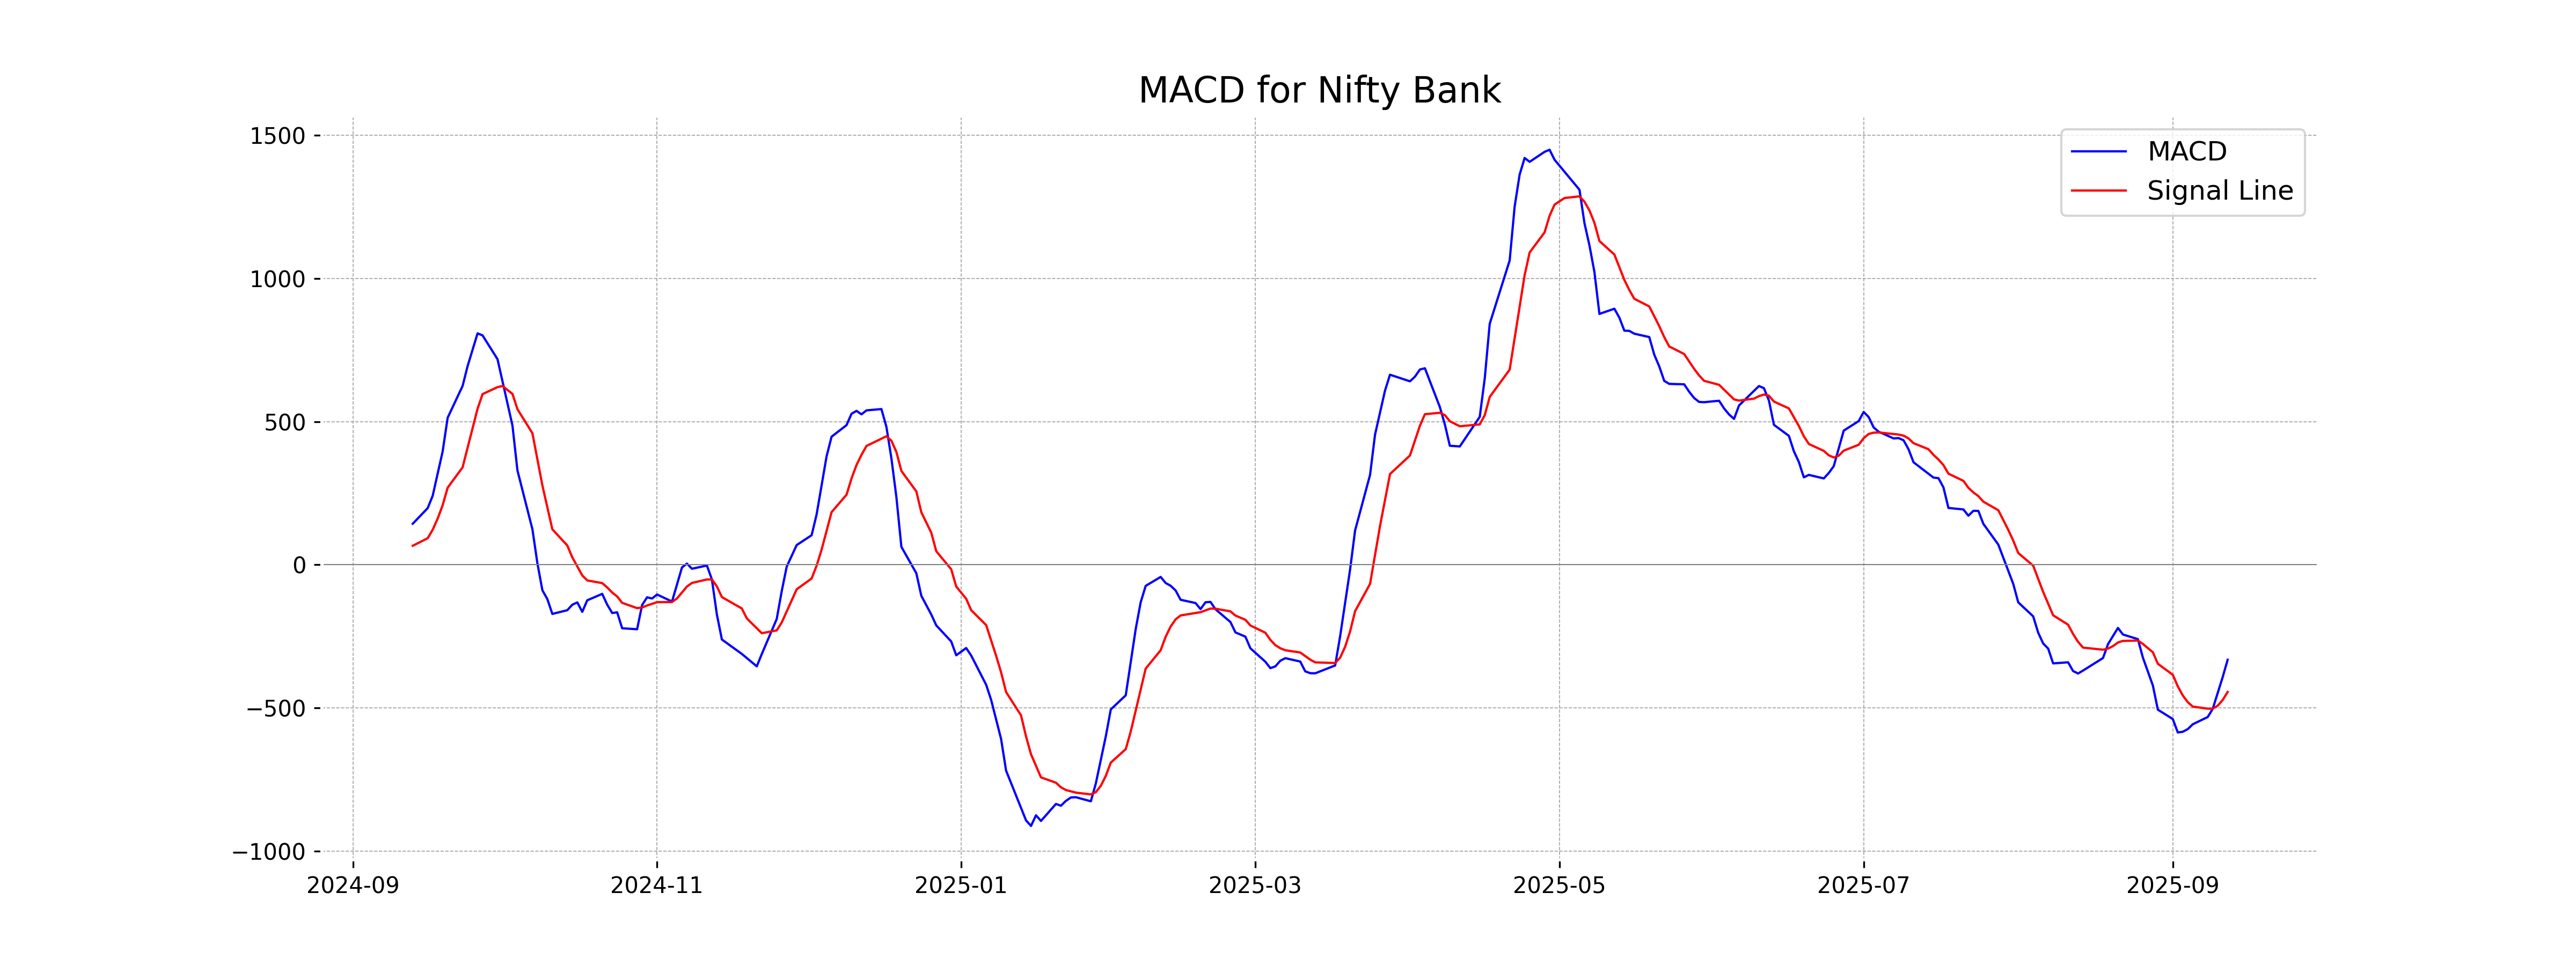
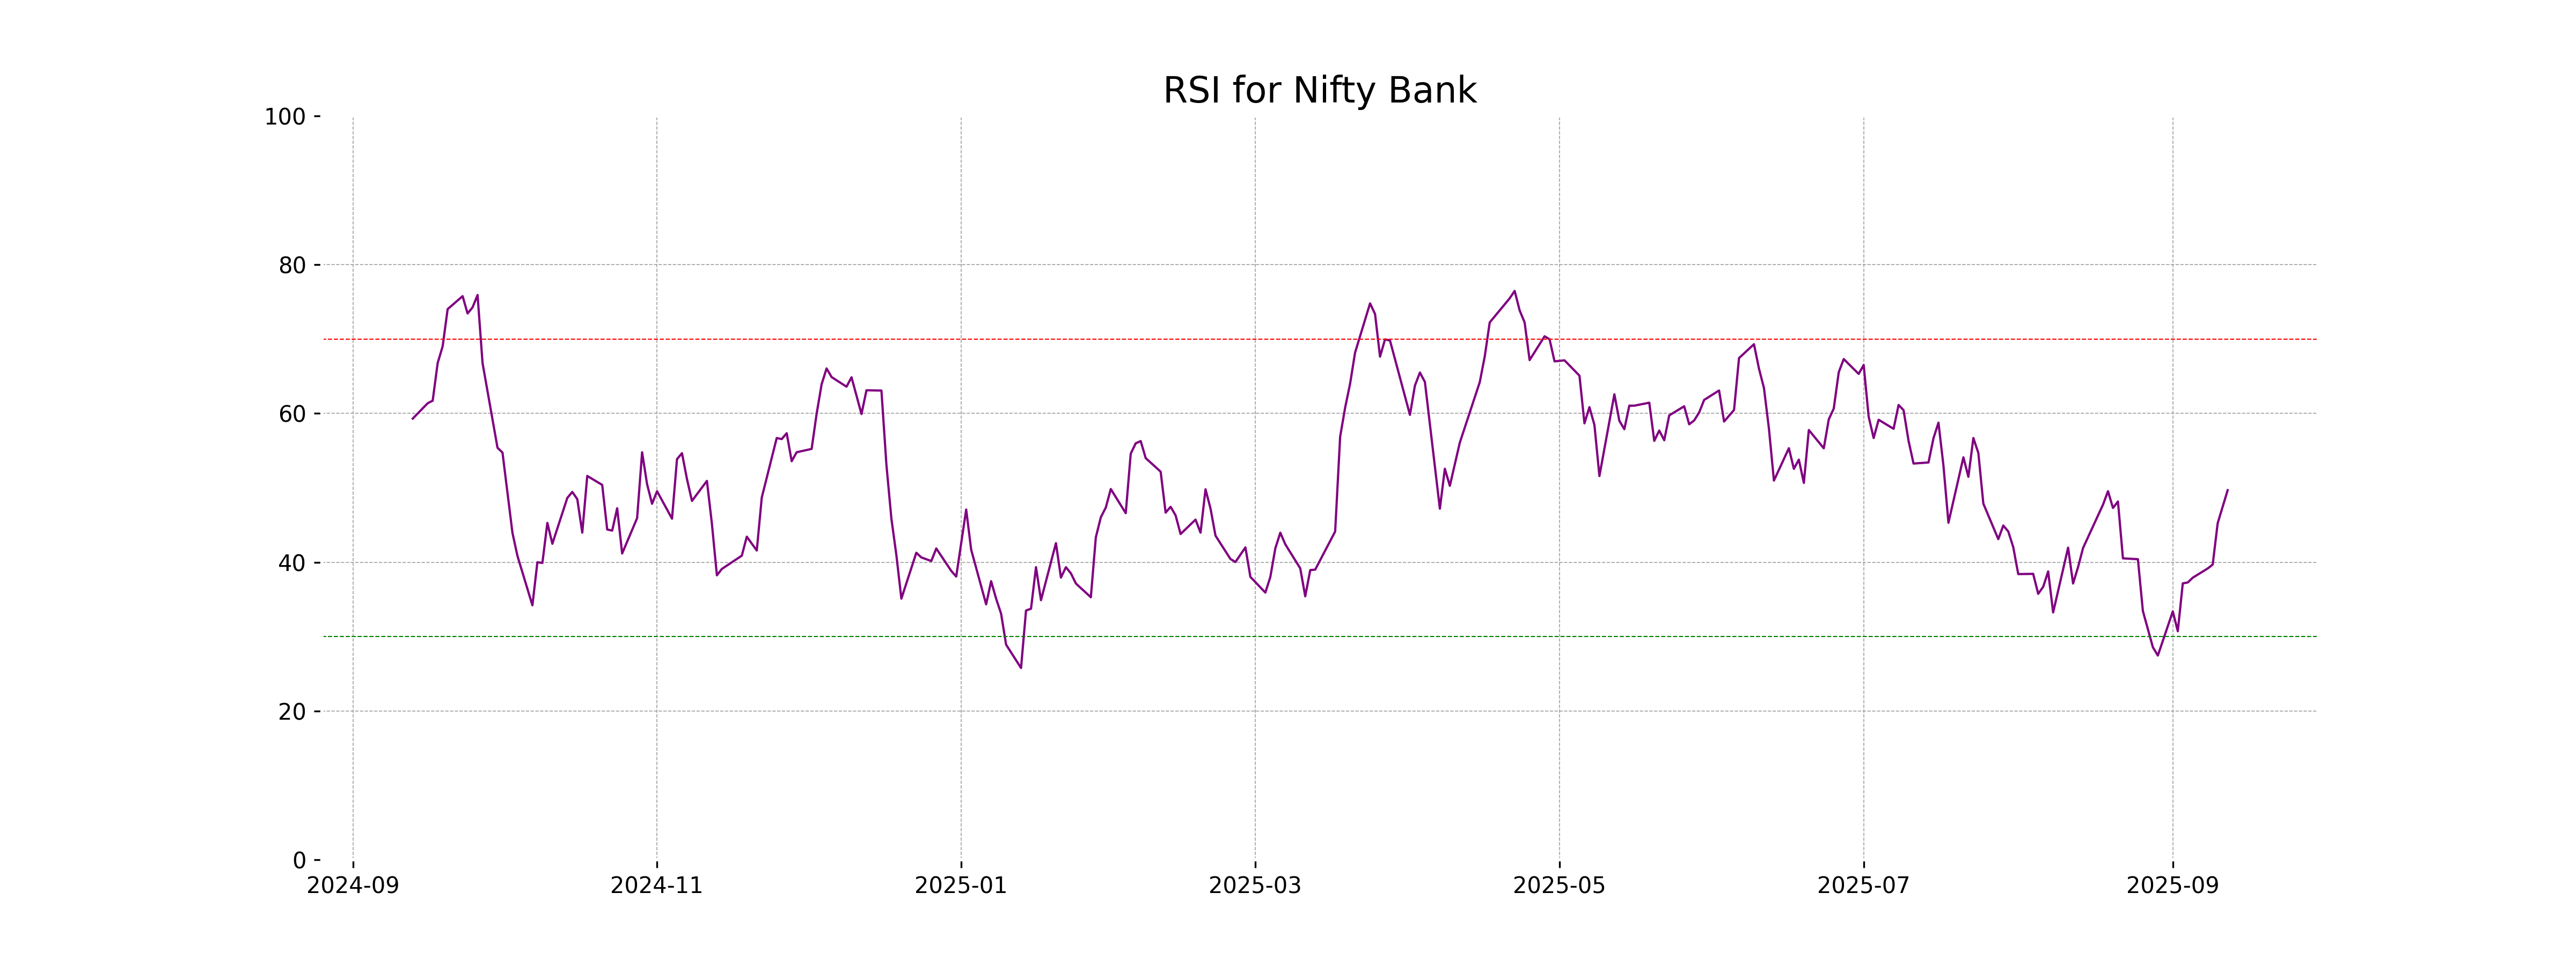
The Nifty Bank index opened at 54,781.55 and closed at 54,809.30, marking a slight increase of 0.26%. The day's trading saw a high of 54,852.25 and a low of 54,580.35. Despite the positive close, the index's 10 EMA (54,454.39) and 20 EMA (54,650.88) suggest short-term bearish sentiment, reinforced by a negative MACD of -331.40, though slightly better than the MACD Signal of -443.78. The RSI indicates a neutral momentum at 49.68.
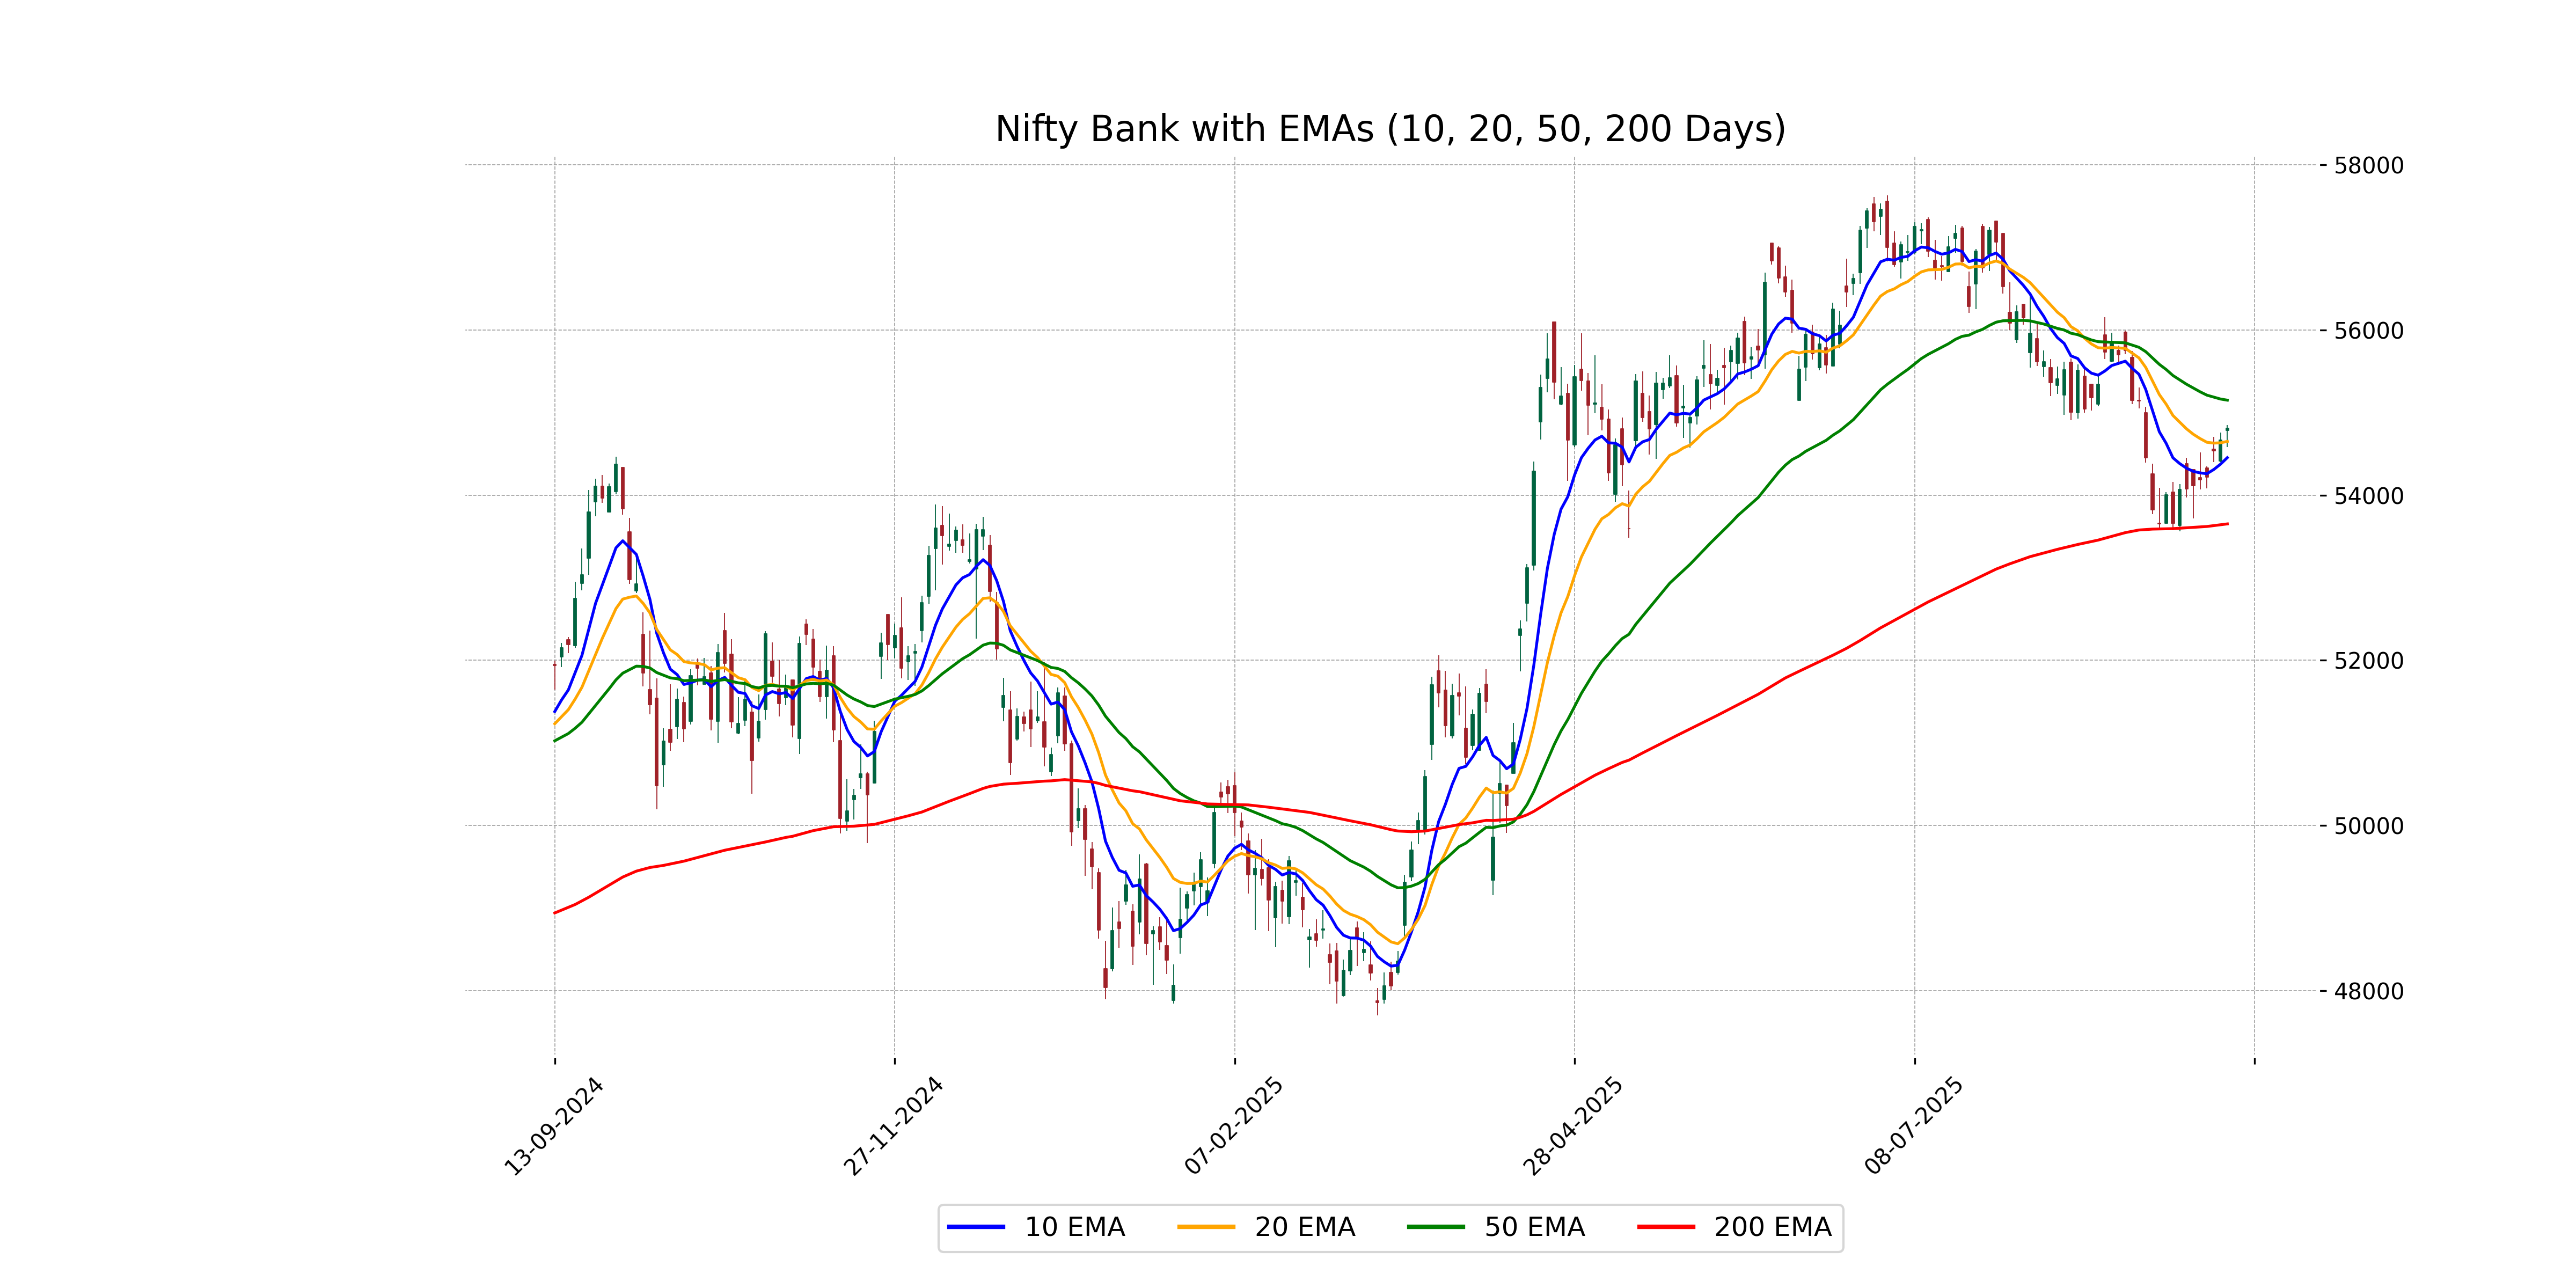
Relationship with Key Moving Averages
Nifty Bank closed at 54809.30, which is below its 50-day EMA of 55150.41, indicating a potential short-term weakness. However, it is above the 10-day EMA of 54454.39 and close to the 20-day EMA of 54650.88, suggesting some short-term support. The presence of the RSI at 49.68 shows a neutral momentum.
Moving Averages Trend (MACD)
Based on the data, Nifty Bank's MACD is currently at -331.40, which is above its MACD Signal of -443.78. This suggests a potential bullish crossover, indicating that the recent upward movement may continue. However, the MACD is still in the negative territory, so caution is advised as the broader trend may still be bearish.
RSI Analysis
The RSI for Nifty Bank is at 49.68, suggesting a neutral position neither strongly overbought nor oversold. This level indicates a balanced momentum with no clear trend direction, as the RSI is around the mid-point of the typical range (30-70).
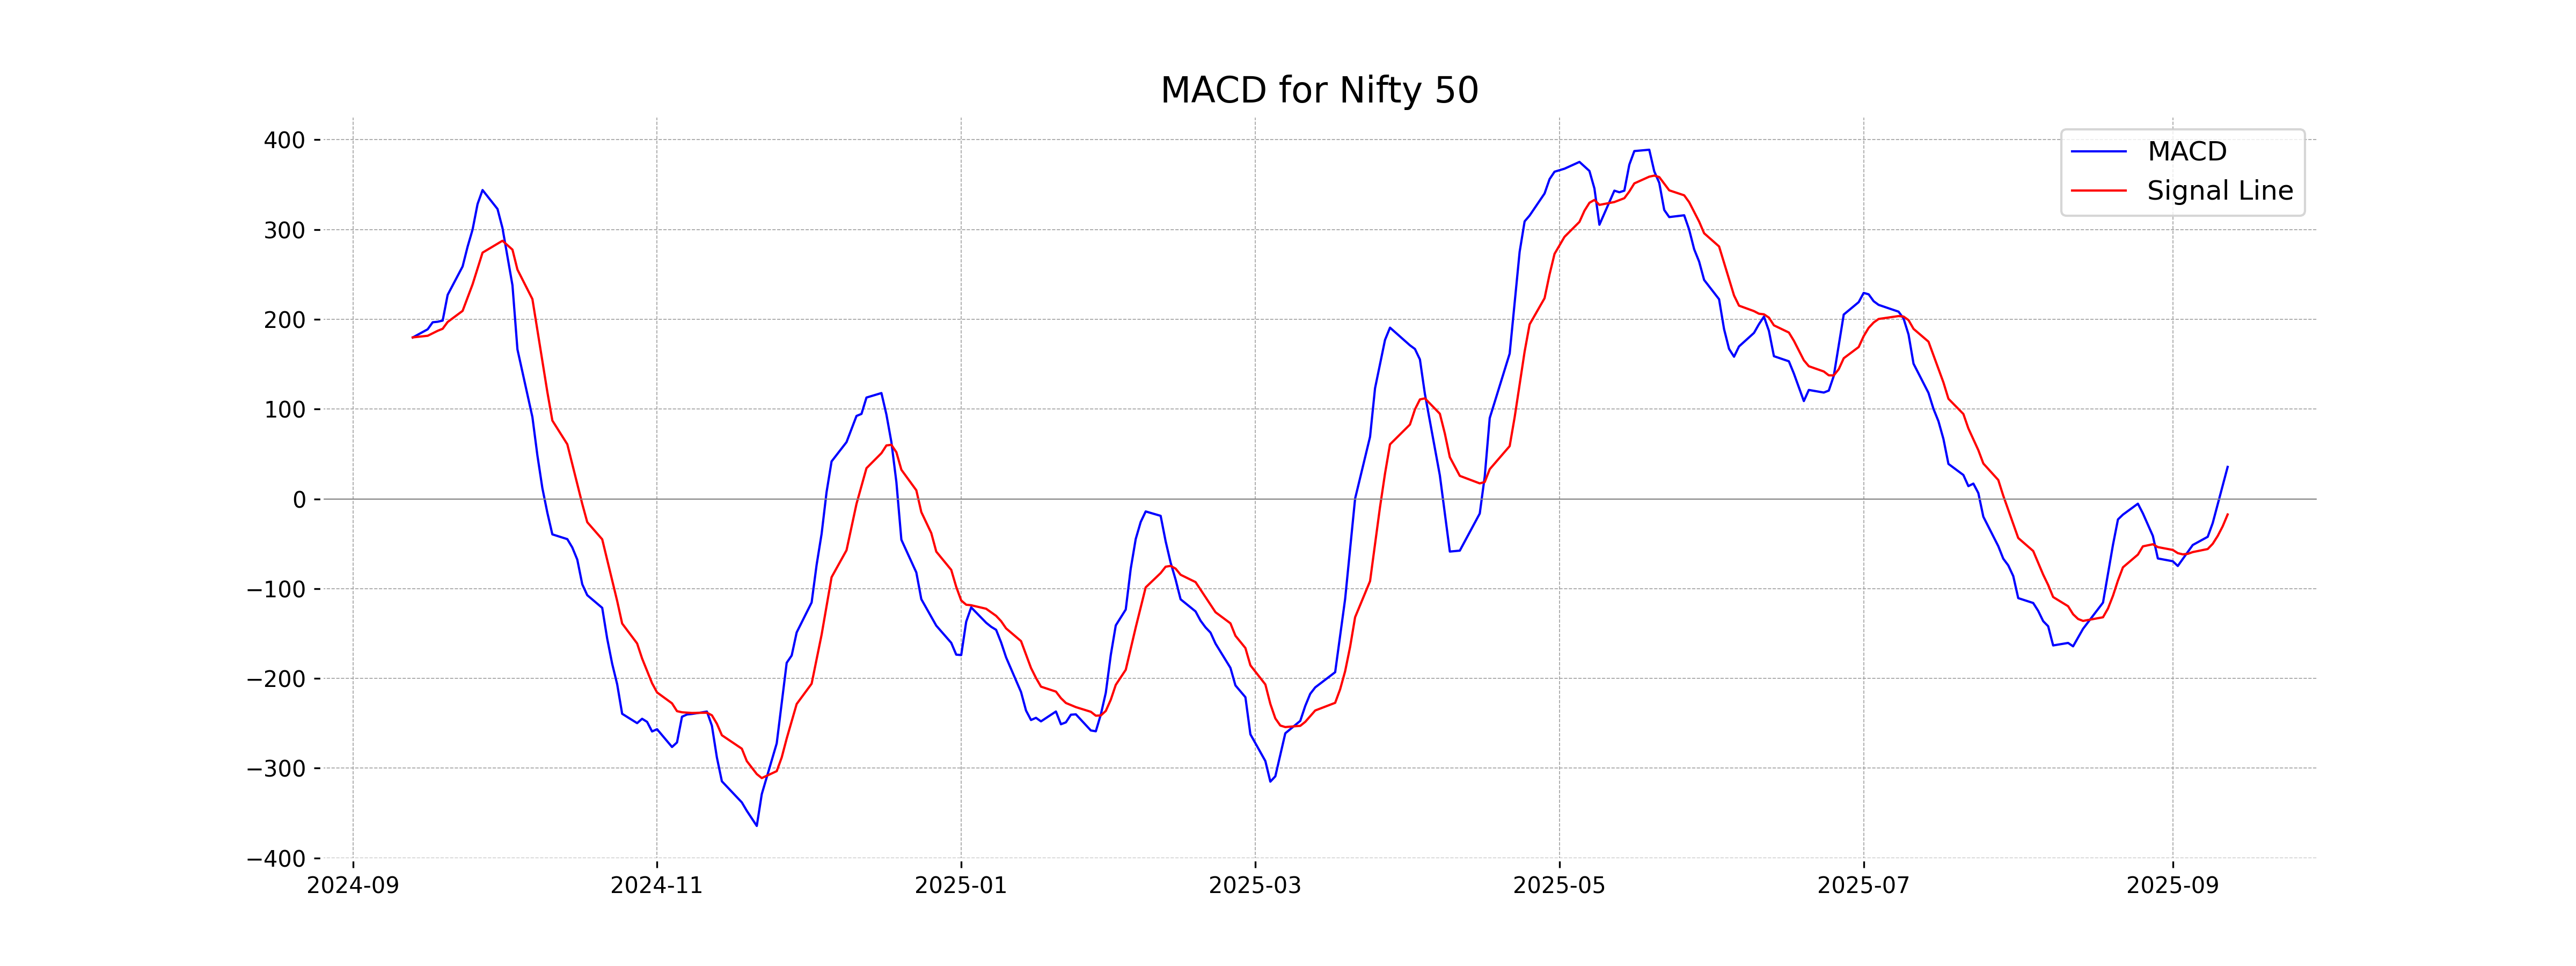
Analysis for Nifty 50 - September 12, 2025

The Nifty 50 opened at 25074.45, reached a high of 25139.45, and closed at 25114.00, showing a positive change from its previous close of 25005.50. The percentage change for the day was 0.43%, resulting in a points increase of 108.5. Technical indicators such as the RSI at 61.00 and a positive MACD are suggesting a bullish trend.
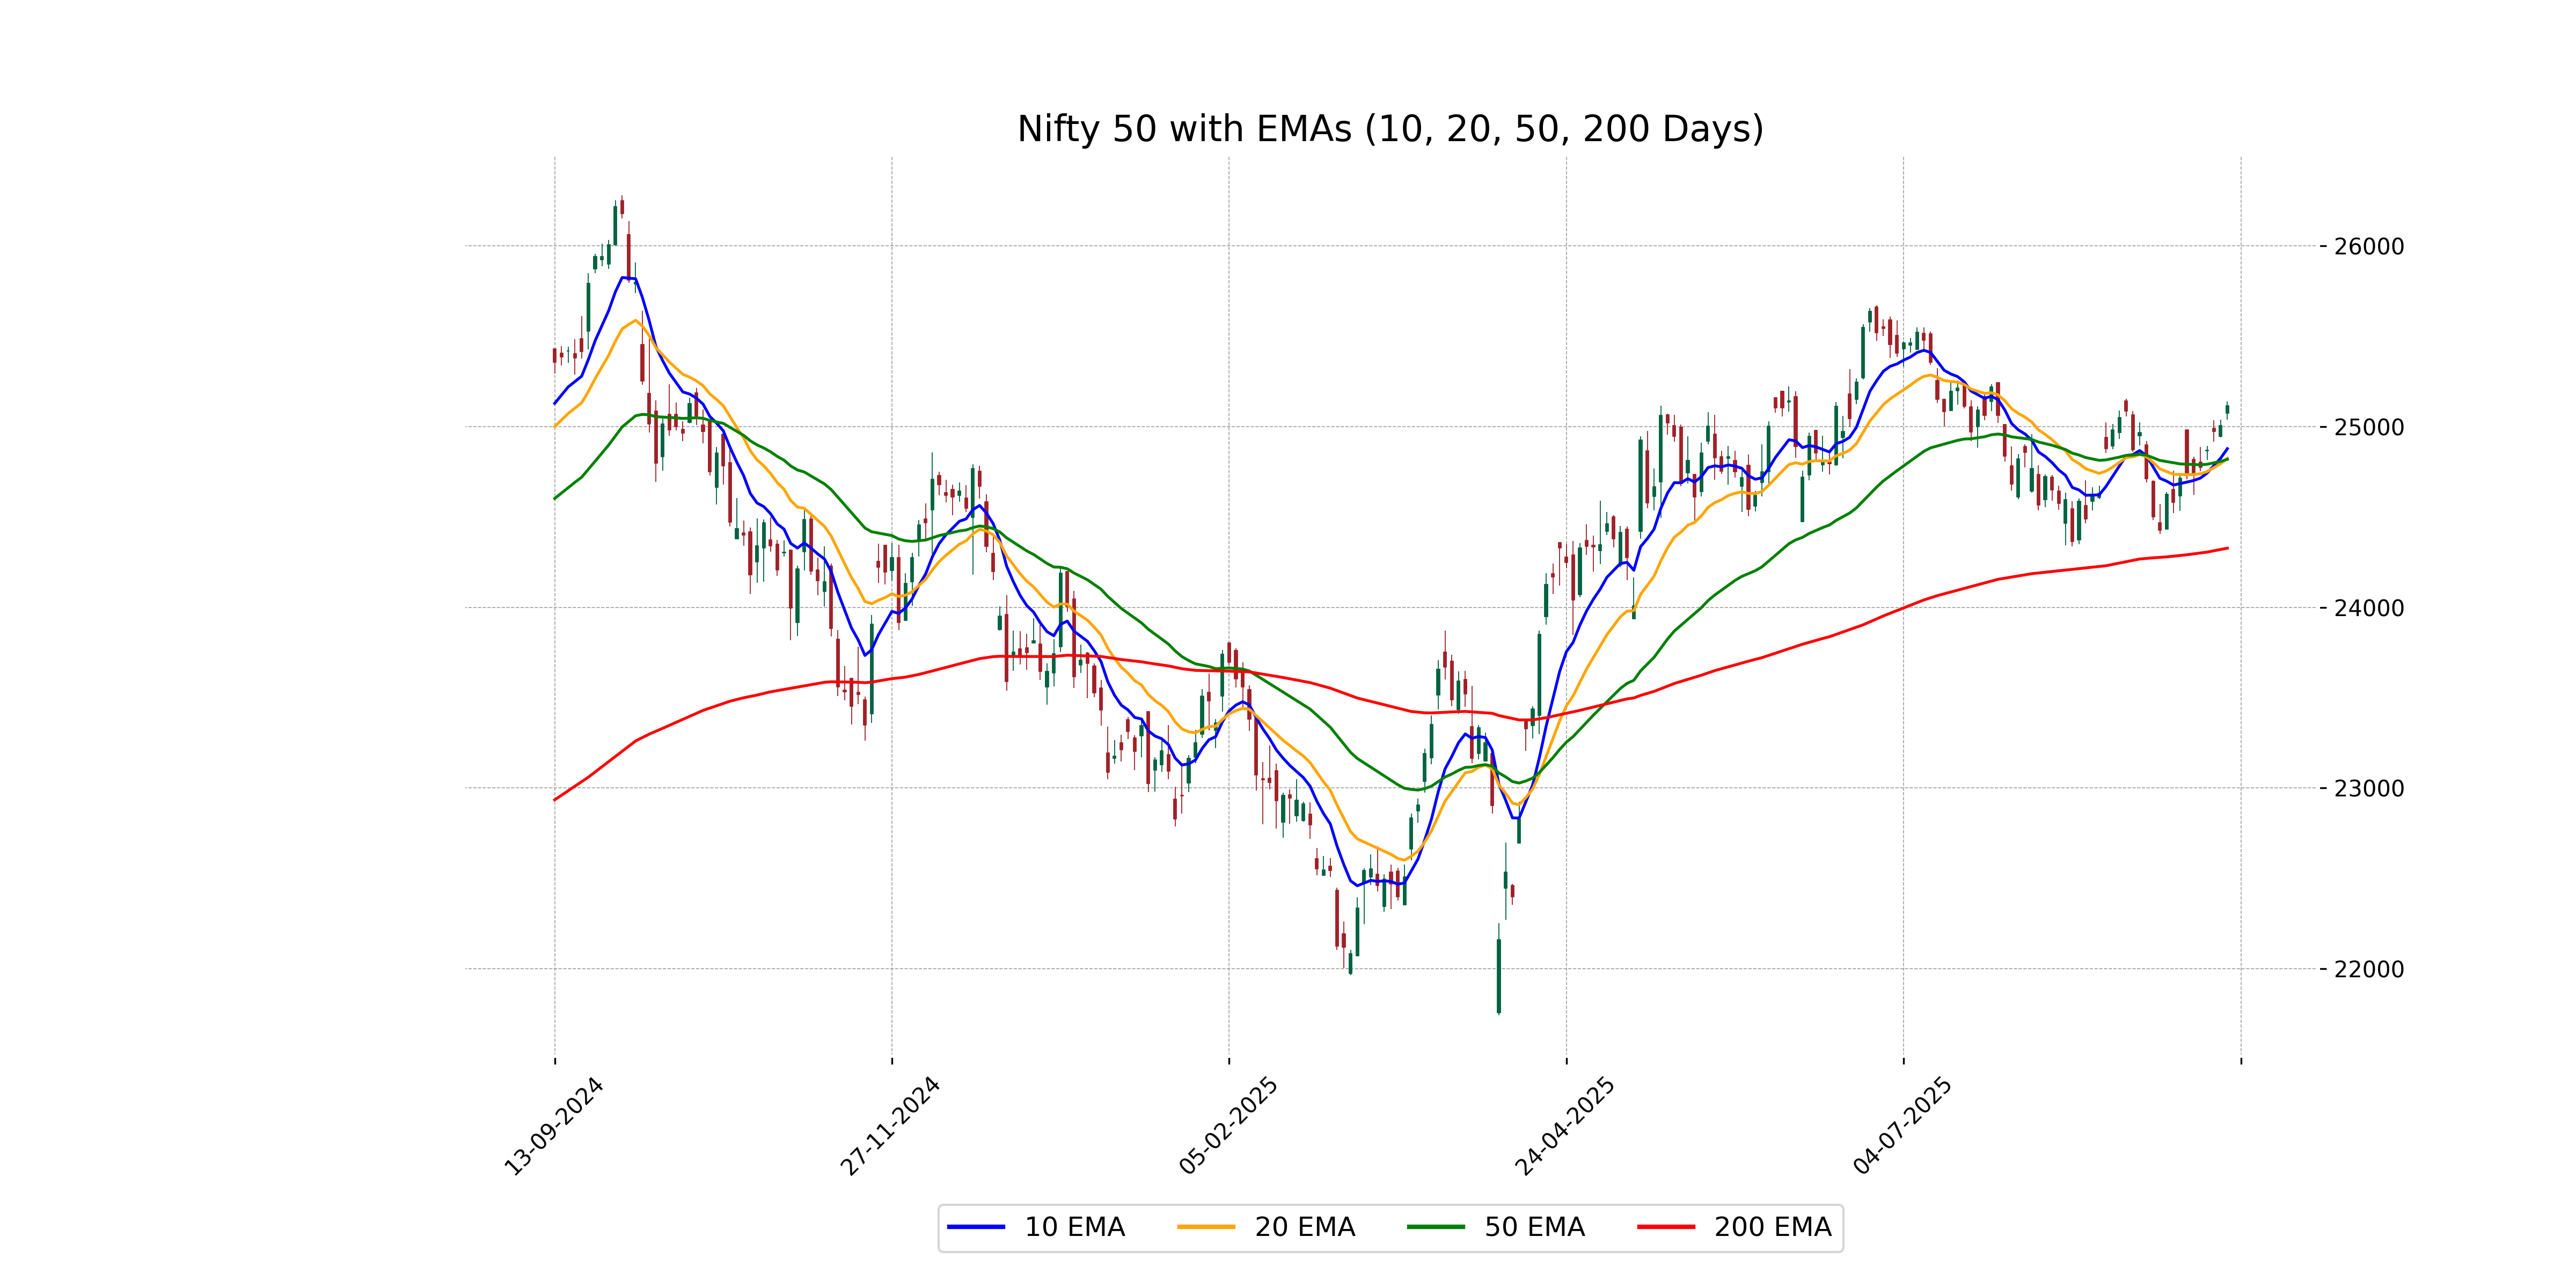
Relationship with Key Moving Averages
The current close for Nifty 50 is 25,114.0, which is above the 50-day EMA of 24,818.50 and the 200-day EMA of 24,326.78, suggesting a bullish trend. It also surpasses the 10-day and 20-day EMAs of 24,877.17 and 24,824.41, reinforcing short-term upward momentum.
Moving Averages Trend (MACD)
``` The MACD value for Nifty 50 is 35.59, which is above the signal line of -17.39. This indicates a potential bullish momentum. An increasing MACD suggests the possibility of a continued uptrend. ```
RSI Analysis
The RSI value for Nifty 50 is 61.00, which suggests that the stock is nearing an overbought condition. Typically, an RSI above 70 is considered overbought, while between 30 and 70 indicates balanced market conditions. It is important to monitor upcoming trends for potential signs of a market reversal.
