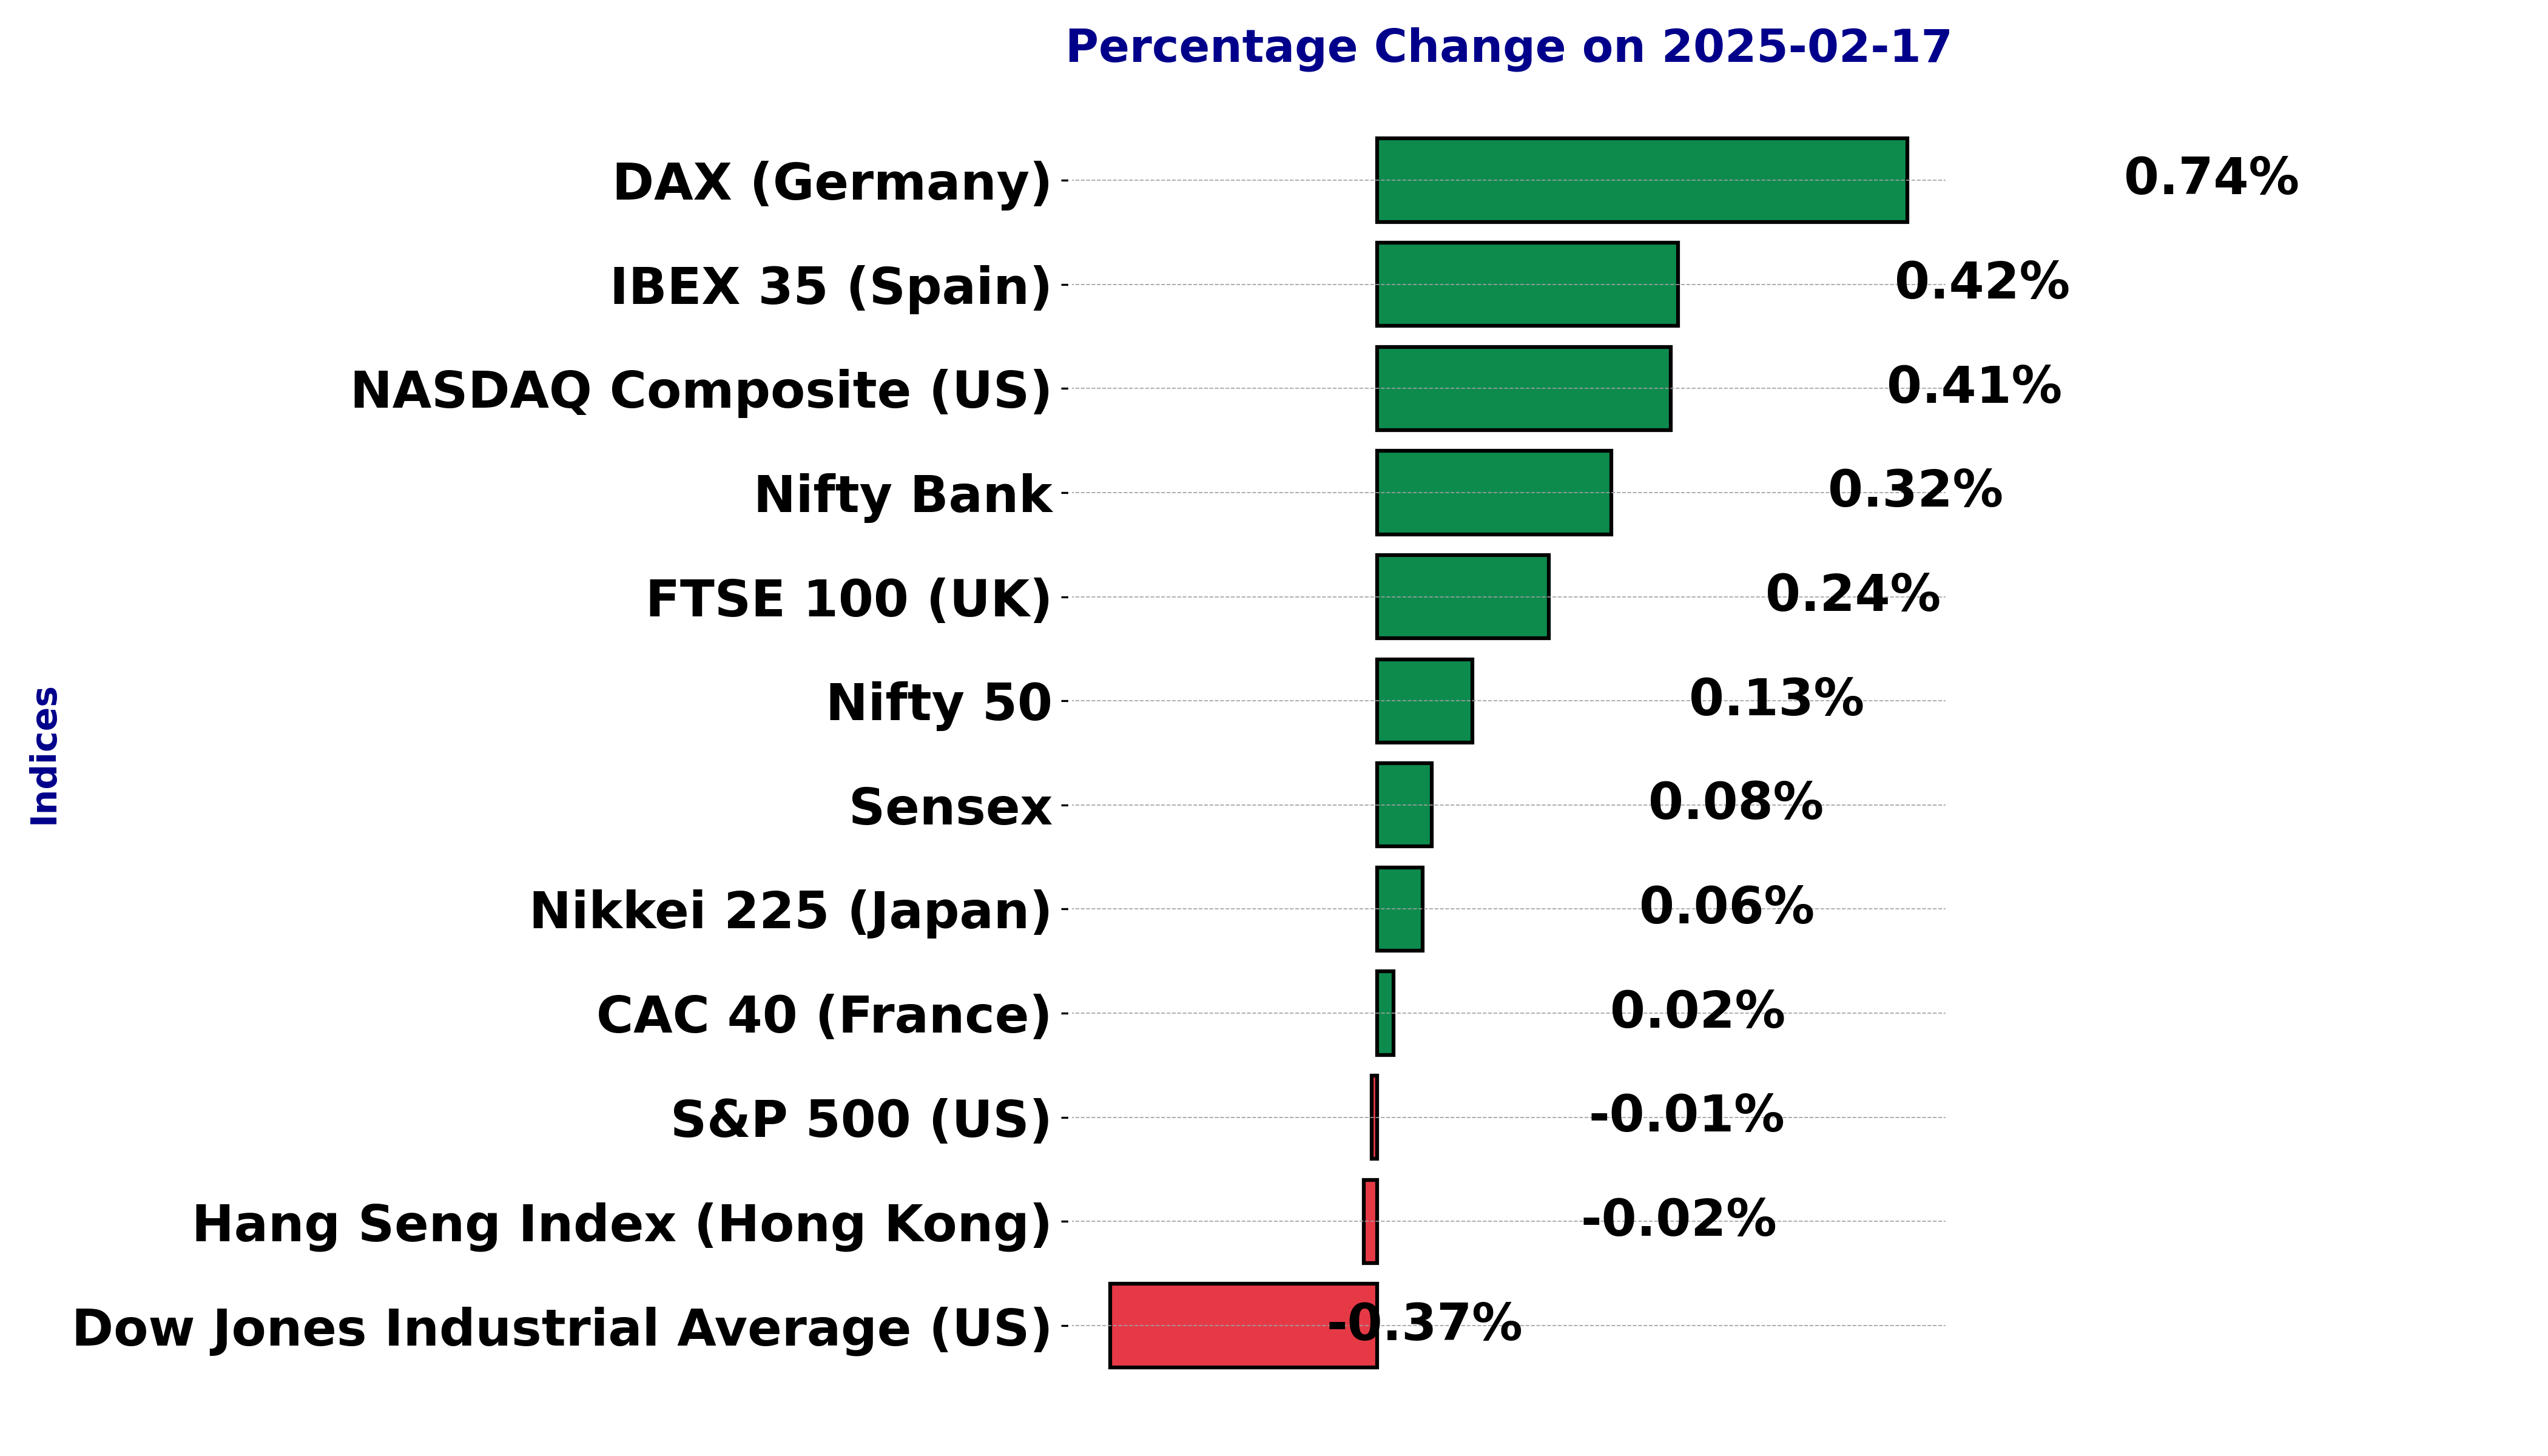
Indian stock market sector-wise performance today - February 17, 2025
The stock market witnessed a mixed performance across different sectors and indices, reflecting a day of varied market movements.
Among the notable indices, the Sensex showcased a slight uptick, closing 0.08% higher. This marginal increment indicates a stable yet cautious sentiment in the broader market.
The Auto index faced a challenging session, experiencing a decline of 0.53%. This dip highlights some level of sluggishness, potentially due to external pressures such as supply chain disruptions or demand fluctuations.
Conversely, the Energy index recorded a positive 0.54% change, suggesting investor confidence buoyed by rising energy demands or favorable commodity prices. In contrast, the FMCG index saw a downturn, with a decrease of 0.36%.
This downward trend could be attributed to profit-booking or a shift in consumer preferences affecting sales forecasts. The Infra sector, on the other hand, managed a modest gain of 0.18%, indicative of steady infrastructure investments continuing to support economic growth.
The IT index dropped by 0.58%, perhaps reflecting investor concerns over the technology sector's valuation or global cues impacting tech shares. Meanwhile, the Metal index climbed by a notable 0.77%, driven by robust industrial demand or favorable pricing in the metal commodities market.
The Banking index recorded a rise of 0.32%, which could be a result of positive developments within the banking sector or supportive regulatory announcements.
Lastly, the Nifty index experienced a modest increase of 0.13%, rounding out a day of mixed performances. The most significant movement came from the Metal sector, with a substantial rise of 0.77%.
This surge suggests strong demand and possibly insider confidence in the sector’s growth prospects. Market analysts may attribute this to increased infrastructure projects and global recovery prospects bolstering demand for metals.
Overall, the market's mixed performance indicates diverse sector-specific factors at play, highlighting the importance of staying informed on each sector's dynamics to understand broader market trends.
Analysis for Sensex - February 17, 2025
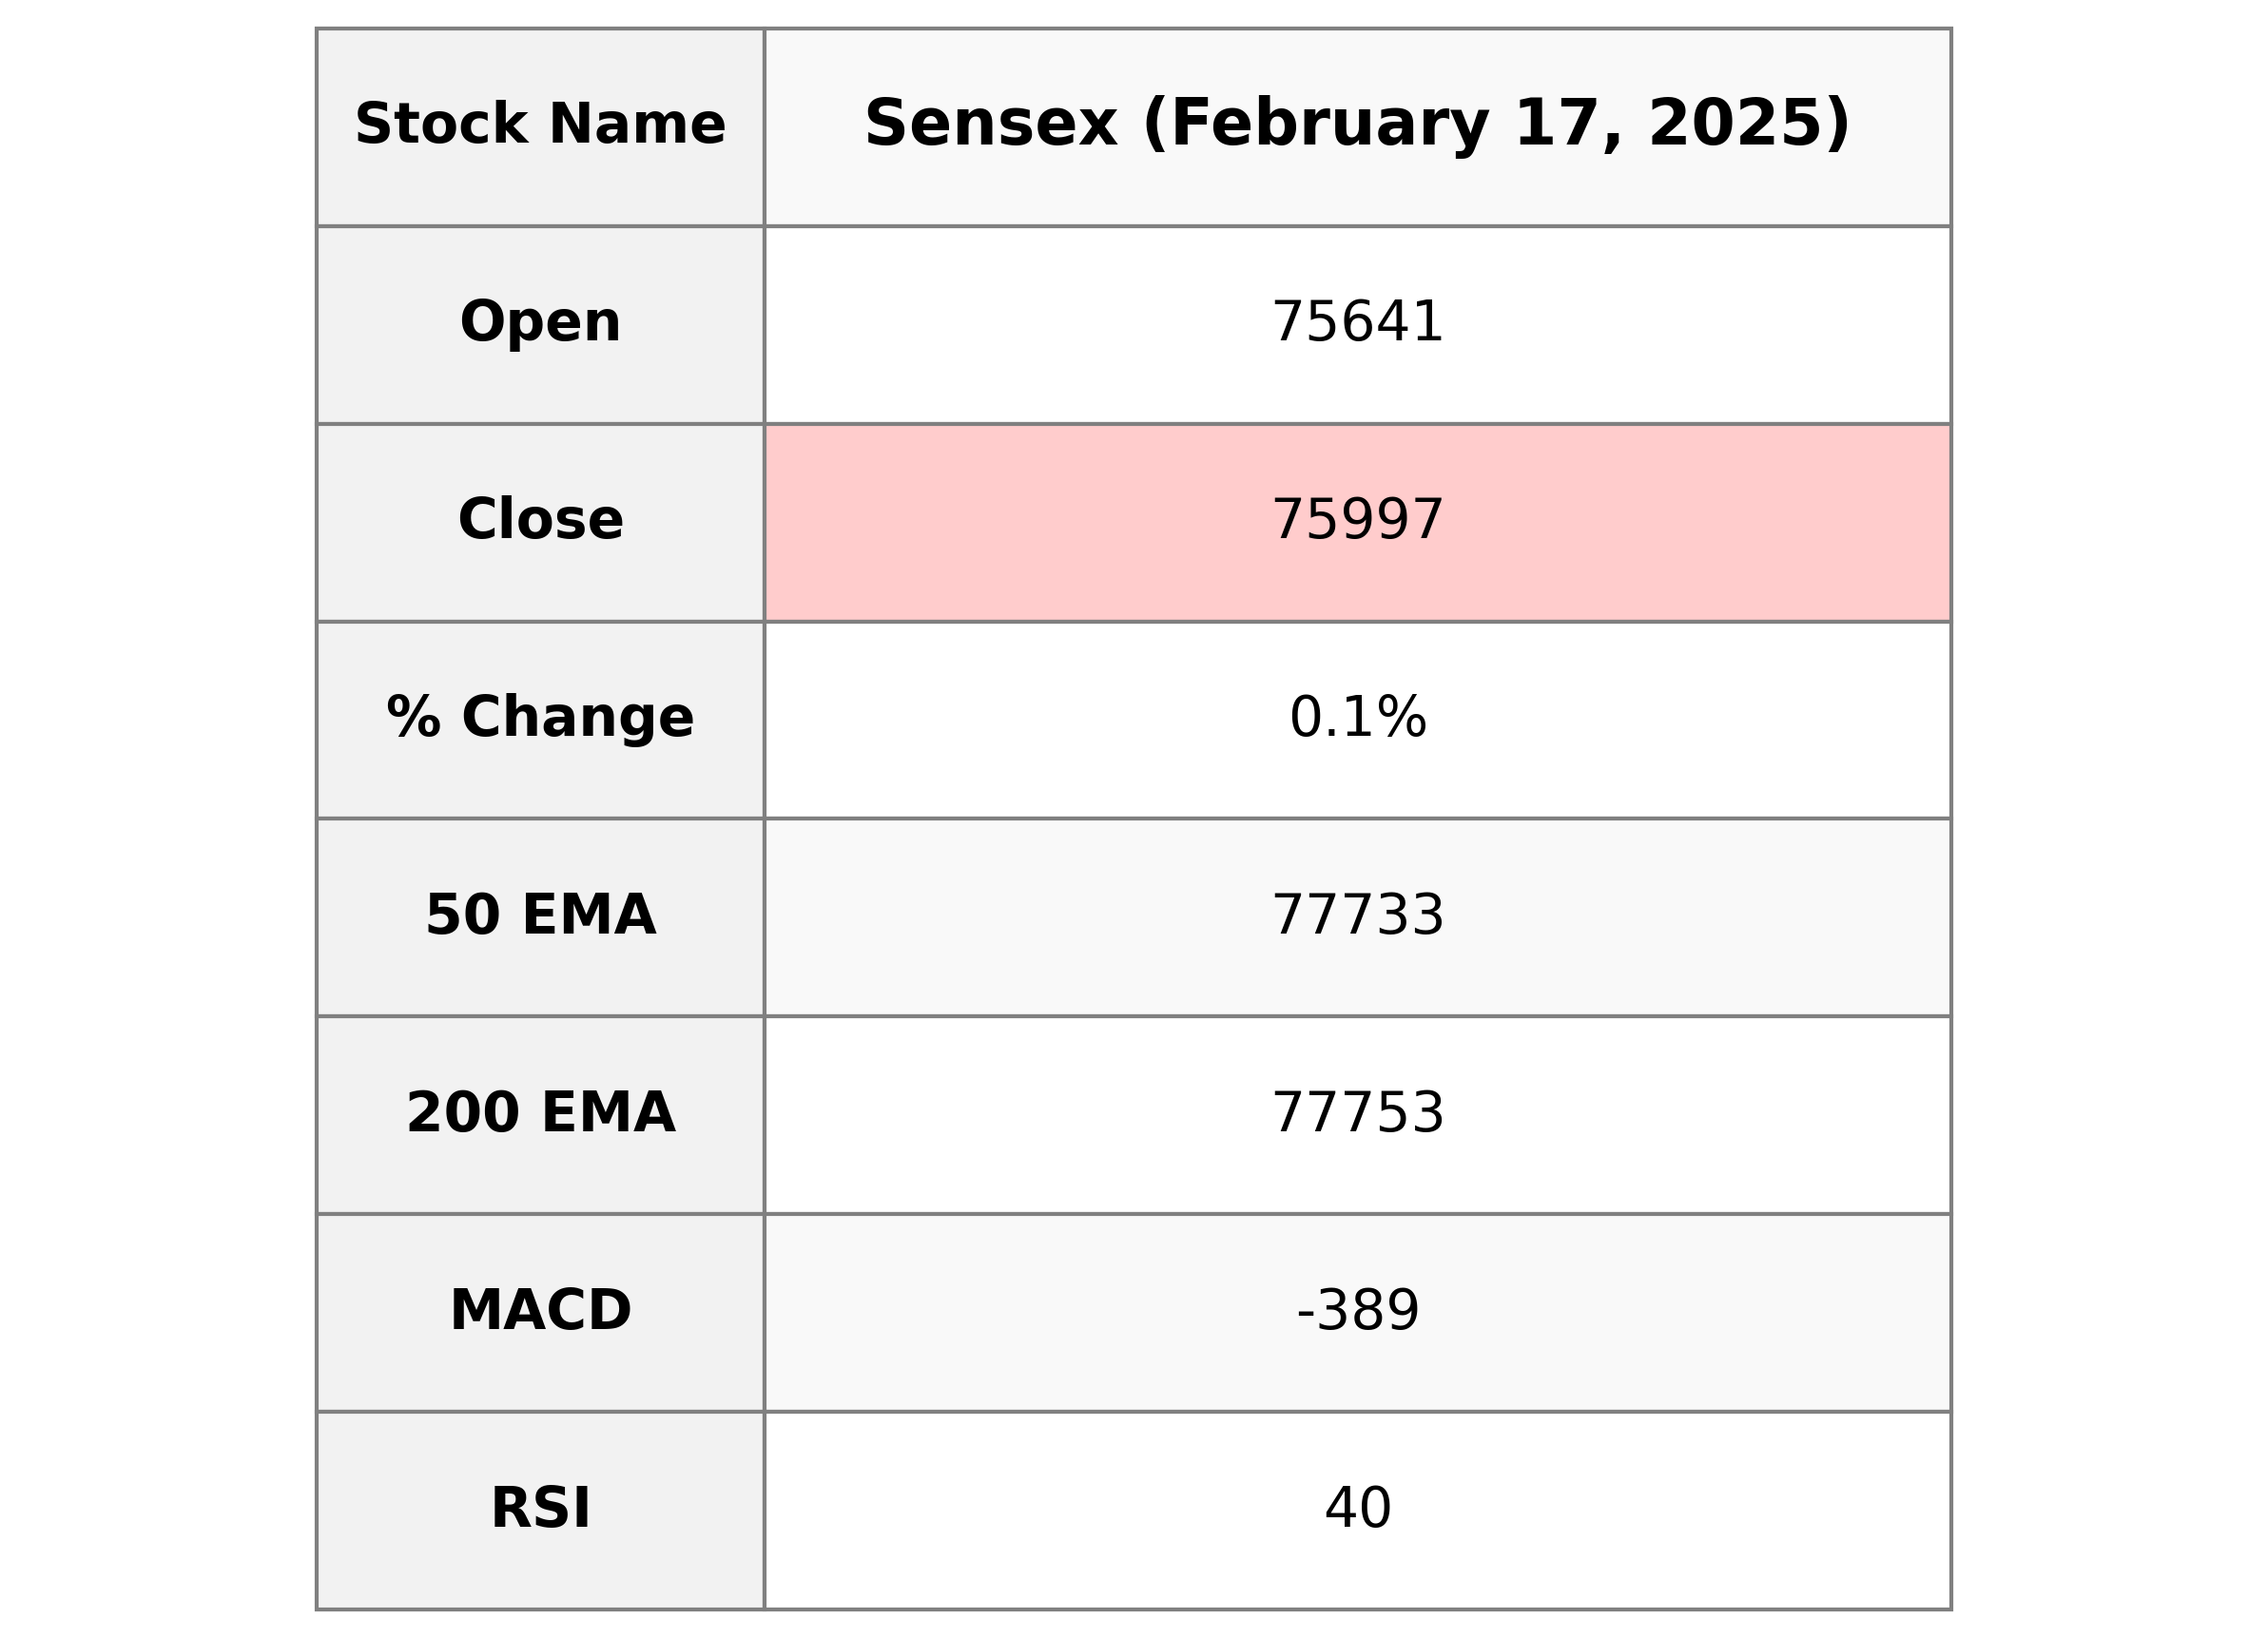
**Sensex Performance Description:** The Sensex opened at 75,641.41 and closed at 75,996.86, with a modest gain, resulting in a 0.08% change from the previous close. The day's trading saw a high of 76,041.96 and a low of 75,294.76. Technical indicators reveal that the RSI is at 40.31, suggesting weaker momentum, while the MACD shows a negative divergence from the signal line.
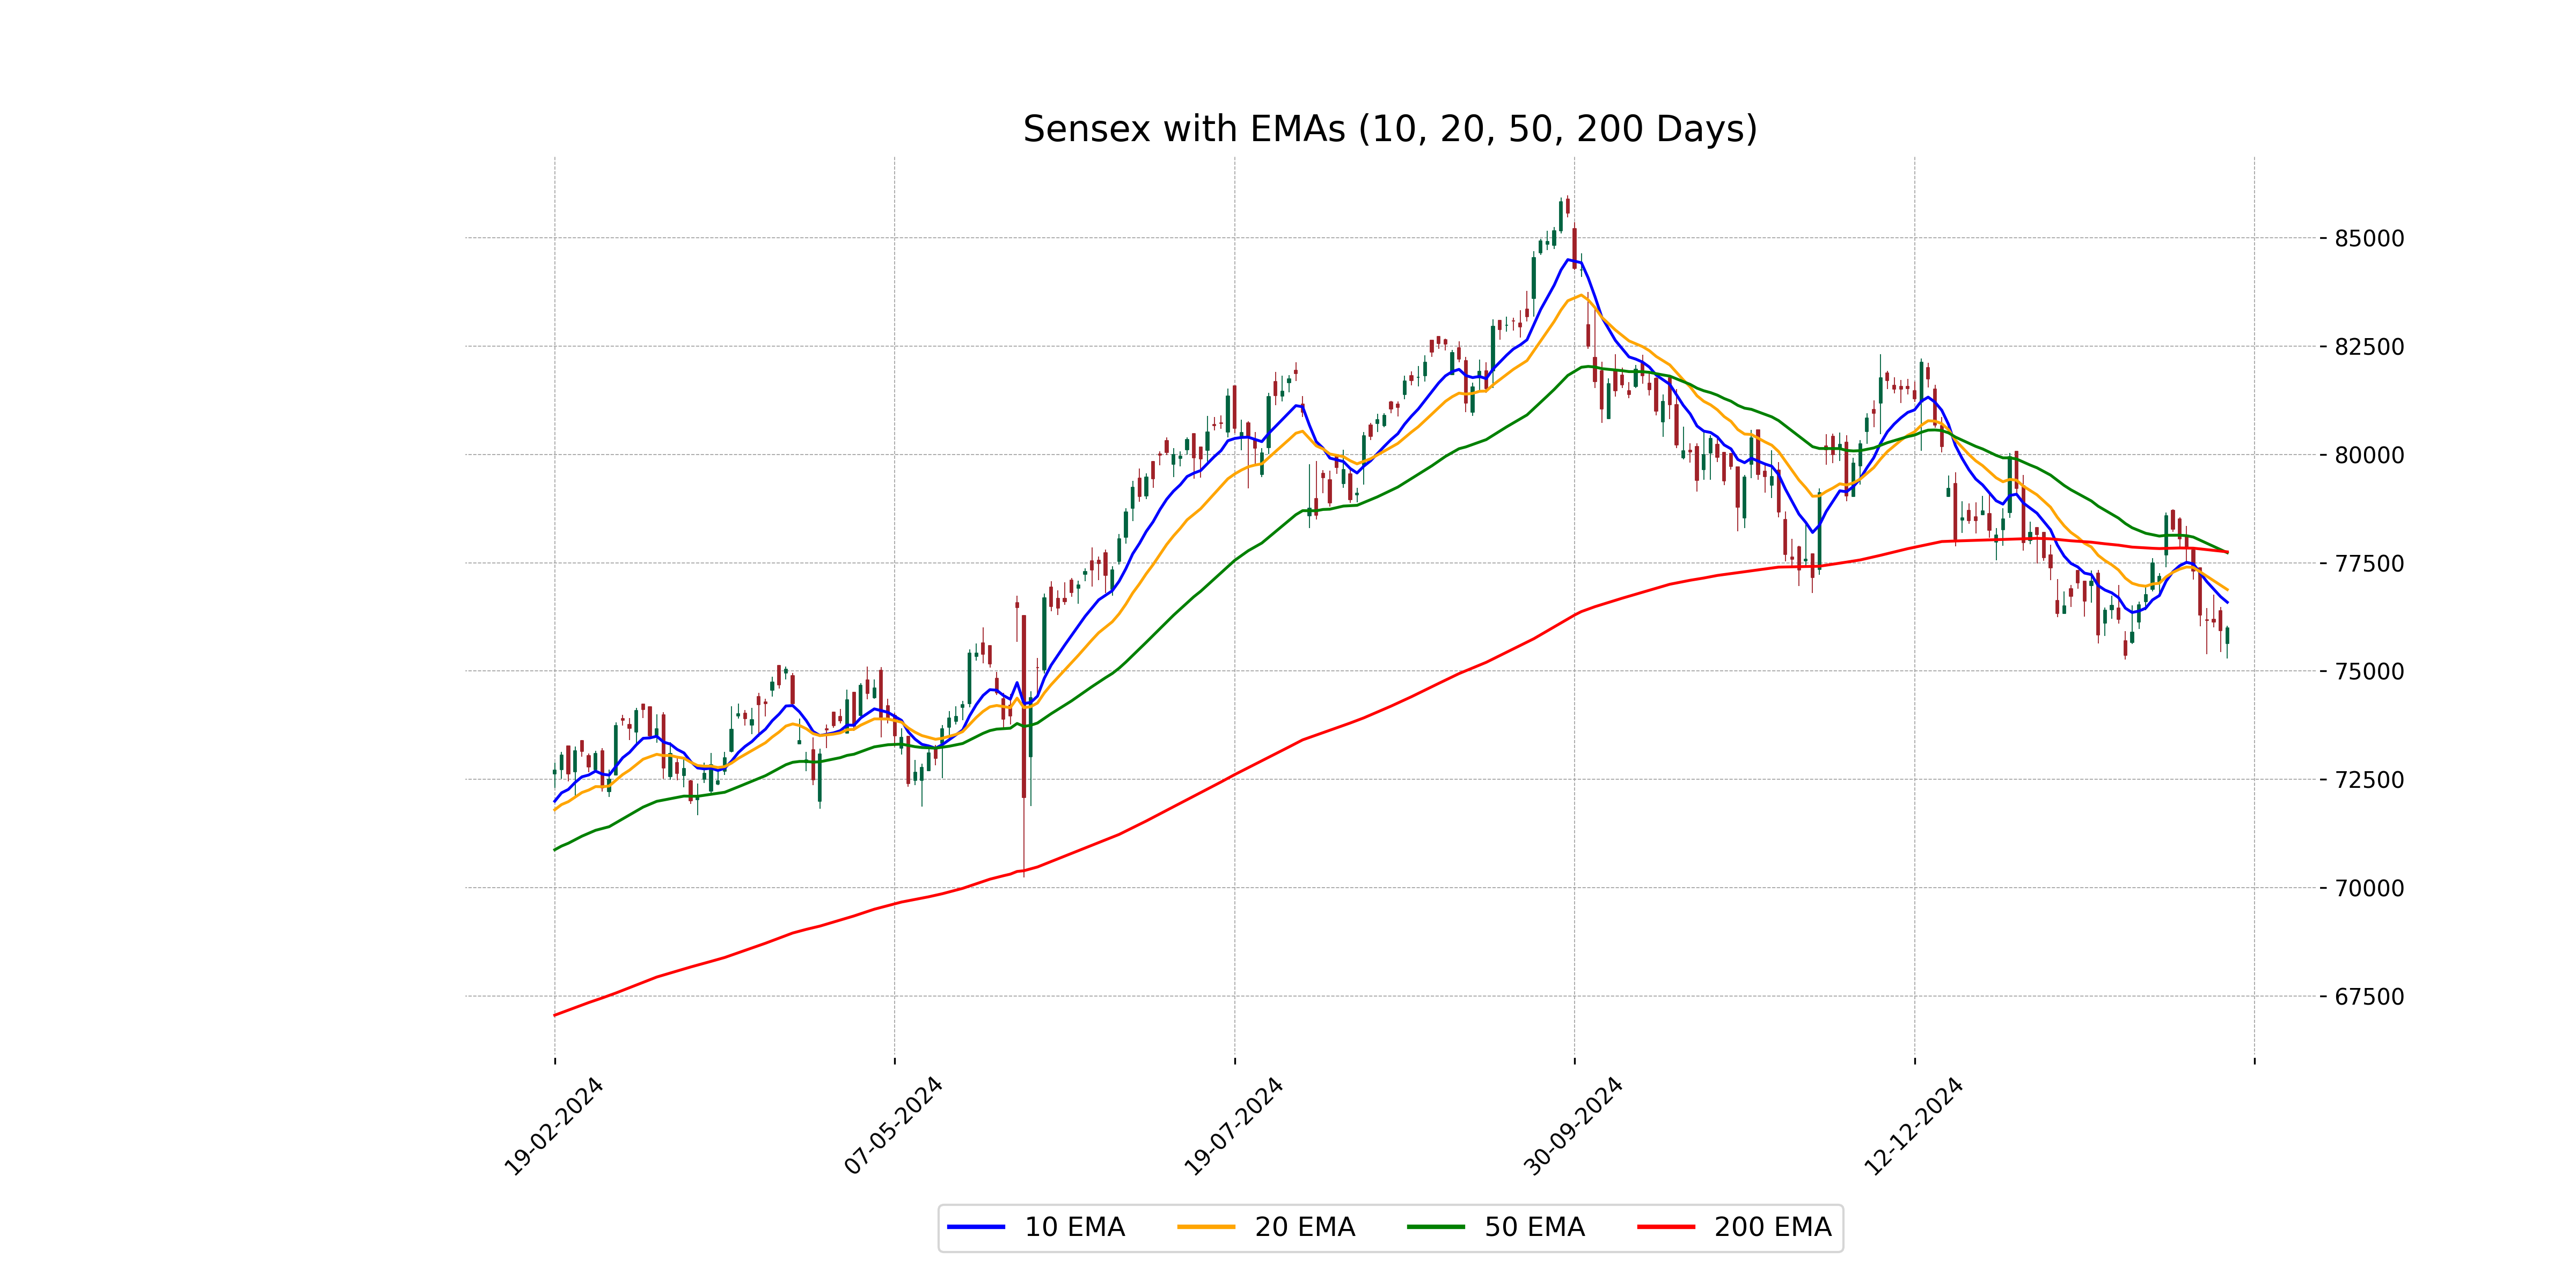
Relationship with Key Moving Averages
The Sensex closed at 75,996.86, which is below its 50 EMA (77,732.96) and 200 EMA (77,753.09), indicating potential bearish momentum. It is, however, above the 10 EMA (76,588.99) and 20 EMA (76,881.21), suggesting short-term positive movement in an overall downtrend.
Moving Averages Trend (MACD)
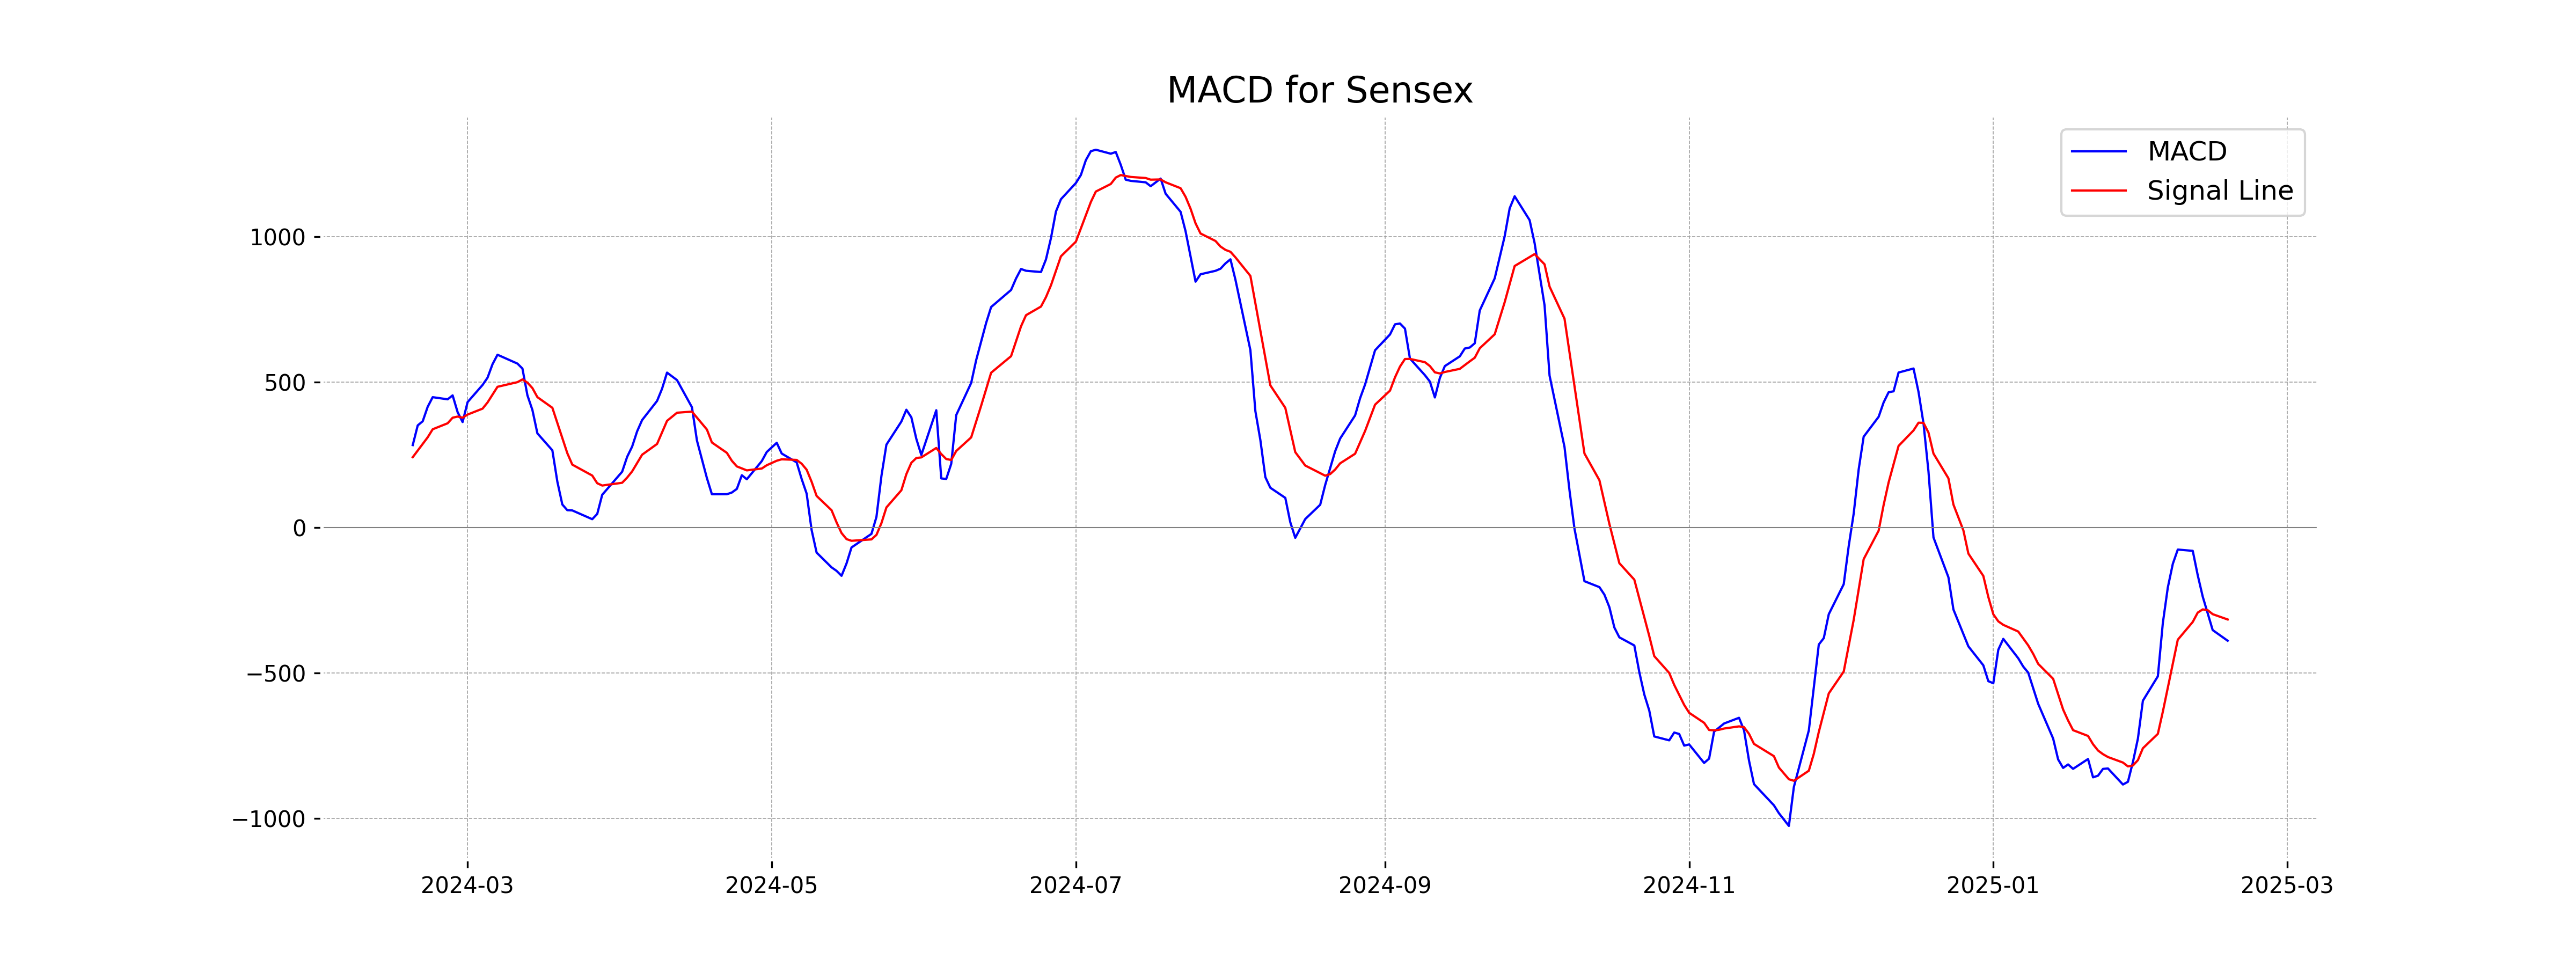
Based on the data, the Sensex's MACD value is -389.03, which is below its MACD Signal line at -316.05. This suggests a bearish trend, indicating potential downward momentum.
RSI Analysis
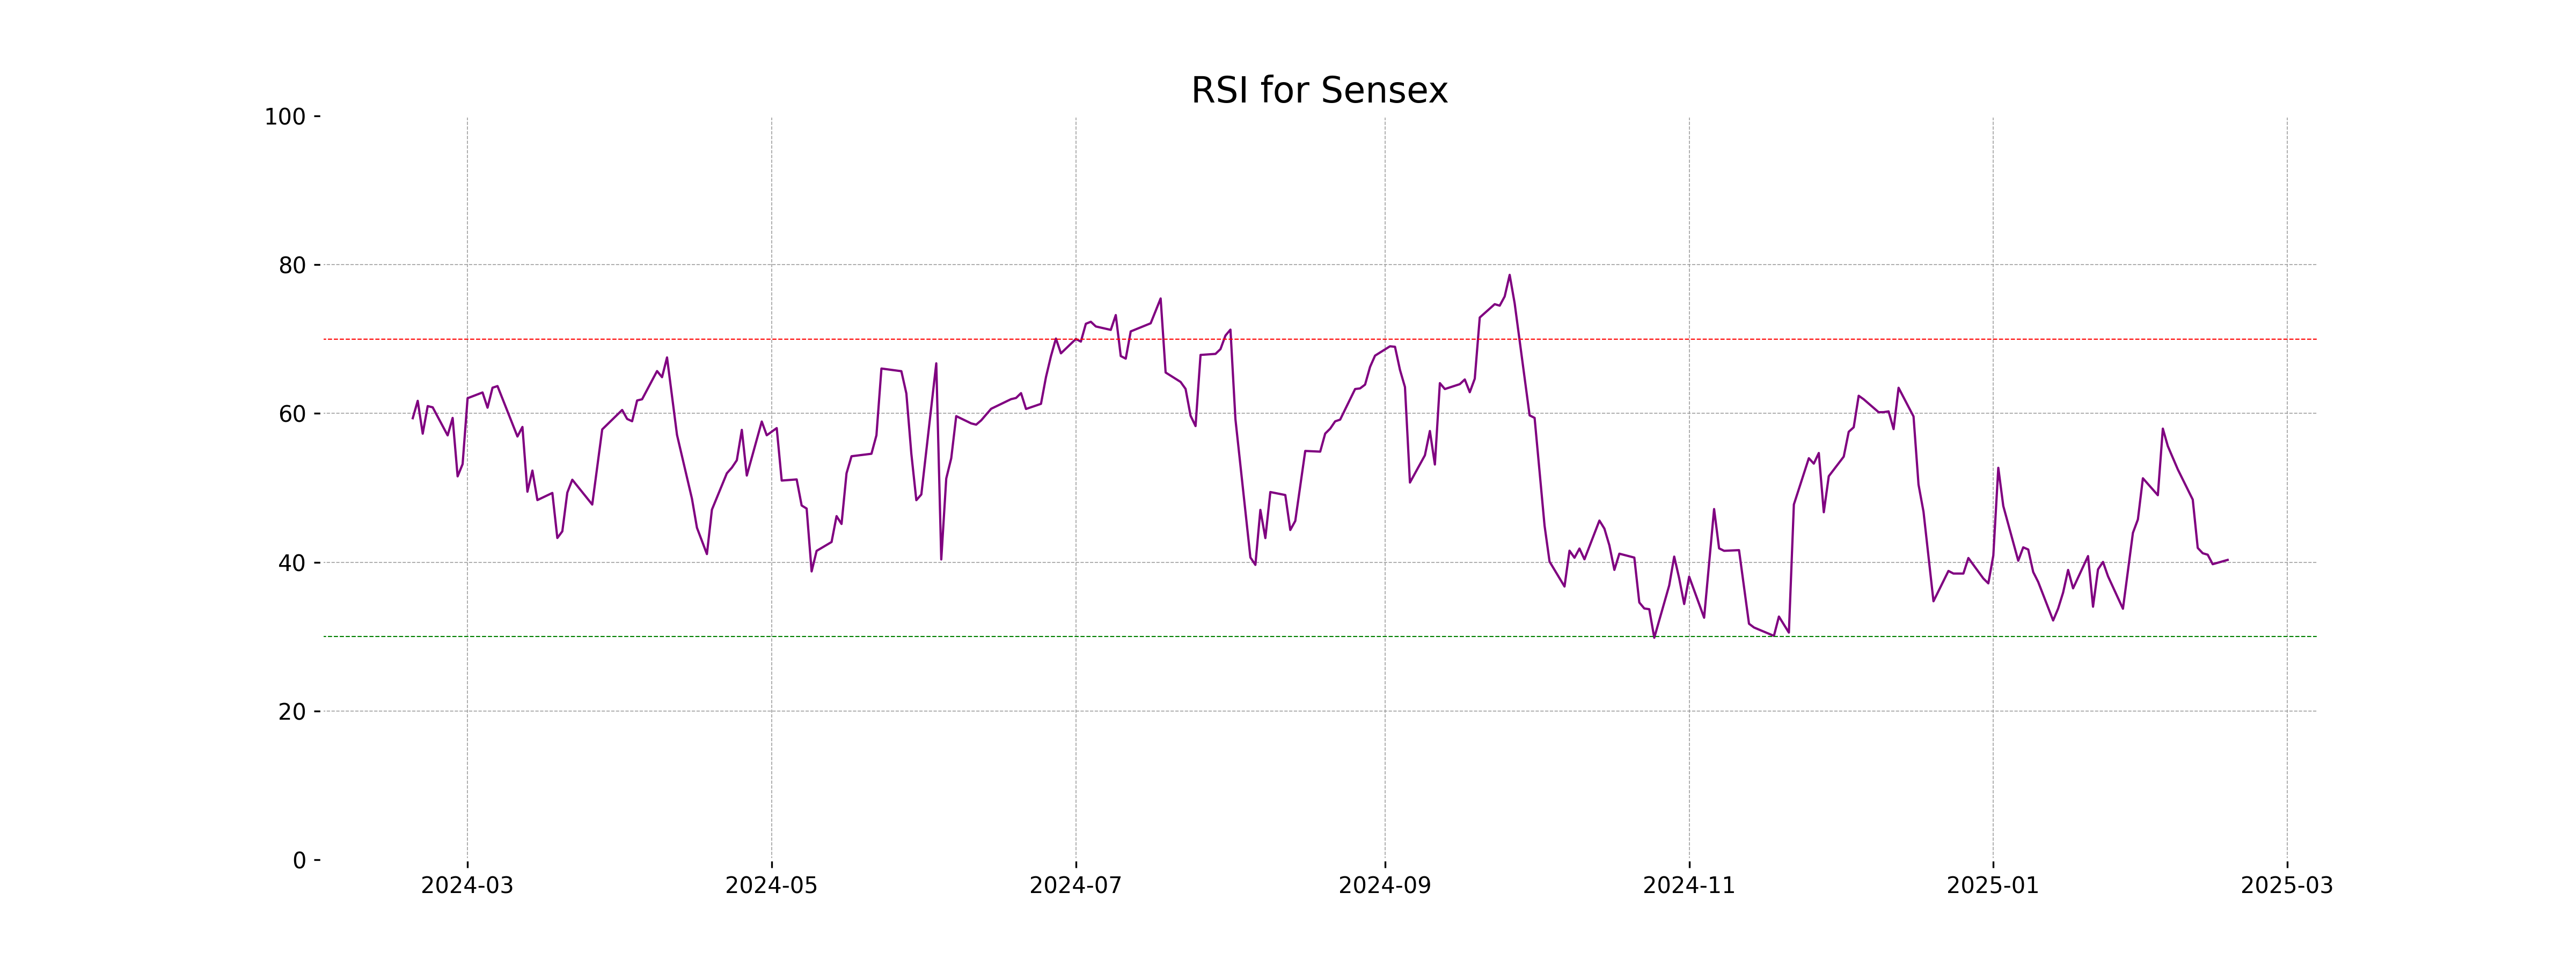
The current RSI value for Sensex is 40.31, which places it in the neutral to slightly oversold territory. This suggests that the index is neither overbought nor oversold, but closer to being potentially oversold, which might indicate a buying opportunity if other factors support.
Analysis for Nifty Auto - February 17, 2025
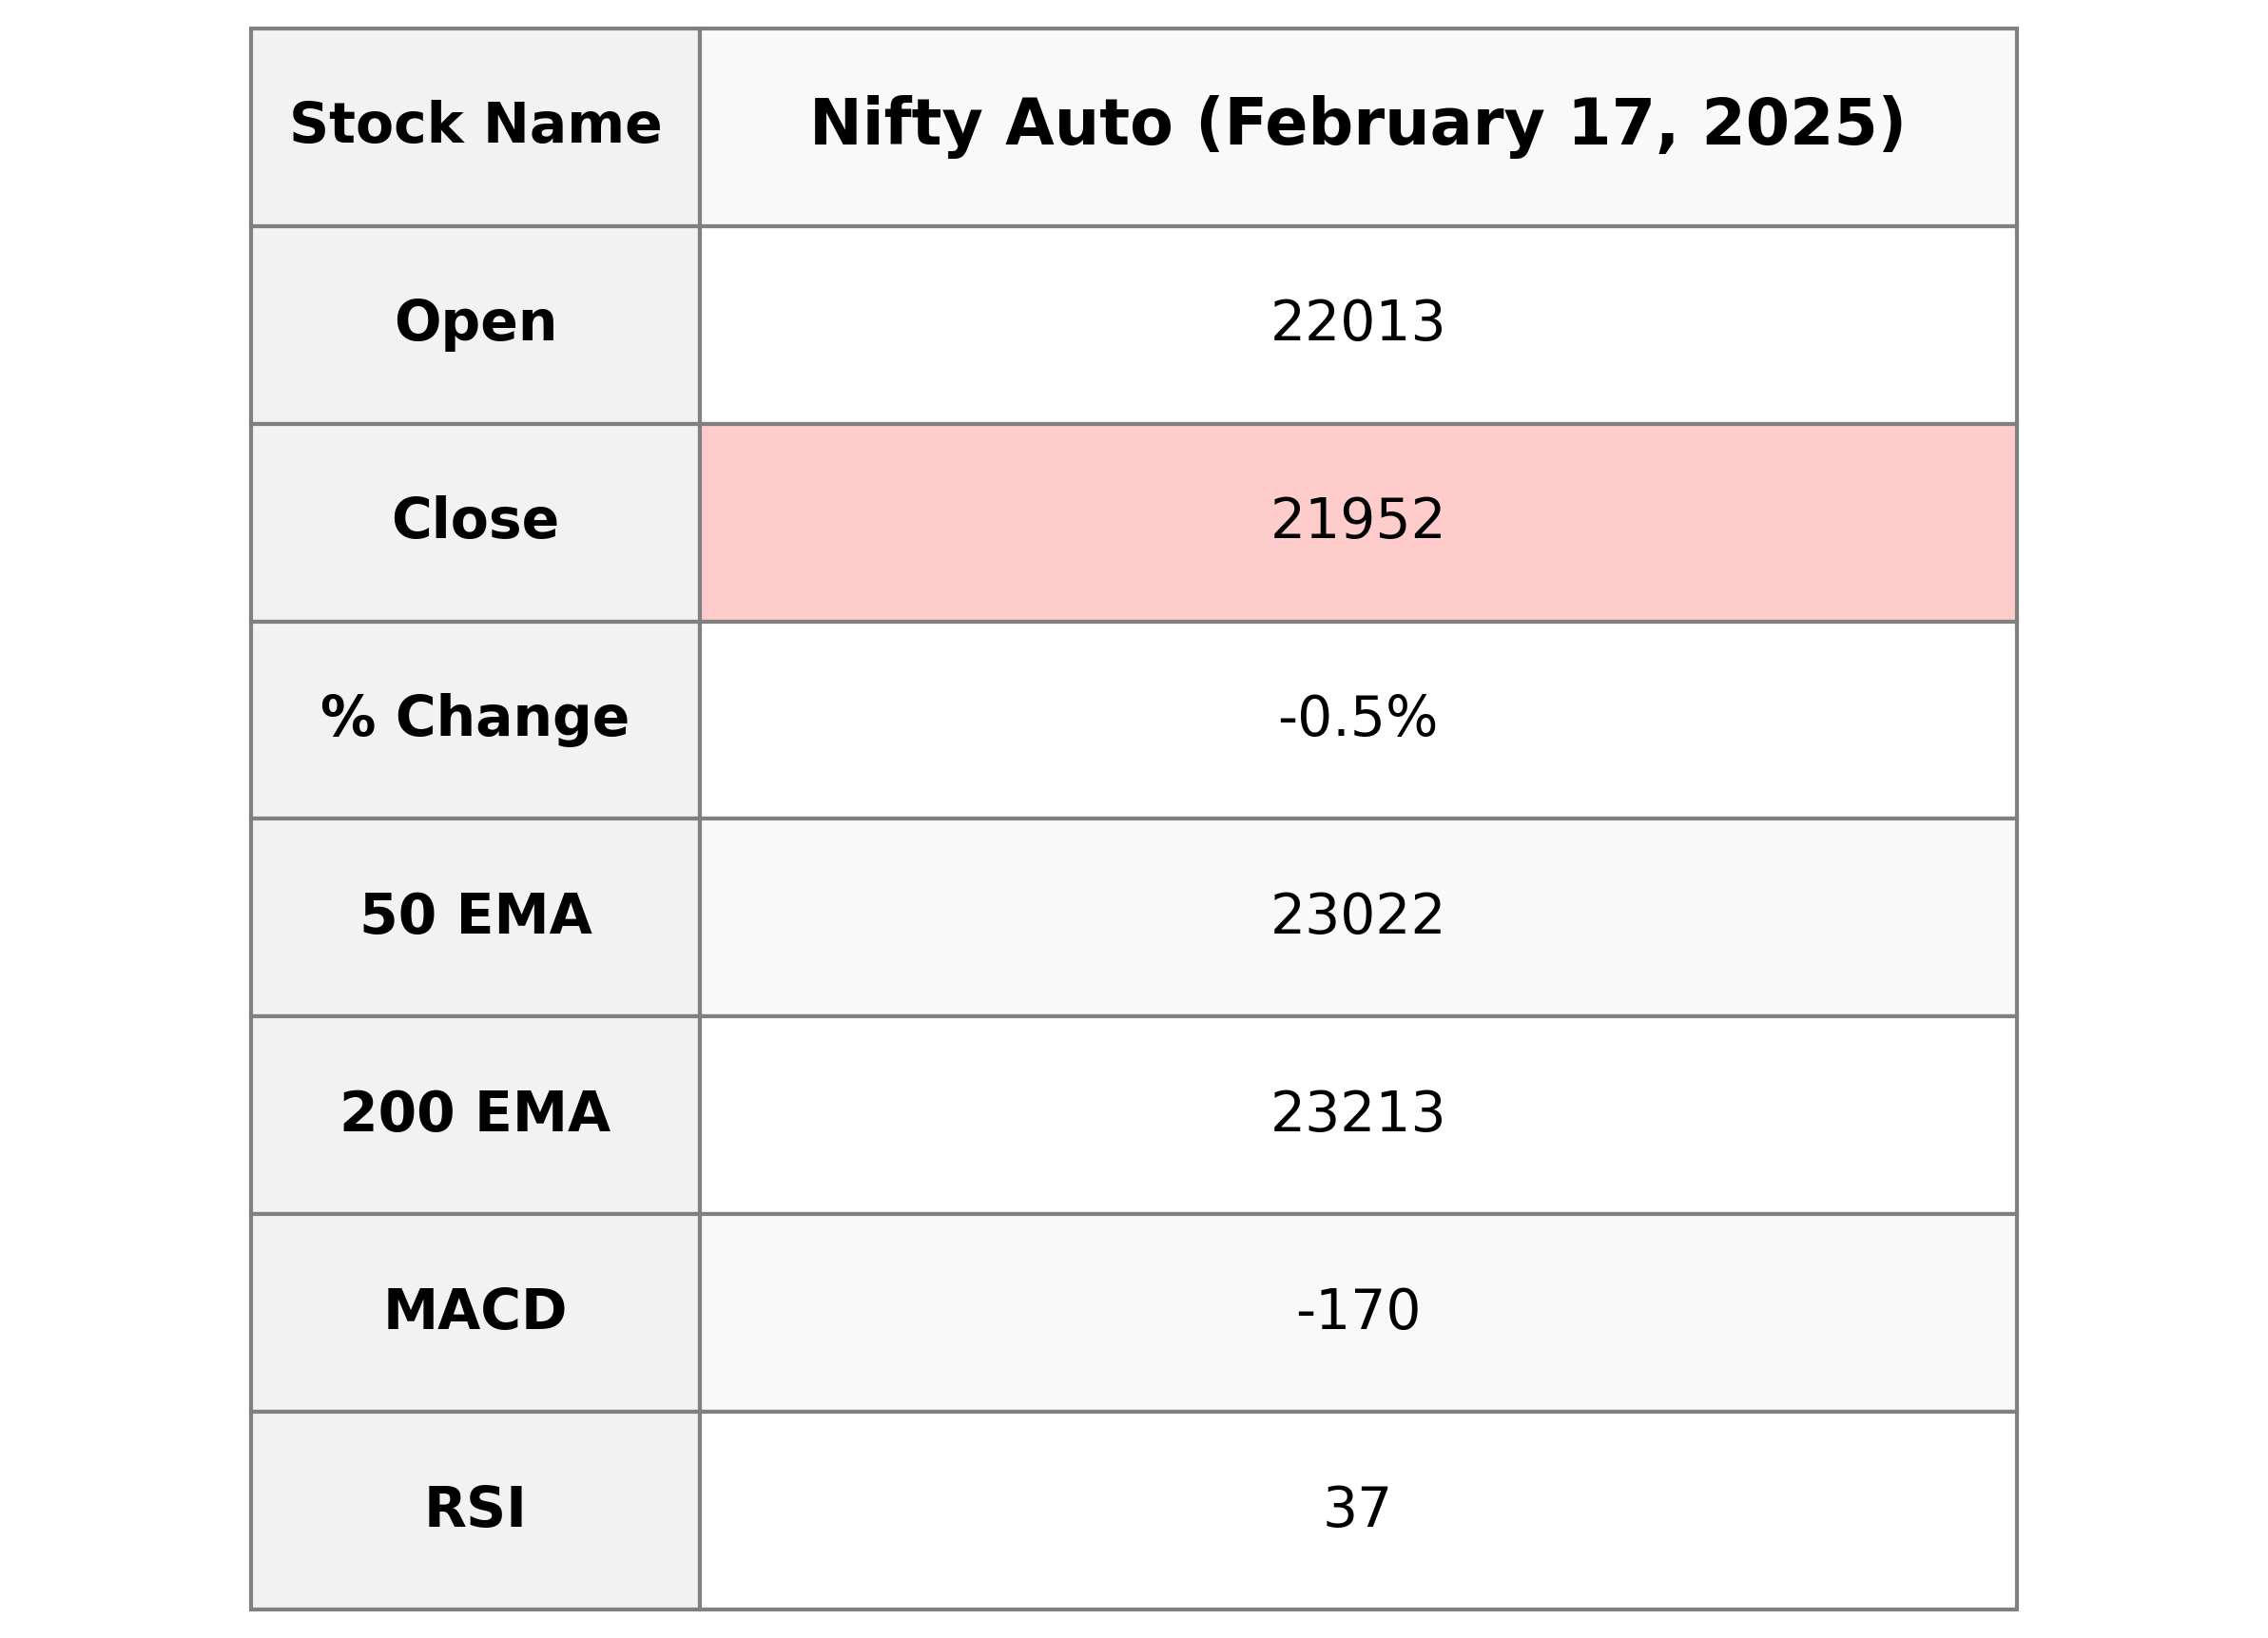
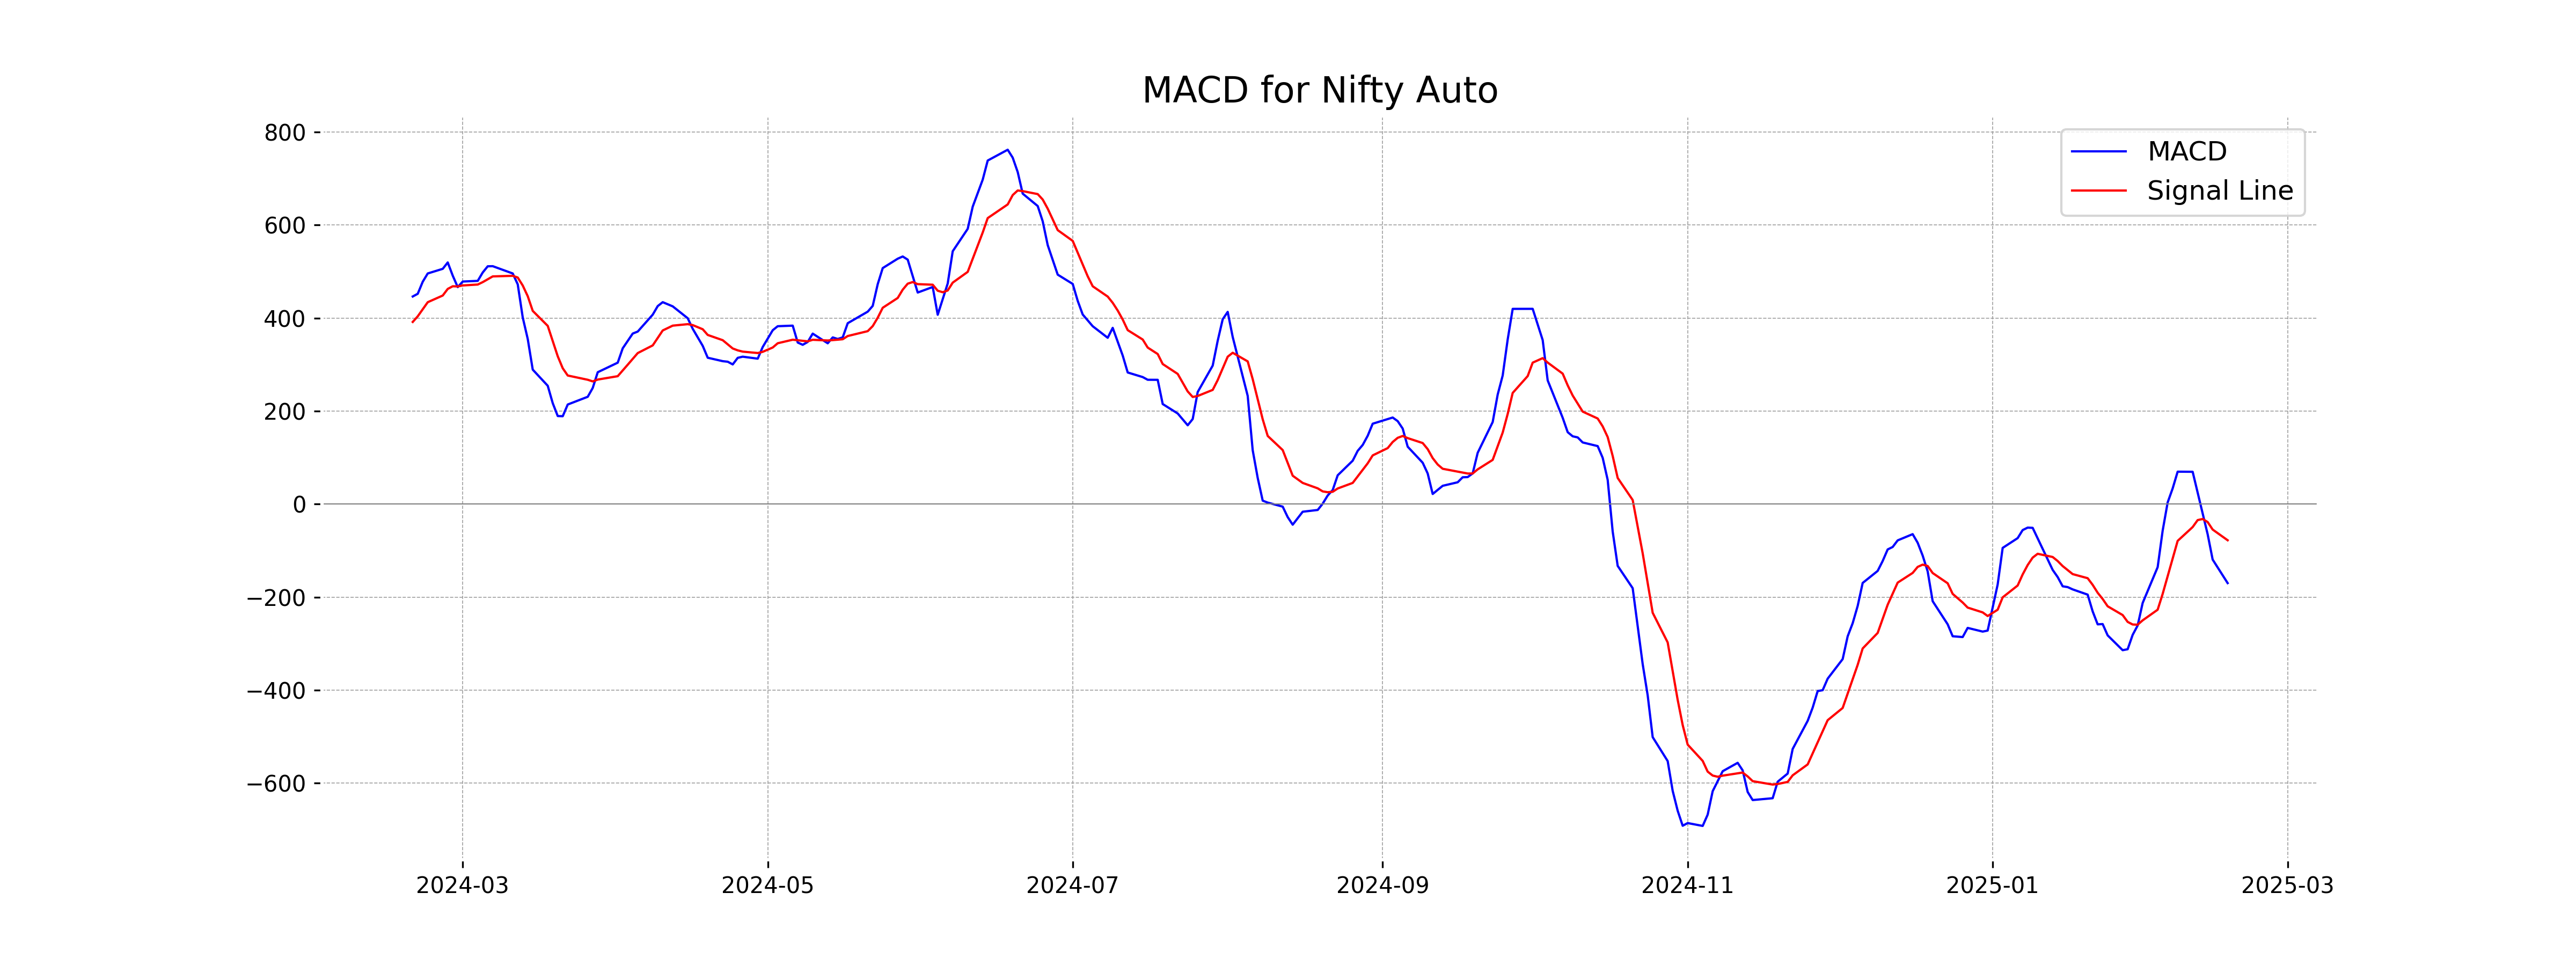
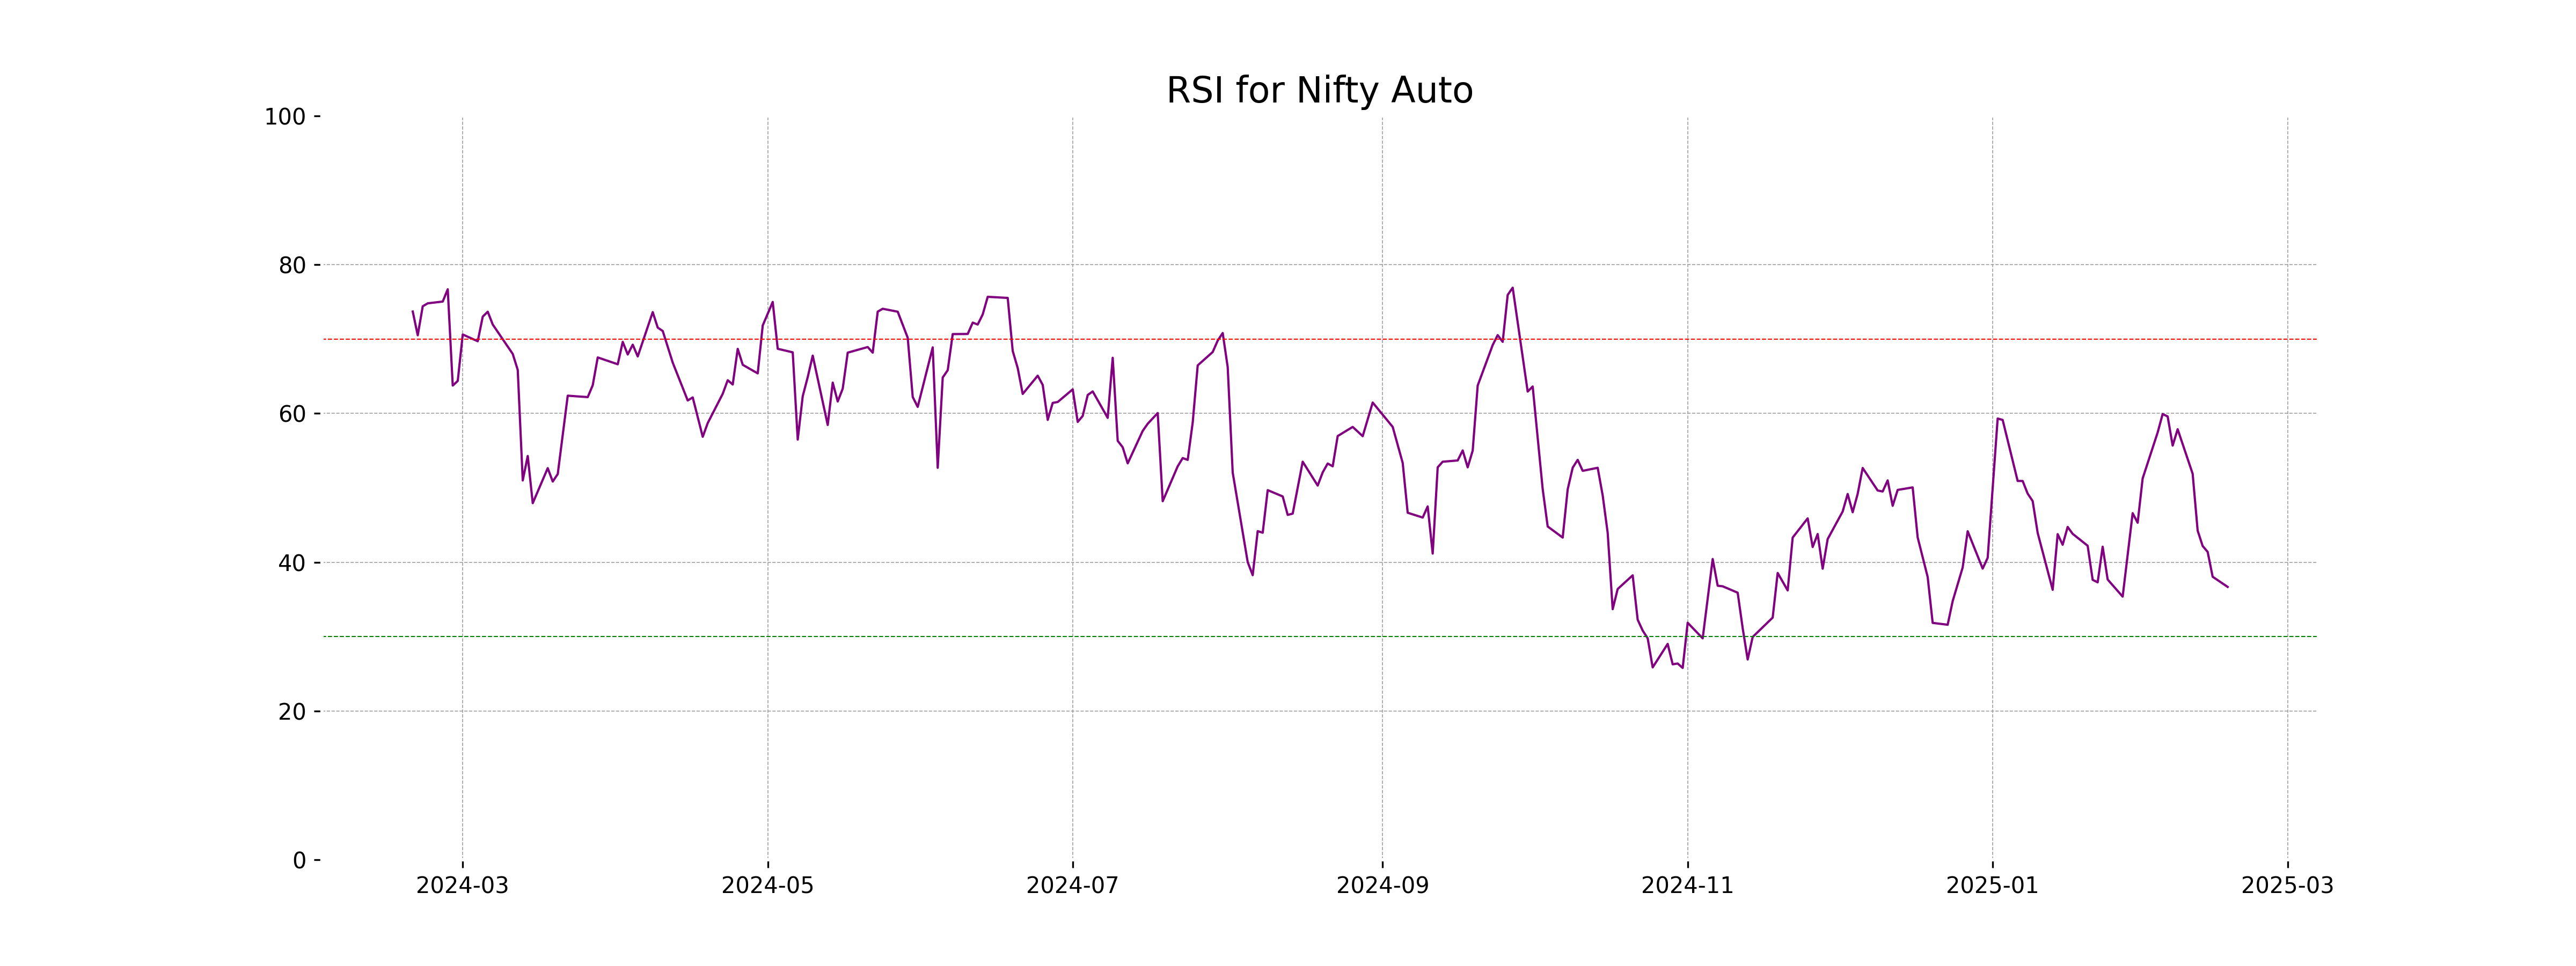
Nifty Auto opened at 22012.80, reached a high of 22012.95, and closed at 21951.85, marking a decrease of 0.53% from the previous close of 22069.30. The point change was -117.45. The Relative Strength Index (RSI) is at a low of 36.68, indicating potential weakness, with a MACD of -169.97 reflecting bearish momentum.
Relationship with Key Moving Averages
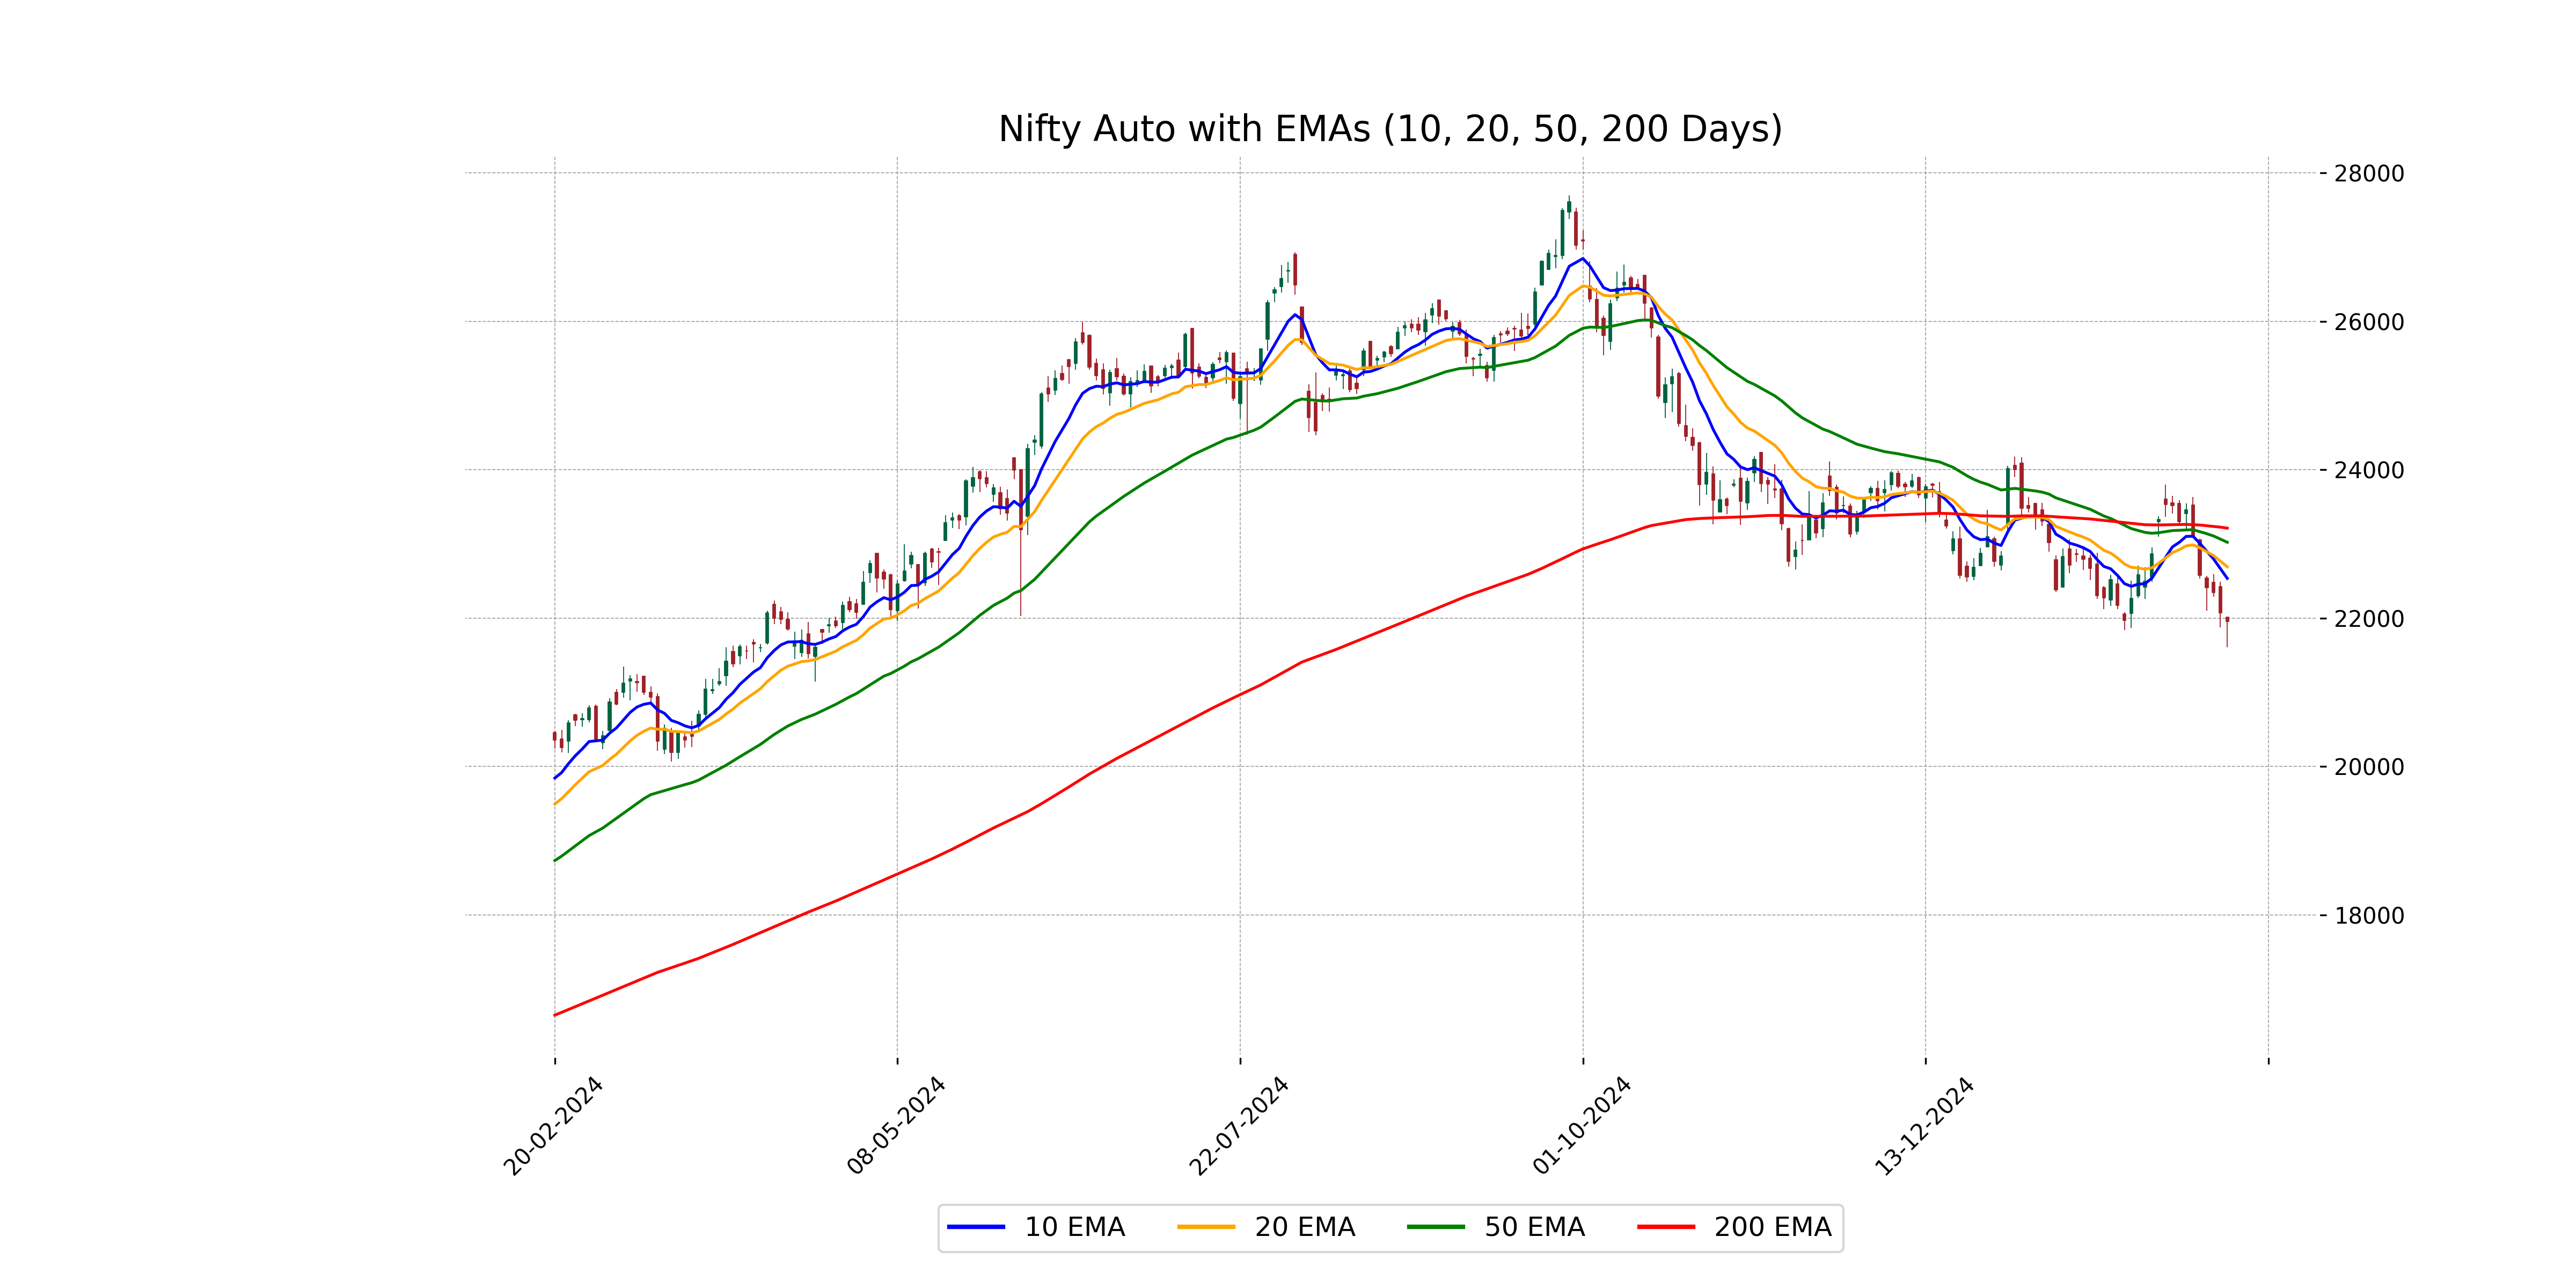
The closing price of Nifty Auto is 21,951.85, which is below the 50 EMA of 23,022.47 and the 200 EMA of 23,213.01, indicating a potential bearish trend in the short to long term. Additionally, it is below the 10 EMA of 22,535.35 and the 20 EMA of 22,691.75, suggesting a continuation of downward momentum in the recent days.
Moving Averages Trend (MACD)
Based on the data, the MACD for Nifty Auto is -169.97, which is below its MACD Signal of -77.81. This indicates a bearish momentum. Additionally, the RSI being at 36.68 suggests that the index might be approaching oversold territory.
RSI Analysis
The RSI (Relative Strength Index) for Nifty Auto is 36.68, indicating that the index is currently in a bearish phase and nearing the oversold territory, which typically occurs below a level of 30. This may suggest potential for a reversal or consolidation if buying interest increases.
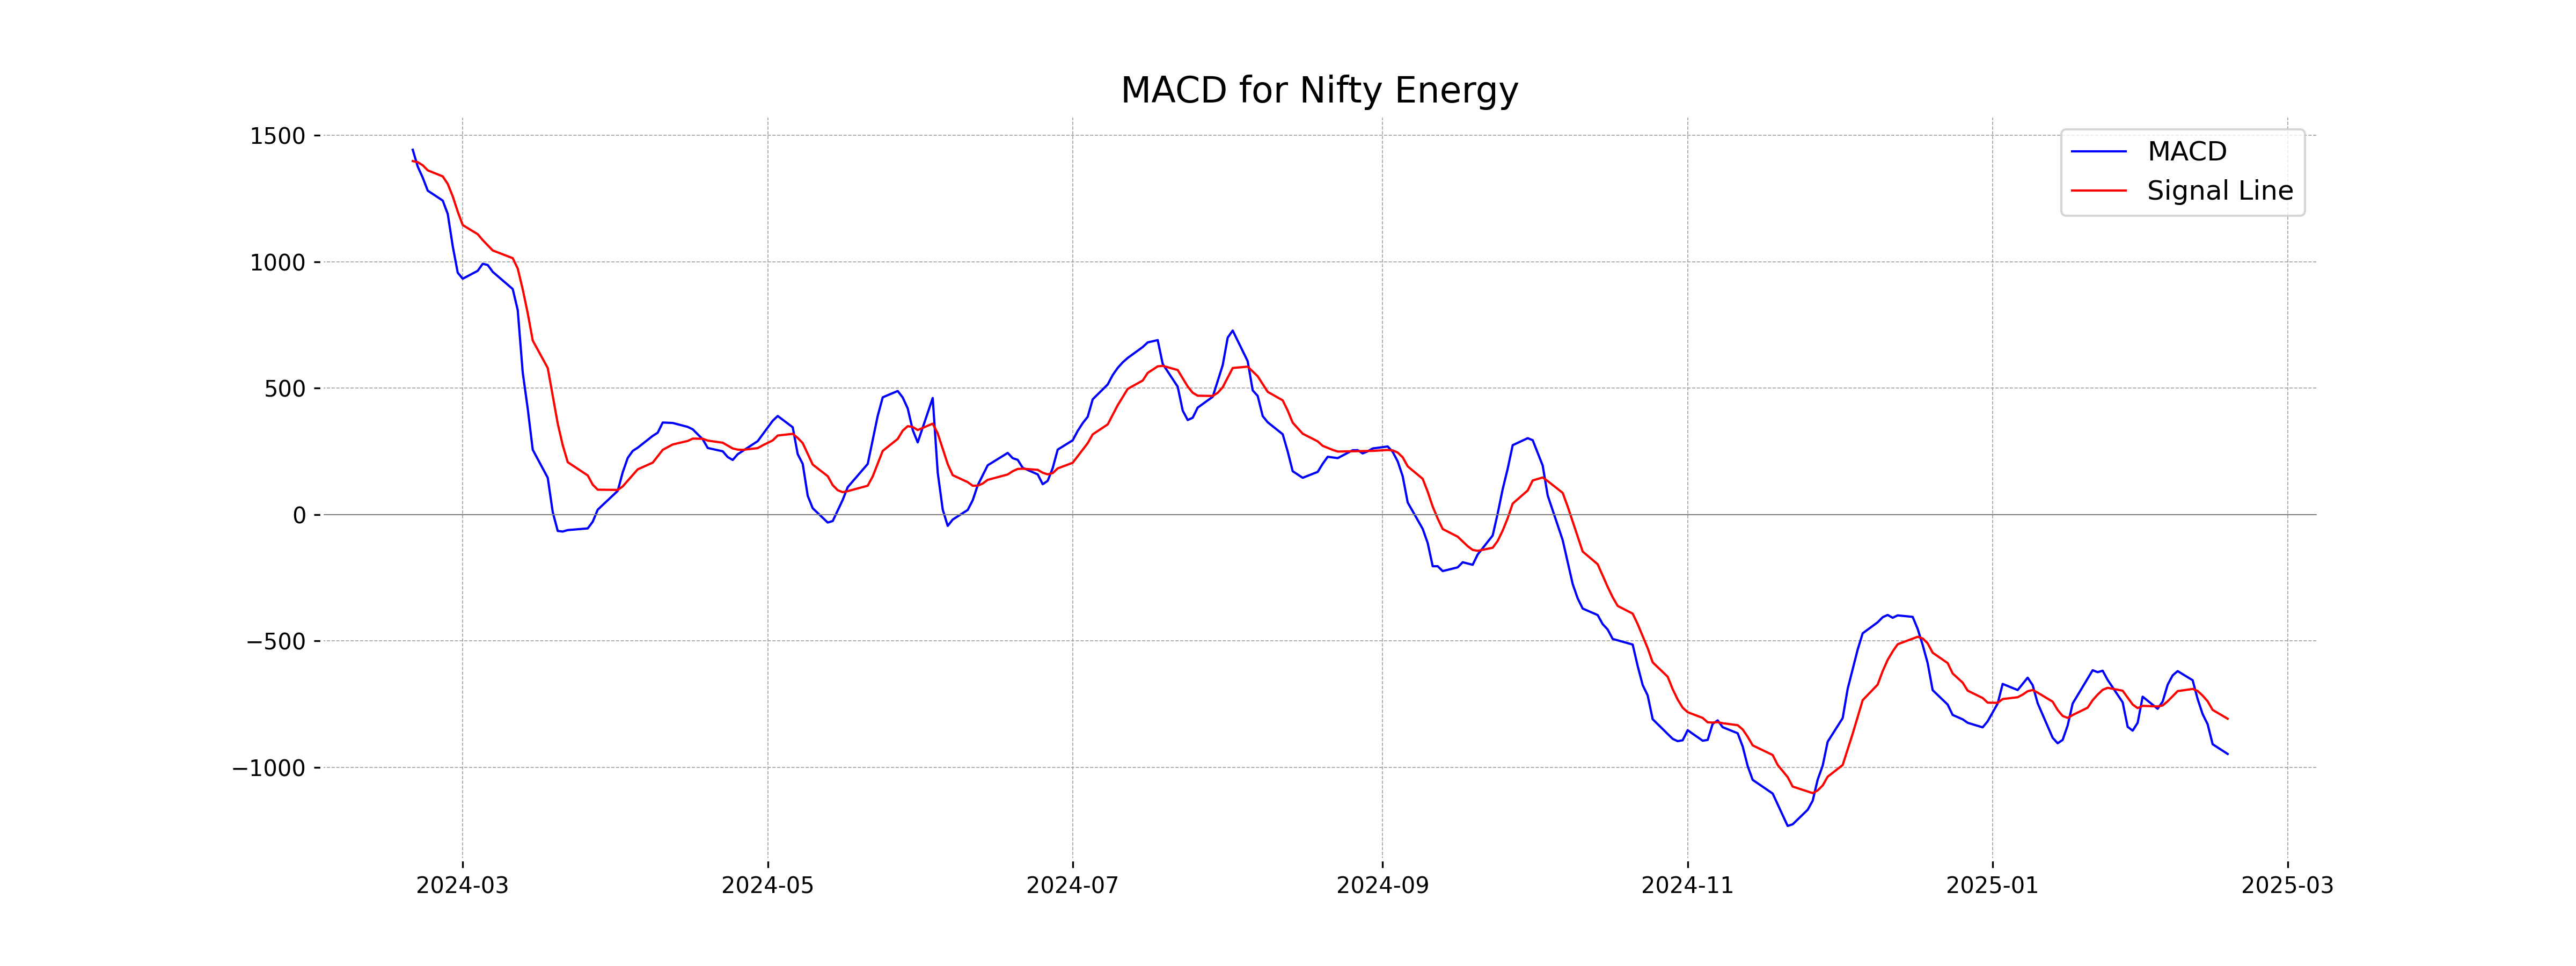
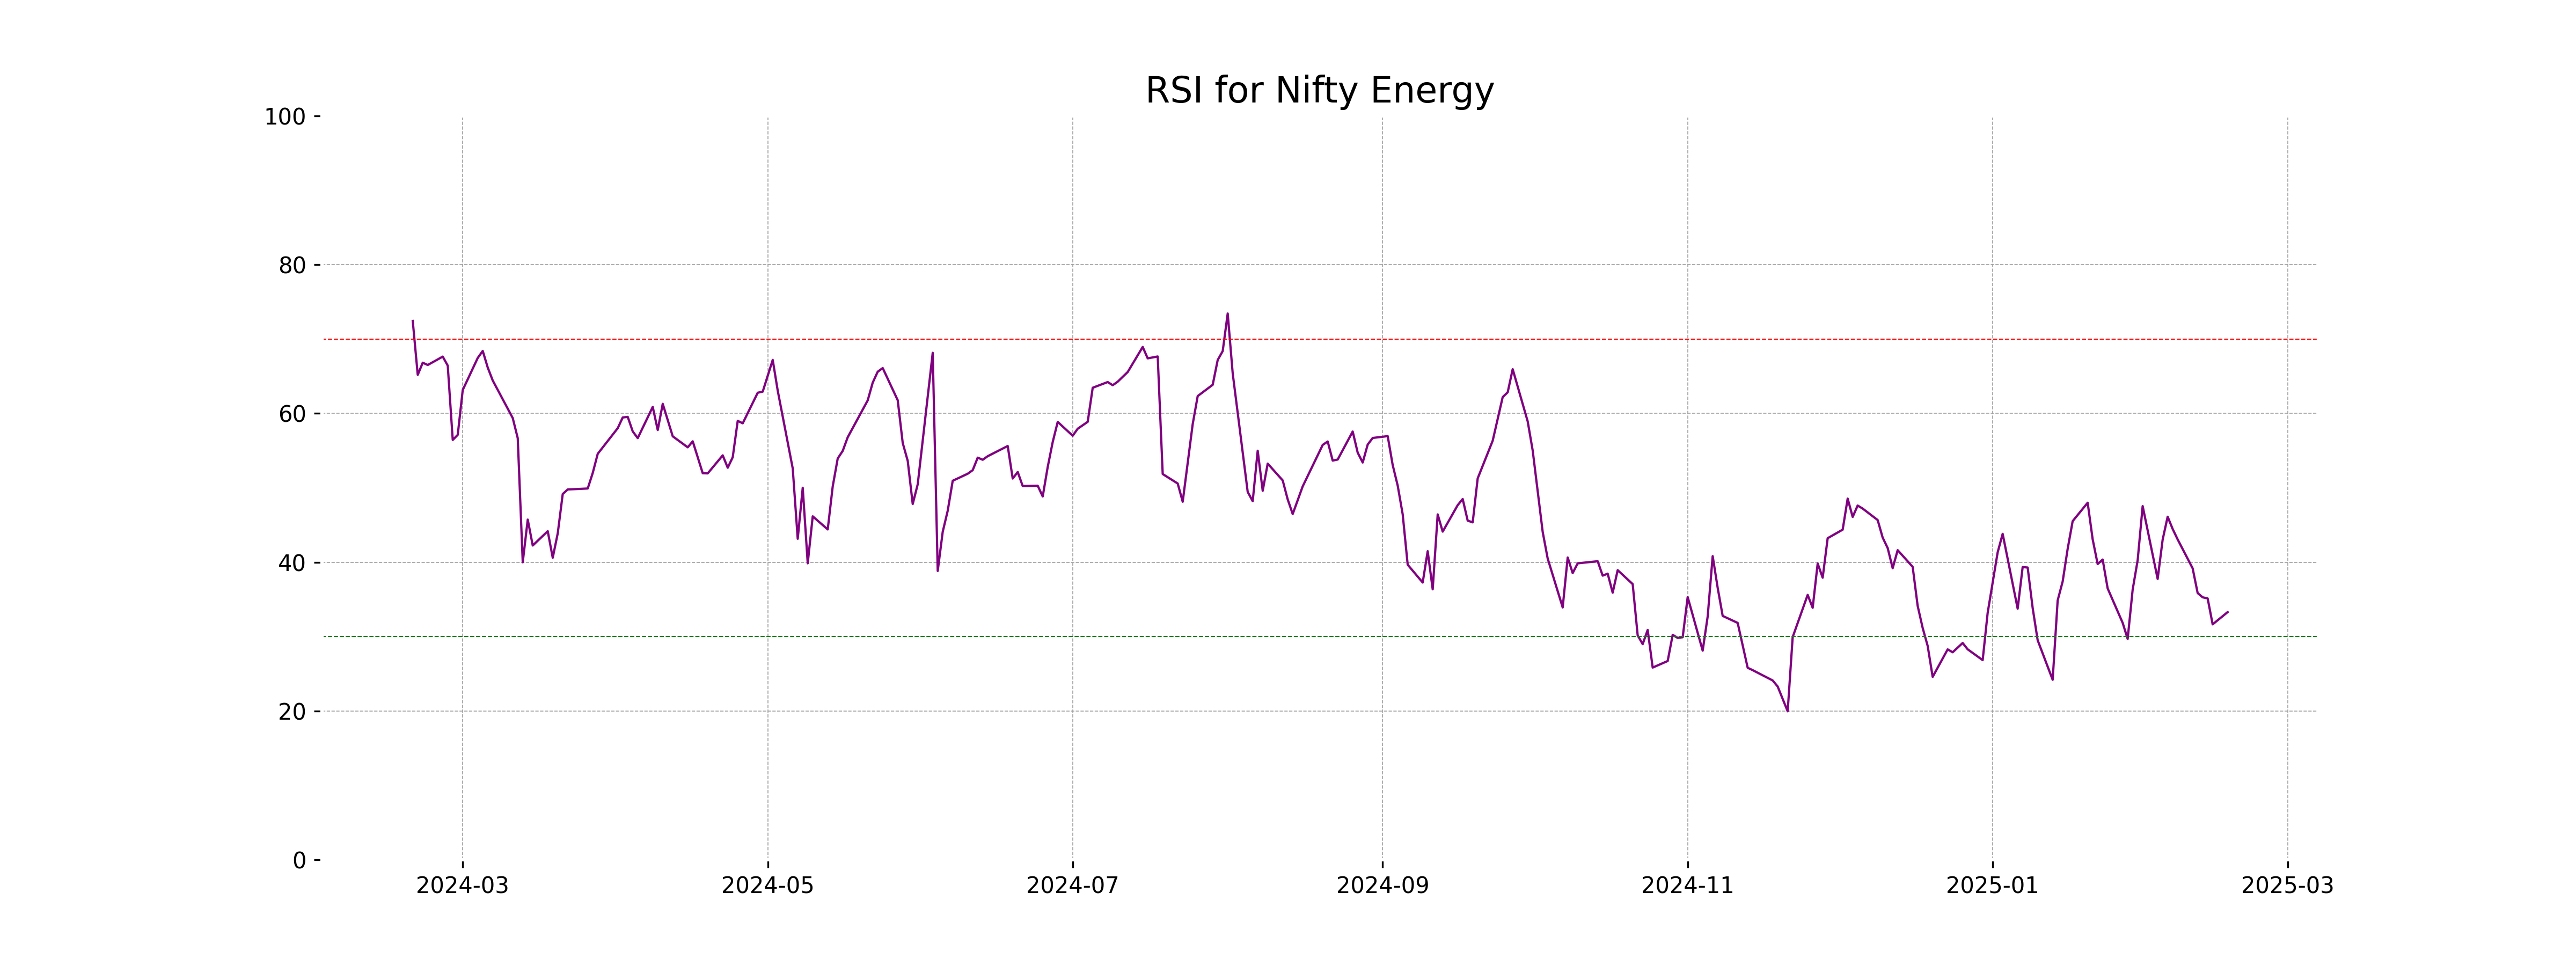
Analysis for Nifty Energy - February 17, 2025
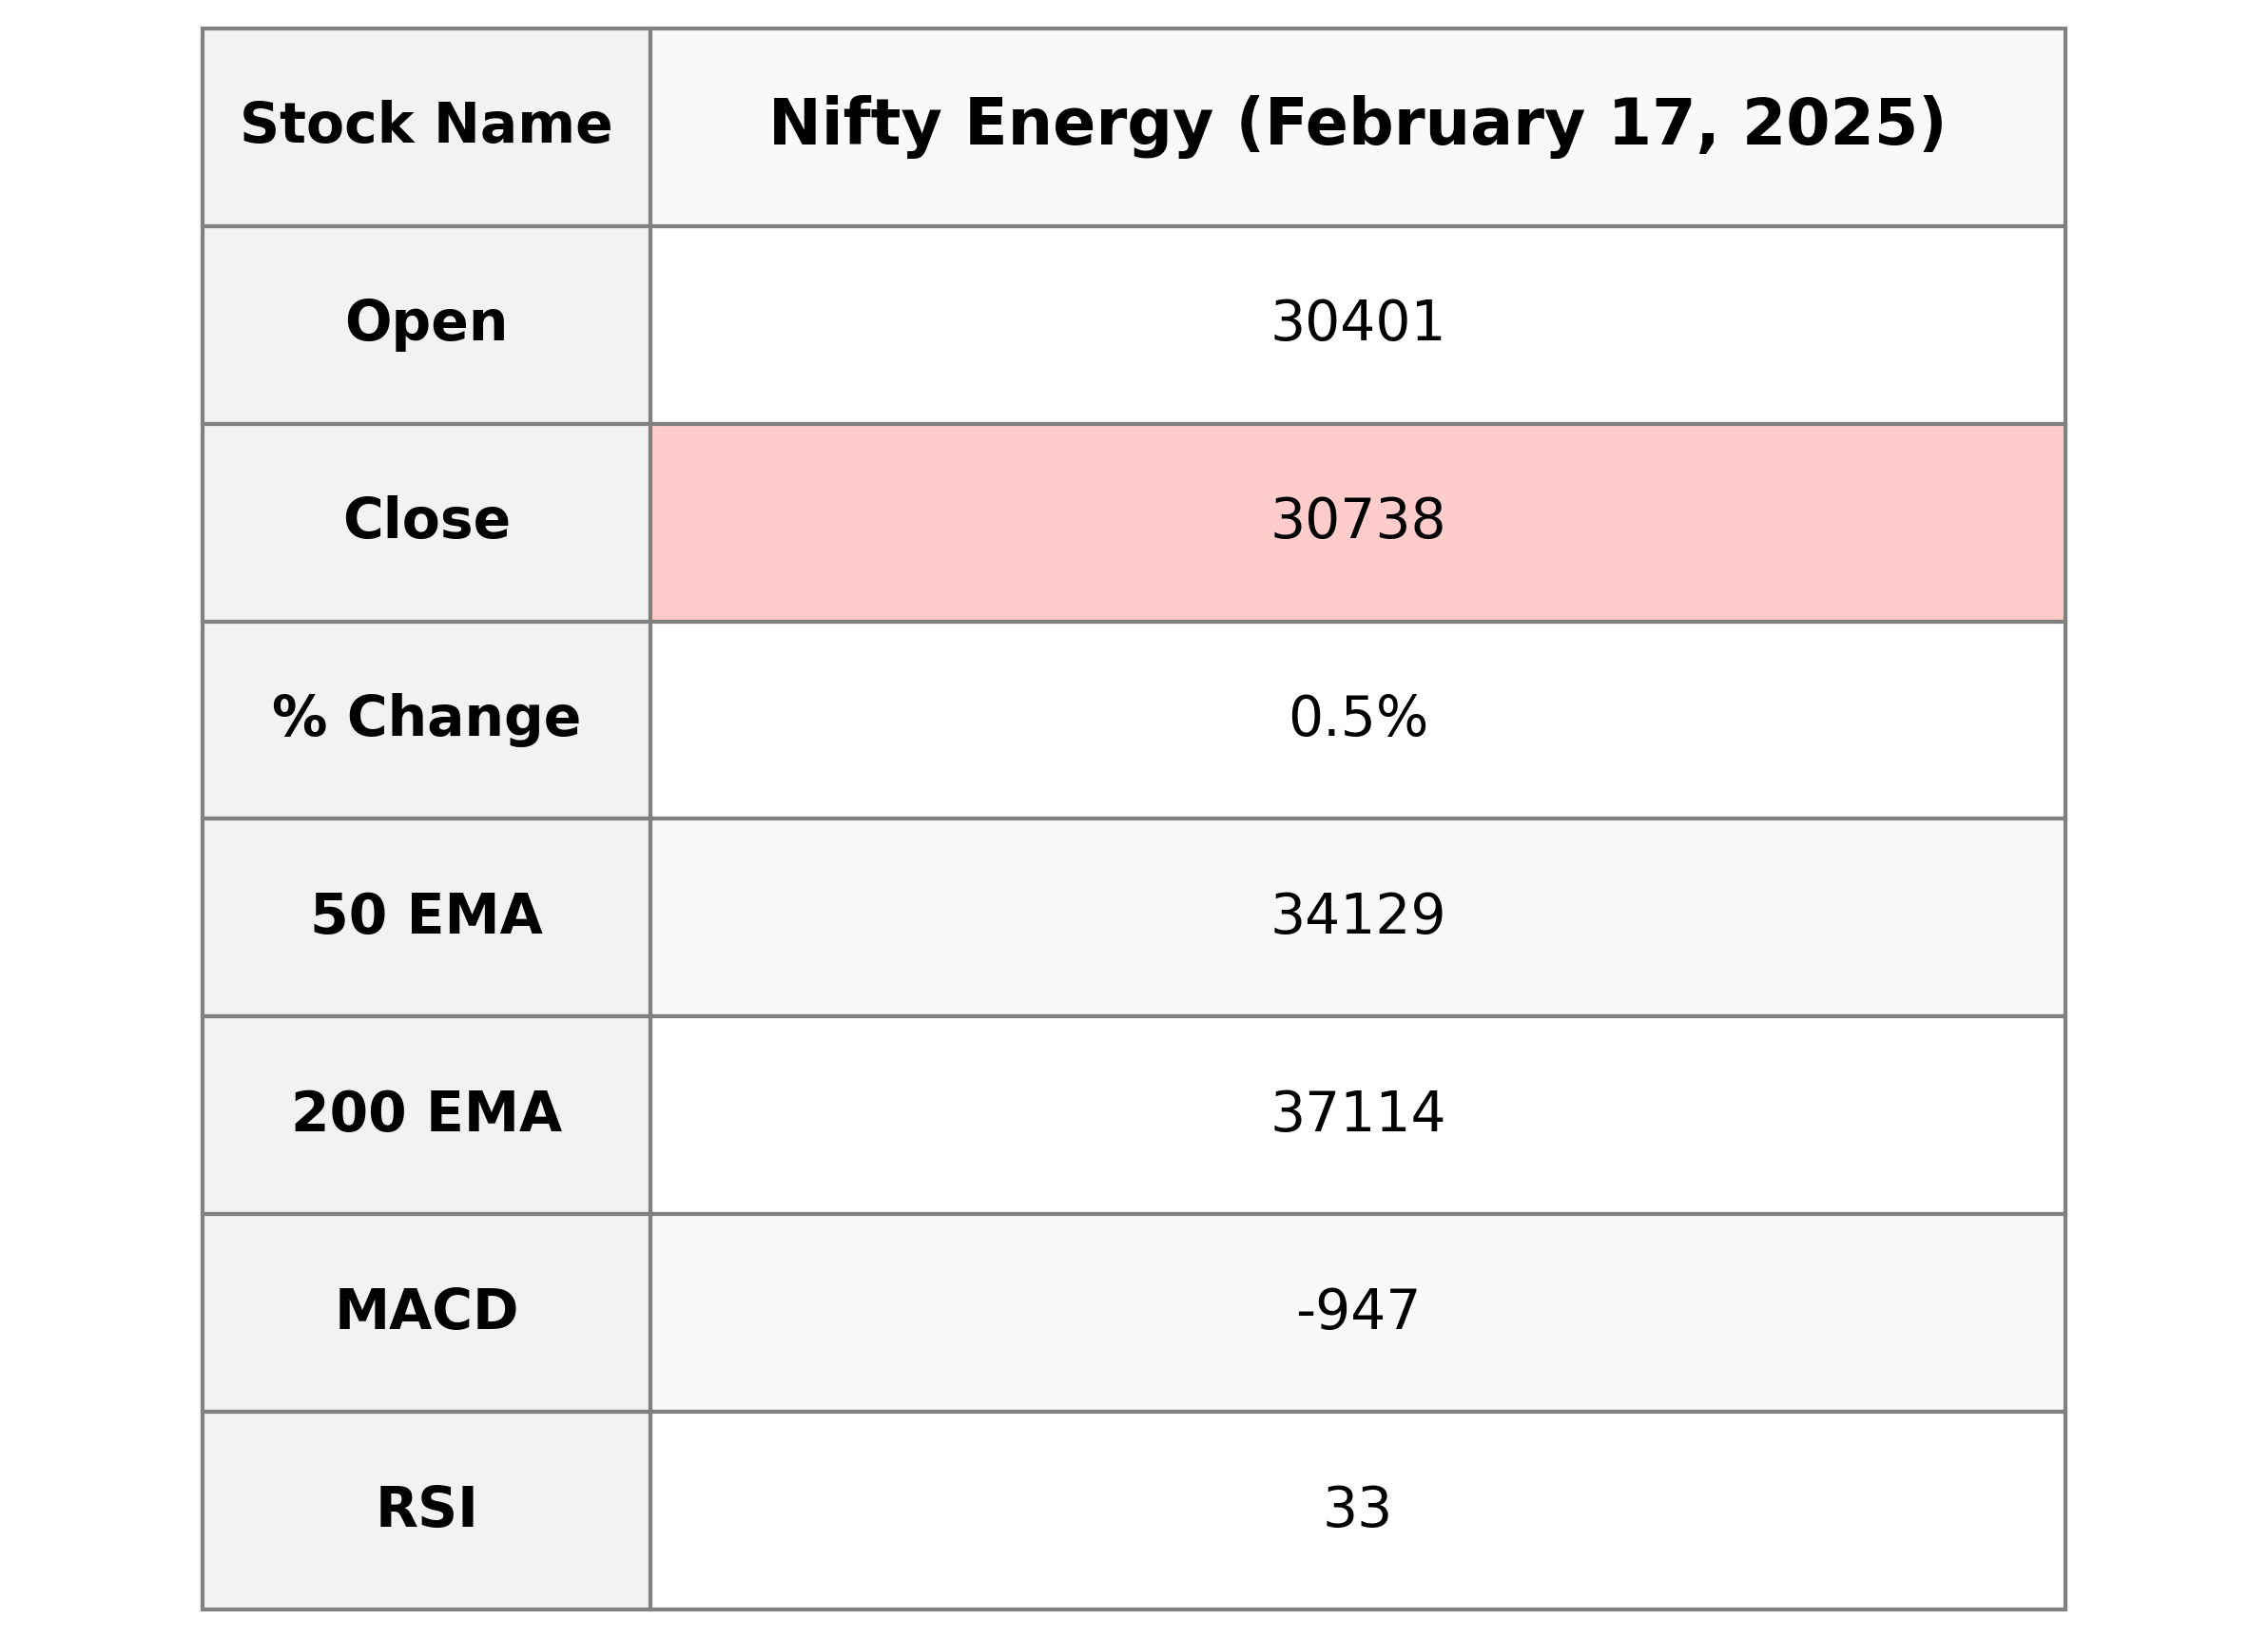
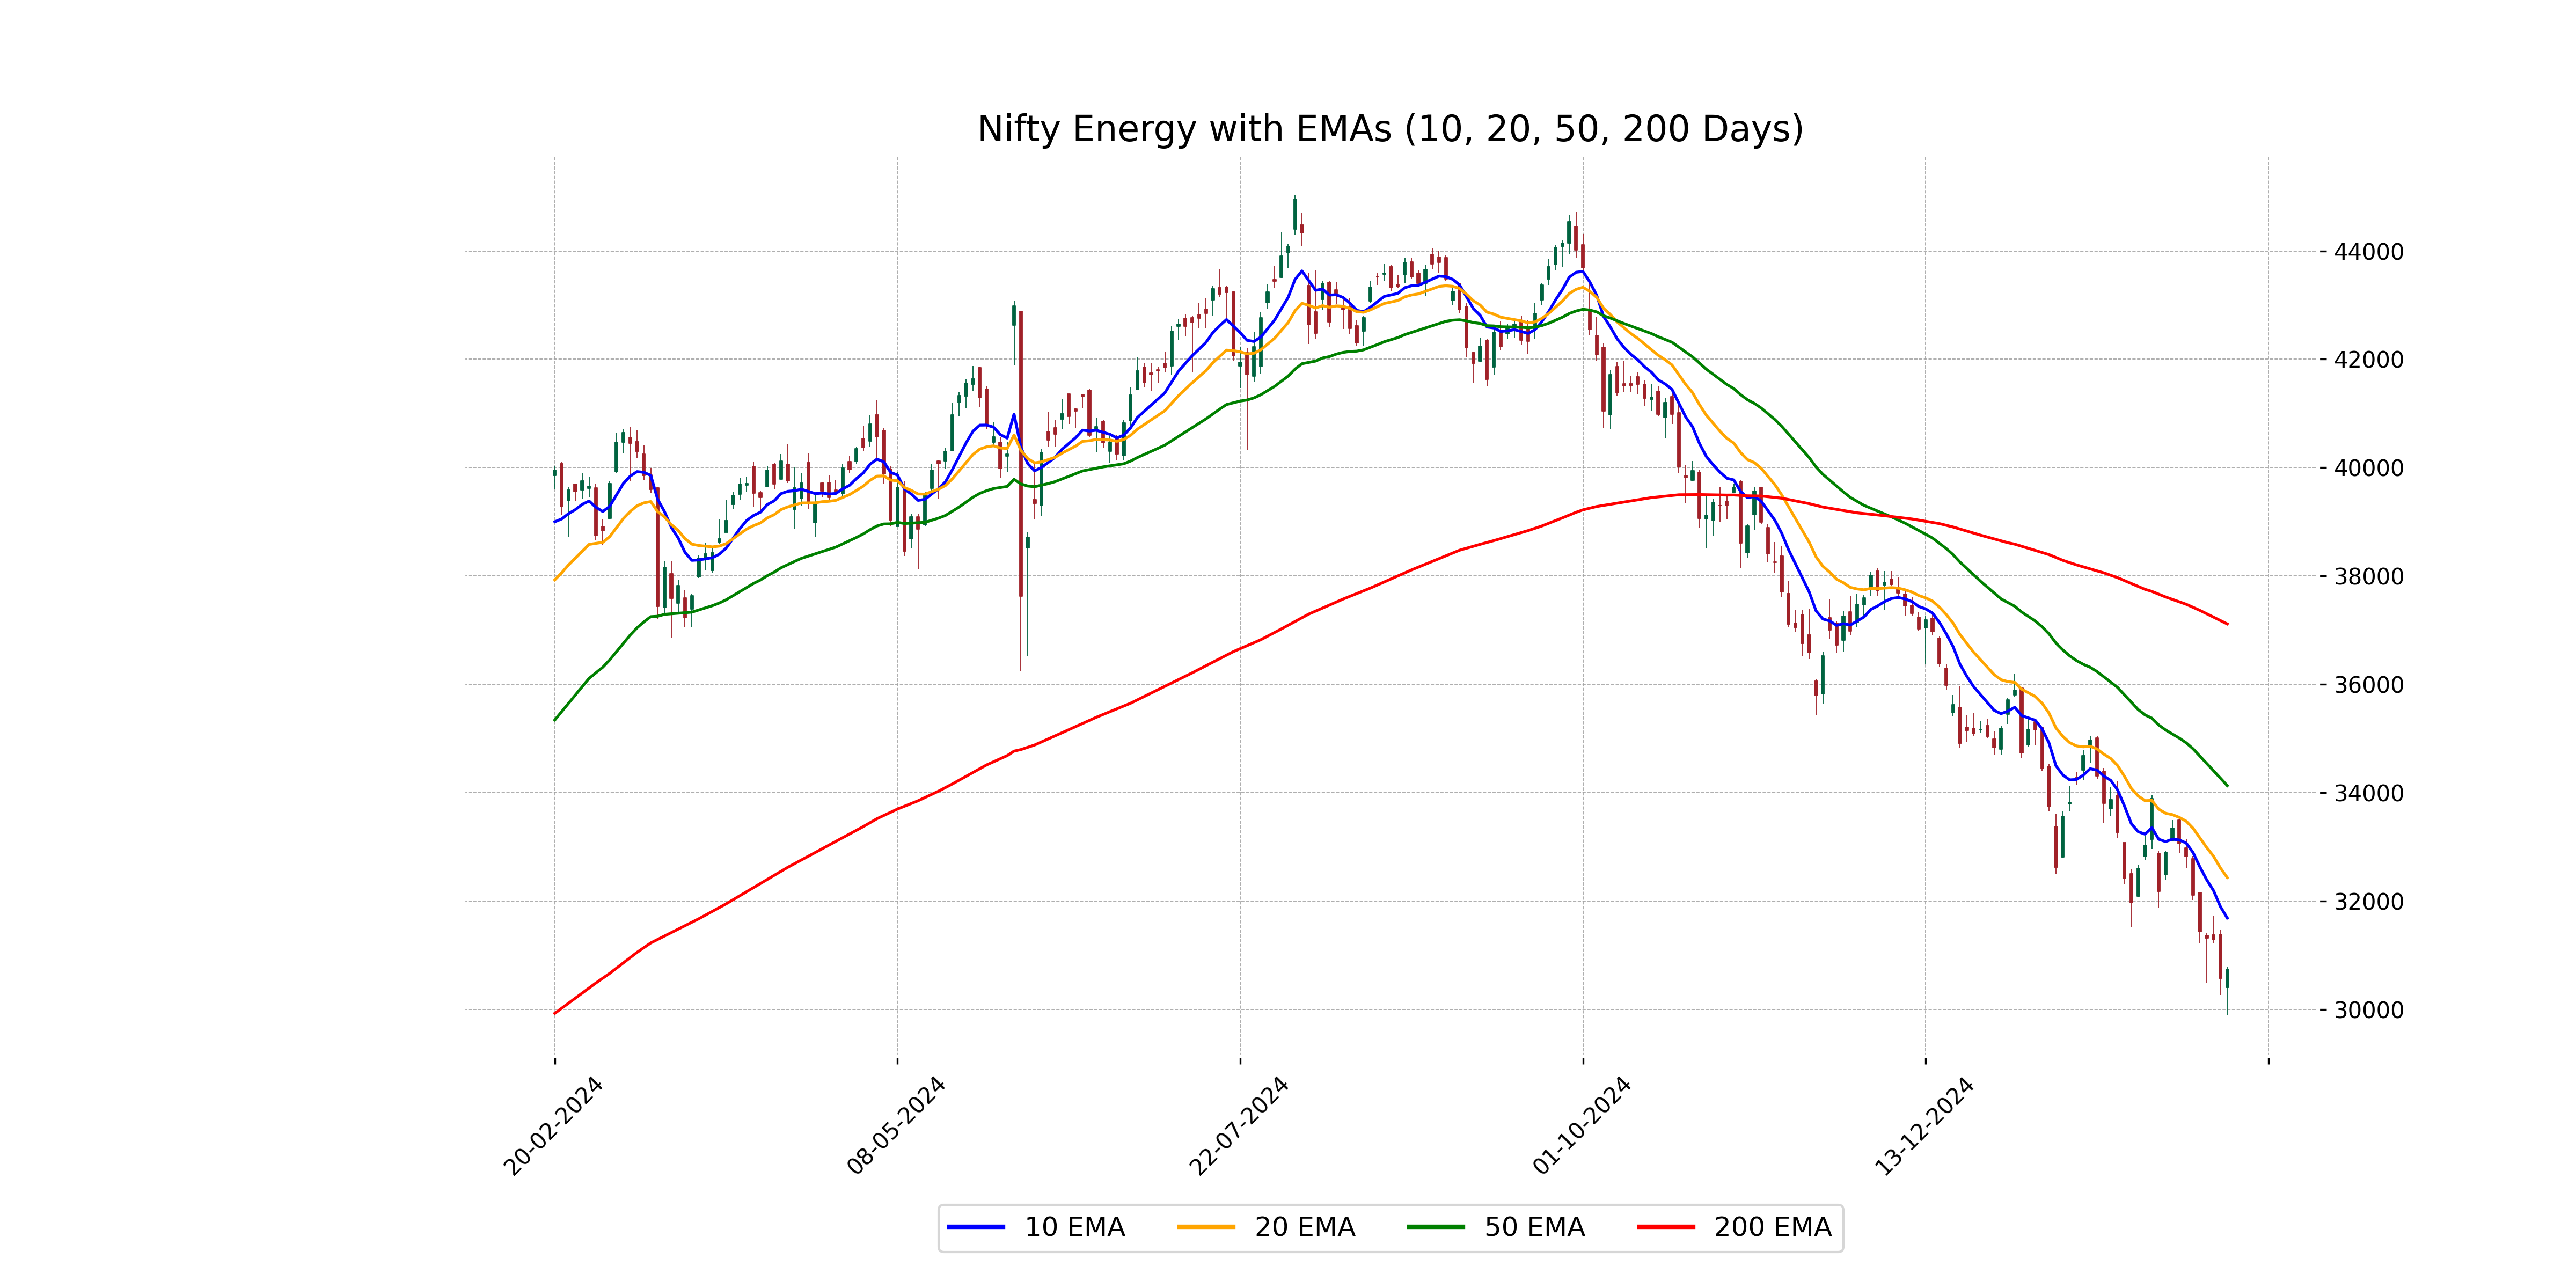
**Nifty Energy Performance:** The Nifty Energy index opened at 30,401.35 and closed higher at 30,737.55, marking a gain of approximately 0.54% with a points change of 165.25. Despite the positive movement in closing value, the technical indicators show a bearish sentiment, with the MACD significantly below the signal line and an RSI of 33.29, indicating possible overselling. The index remains below its 50, 100, and 200 EMA levels, suggesting a bearish trend in the broader market context.
Relationship with Key Moving Averages
Nifty Energy closed at 30,737.55, which is below the 50 EMA (34,129.42), 200 EMA (37,114.06), 10 EMA (31,685.76), and 20 EMA (32,431.88). This suggests a potential bearish trend as the price is currently trading below these key moving averages.
Moving Averages Trend (MACD)
Based on the data, the MACD for Nifty Energy is negative at -947.04, indicating a potential bearish trend in the market. The MACD is below the signal line (-807.77), which may suggest that the index could continue to experience downward pressure.
RSI Analysis
The current RSI for Nifty Energy is 33.29, indicating that the index is moving towards the oversold territory. This suggests a potential buying opportunity if the downtrend reverses, but investors should remain cautious as a low RSI can also signal continued bearish momentum.
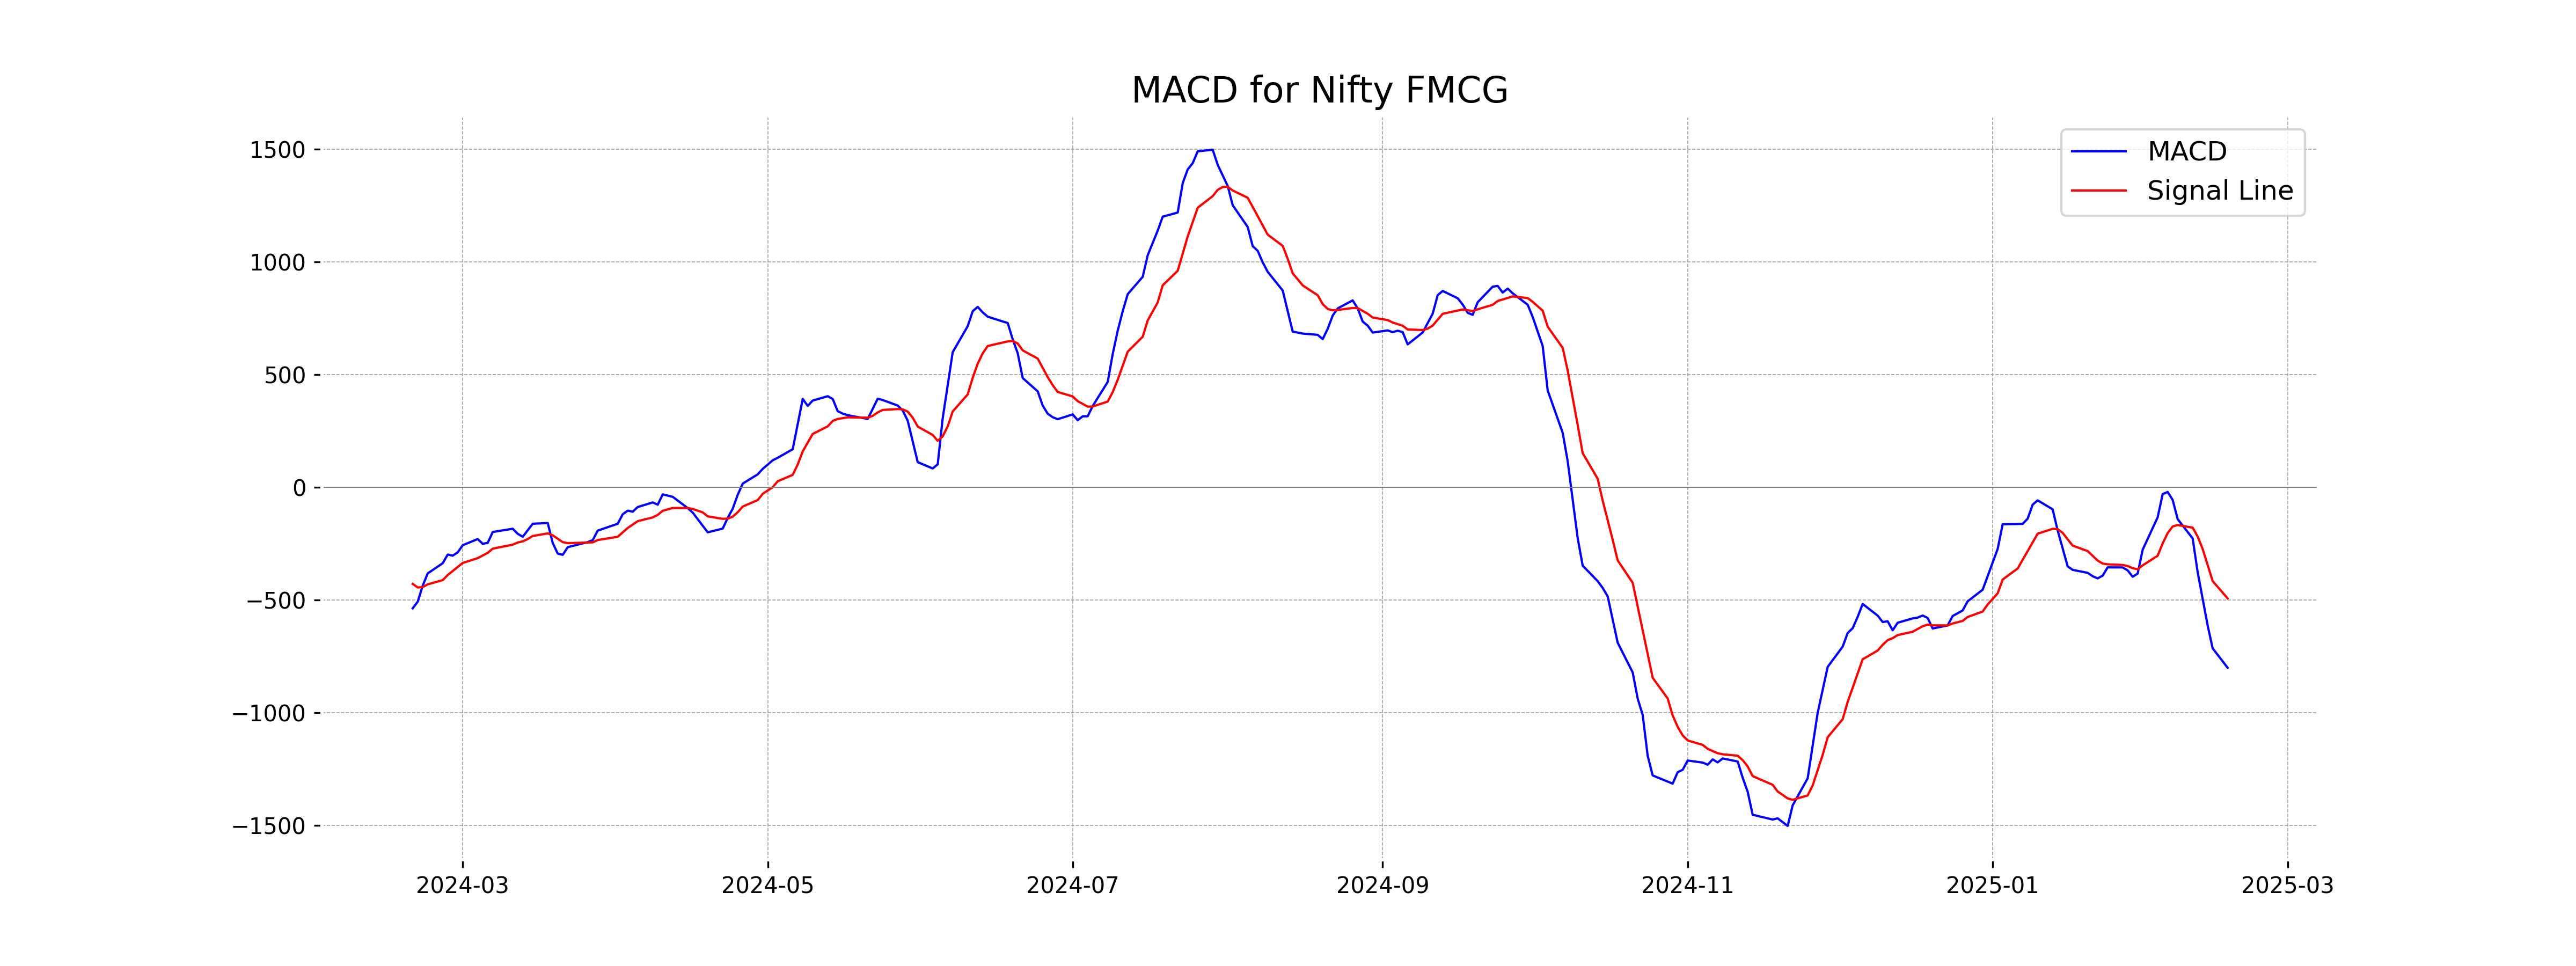
Analysis for Nifty FMCG - February 17, 2025

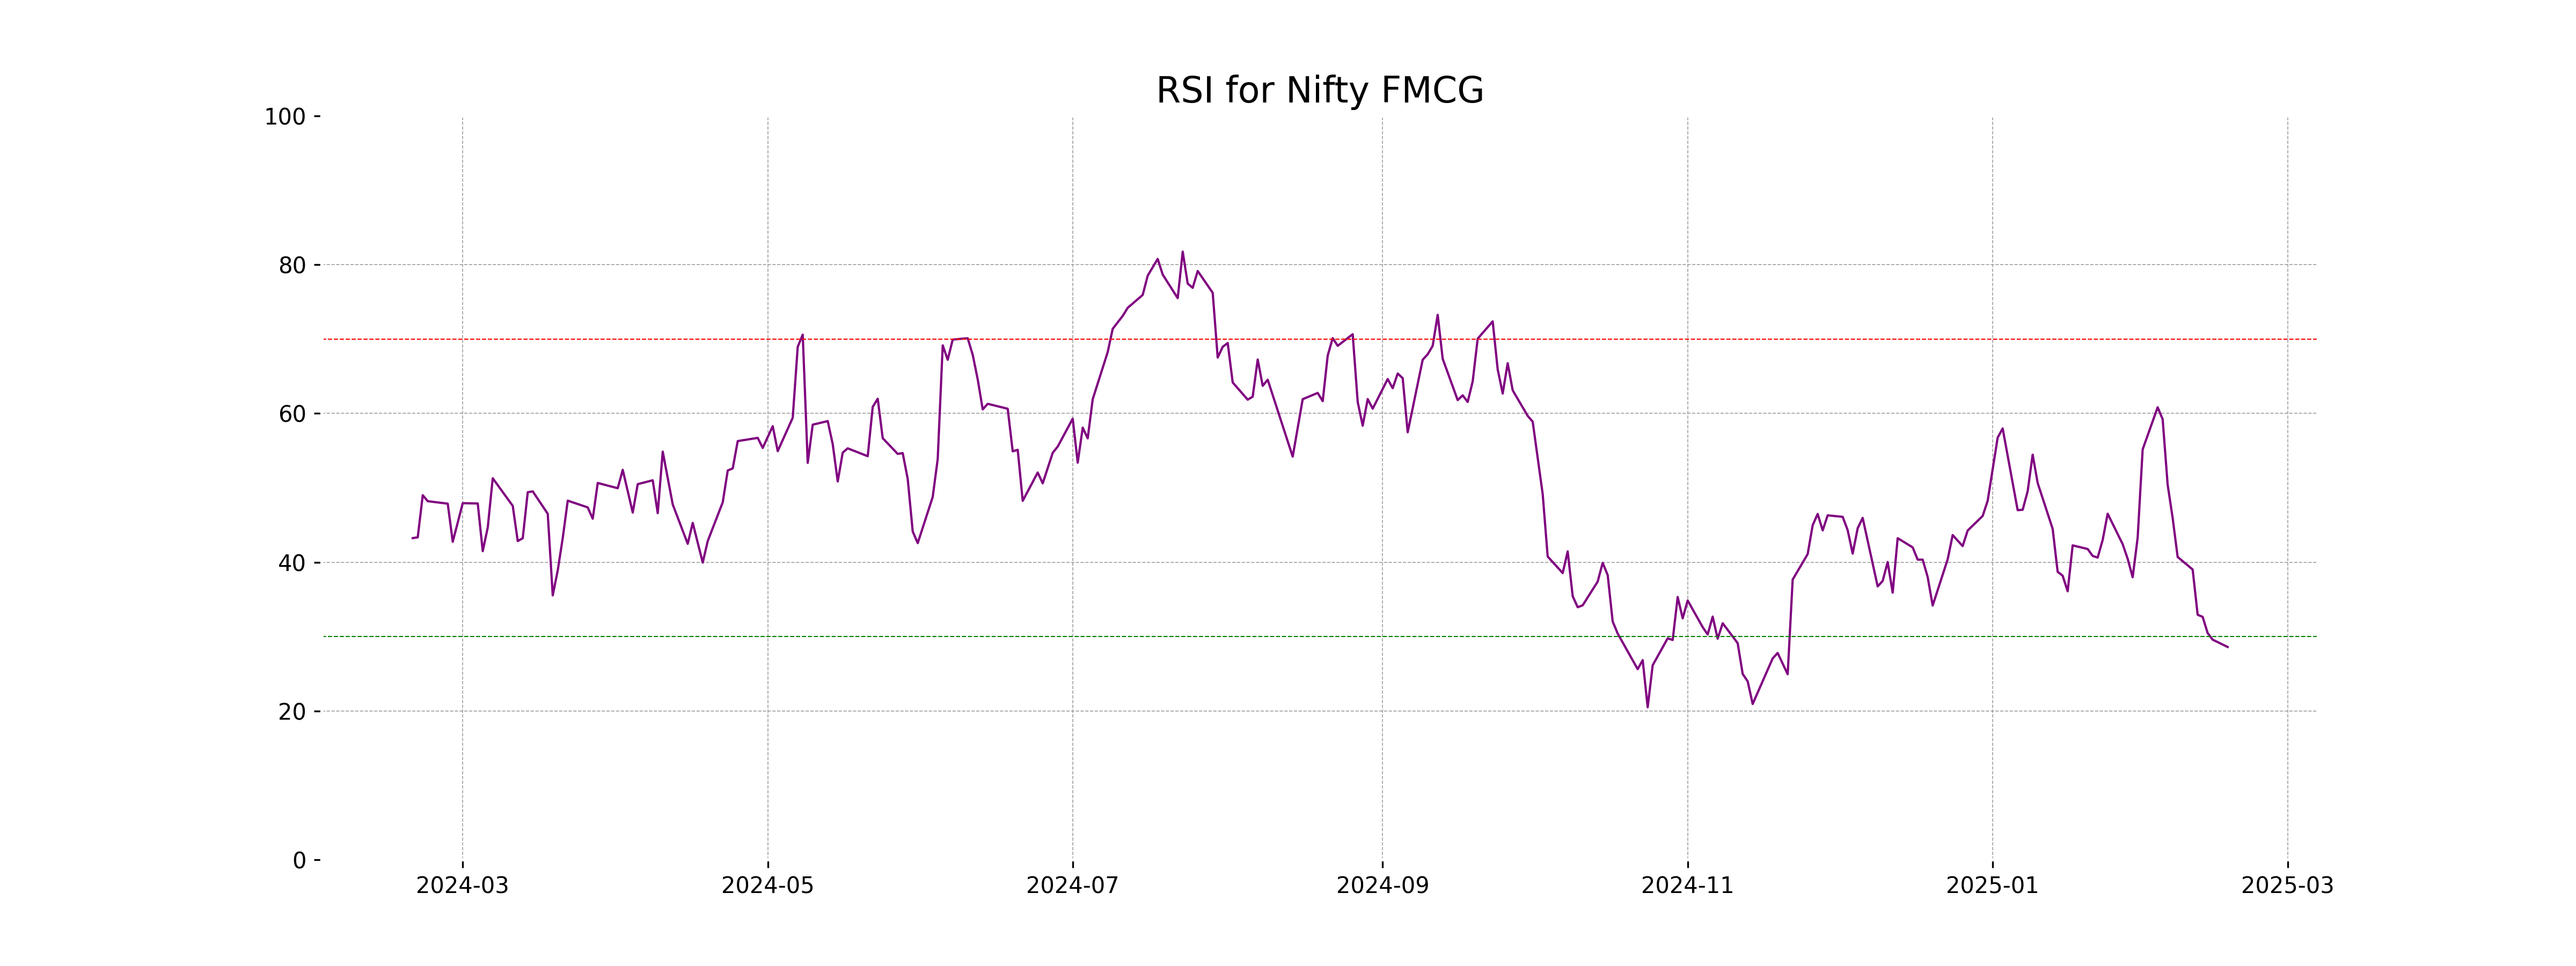
Nifty FMCG opened at 53011.75 and closed at 52945.0, experiencing a points change of -193.55 from the previous close, indicating a decline of approximately -0.36%. The current RSI value of 28.61 suggests that the index may be in an oversold territory, and the MACD indicates a bearish trend as it is below the signal line.
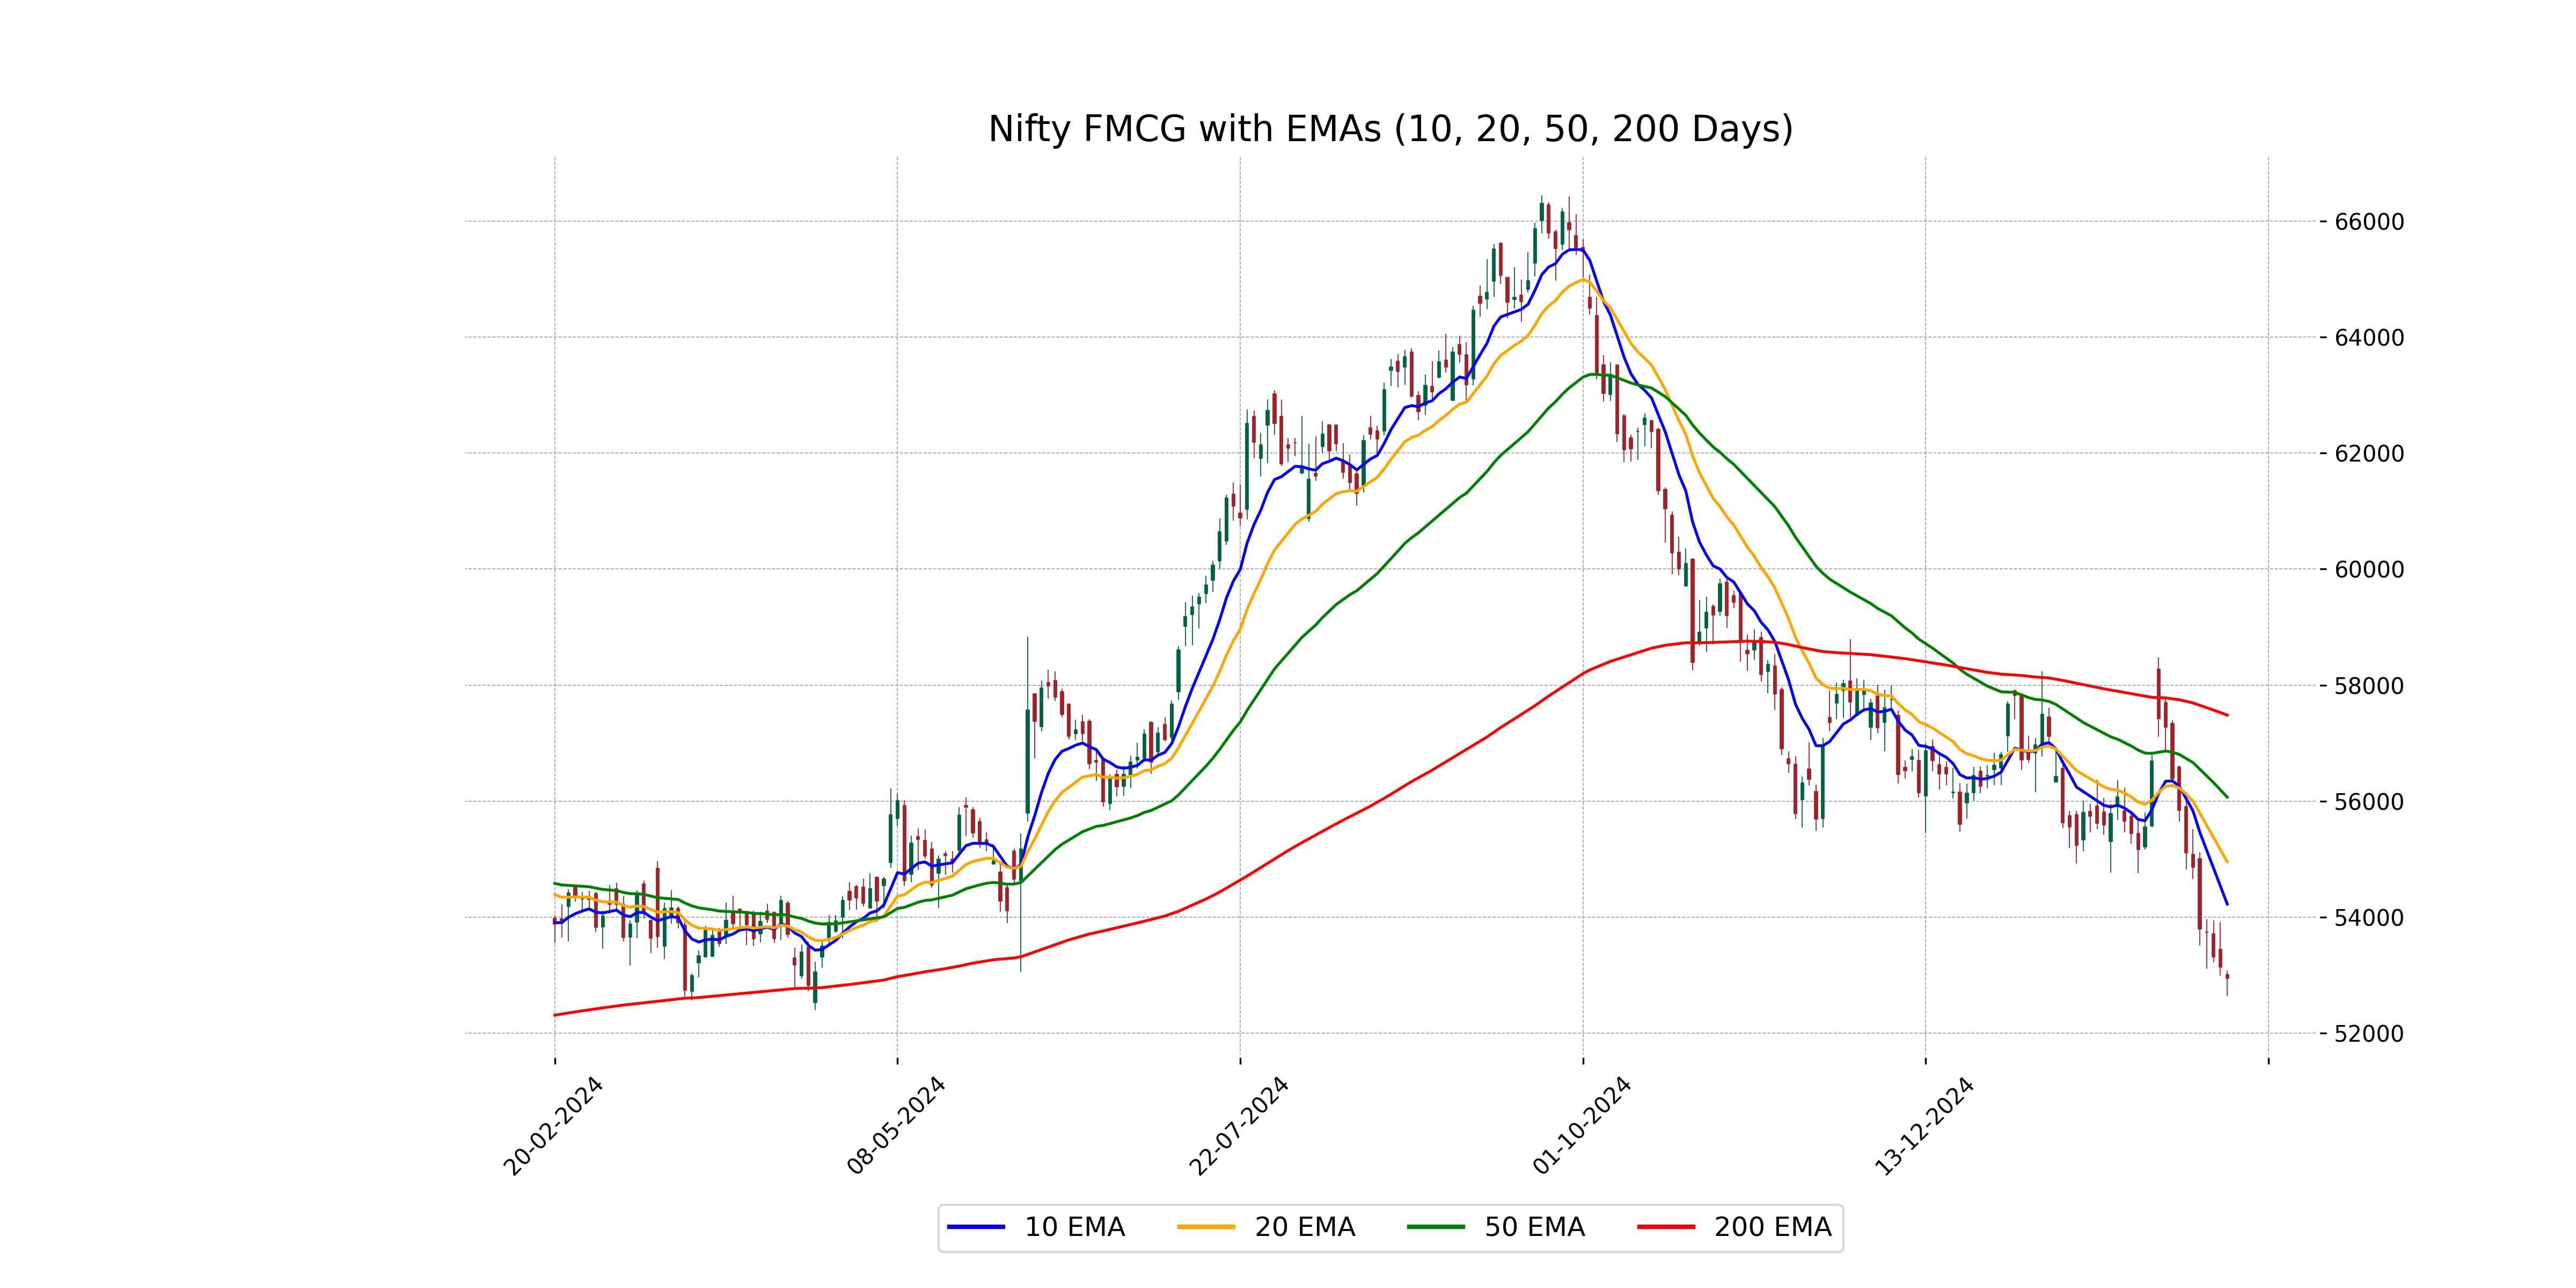
Relationship with Key Moving Averages
The Nifty FMCG index is currently trading below its 10-day EMA of 54225.77, 20-day EMA of 54953.96, 50-day EMA of 56067.53, and 200-day EMA of 57482.47, indicating a bearish trend in comparison to these key moving averages. The significant RSI value of 28.61 further suggests oversold conditions in the index.
Moving Averages Trend (MACD)
**Nifty FMCG** is currently experiencing bearish momentum as indicated by the MACD value of -800.19, which is below both the MACD Signal line of -492.54 and zero. This suggests that negative market sentiment may persist, especially considering the RSI is also low at 28.61, indicating potential oversold conditions.
RSI Analysis
The relative strength index (RSI) for Nifty FMCG is 28.61, which indicates that the stock is currently in the oversold territory. This may suggest a potential buying opportunity as the RSI value is below 30, often seen as a threshold for oversold conditions.
Analysis for Nifty Infra - February 17, 2025

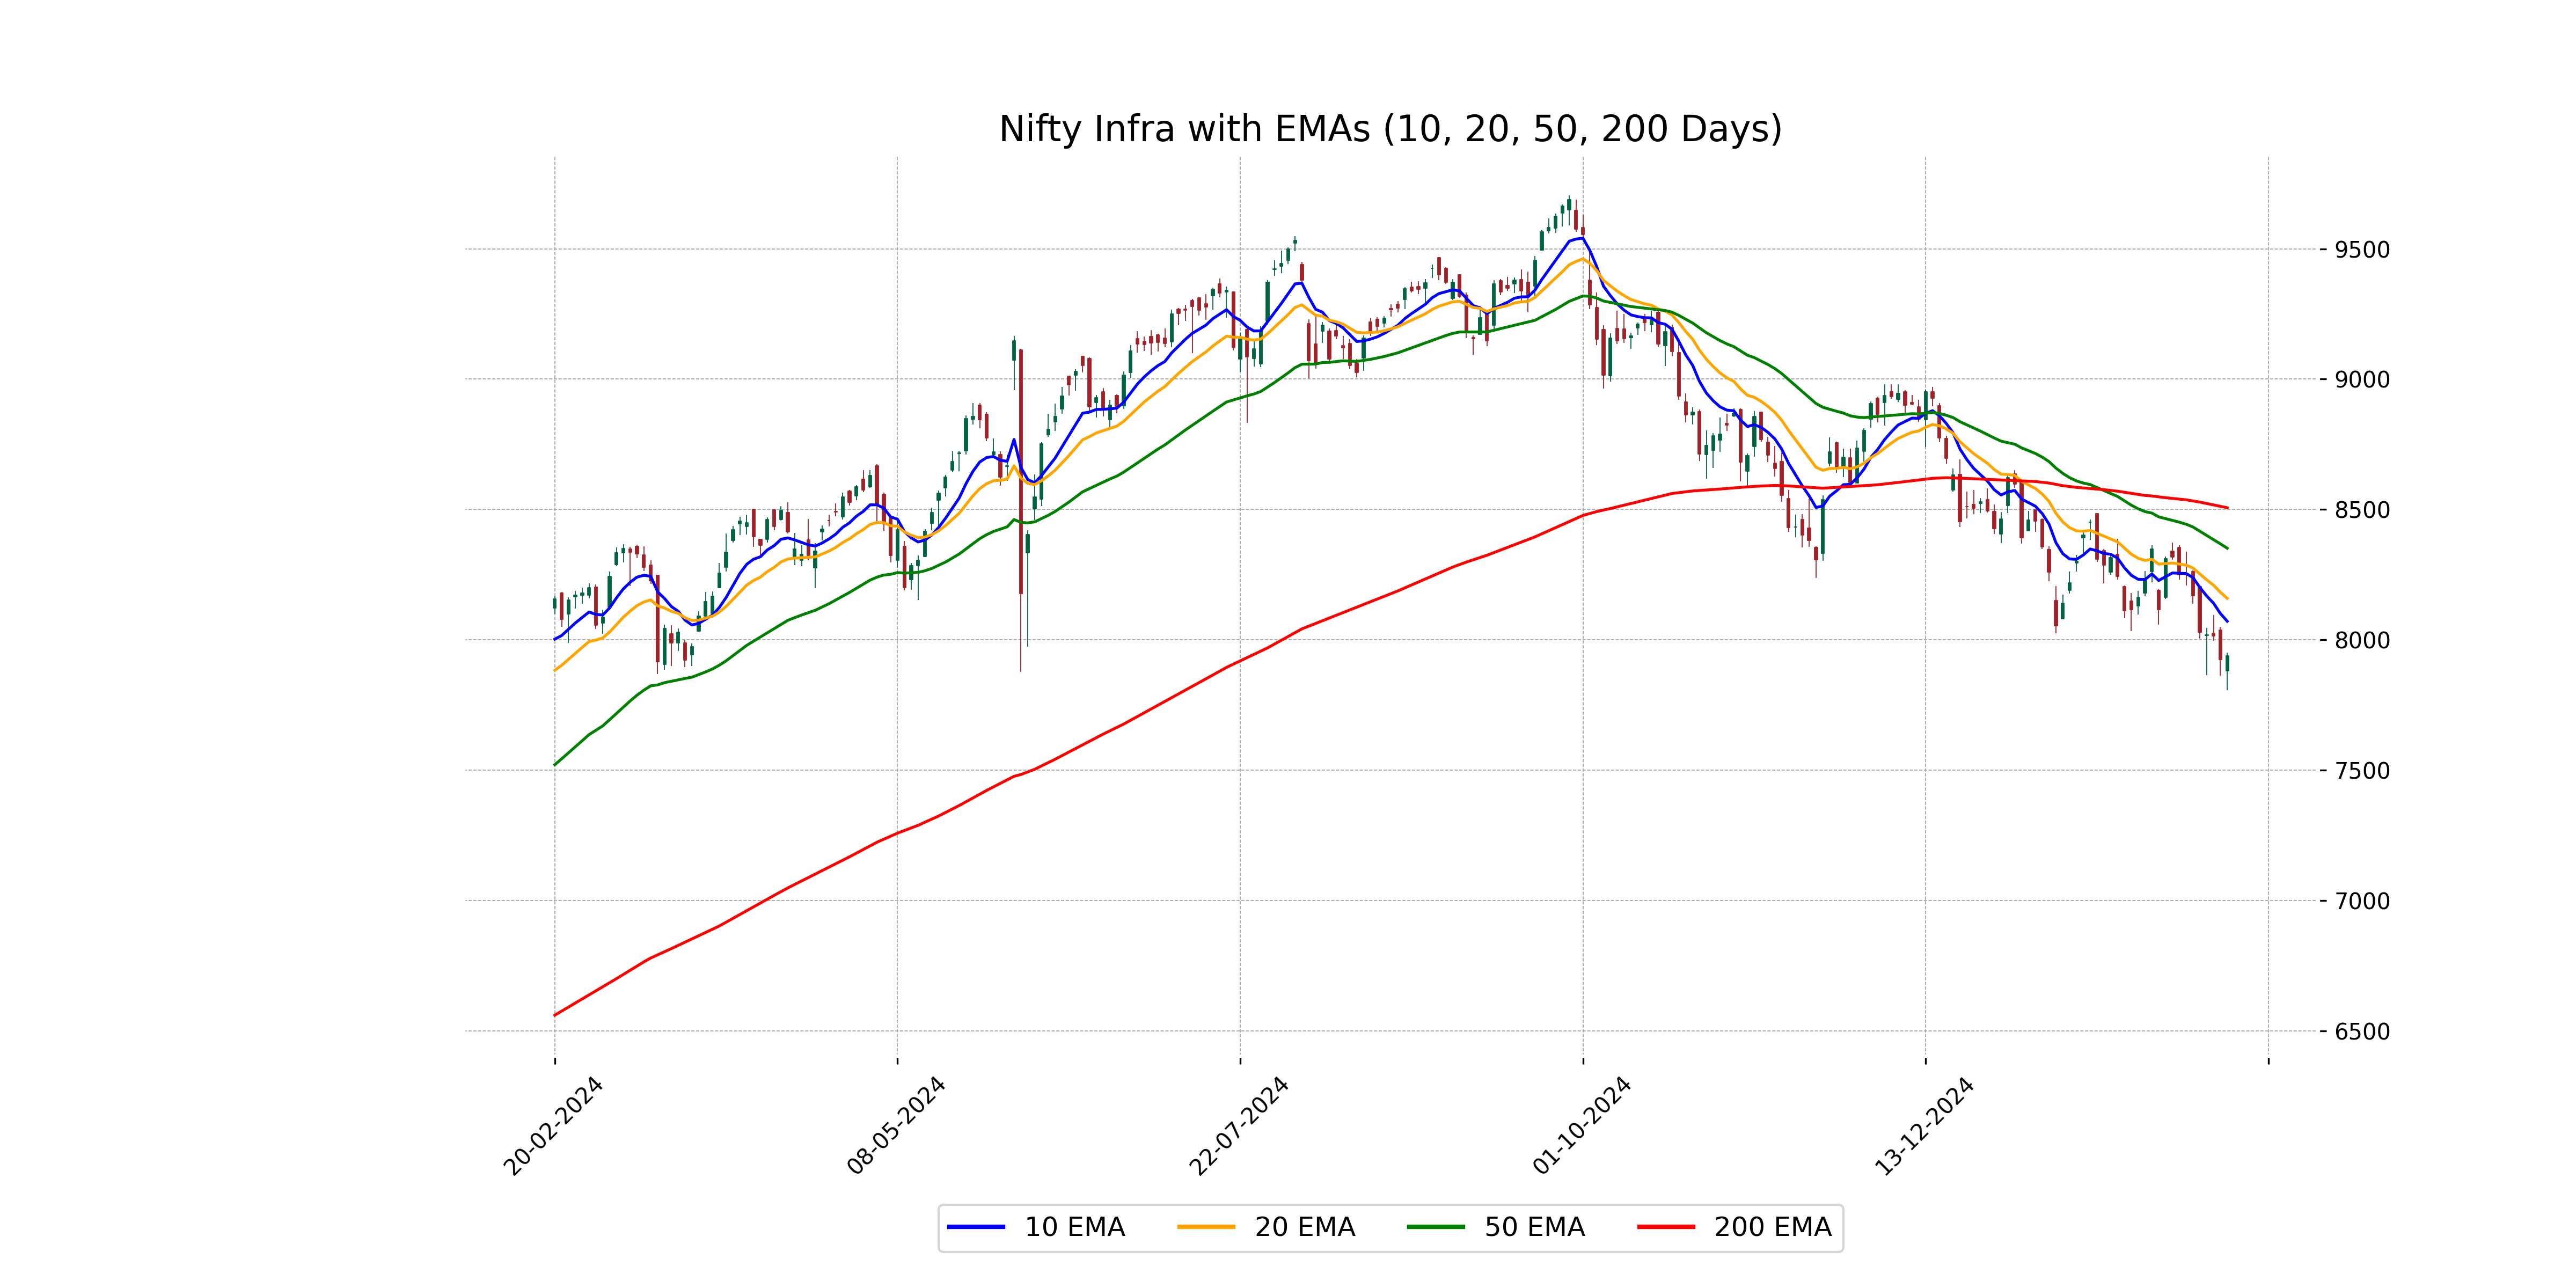
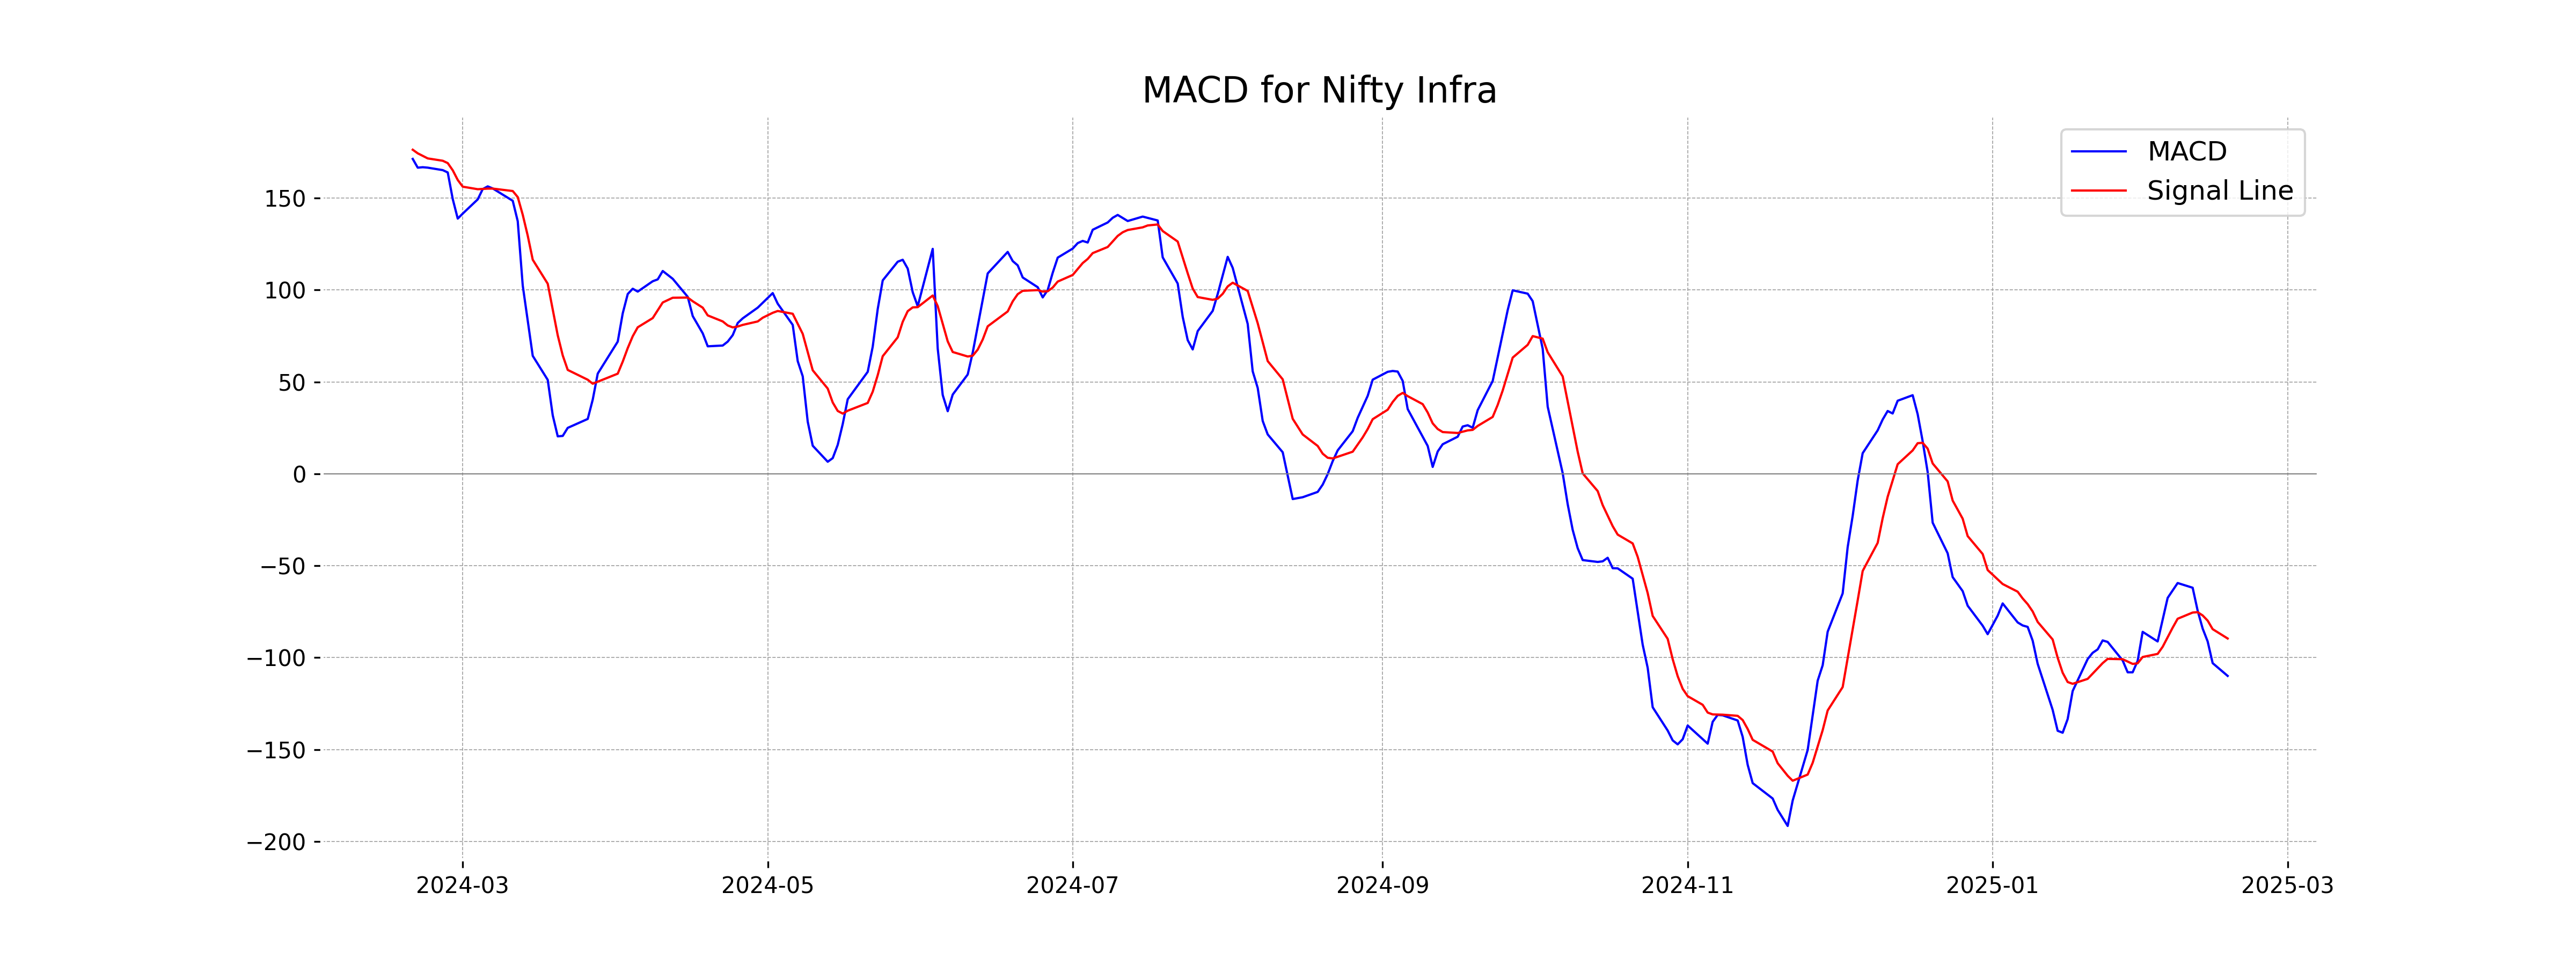
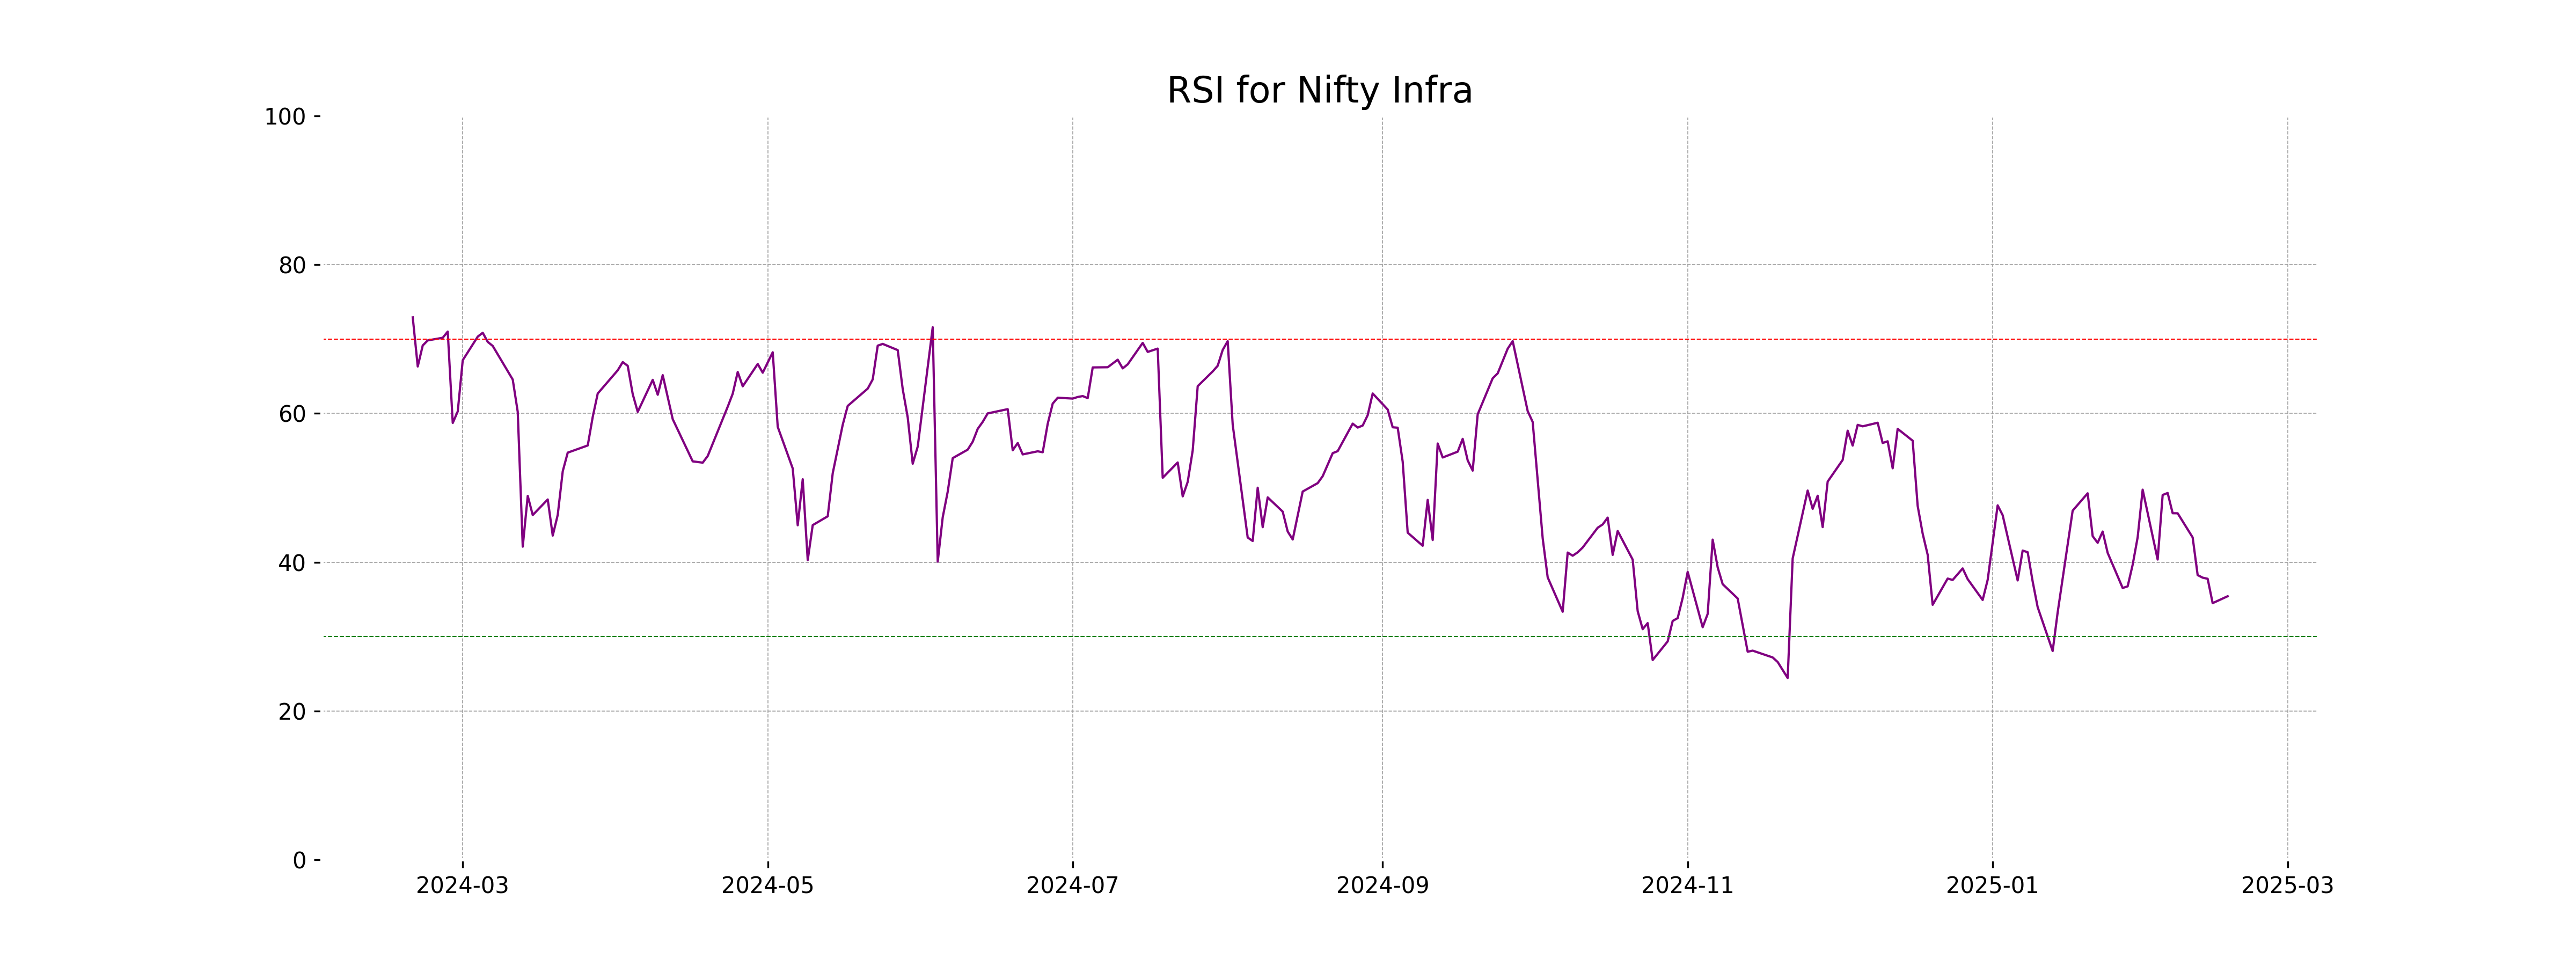
Nifty Infra opened at 7881.25 and closed at 7937.40, showing a slight increase of 0.18%. The RSI is at 35.42, indicating the index may be approaching an oversold region. The MACD is negative at -109.91, suggesting bearish momentum, while it trades below key EMAs, pointing towards a potential continuation of the downtrend.
Relationship with Key Moving Averages
The closing price of Nifty Infra at 7937.40 is below its 50 EMA of 8351.01 and 200 EMA of 8506.39, indicating a bearish trend. Additionally, it is below the 10 EMA of 8070.98 and 20 EMA of 8158.80, further suggesting downward pressure in the short term.
Moving Averages Trend (MACD)
**MACD Analysis for Nifty Infra:** The MACD for Nifty Infra is negative at -109.91, which suggests a bearish sentiment as it is below the signal line at -89.56. This indicates a potential continuation of the downward trend.
RSI Analysis
The RSI value for Nifty Infra is 35.42, which suggests that the index is close to being oversold. An RSI below 30 typically indicates an oversold condition, which might suggest a potential buying opportunity if other indicators align. However, since it's above 30, careful monitoring of other technical indicators is advisable.
Analysis for Nifty IT - February 17, 2025
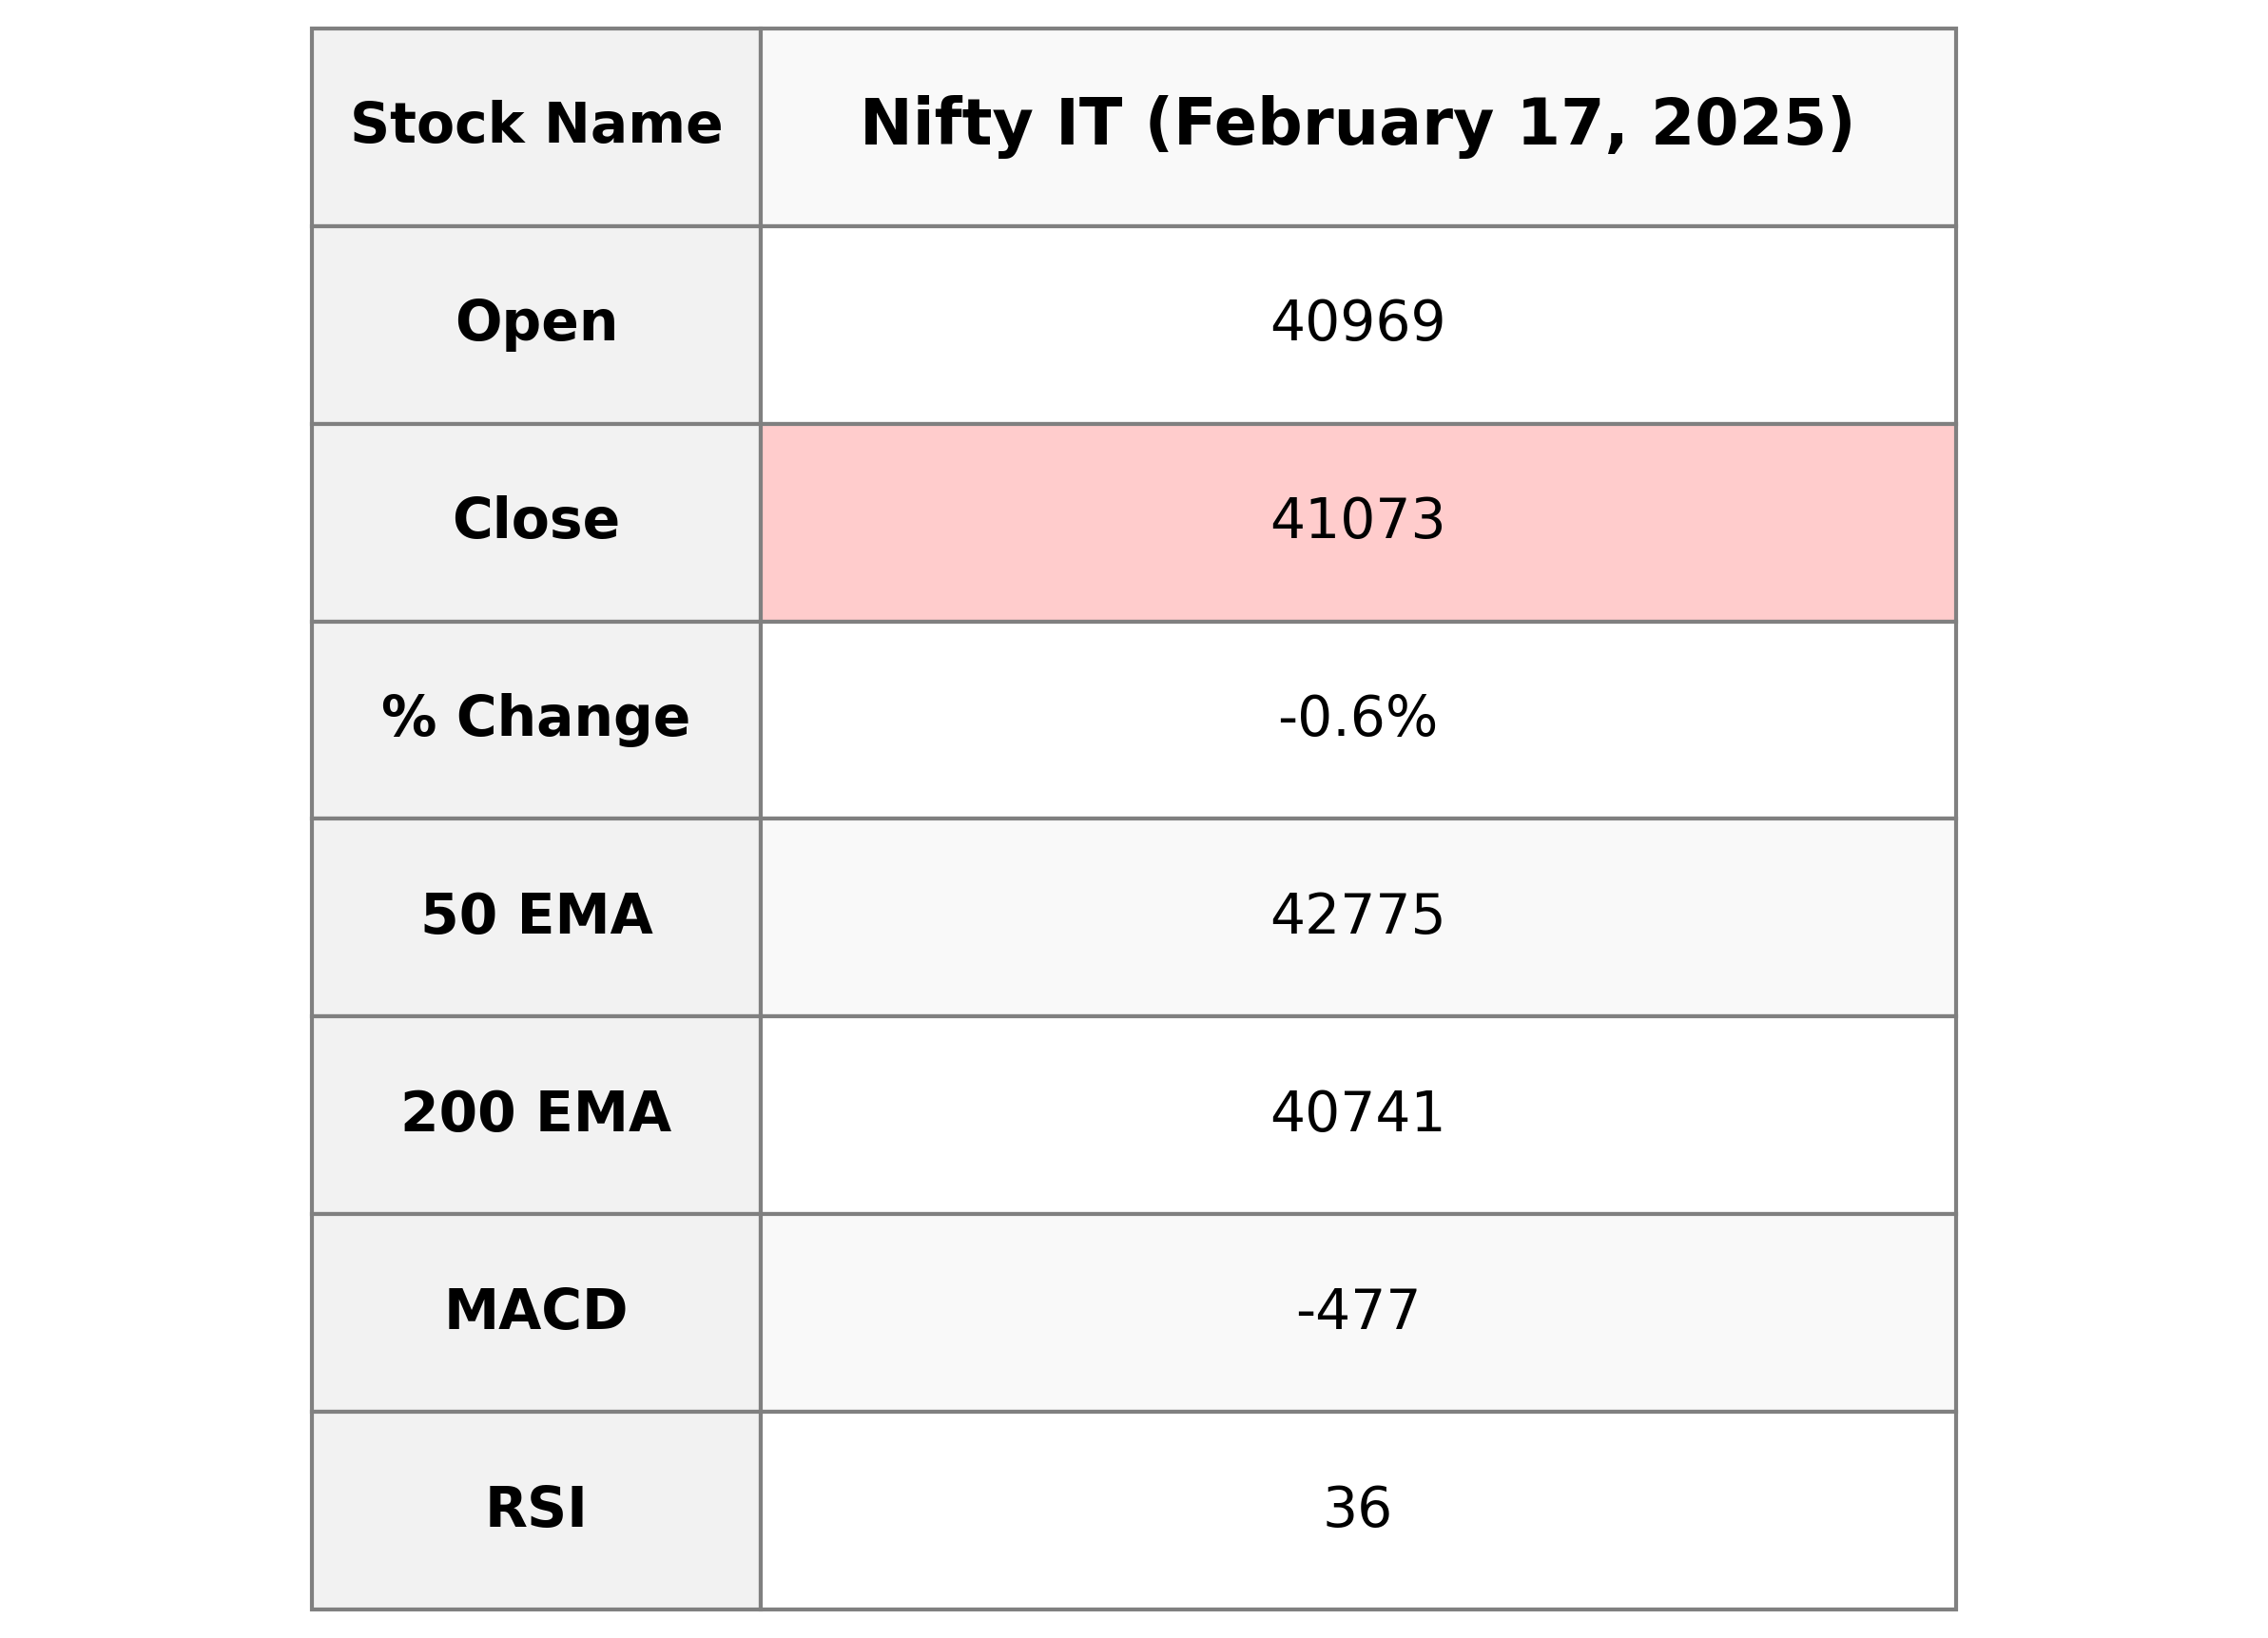
Nifty IT opened at 40968.80 and closed at 41073.20, experiencing a slight decline of 0.58% compared to the previous close of 41311.15, with a points change of -237.95. The RSI is relatively low at 36.26, indicating potential overselling. The MACD is negative, with a reading of -476.92 against a signal of -345.66, suggesting a downward trend.
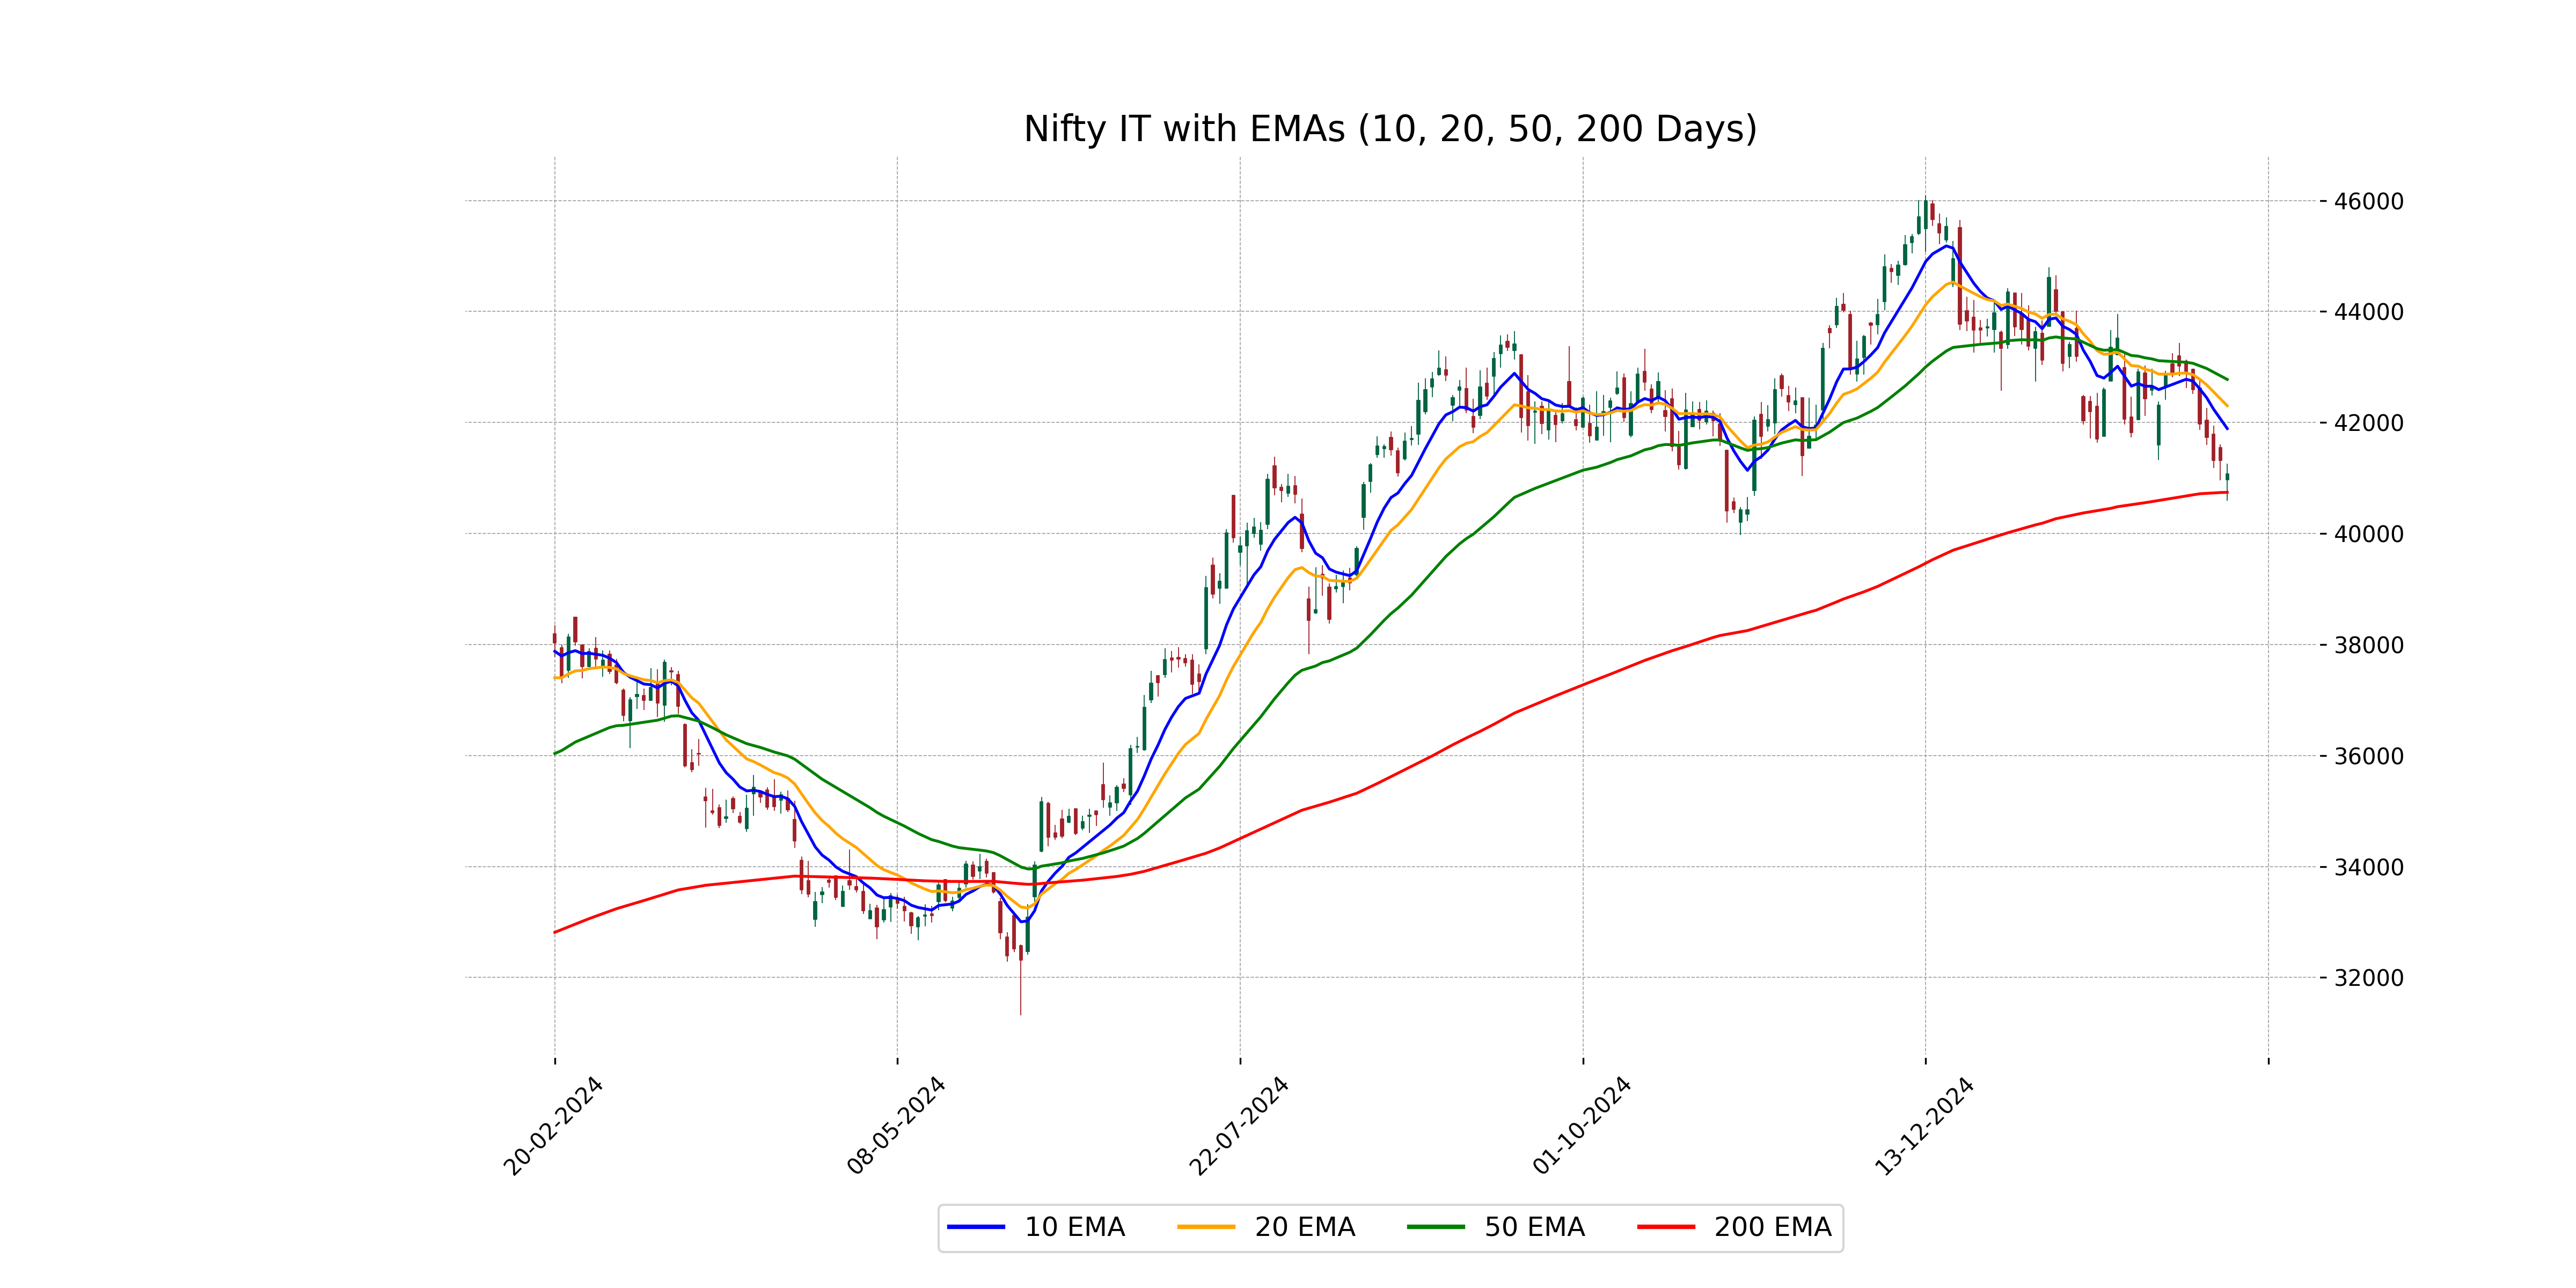
Relationship with Key Moving Averages
The closing price of Nifty IT (41073.20) is below the 50-day EMA (42775.27), indicating a potential downward trend. It is slightly above the 200-day EMA (40740.83), suggesting long-term bullishness. Additionally, the close is below both the 10-day (41889.87) and 20-day (42300.75) EMAs, reinforcing short-term bearish sentiment.
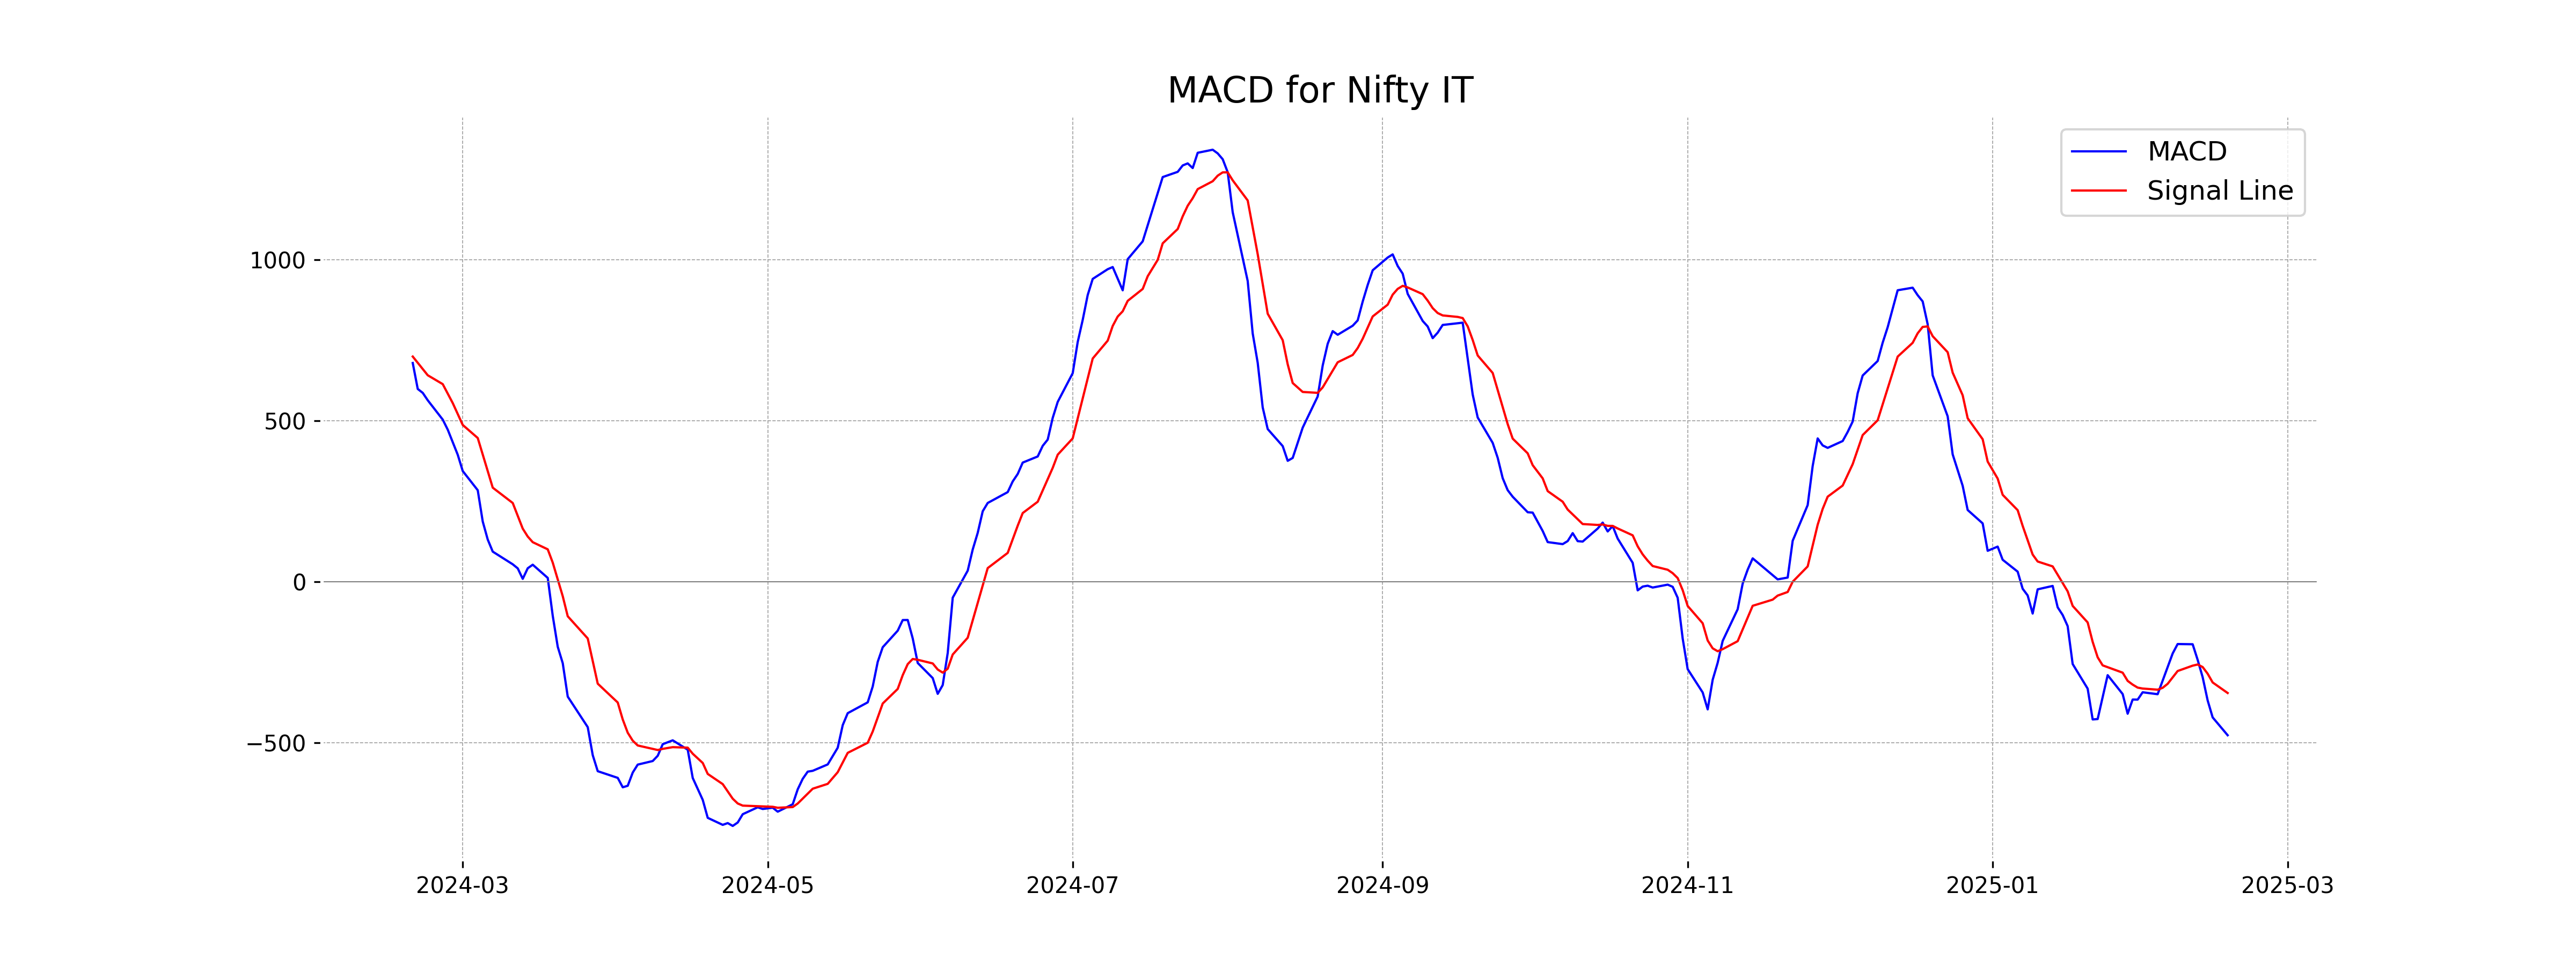
Moving Averages Trend (MACD)
Nifty IT's MACD of -476.92 is below its signal line of -345.66, indicating a bearish momentum. This suggests potential continued downward price pressure, as reflected in the negative MACD value compared to the signal line.
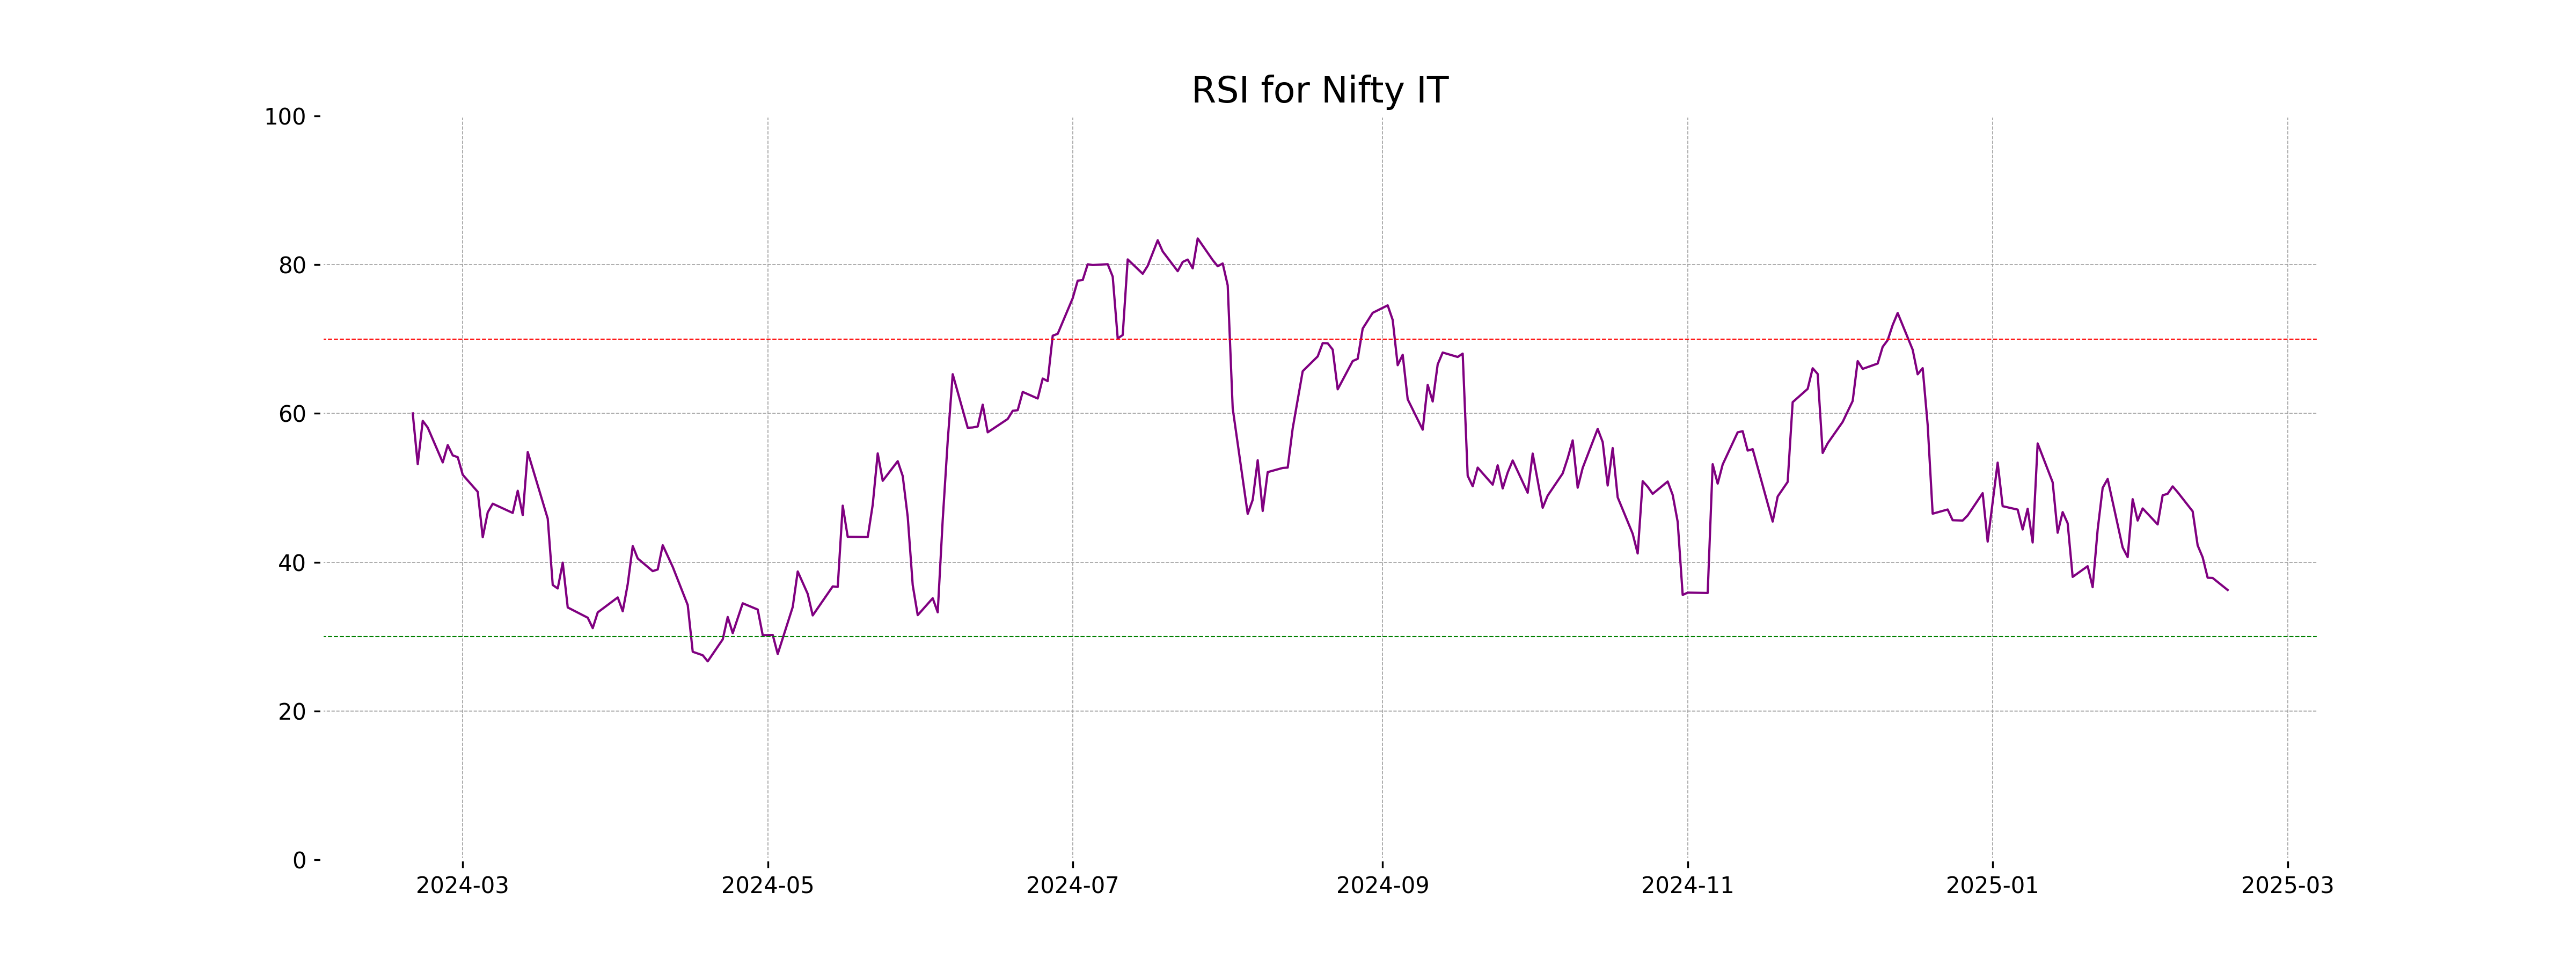
RSI Analysis
Based on the provided data, the Nifty IT index shows a Relative Strength Index (RSI) of 36.26. An RSI below 30 is typically considered oversold, while a value near 36 suggests it is nearing oversold territory, indicating potential for a reversal or continued weakness in the near term.
Analysis for Nifty Metal - February 17, 2025

Nifty Metal opened at 8155.40 and closed at 8250.20, showing a positive change of 0.77% with a points increase of 62.70 from the previous close. The current RSI is 45.21, indicating mild bearish momentum, while the MACD shows a slight improvement as it's less negative than the MACD Signal. Despite closing above its lows, the index remains below its 50 EMA and 200 EMA, suggesting an overall bearish trend.
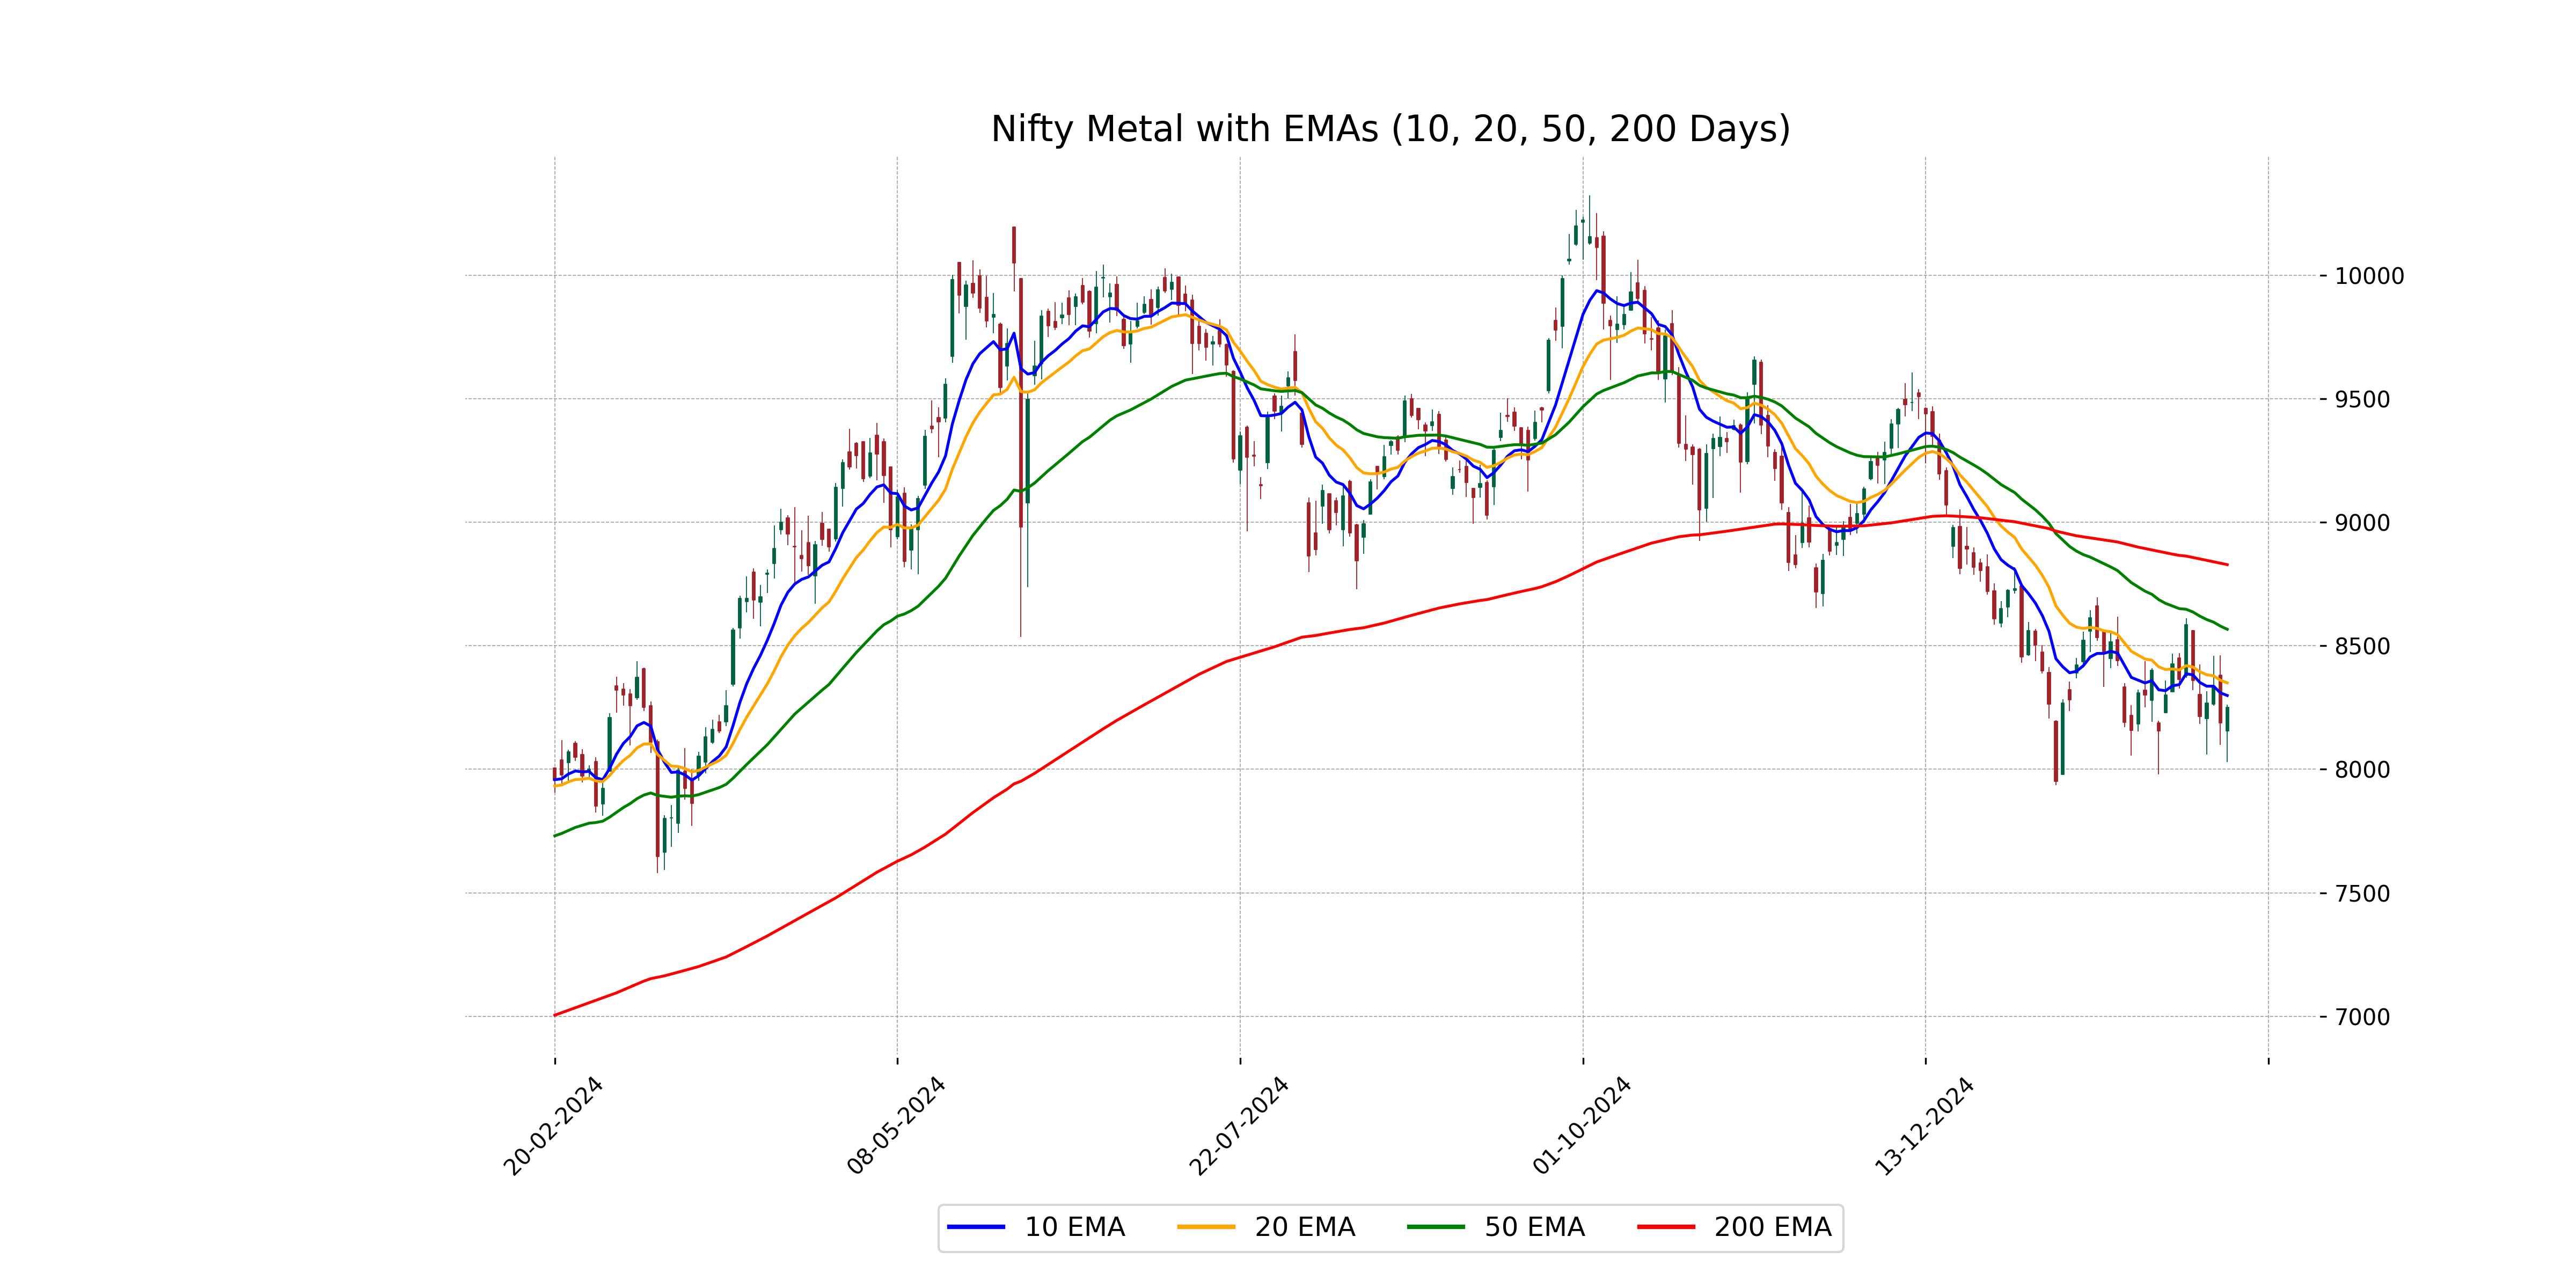
Relationship with Key Moving Averages
The closing price of Nifty Metal at 8250.20 is below its 10 EMA at 8298.39, 50 EMA at 8566.38, and 200 EMA at 8828.10. This indicates a bearish trend, as the current price is below these key moving averages, suggesting potential resistance at these levels.
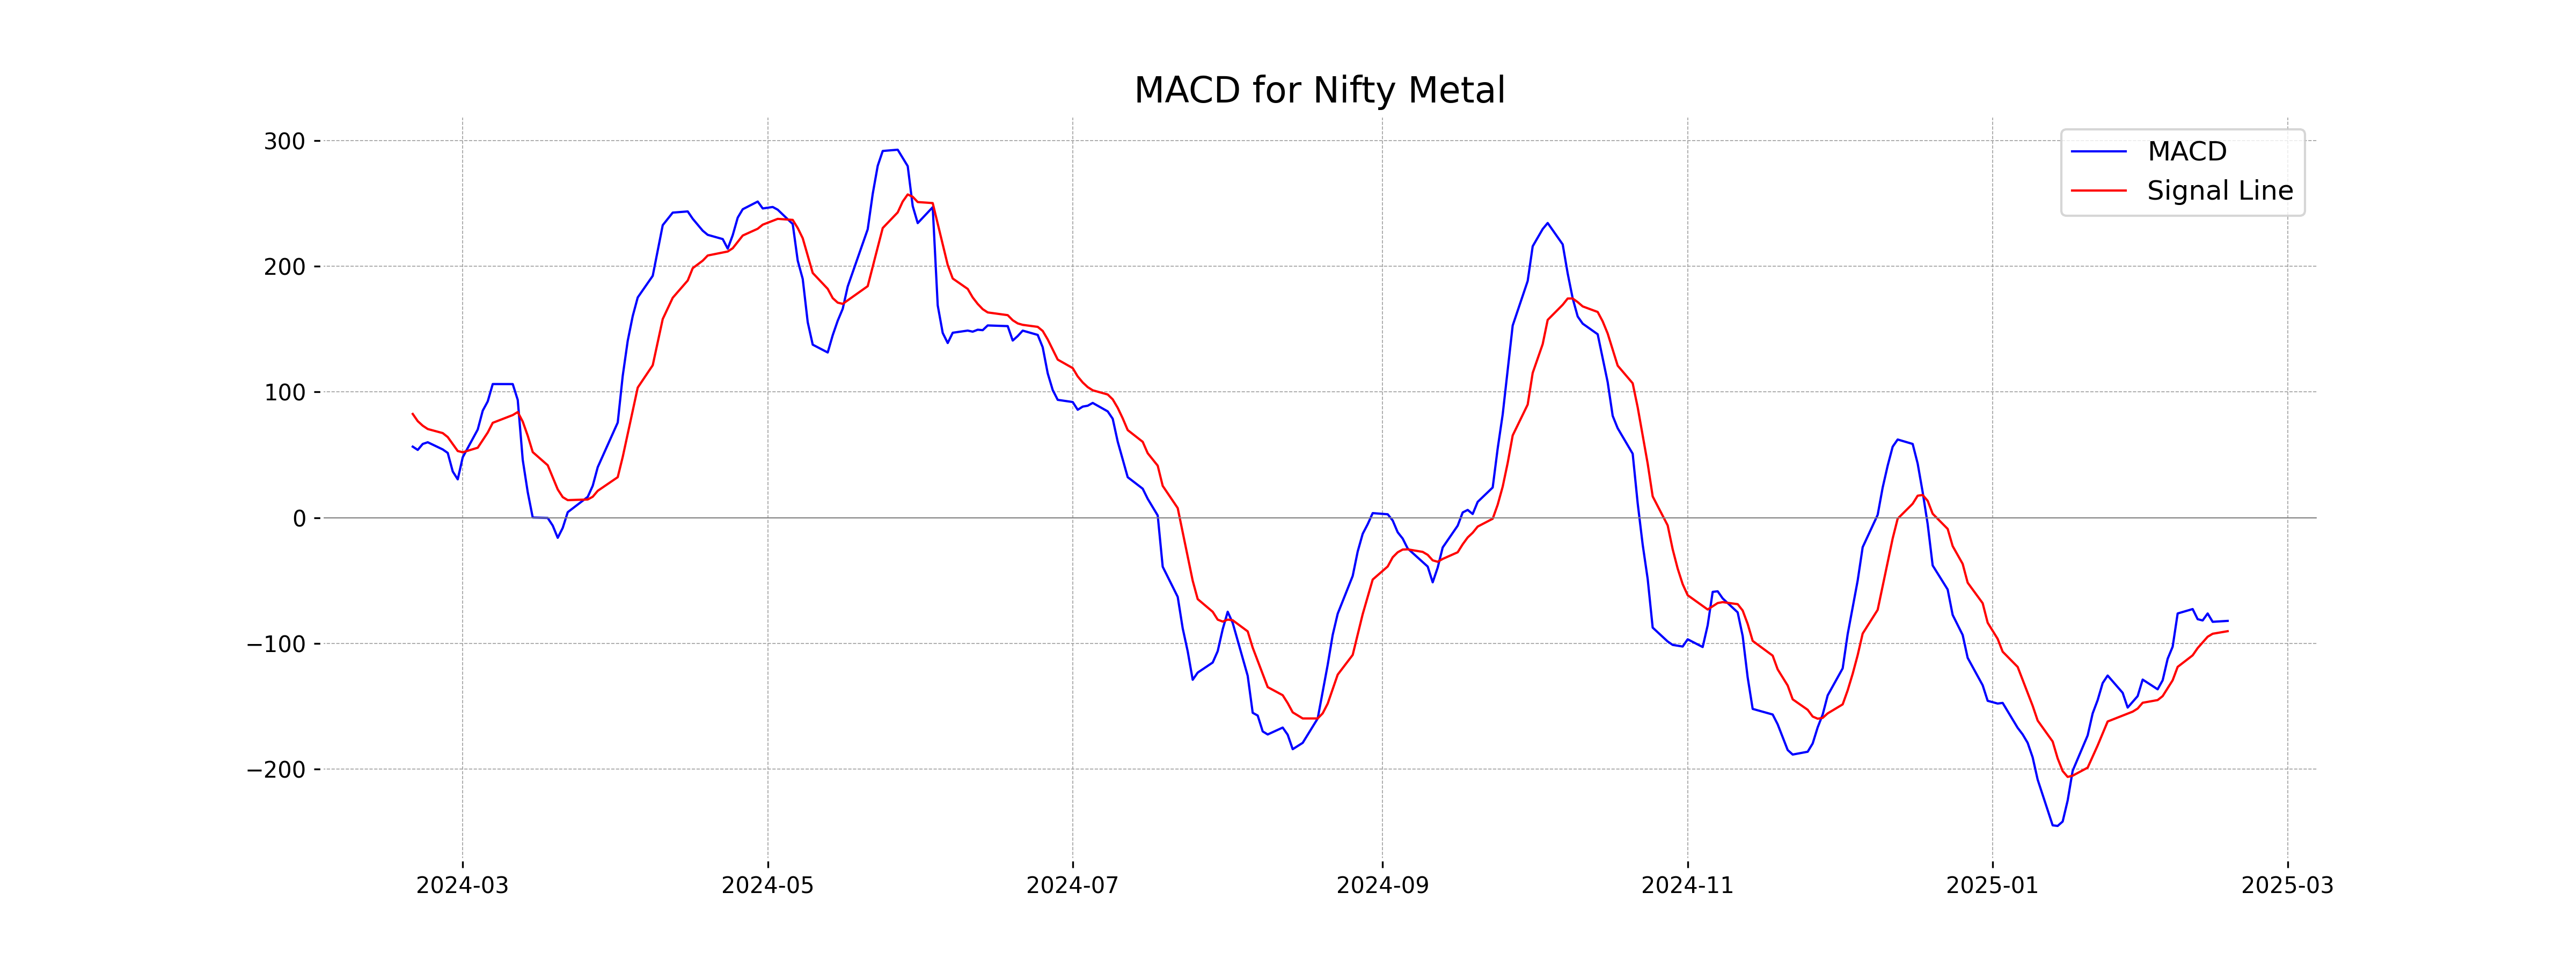
Moving Averages Trend (MACD)
The MACD for Nifty Metal is at -82.127, with the MACD Signal at -90.321. This indicates a negative trend, as the MACD is below the signal line, suggesting bearish momentum.
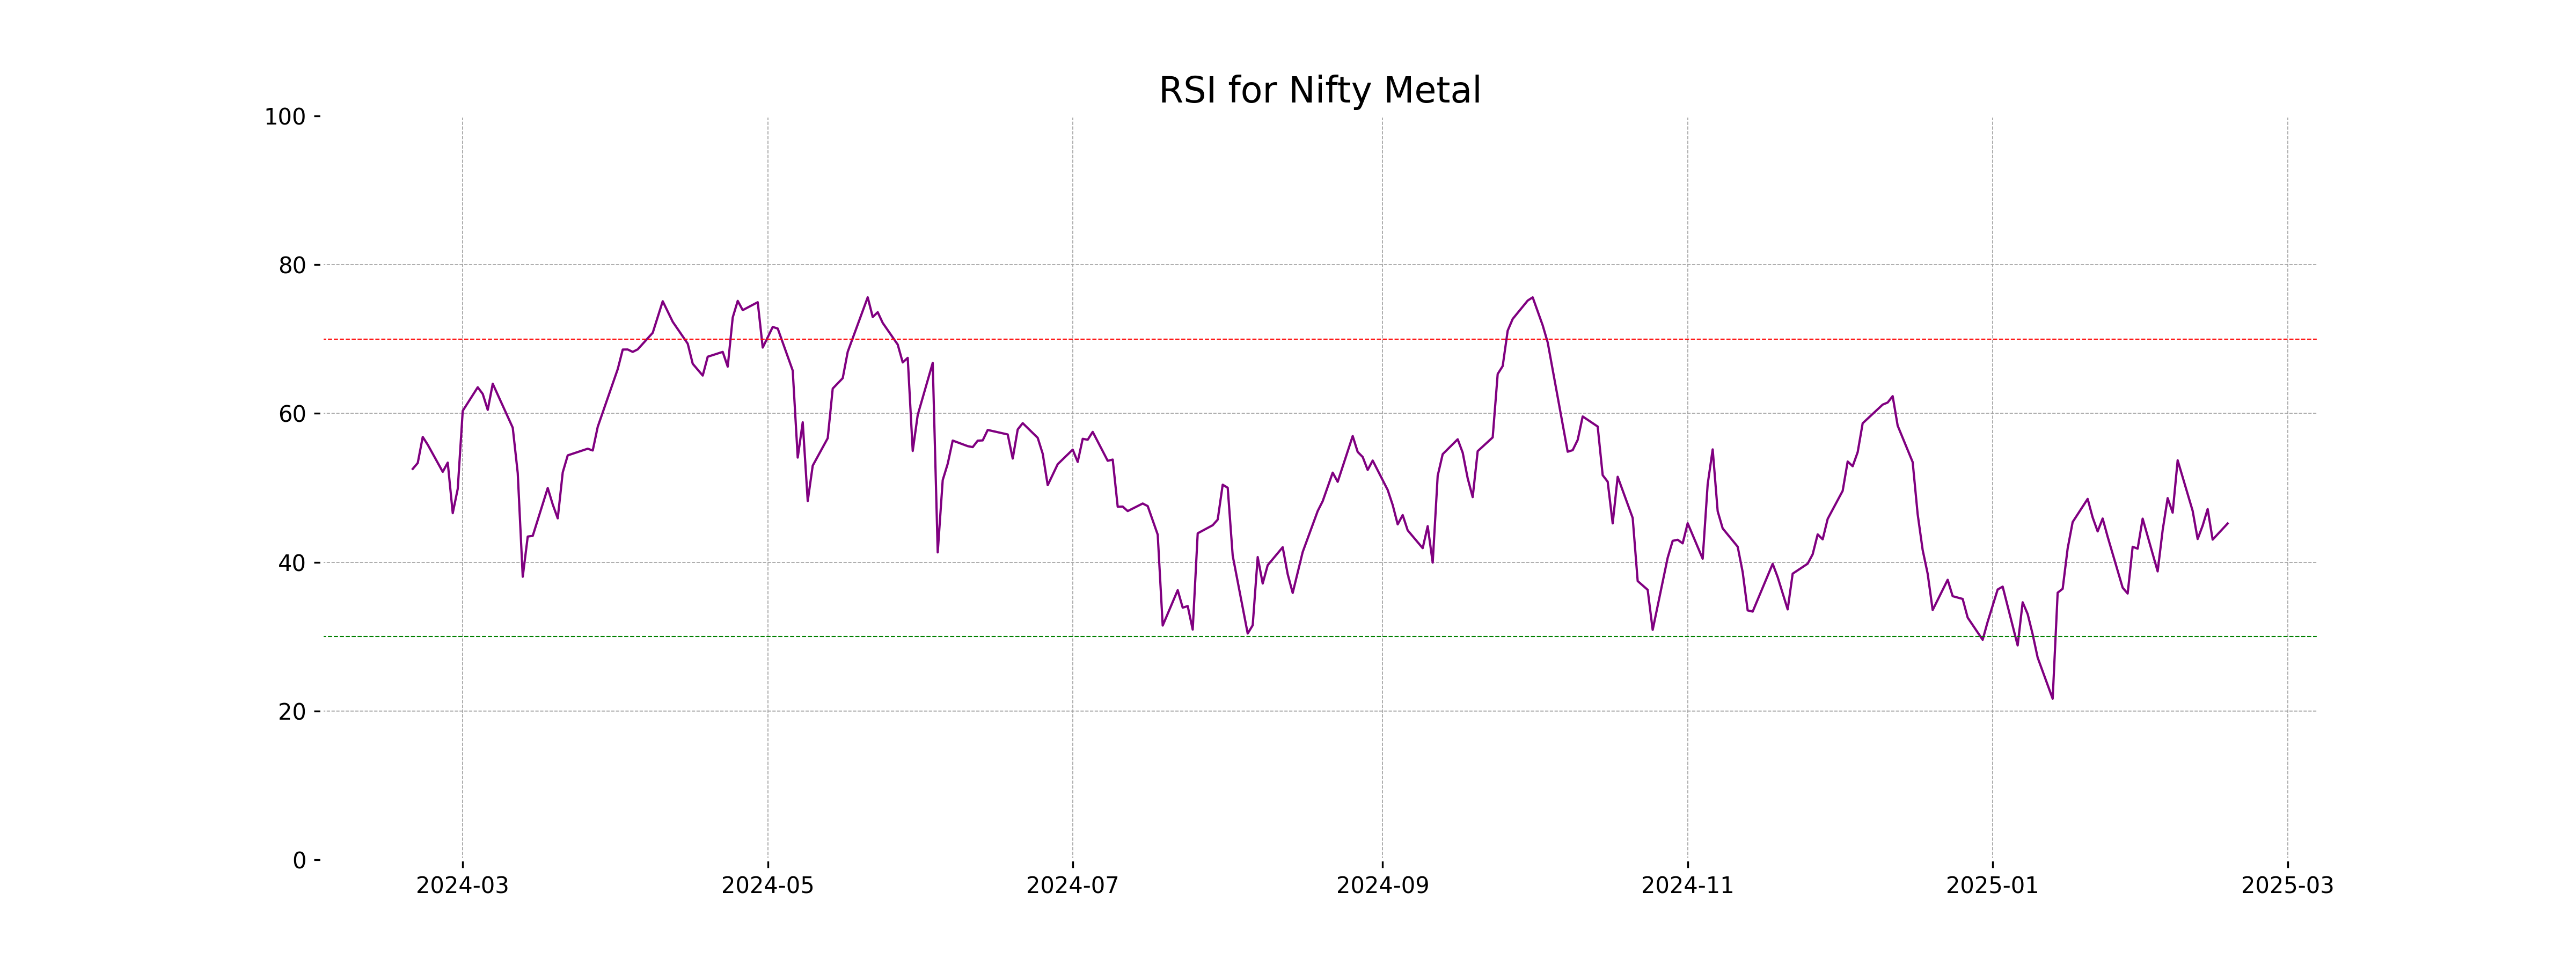
RSI Analysis
The current RSI for Nifty Metal is 45.21, indicating that the stock is in a neutral territory. This suggests neither overbought nor oversold conditions, implying potential stability in price movements.
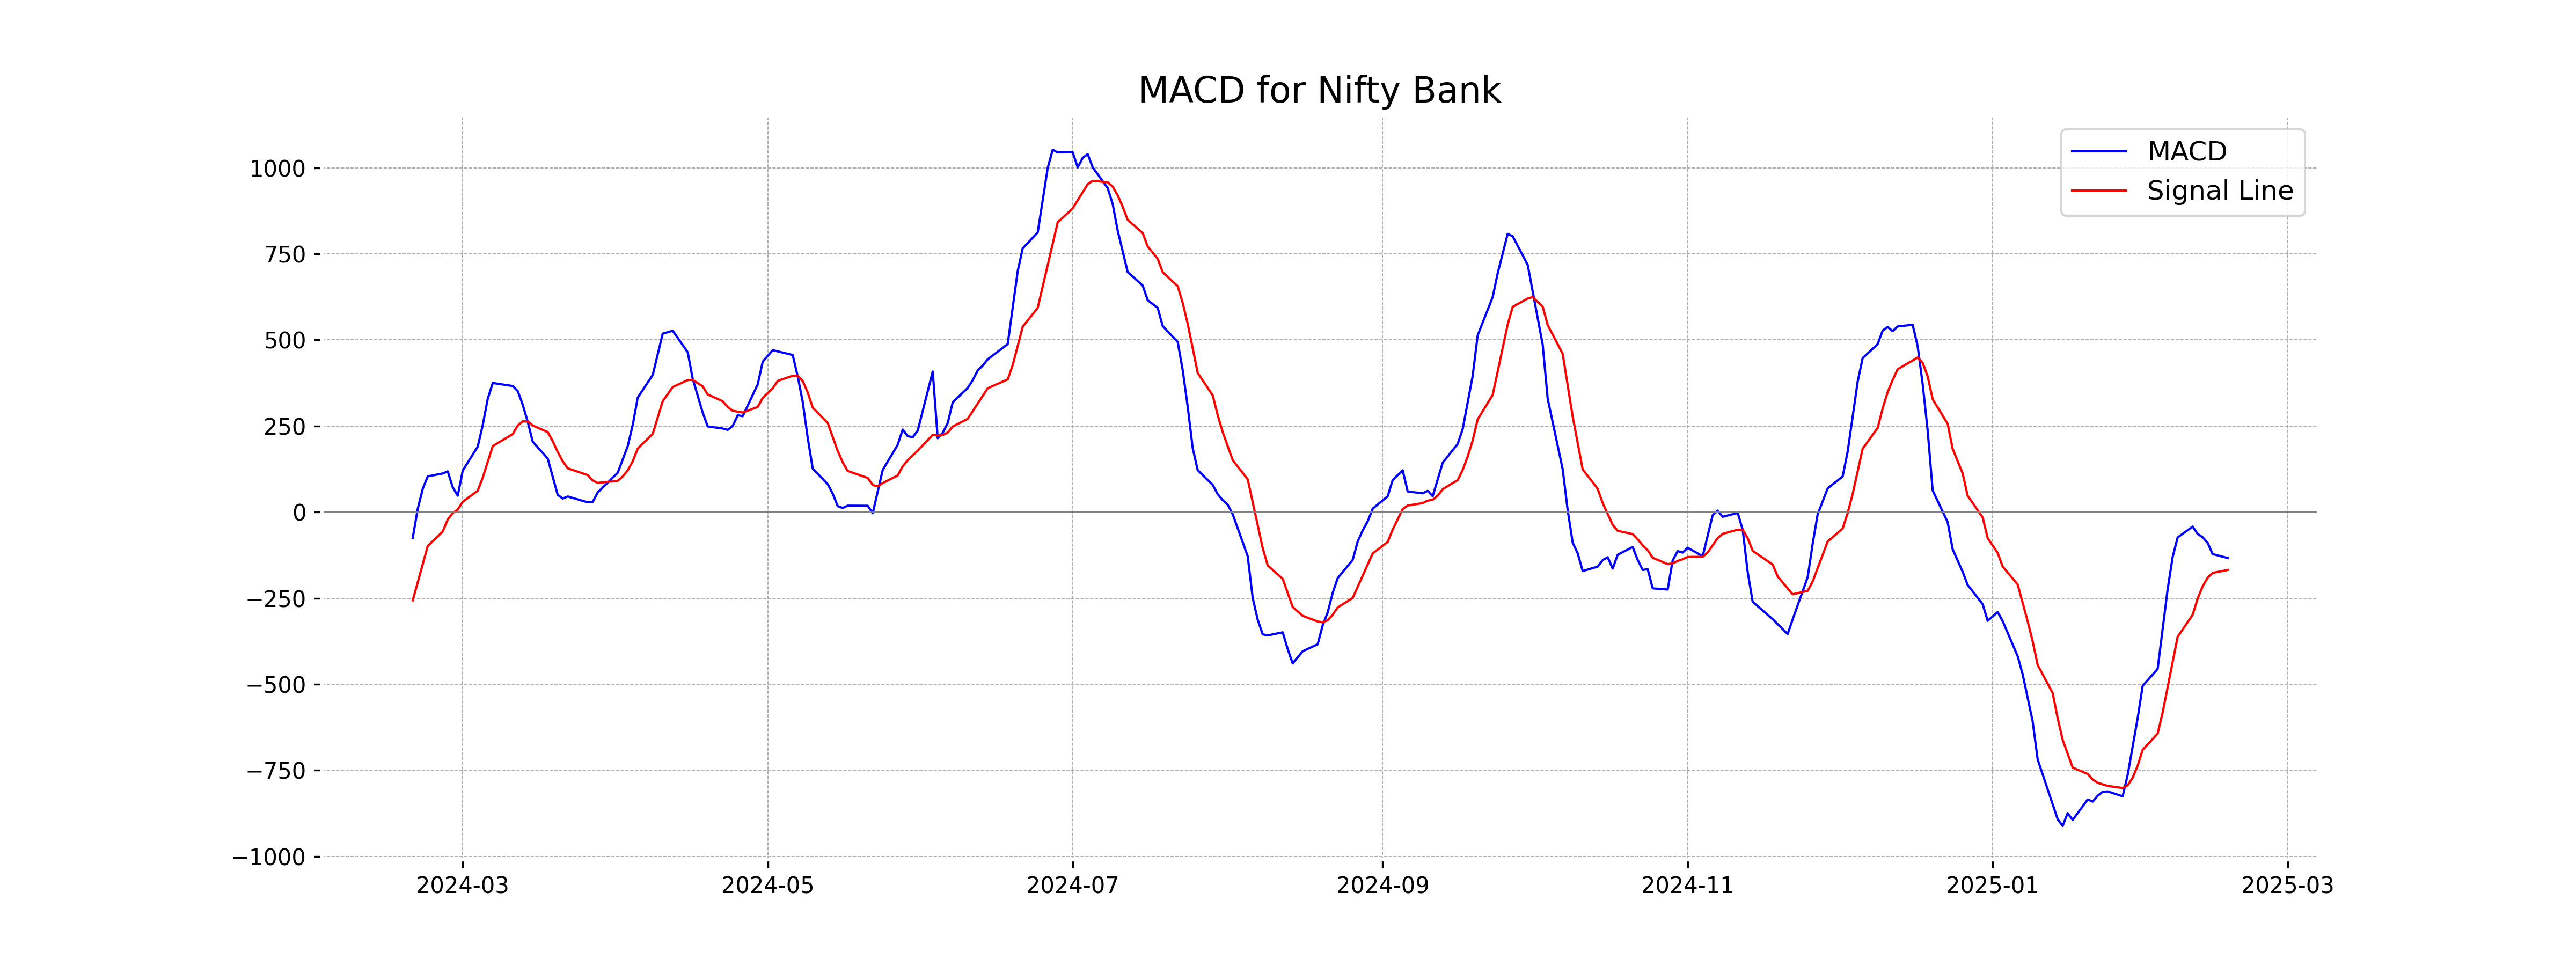
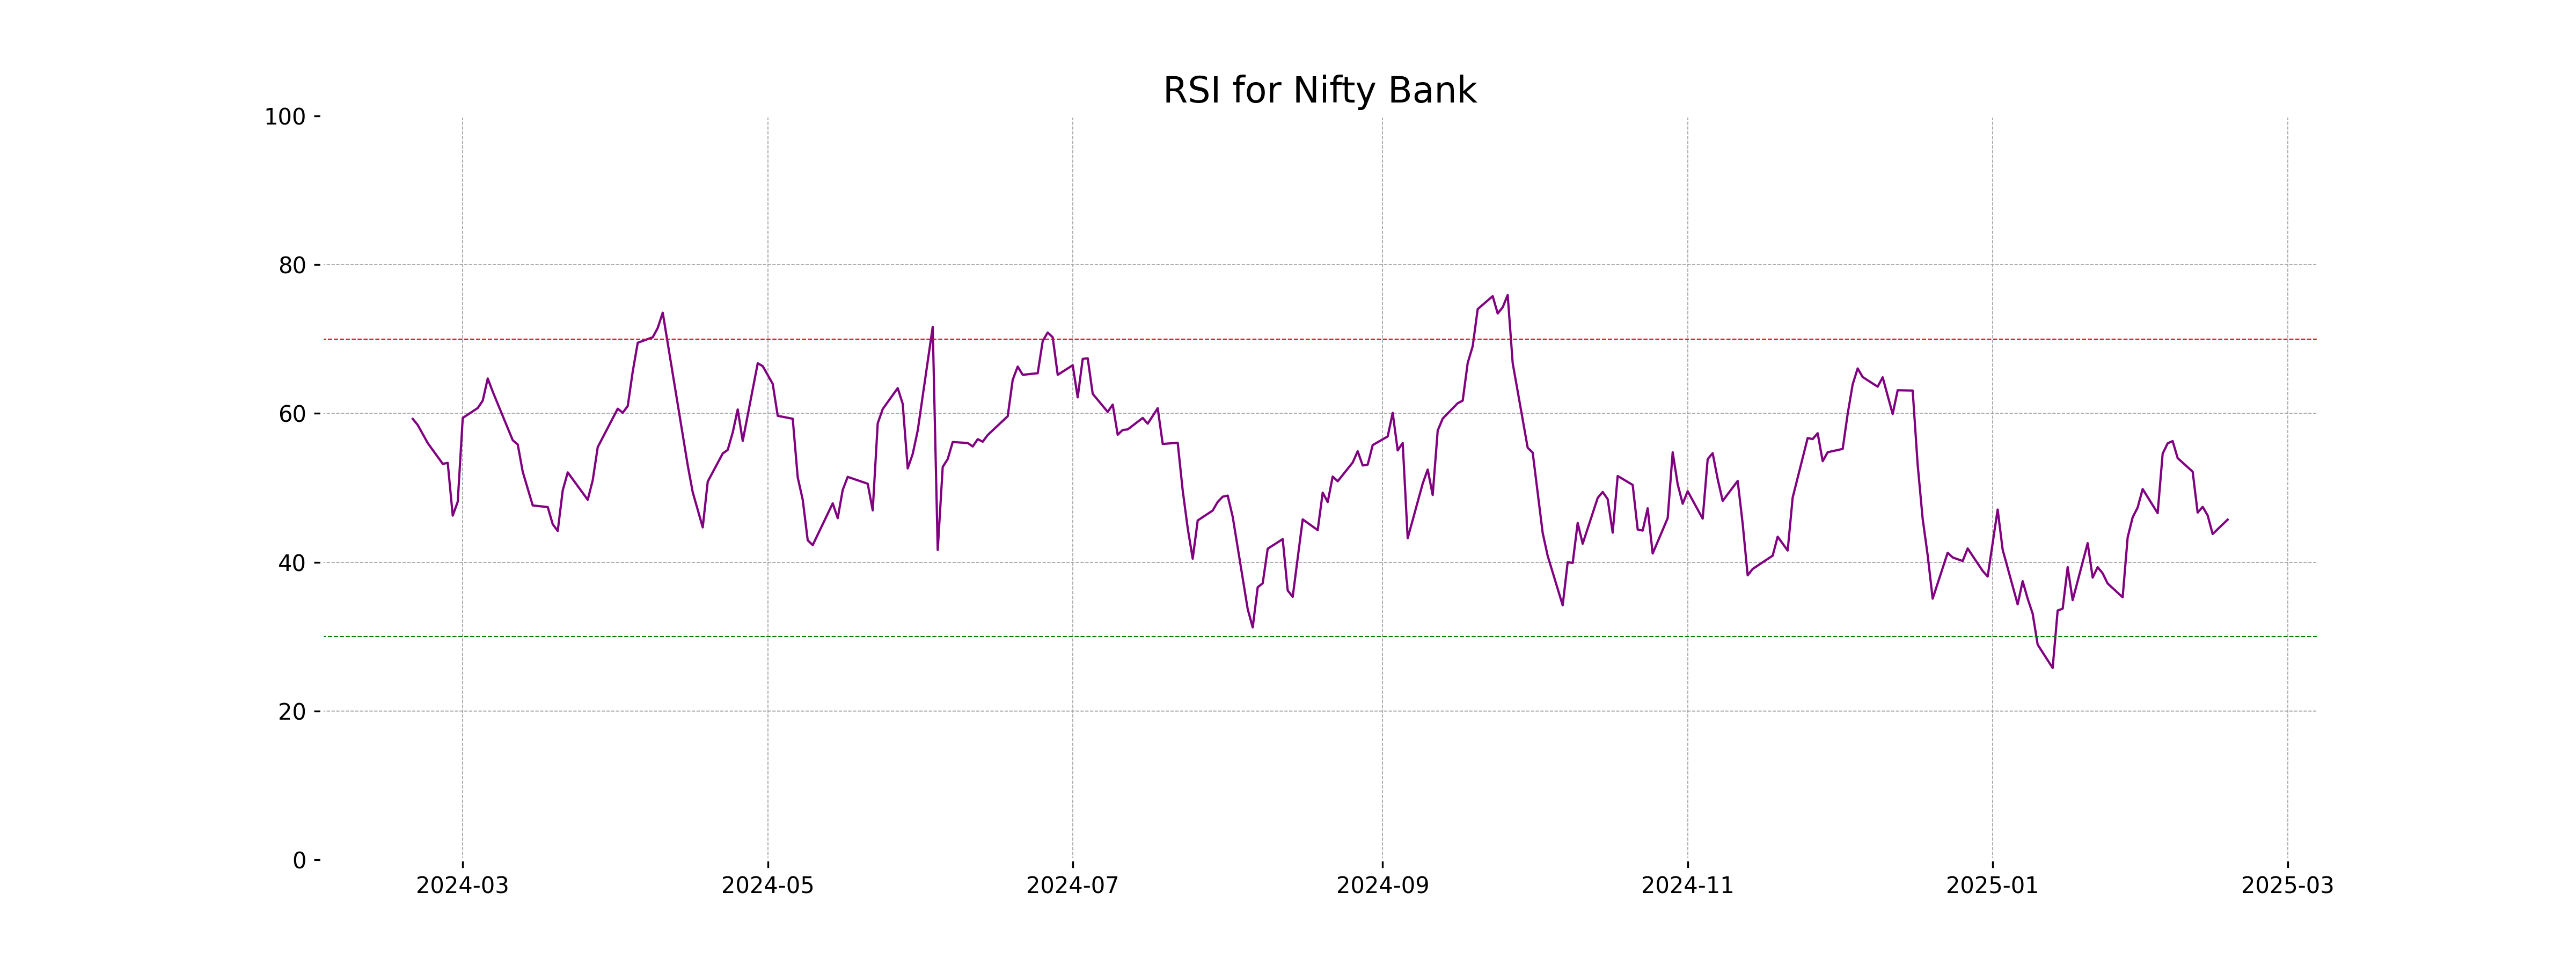
Analysis for Nifty Bank - February 17, 2025

Nifty Bank opened at 48,880.40, with a high of 49,319.00 and a low of 48,525.60, closing at 49,258.90. It gained 159.45 points, marking a 0.32% increase from the previous close of 49,099.45. The RSI stands at 45.73, indicating slight bearish momentum, and the MACD is at -133.38, showing potential for recovery.
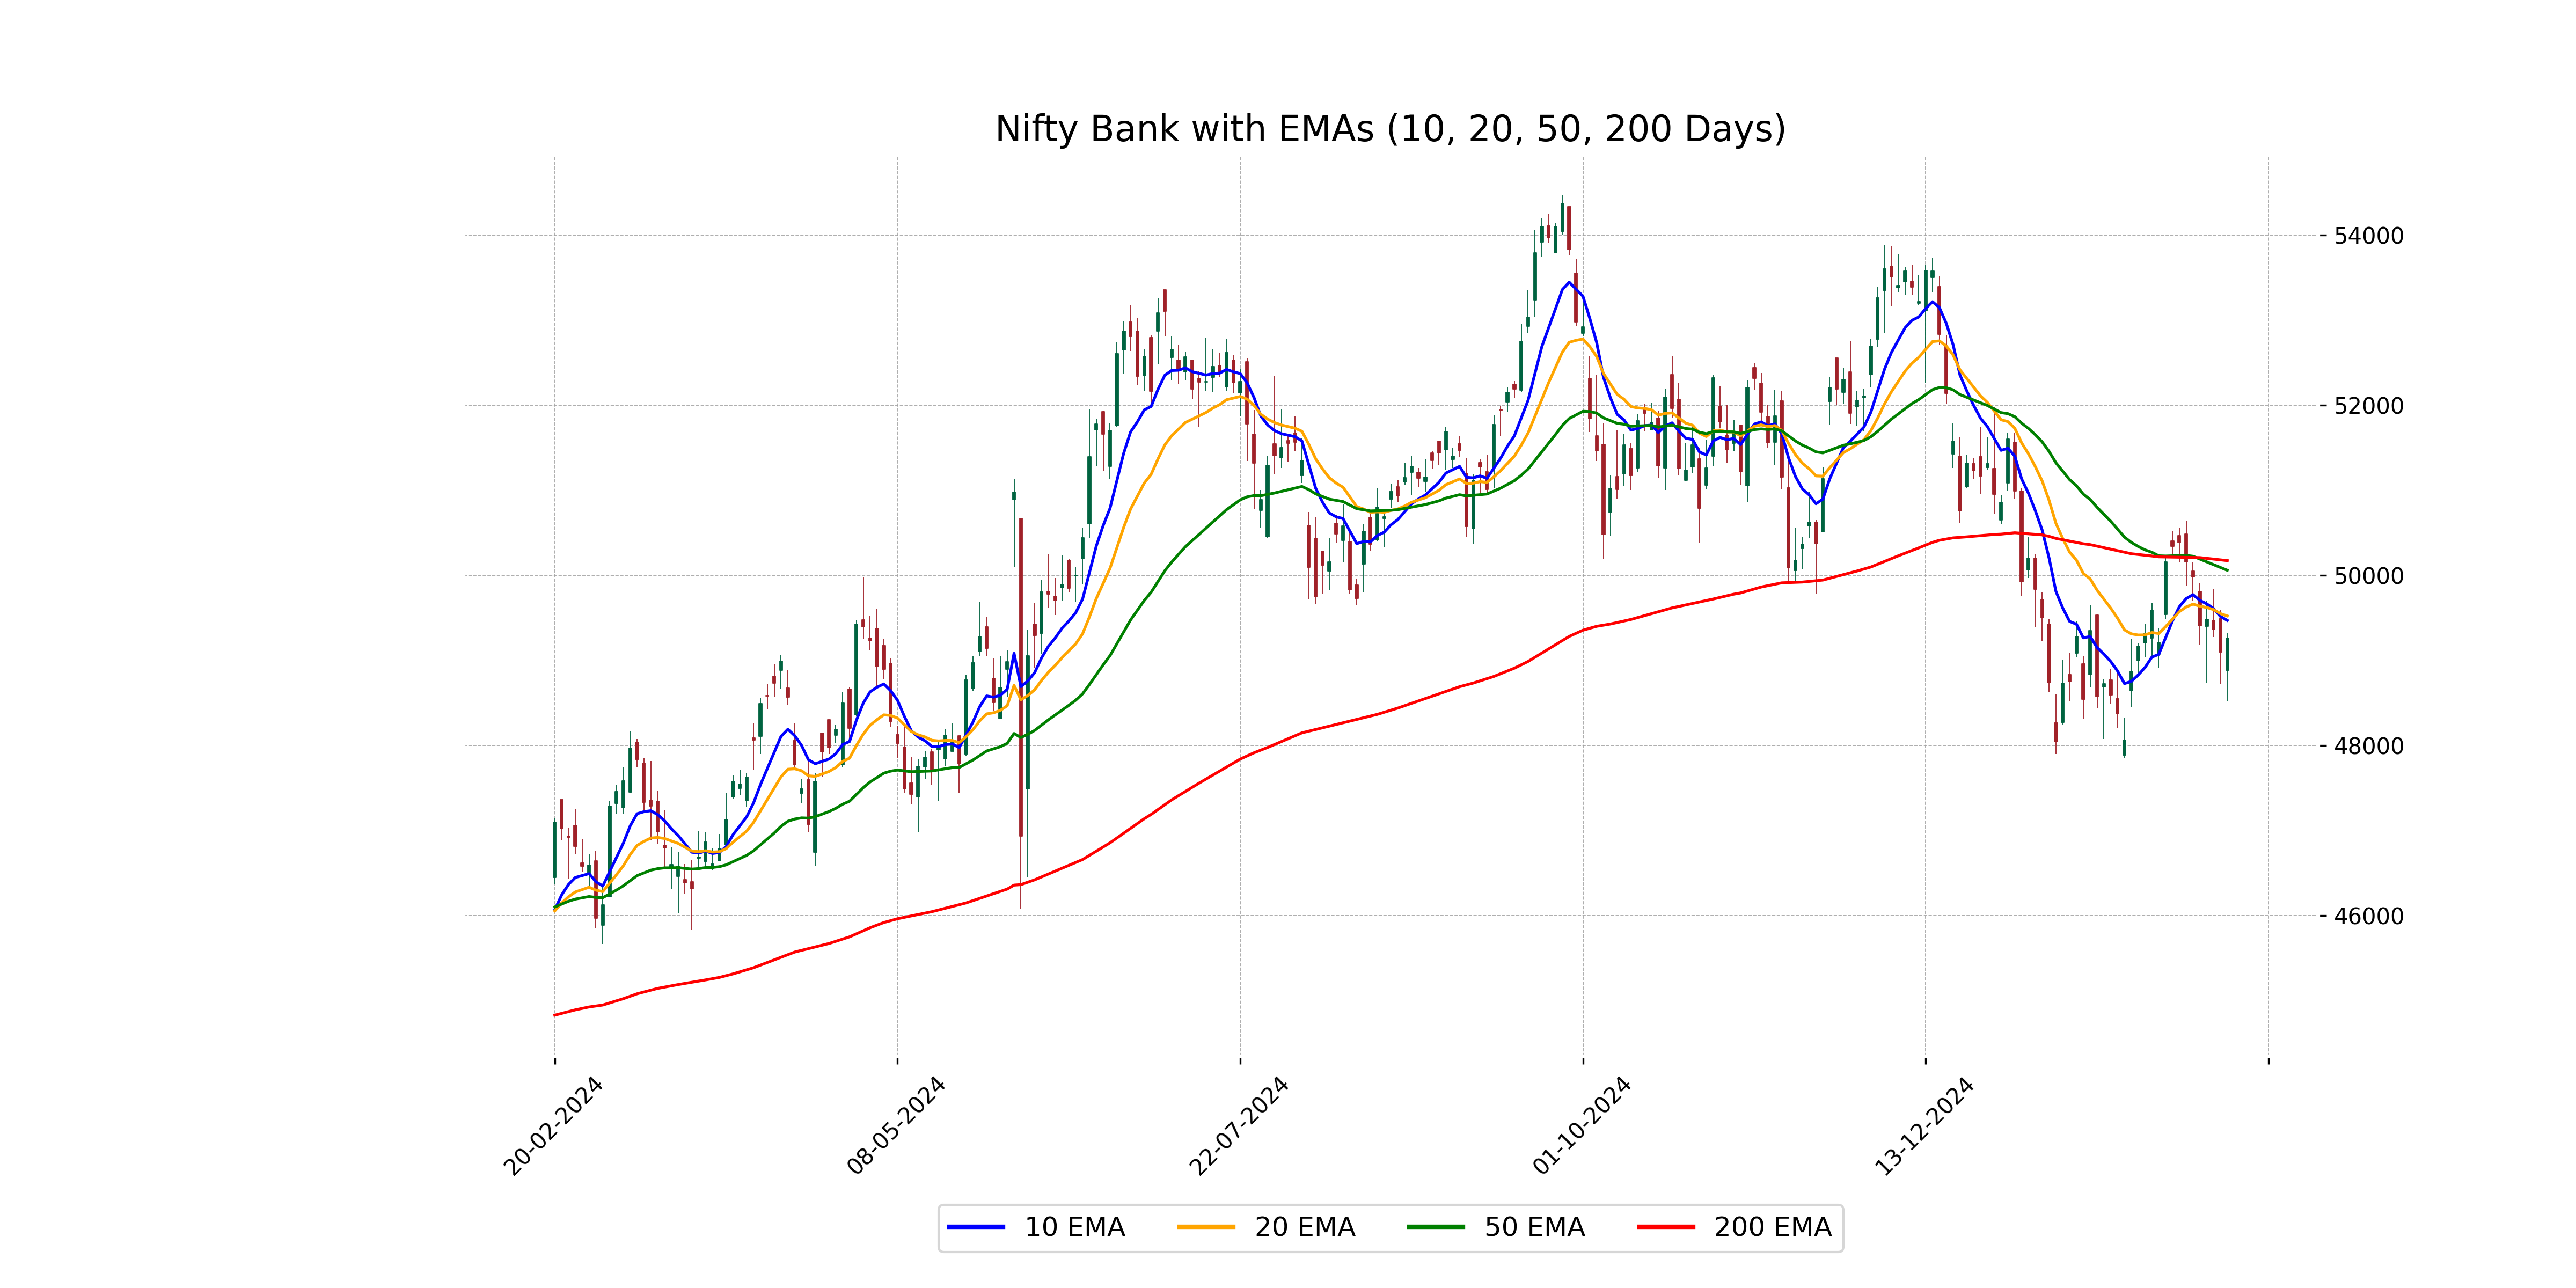
Relationship with Key Moving Averages
The Nifty Bank index closed at 49258.90, which is below its 50-day EMA of 50059.24 and 200-day EMA of 50172.58, indicating potential bearish sentiment in the medium to long term. However, it is slightly below its 10-day EMA of 49469.44 and 20-day EMA of 49521.51, suggesting potential short-term resistance.
Moving Averages Trend (MACD)
The MACD for Nifty Bank is -133.38, while the MACD Signal is -168.04, indicating a bullish crossover is approaching. This typically suggests a potential upcoming shift towards a bullish momentum as the MACD is moving closer to crossing above the signal line.
RSI Analysis
RSI for Nifty Bank is at 45.73, indicating a neutral market condition. If RSI moves towards 30, it would suggest an oversold condition, whereas a move towards 70 would indicate an overbought situation. Currently, RSI suggests no strong momentum in either direction.
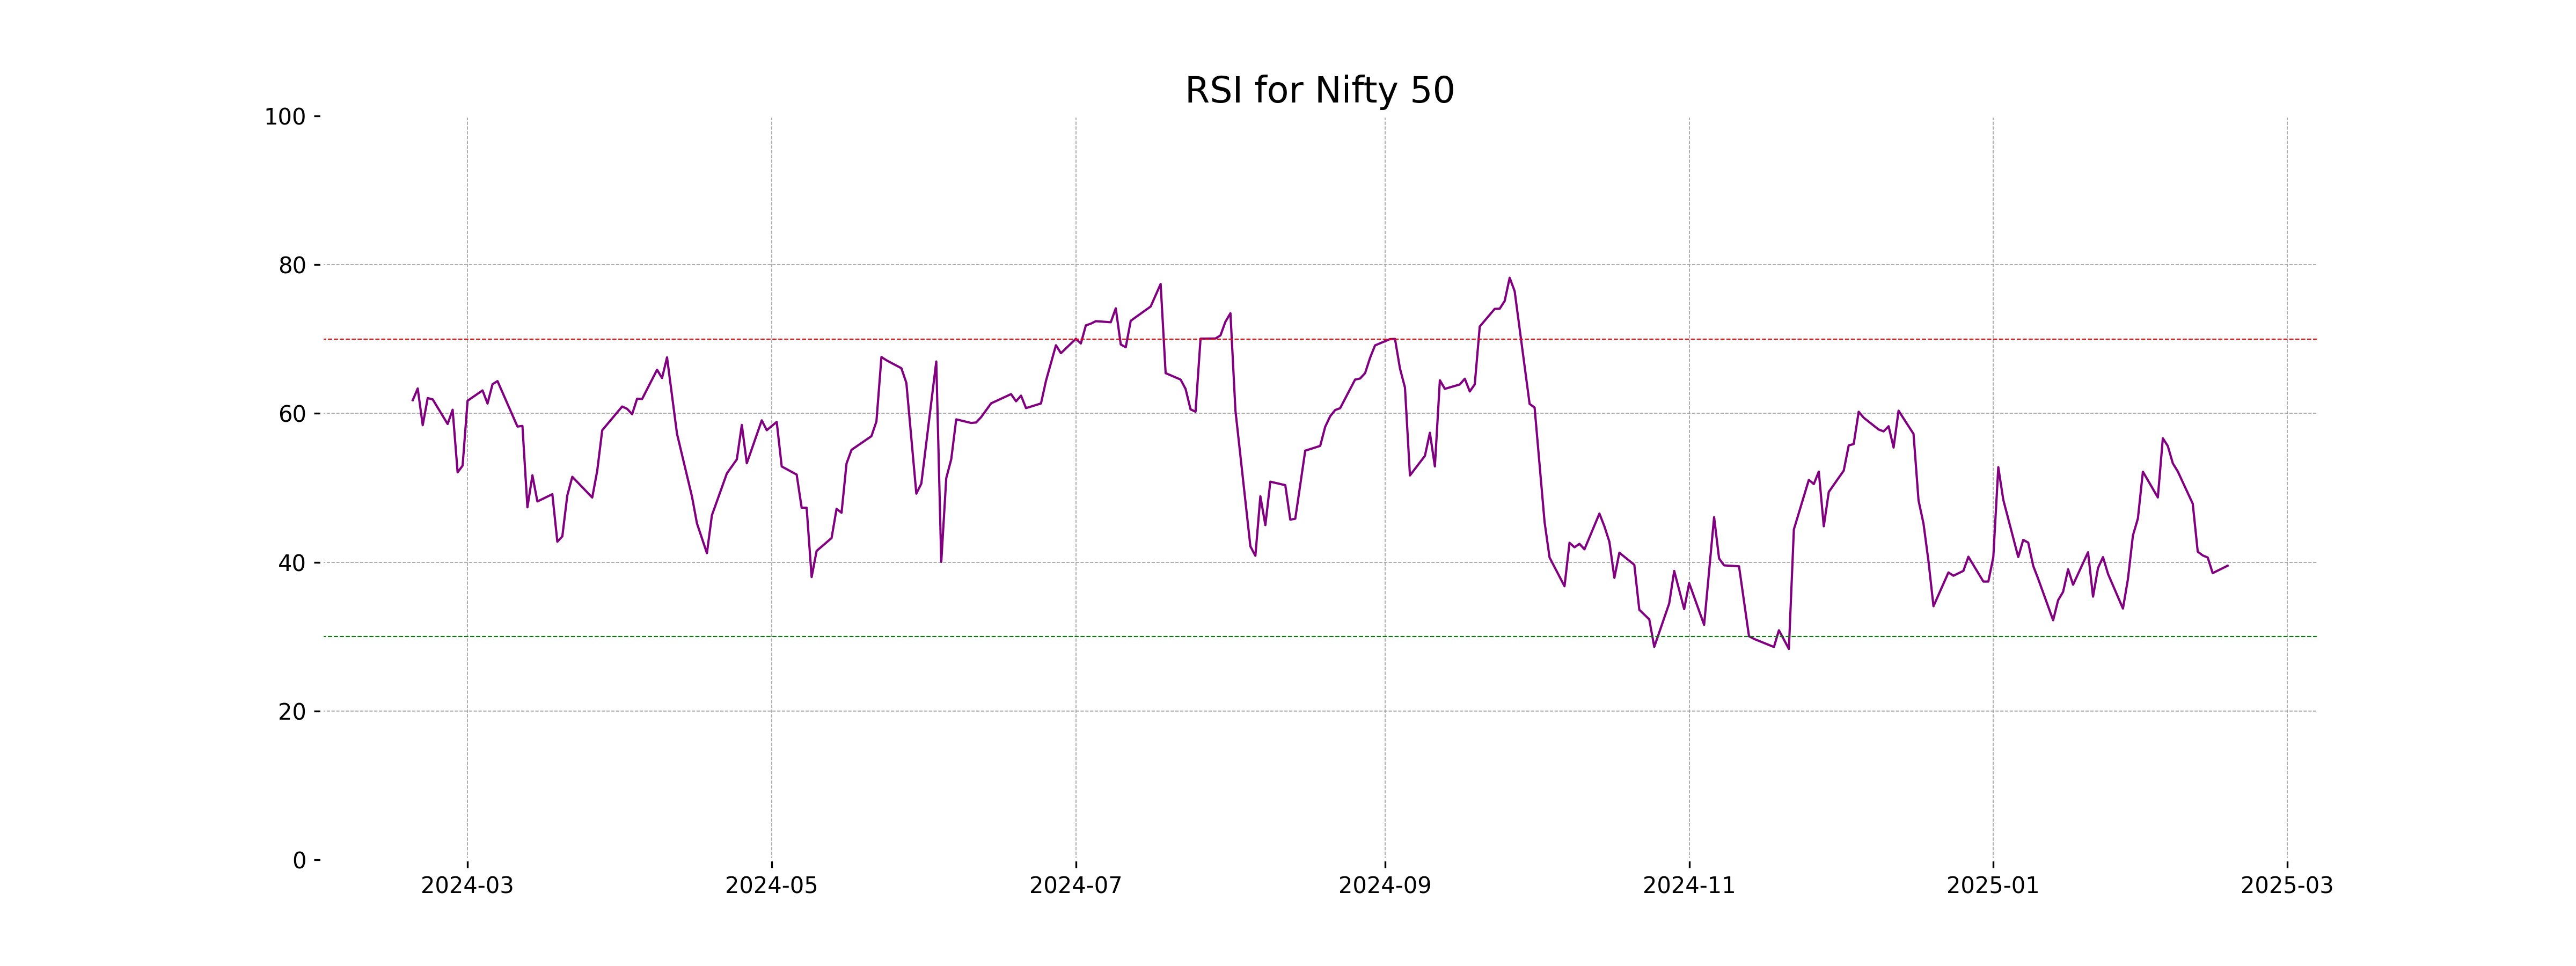
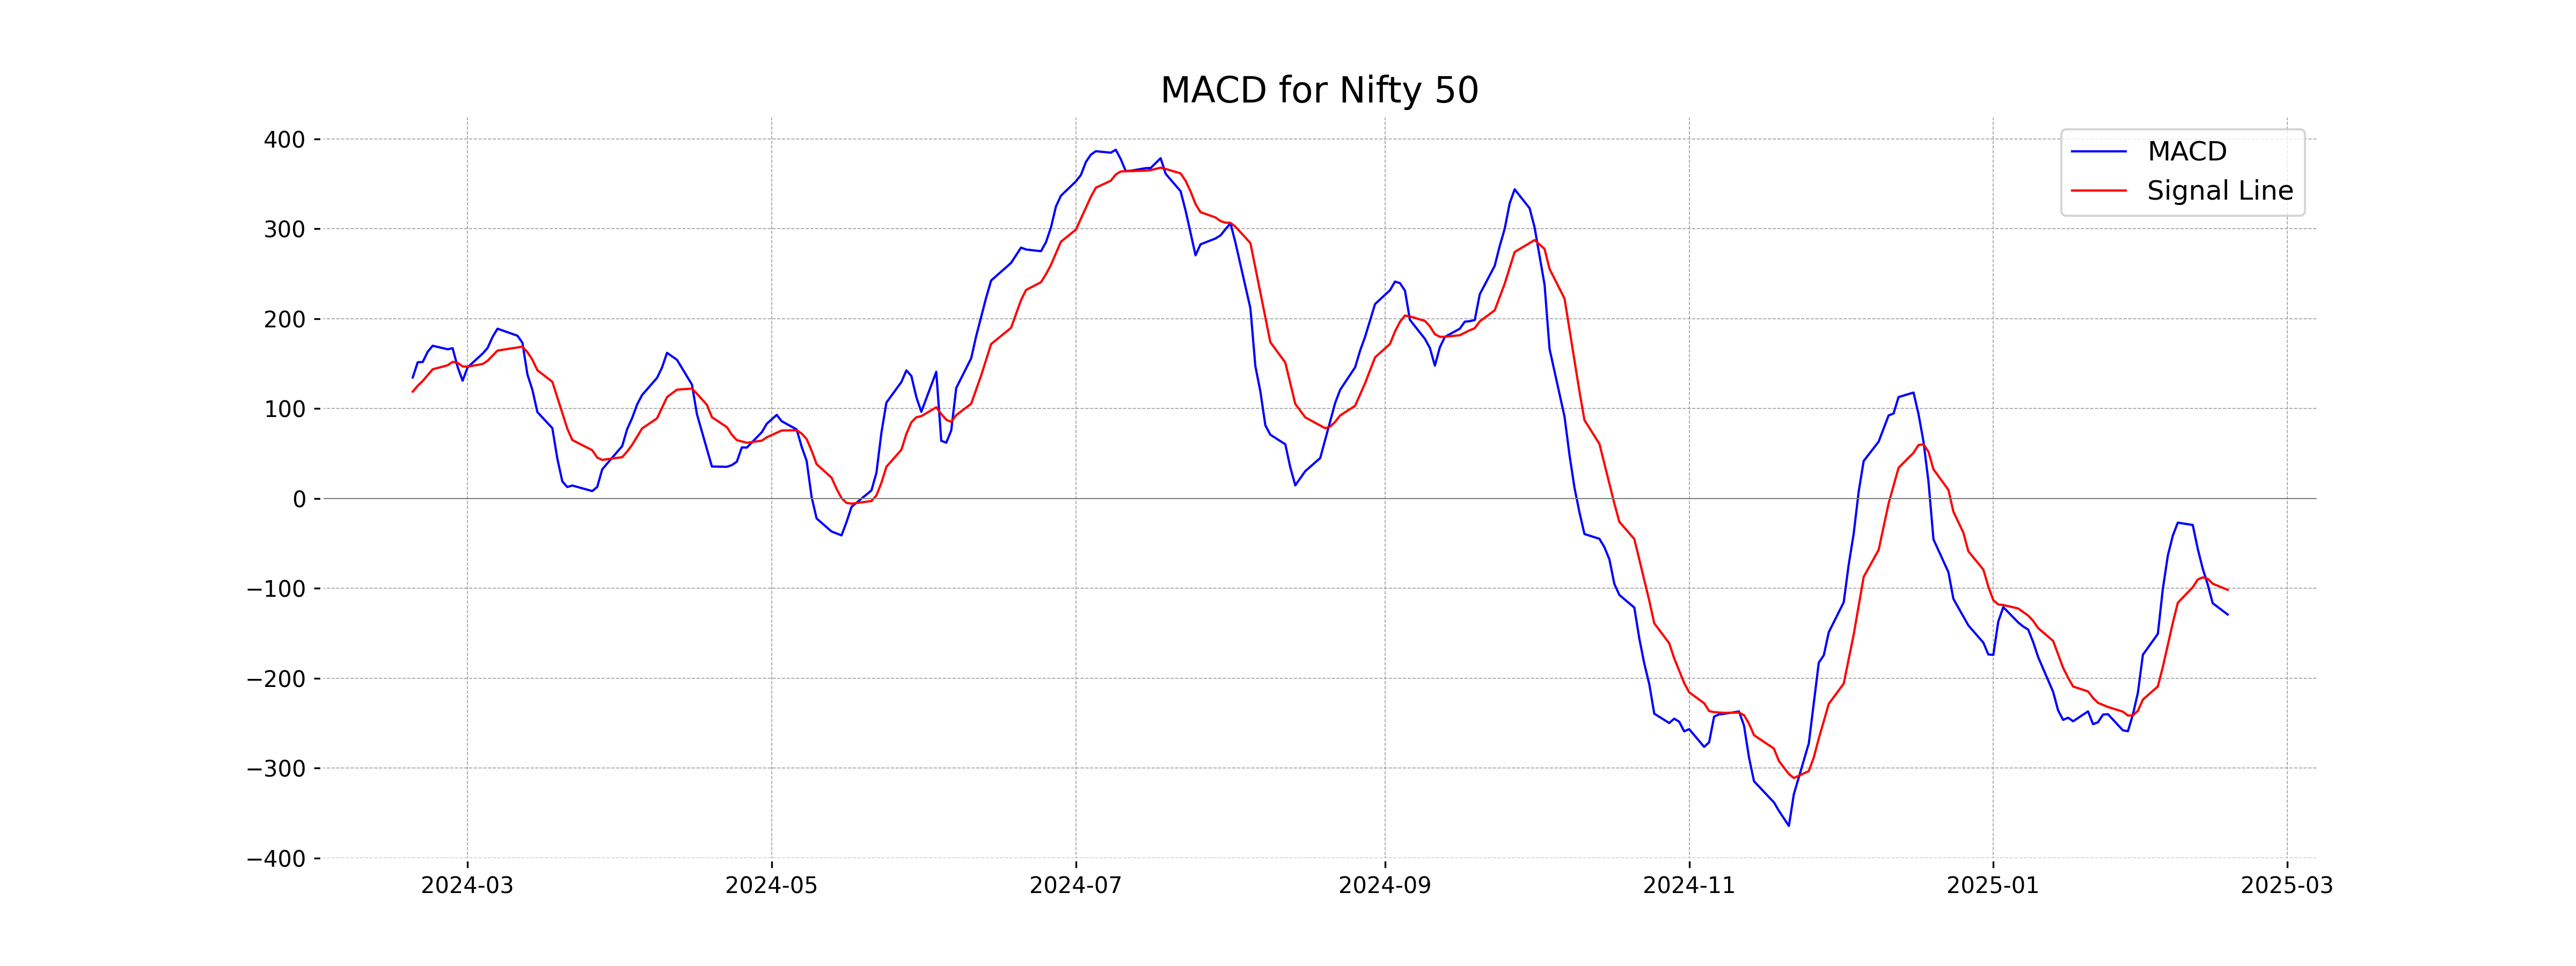
Analysis for Nifty 50 - February 17, 2025
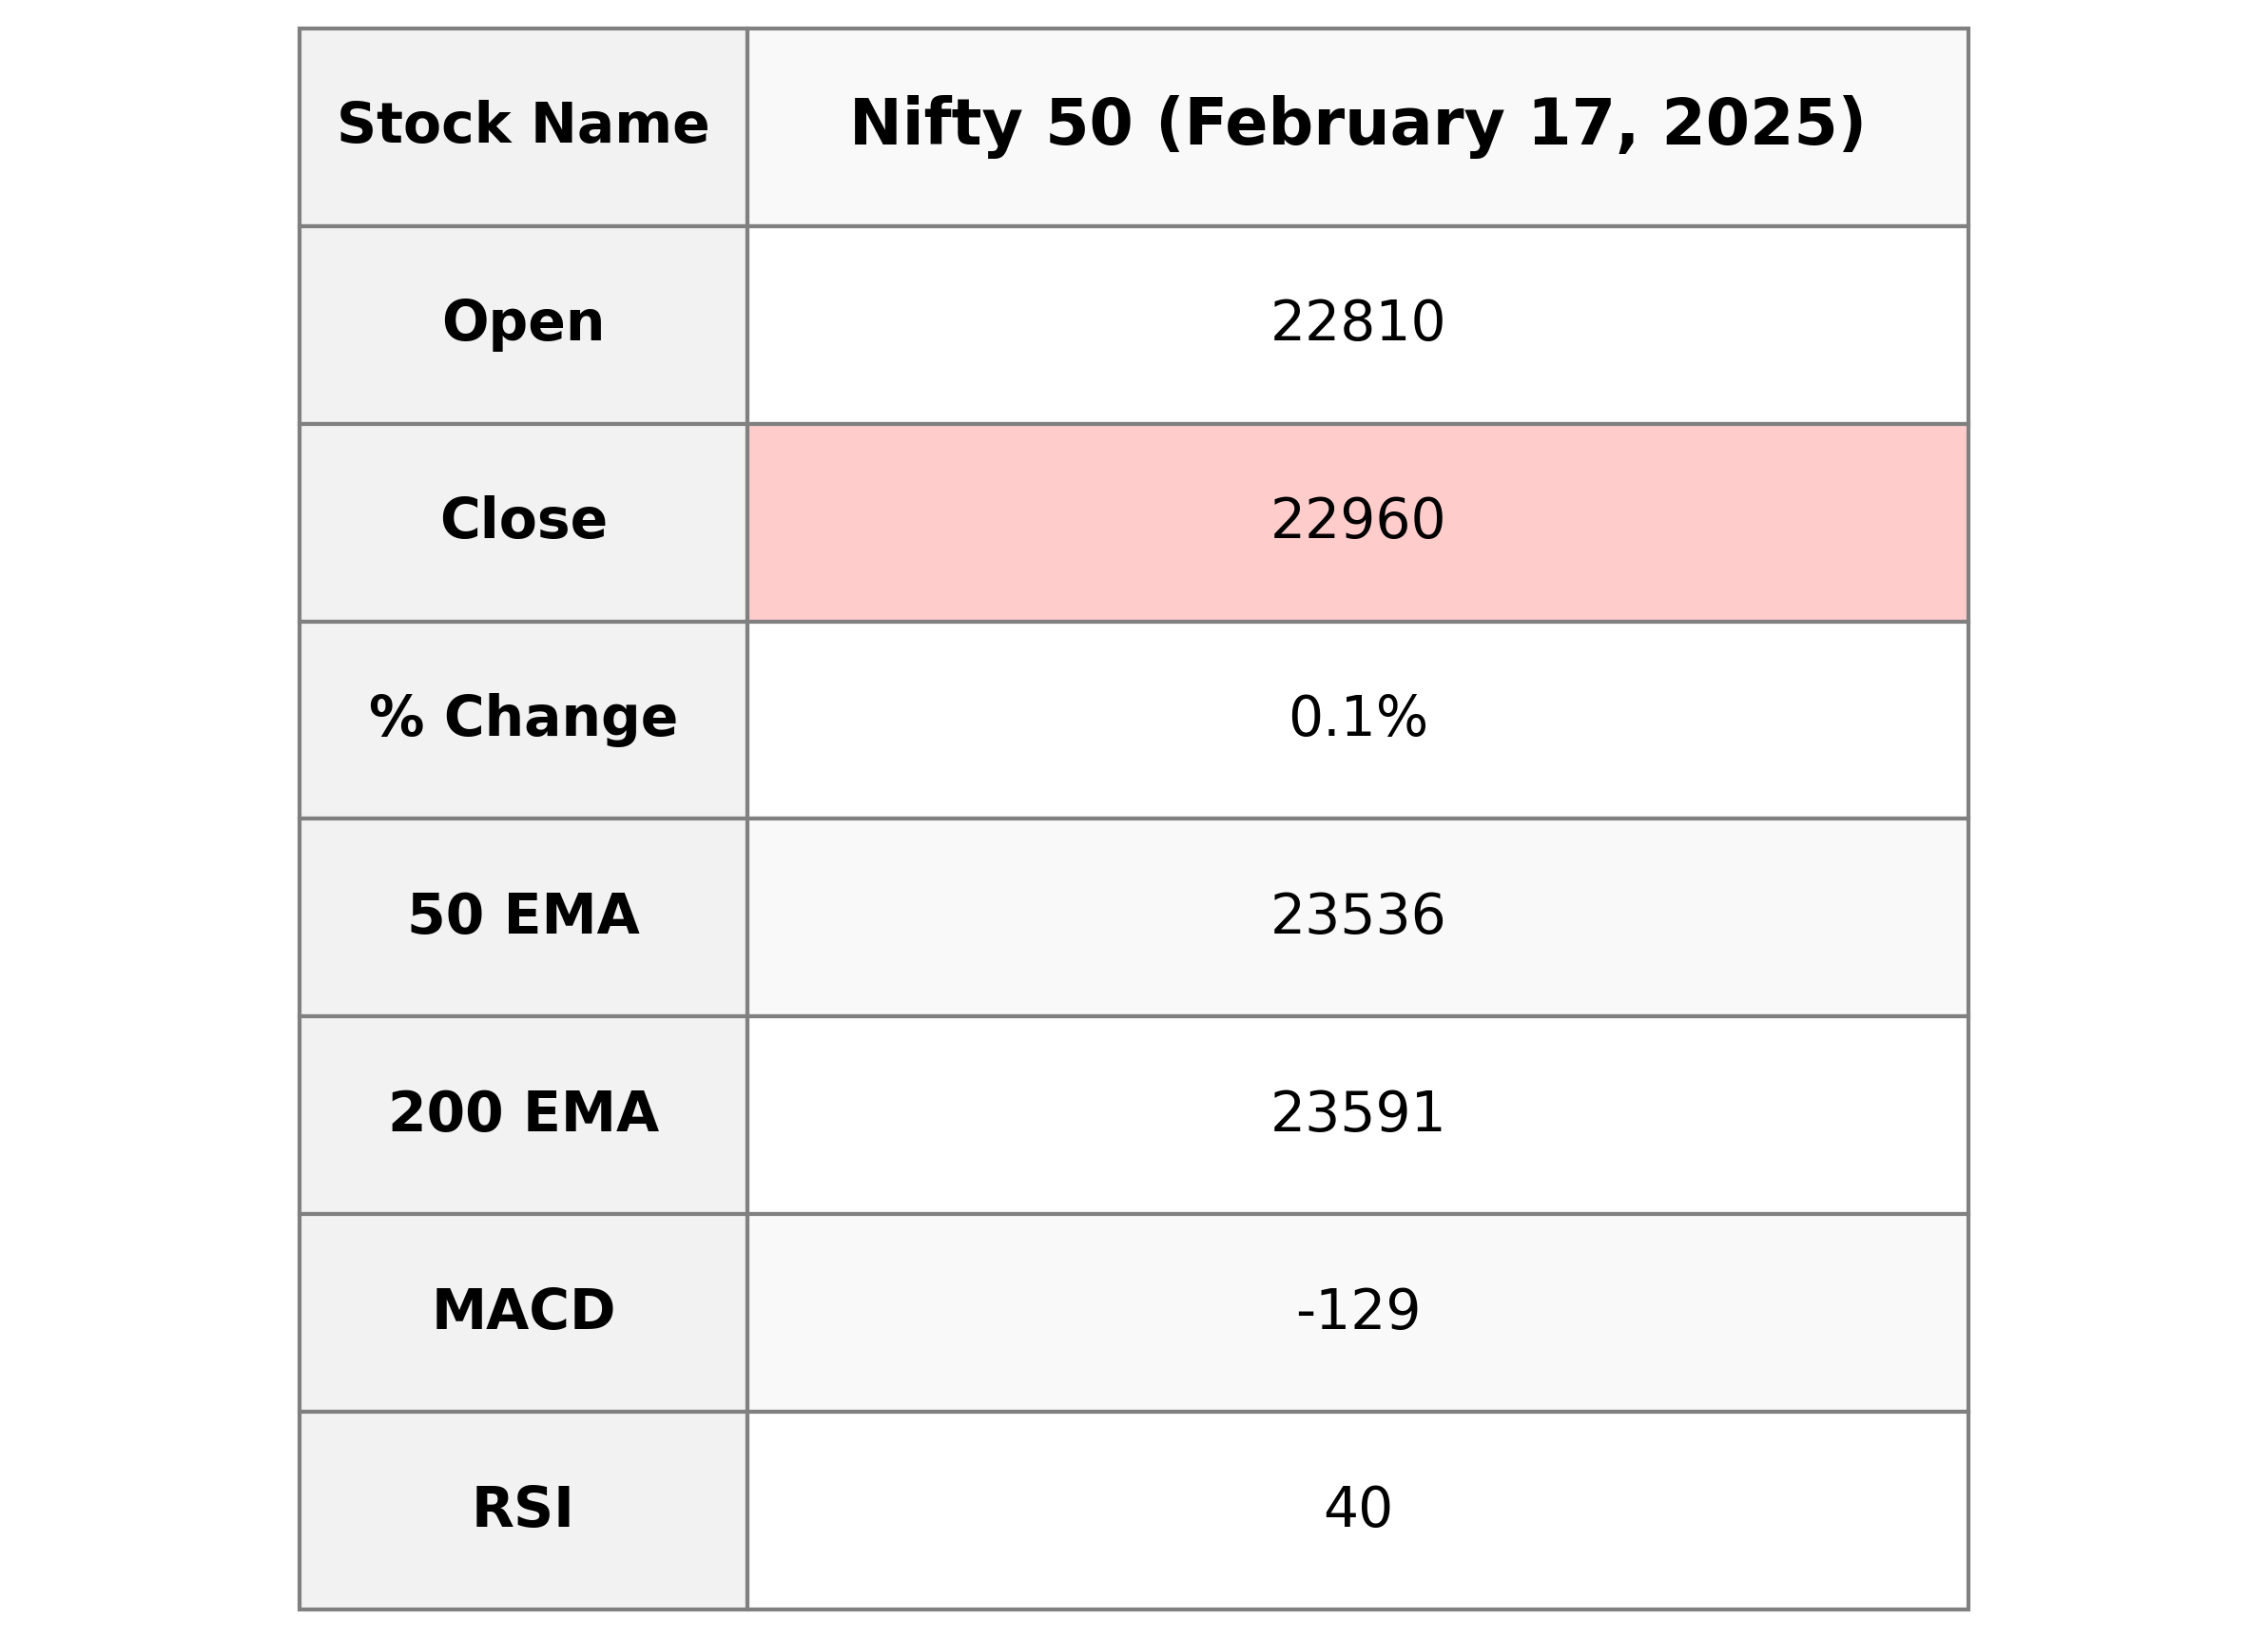
The Nifty 50 opened at 22,809.90, reached a high of 22,974.20, and closed at 22,959.50 with a points change of 30.25 from the previous close of 22,929.25, reflecting a slight increase of 0.13%. The Relative Strength Index (RSI) stands at 39.53, indicating it is approaching the oversold territory, while the Moving Average Convergence Divergence (MACD) suggests a bearish stance at -129.09.
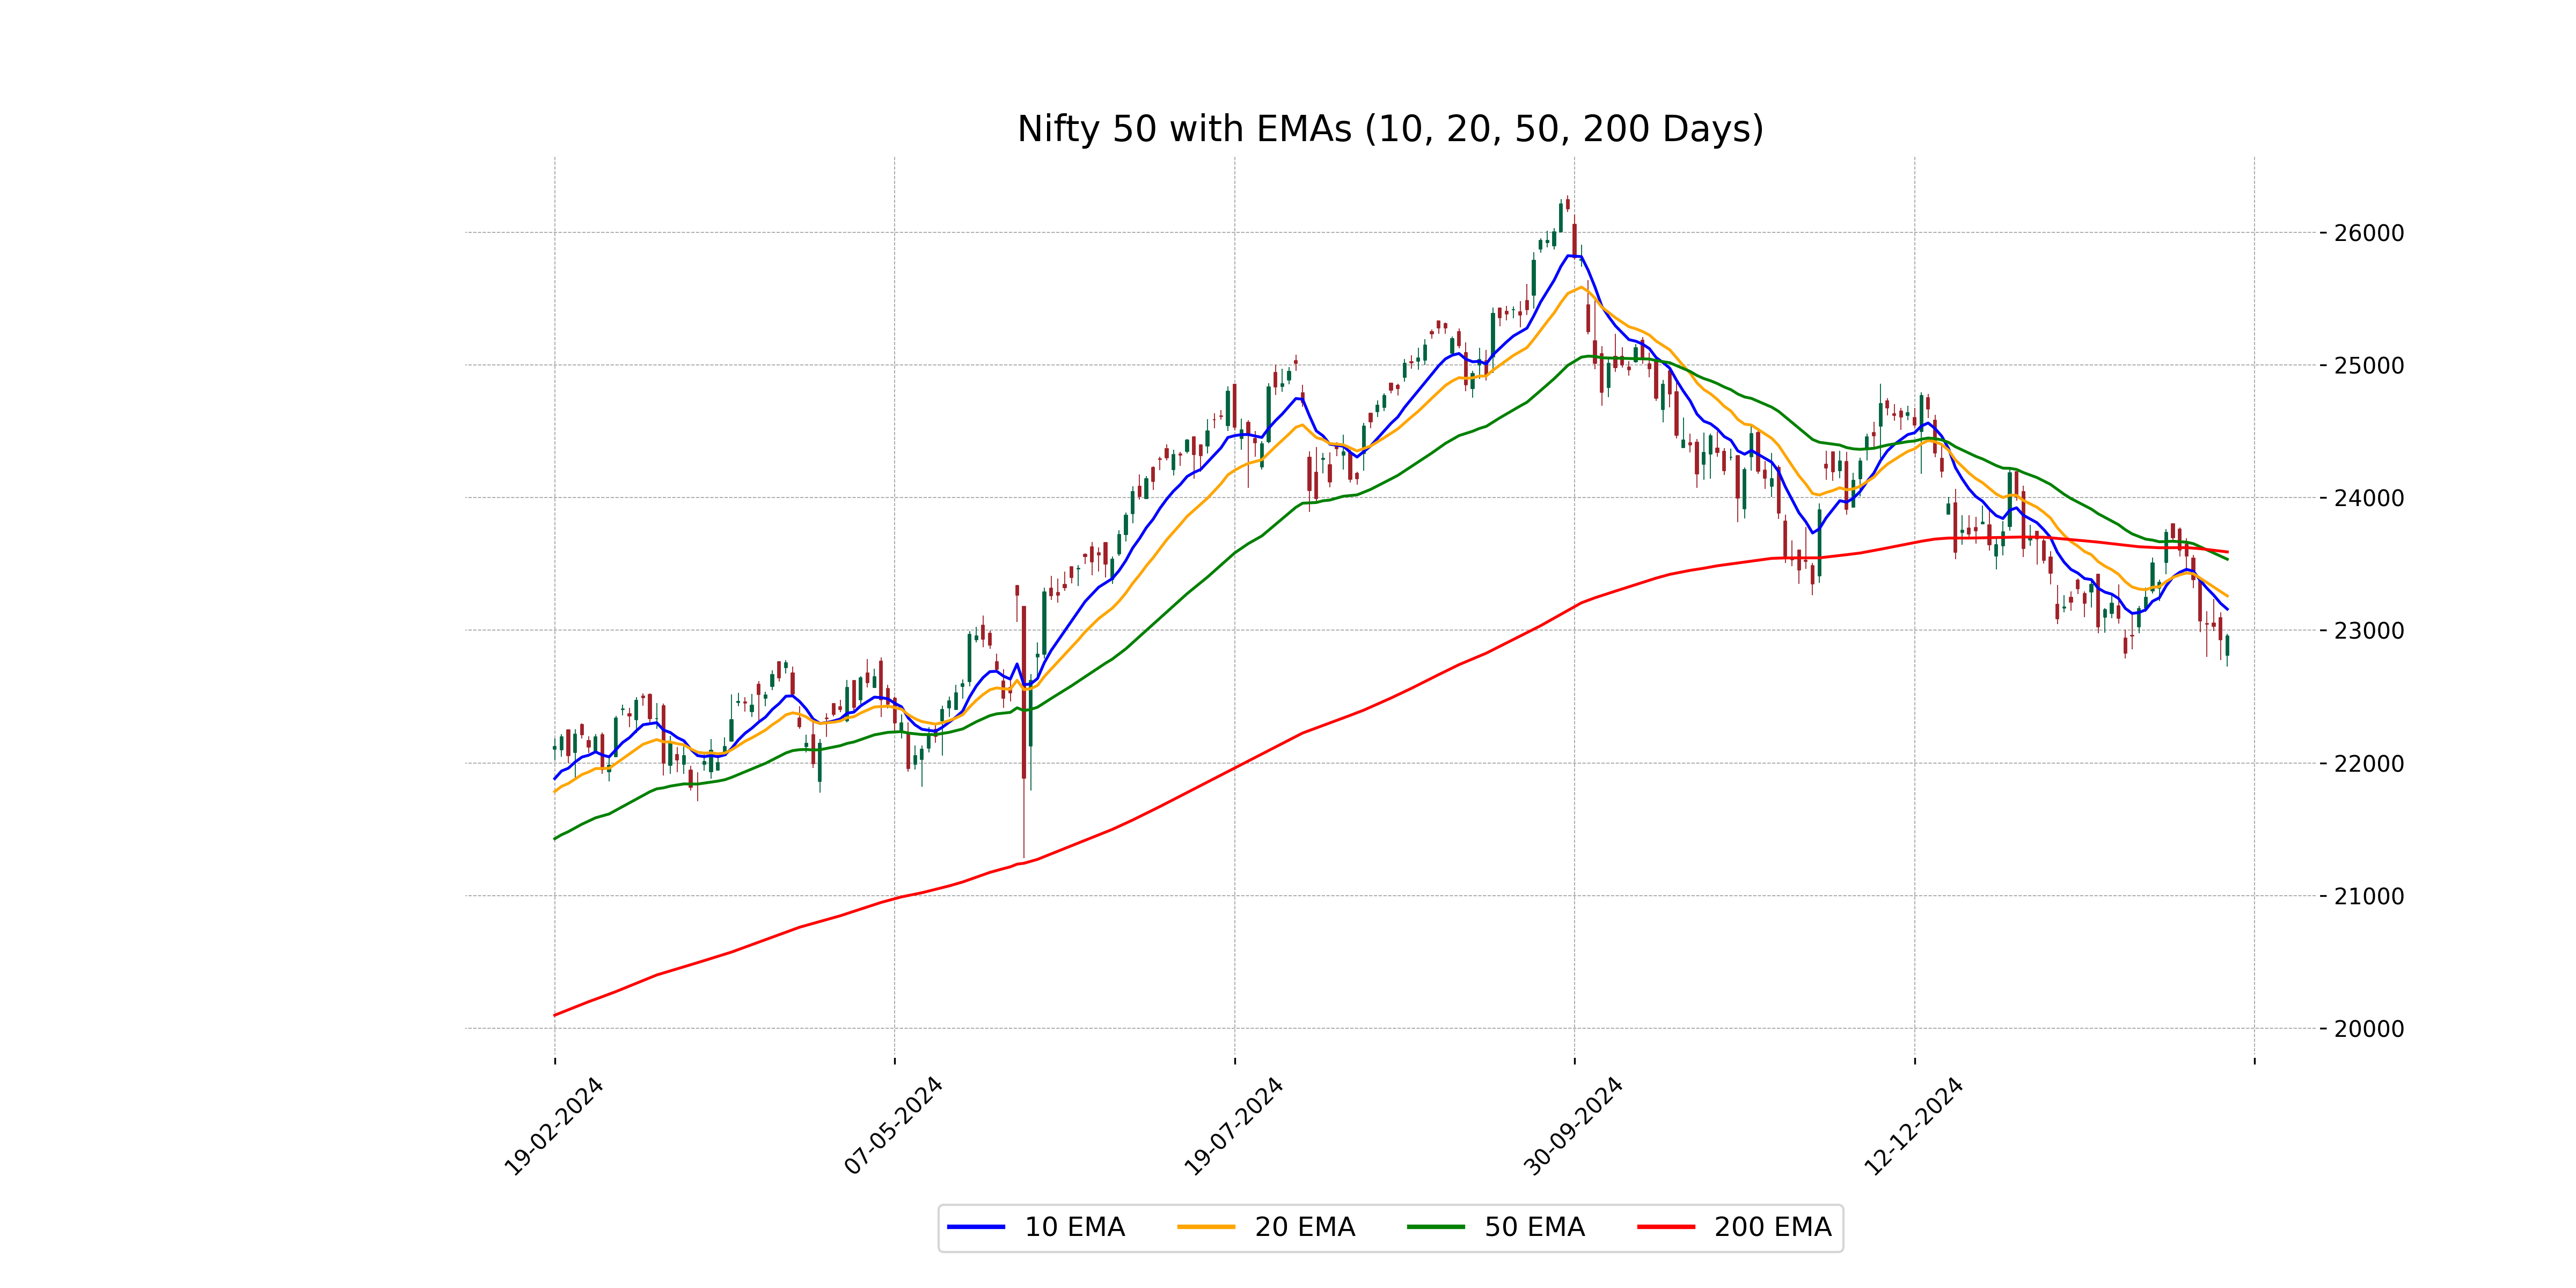
Relationship with Key Moving Averages
The Nifty 50's closing price of 22,959.5 is below its 50-day EMA of 23,535.76 and 200-day EMA of 23,590.99, suggesting a bearish trend. It is also below the 10-day and 20-day EMAs, indicating short-term downward momentum.
Moving Averages Trend (MACD)
The MACD value for Nifty 50 is -129.09, which is below its signal line of -101.65. This indicates a bearish momentum in the market. The negative MACD value suggests that the index may continue to see downward pressure in the near term.
RSI Analysis
The Relative Strength Index (RSI) for Nifty 50 is 39.53, which suggests that the index is approaching the oversold territory. This indicates a potential for buying opportunities, as RSI values below 30 generally suggest an oversold condition.