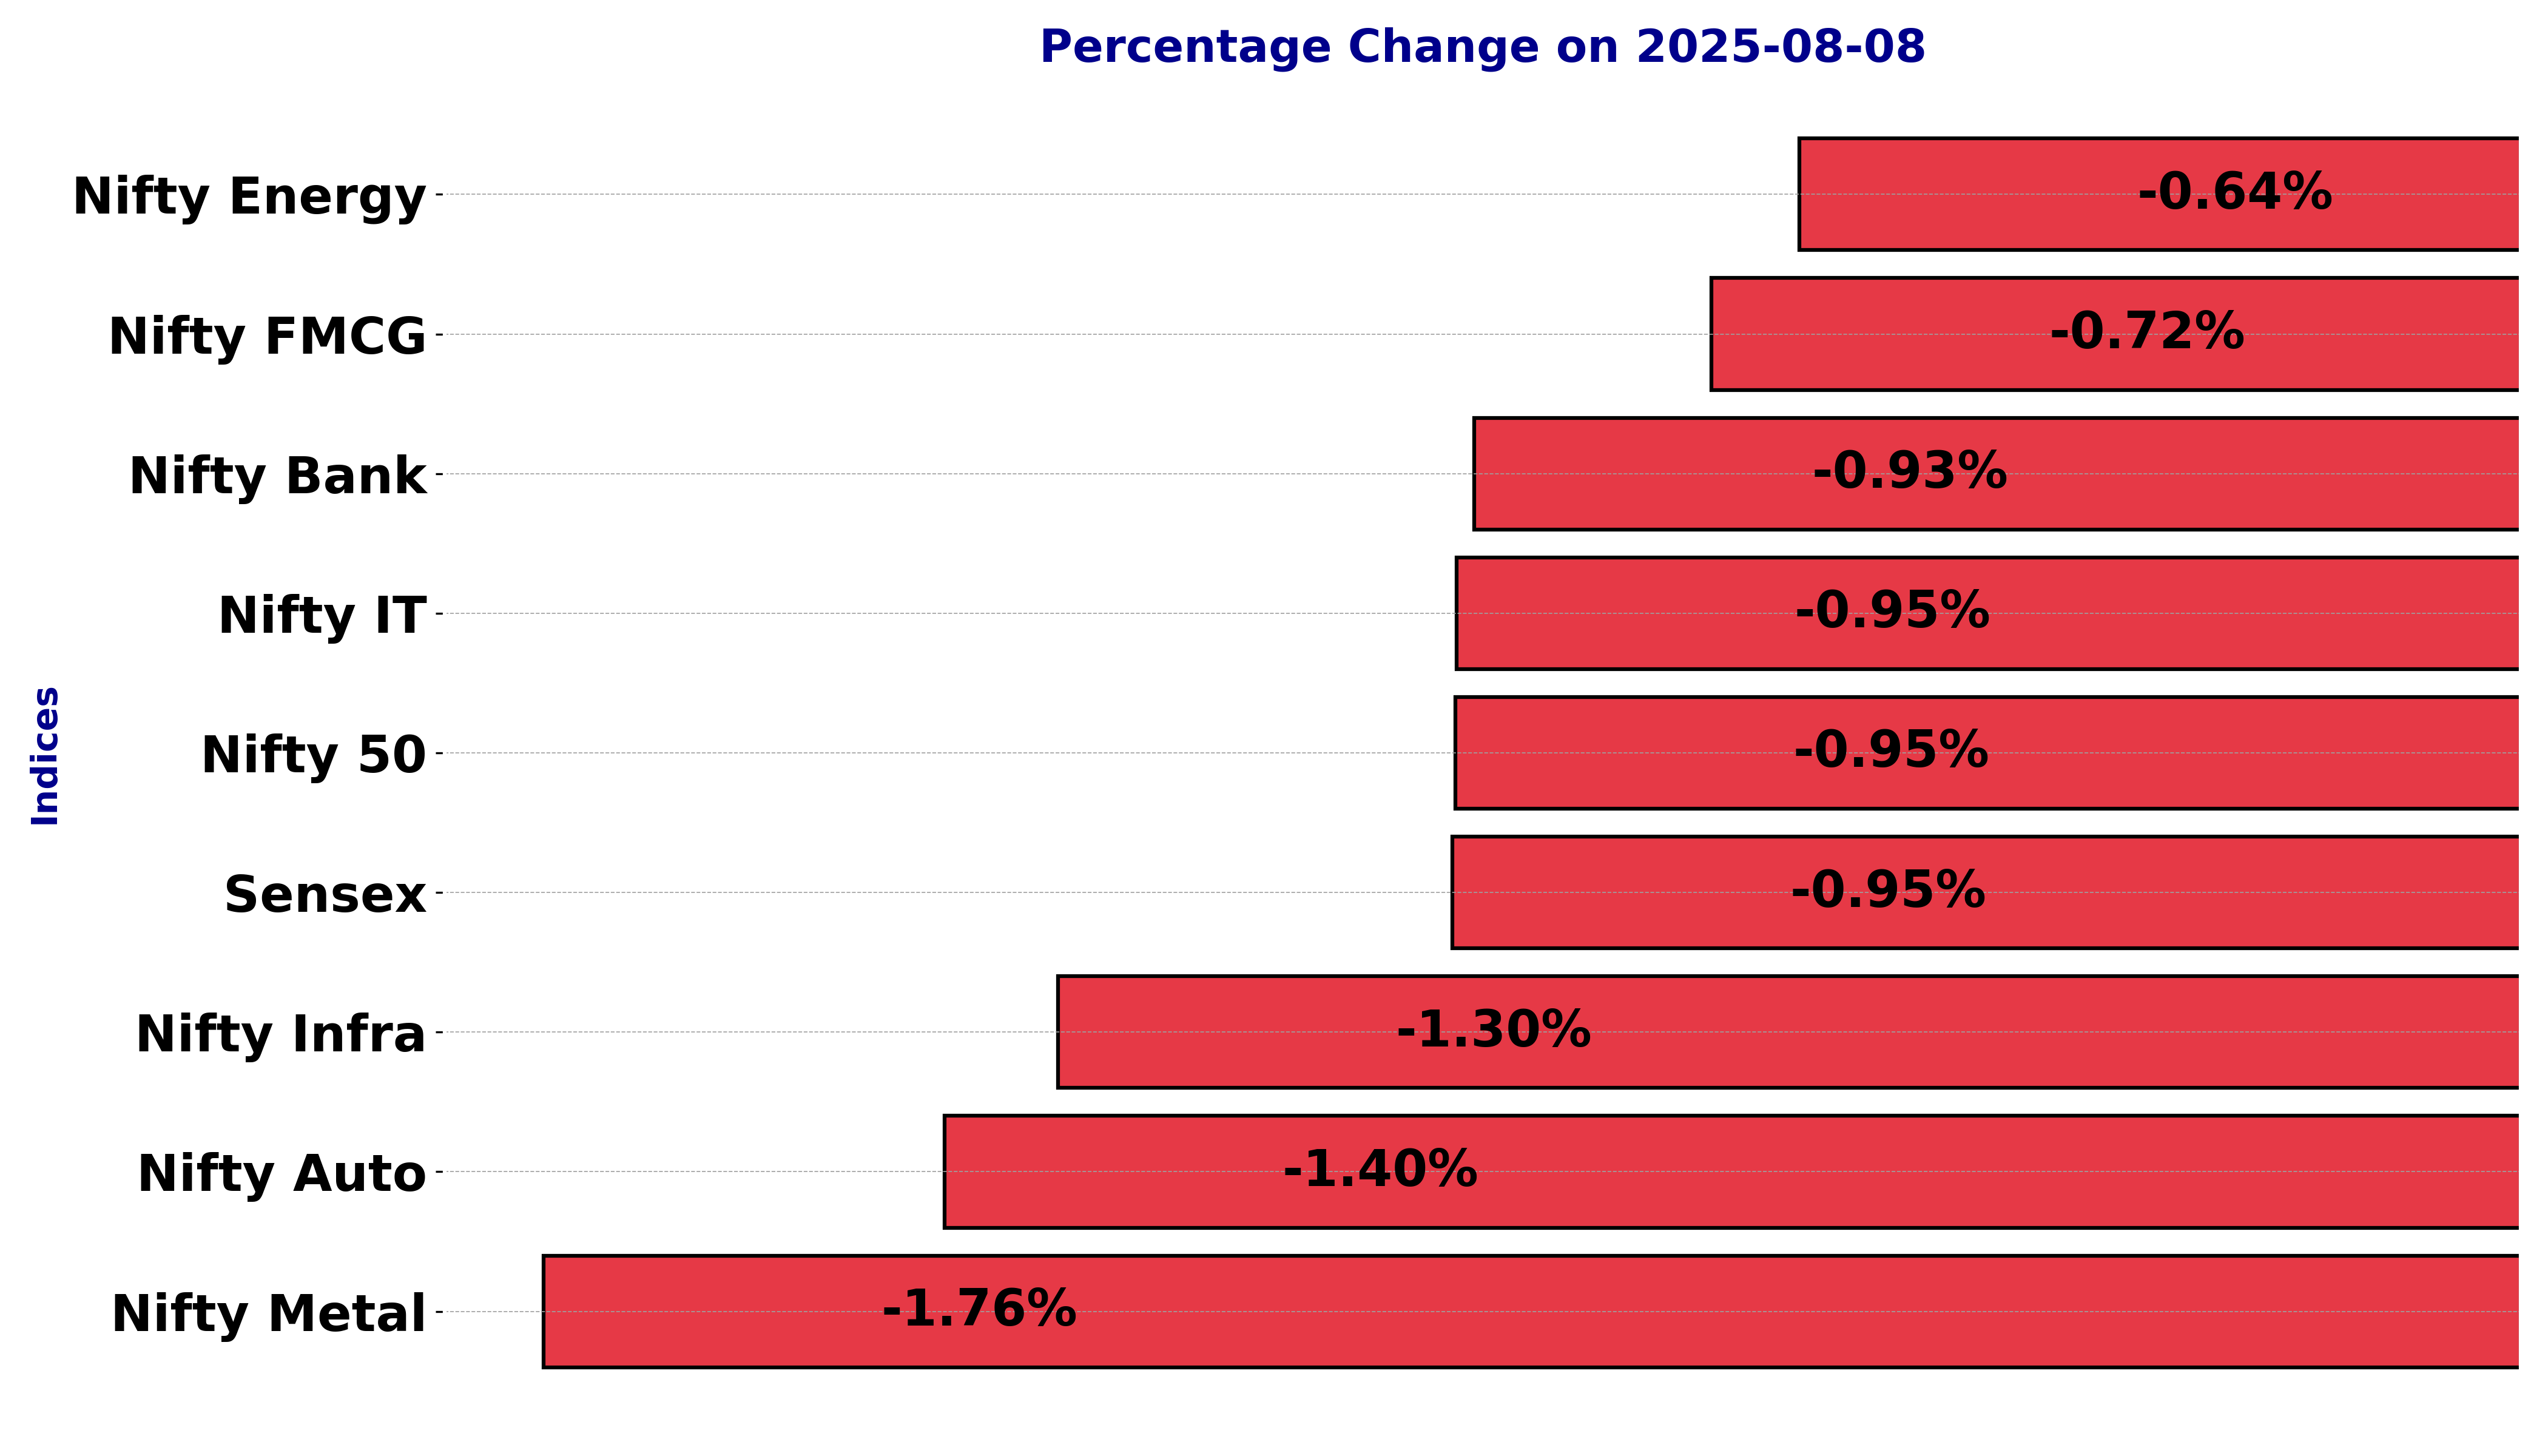
Indian stock market sector-wise performance today - August 8, 2025
The stock market on Friday (August 8, 2025) witnessed a varied performance across different sectors and indices.
Among the indices that faced significant declines, the Nifty Auto index experienced the most substantial percentage drop of -1.40%, indicating a challenging day for this sector.
Following closely was the Nifty Metal index, with a percentage change of -1.76%, reflecting a notable contraction in the metal sector.
The Nifty Infra also showed a significant decrease with a percentage change of -1.30%, suggesting a downturn in infrastructure-related stocks.
Meanwhile, the Nifty IT index encountered a fall of -0.95%, consistent with the broader market trend.
The Nifty Bank and Nifty displayed decreases of -0.93% and -0.95%, respectively, indicating a general downtrend in financial stocks.
Nifty FMCG and Nifty Energy sectors recorded milder drops of -0.72% and -0.64%, respectively, showcasing relative resilience compared to other indices.
The Nifty, a major benchmark index, experienced a decrease of -0.95%, in line with the overall market sentiment. A key focus could be the Nifty Metal, which was the most affected with a -1.76% change.
Several factors could have influenced this sector's performance, such as fluctuations in commodity prices, global economic uncertainties, and supply chain disruptions impacting the metal industry.
The overall market sentiment might have been shaped by external economic pressures, geopolitical tensions, or domestic policy shifts that led investors to adopt a more cautious approach.
Consequently, this resulted in downward pressure across major sectors, with auto and metal experiencing notable impacts during the trading session.
Analysis for Sensex - August 08, 2025

Sensex Performance: The Sensex opened at 80,478.01 points and experienced fluctuations with a high of 80,550.40 and a low of 79,775.84 before closing at 79,857.79. It showed a decline with a percentage change of -0.95%, equating to a points loss of 765.47 from the previous close of 80,623.26. The Relative Strength Index (RSI) is 33.23, indicating potential oversold conditions.
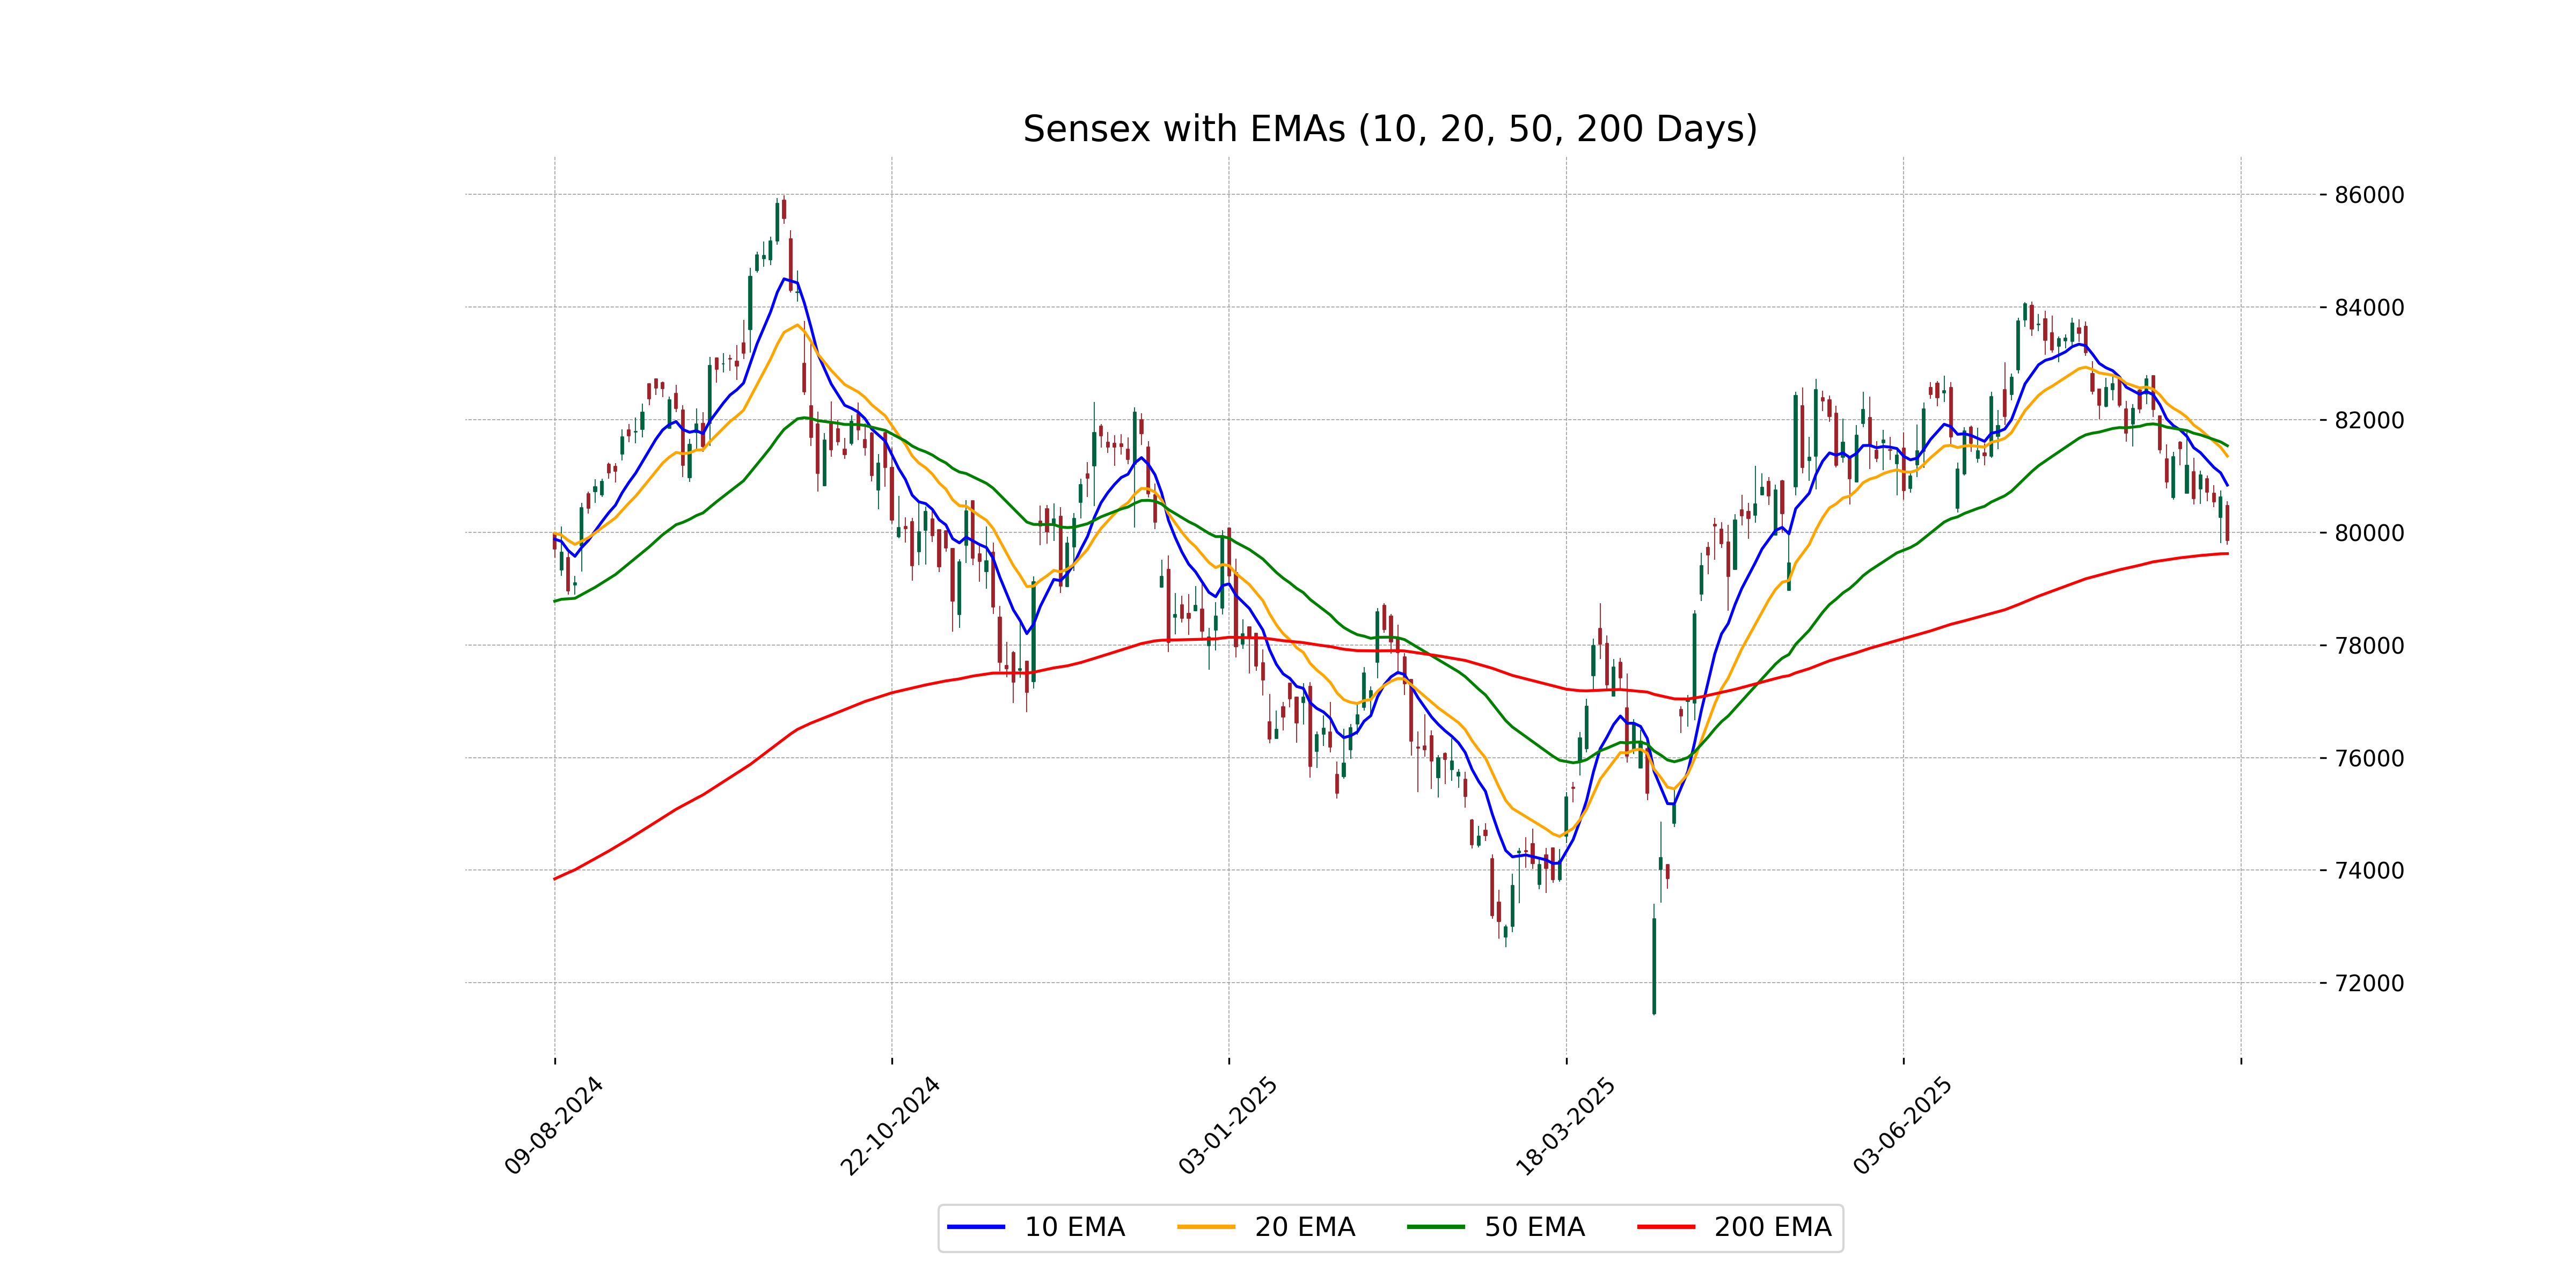
Relationship with Key Moving Averages
The Sensex closed below its 50-day, 20-day, and 10-day Exponential Moving Averages (EMAs), indicating a bearish trend in the short to medium term. However, it's still slightly above the 200-day EMA, suggesting that the long-term trend has not yet turned bearish. The RSI is also in the lower range, reinforcing the bearish sentiment.
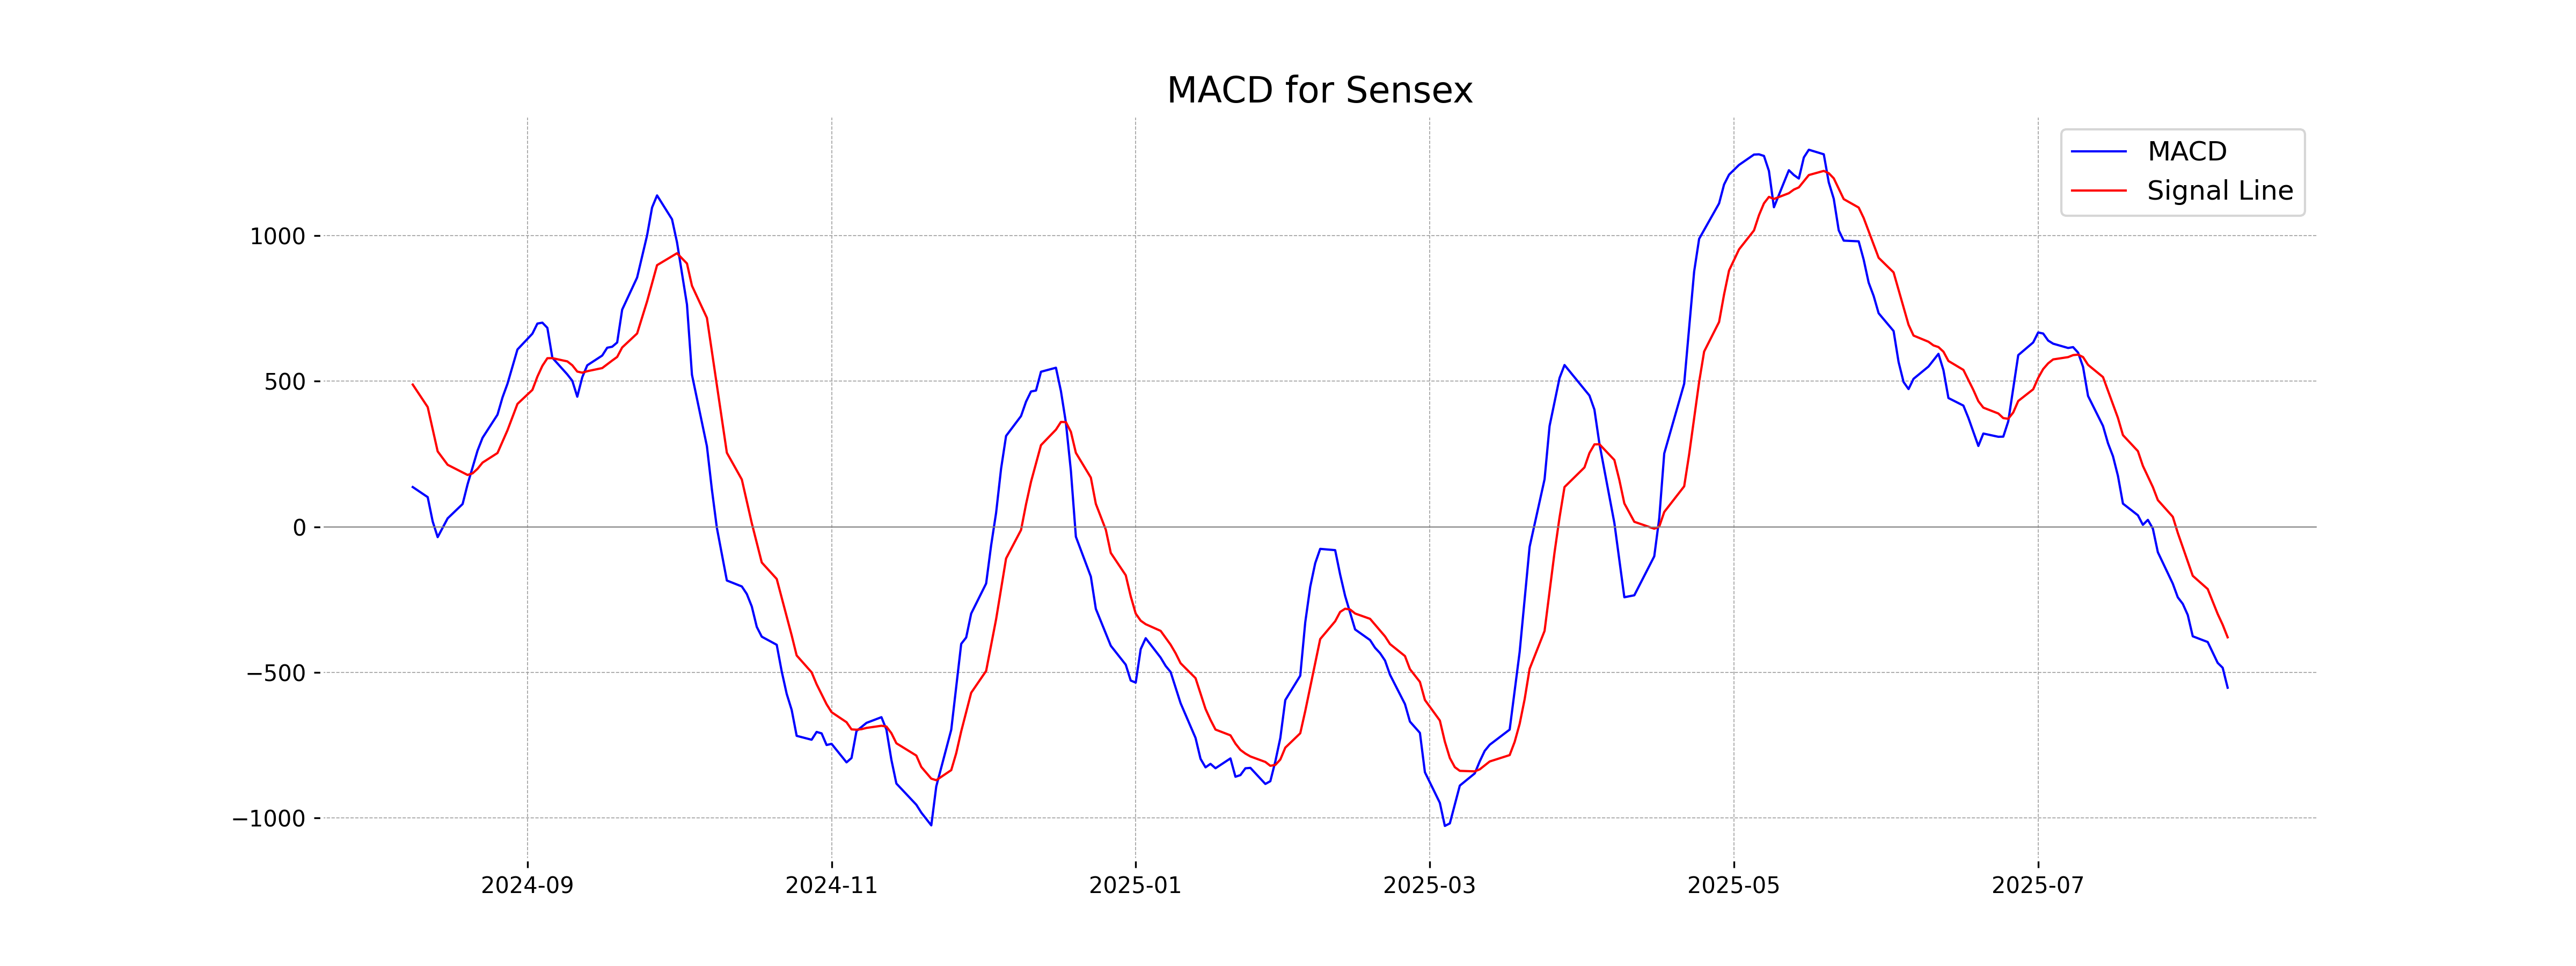
Moving Averages Trend (MACD)
Based on the provided data for the Sensex, the MACD value is -552.67, which is significantly lower than the MACD Signal at -379.54. This negative divergence suggests a bearish trend, indicating potential downward momentum in the Sensex market. The RSI is also relatively low at 33.23, pointing towards possible oversold conditions.
RSI Analysis
The RSI of Sensex is 33.23, which suggests that the index is nearing the oversold territory. An RSI below 30 is typically considered oversold, indicating potential buying opportunities if the trend reverses. However, traders should exercise caution as it is not yet in the extreme oversold zone.

Analysis for Nifty Auto - August 08, 2025
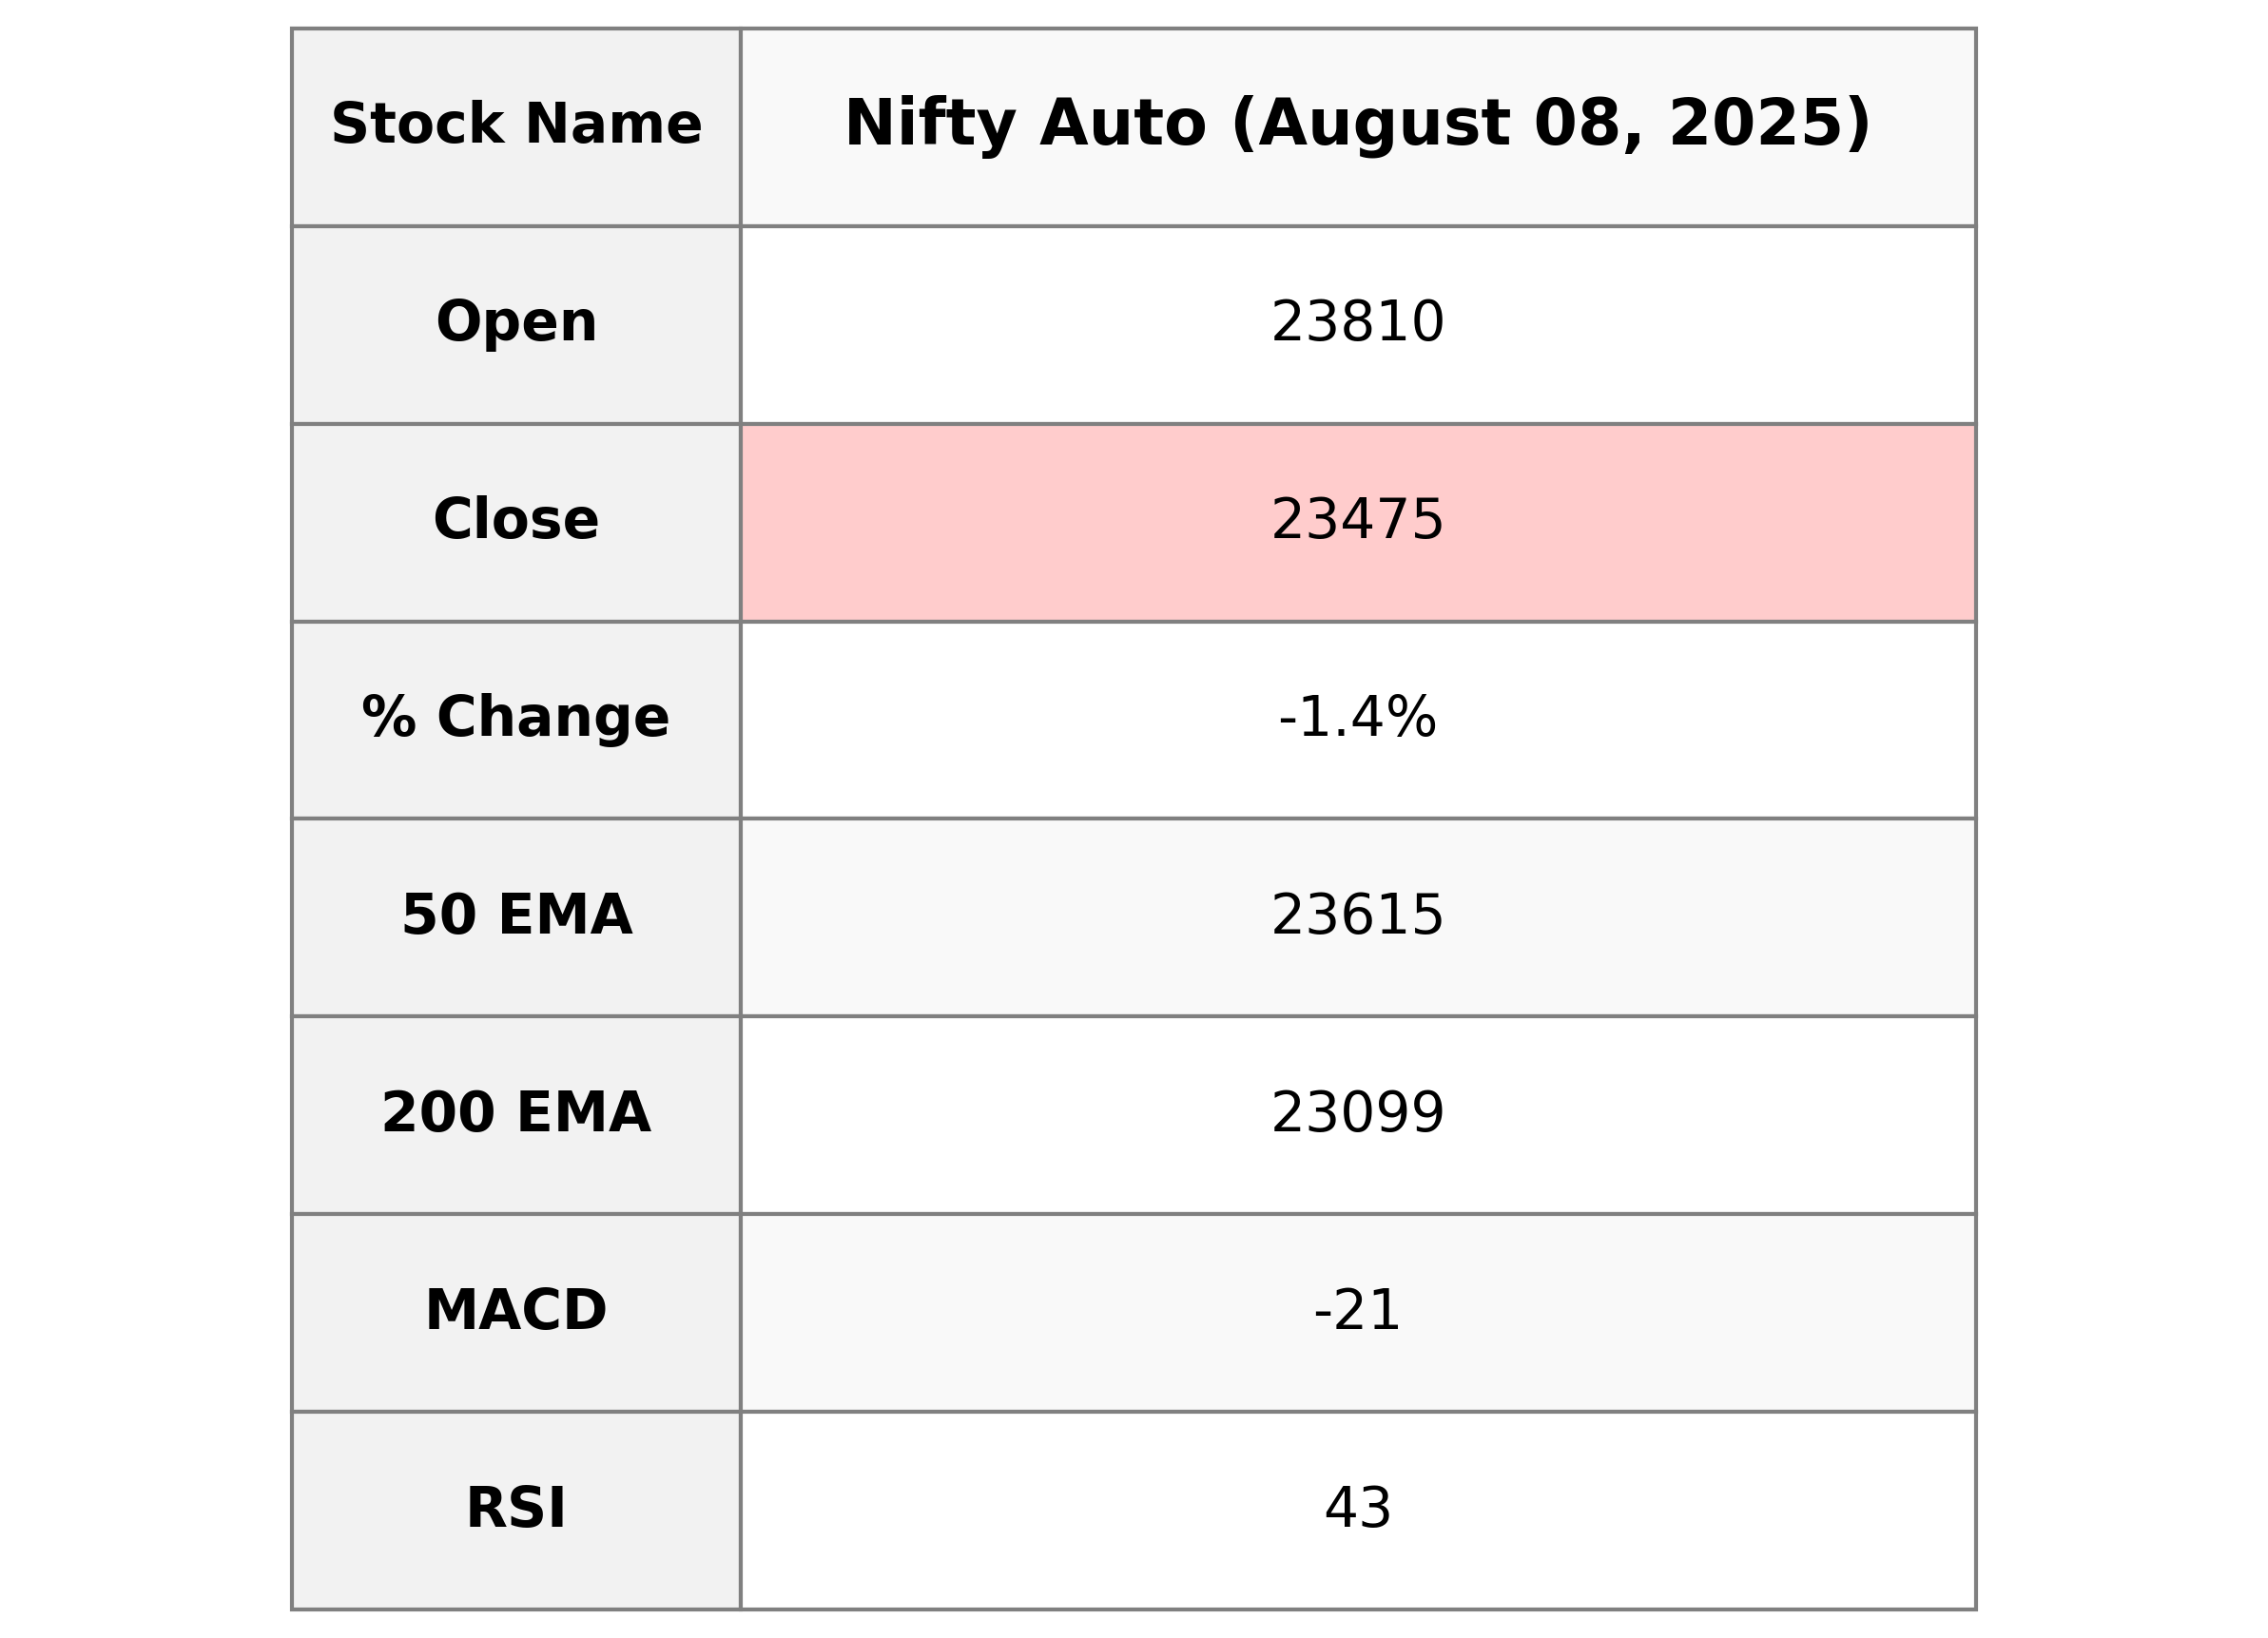
The Nifty Auto index opened at 23,810.30 and closed at 23,474.65, experiencing a decline of approximately 1.40%, with a points change of -333.45 from the previous close of 23,808.10. The RSI stands at 43.39, indicating potential weakness, and the MACD value of -20.72 suggests a bearish trend as it is below the MACD signal of 16.83. The trading volume was notably absent at 0.0, suggesting no transactions took place during the session.
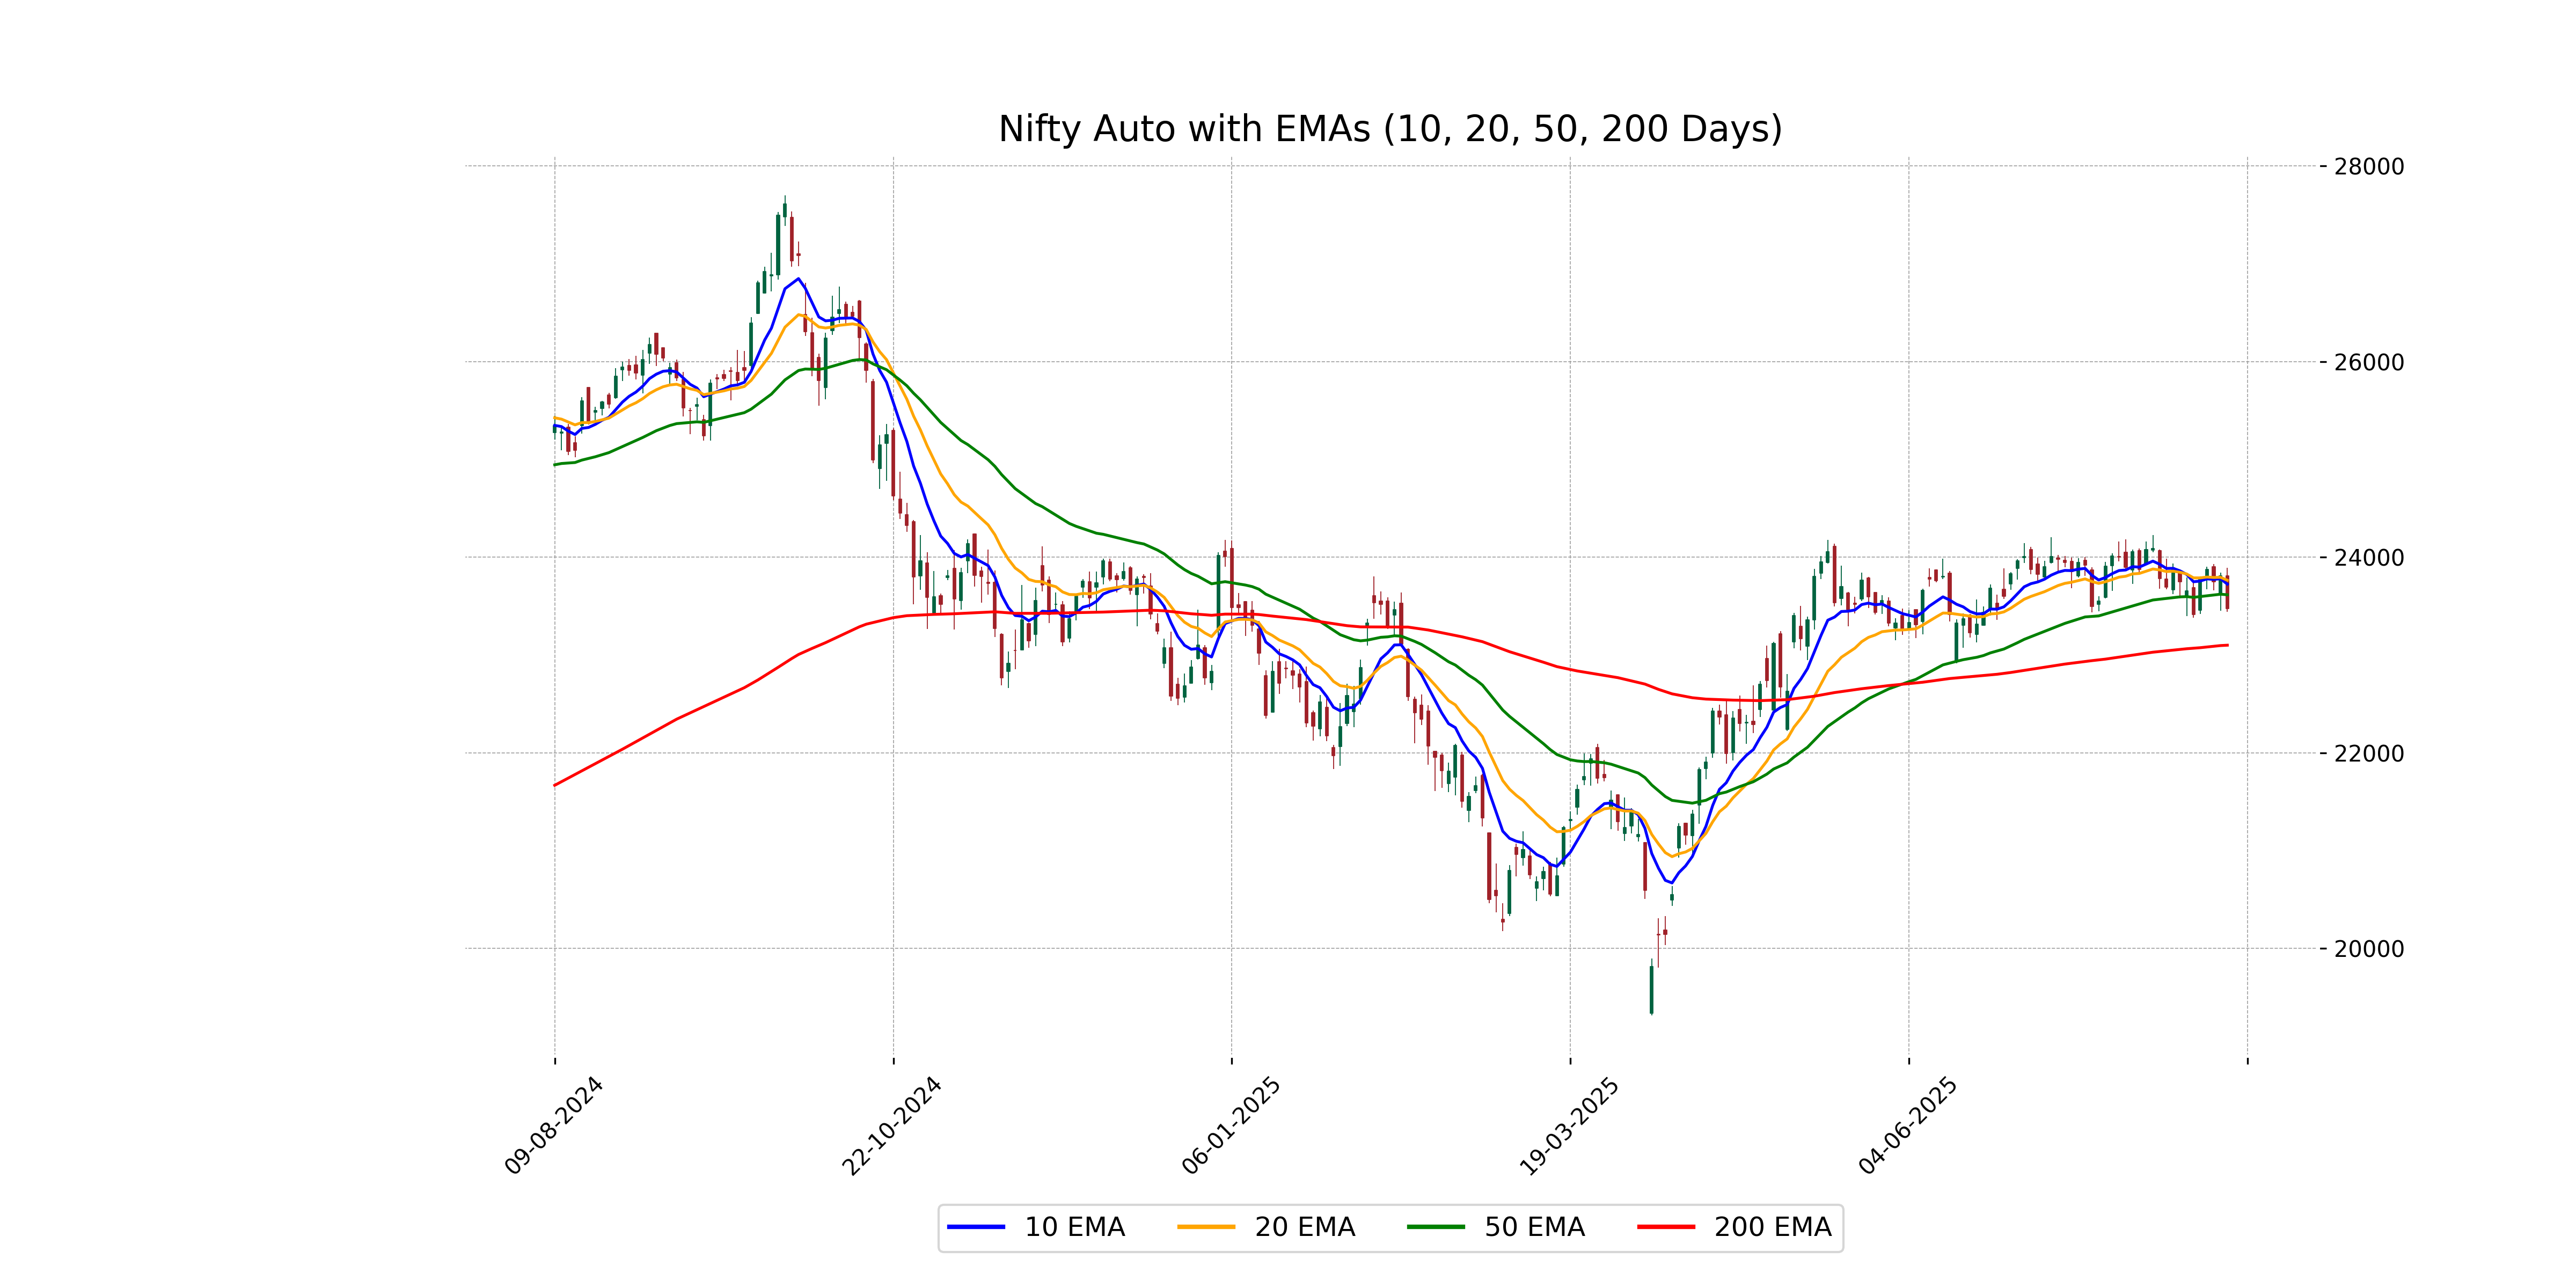
Relationship with Key Moving Averages
The closing price of Nifty Auto at 23474.65 is below the 50-day EMA of 23614.65, indicating a bearish trend. It is also below the 200-day EMA of 23099.16 but remains near the 10-day EMA and 20-day EMA, suggesting potential volatility or consolidation in the short term. The RSI of 43.39 also supports a neutral to slightly bearish sentiment.
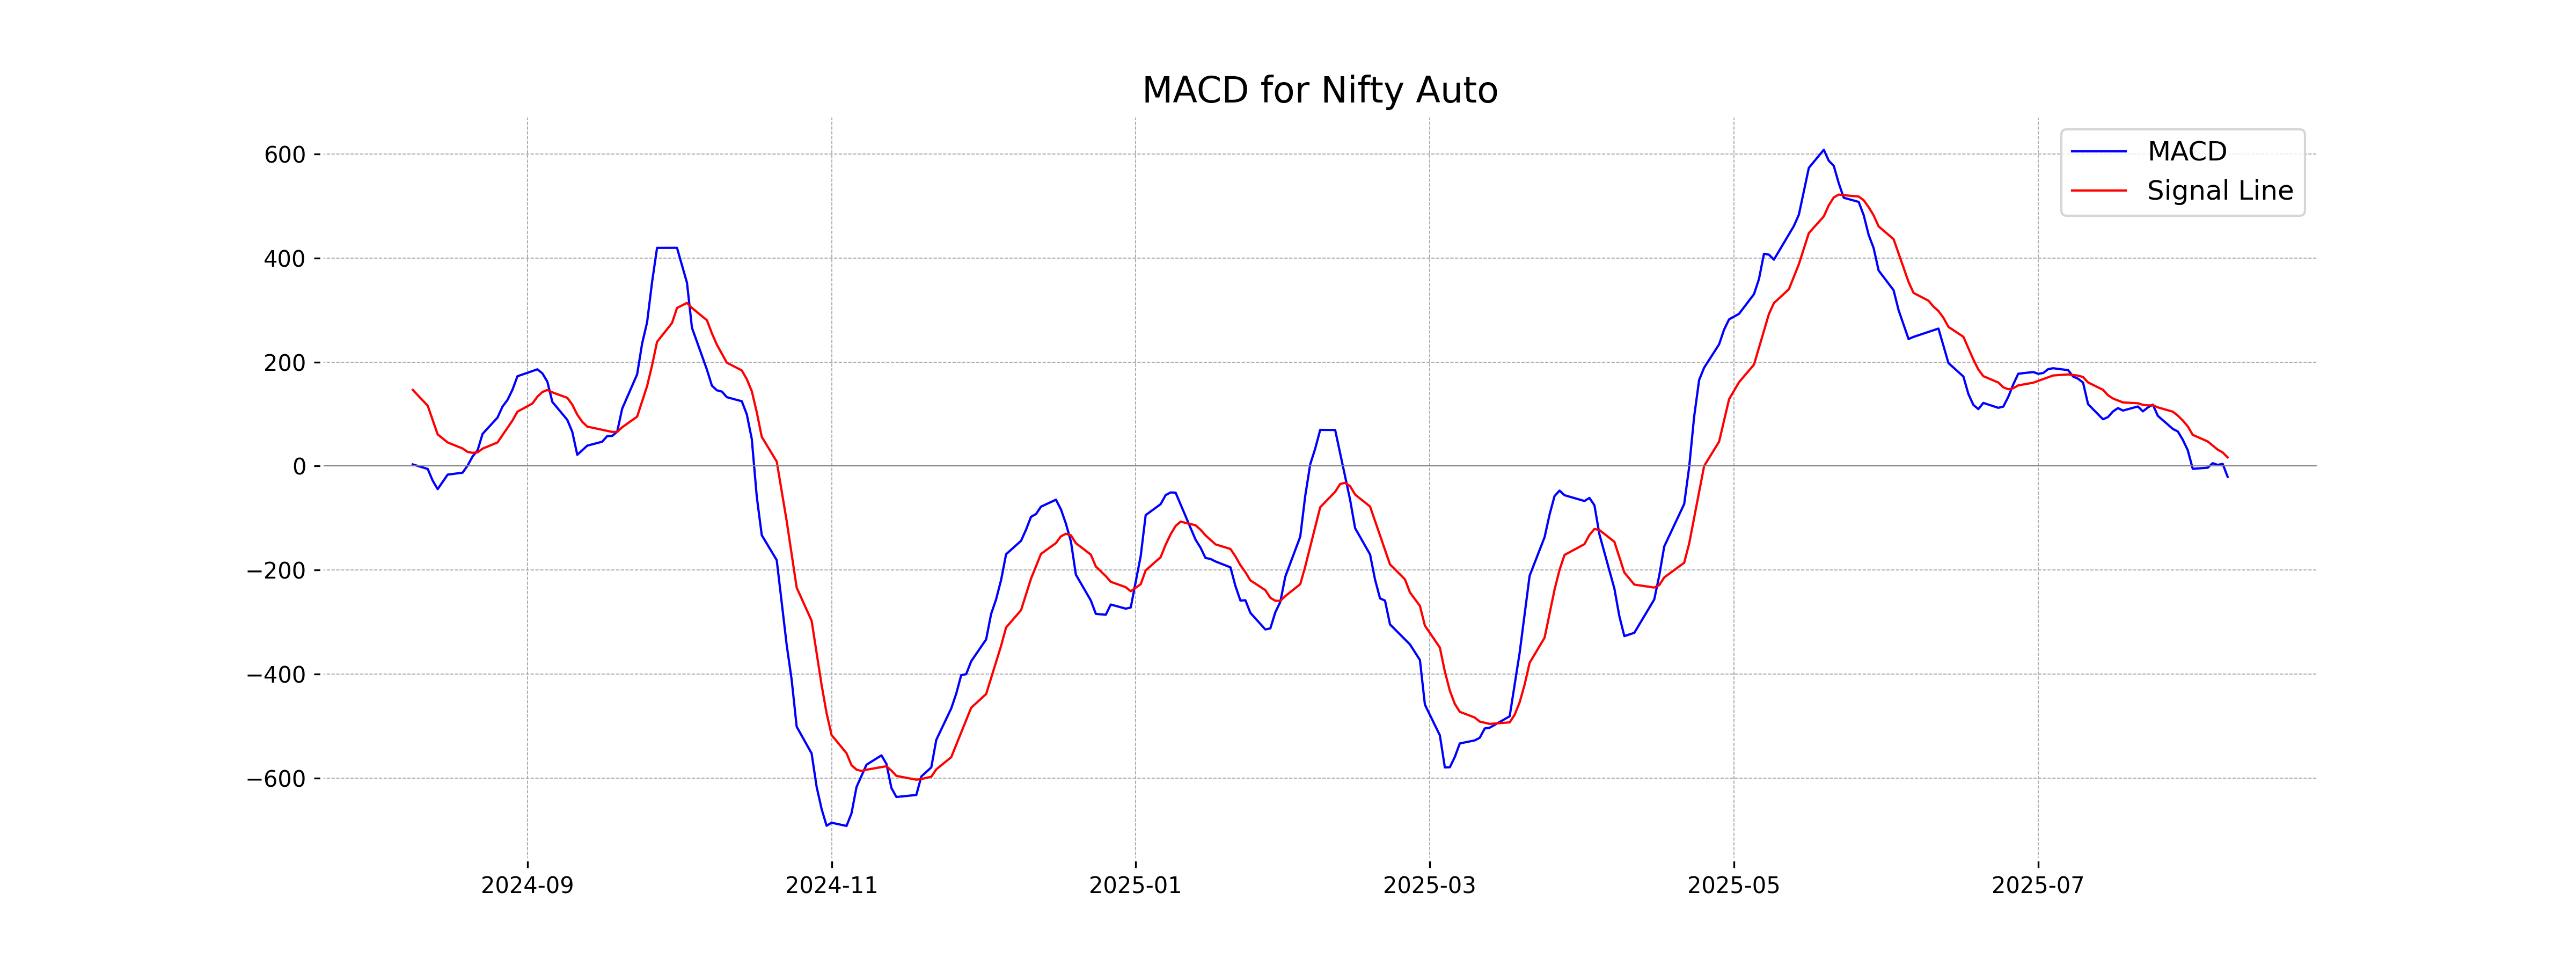
Moving Averages Trend (MACD)
MACD Analysis for Nifty Auto: The MACD value of -20.72, which is below the MACD Signal of 16.83, indicates a bearish sentiment in the market. This suggests that the downward momentum could continue if other factors remain unchanged.
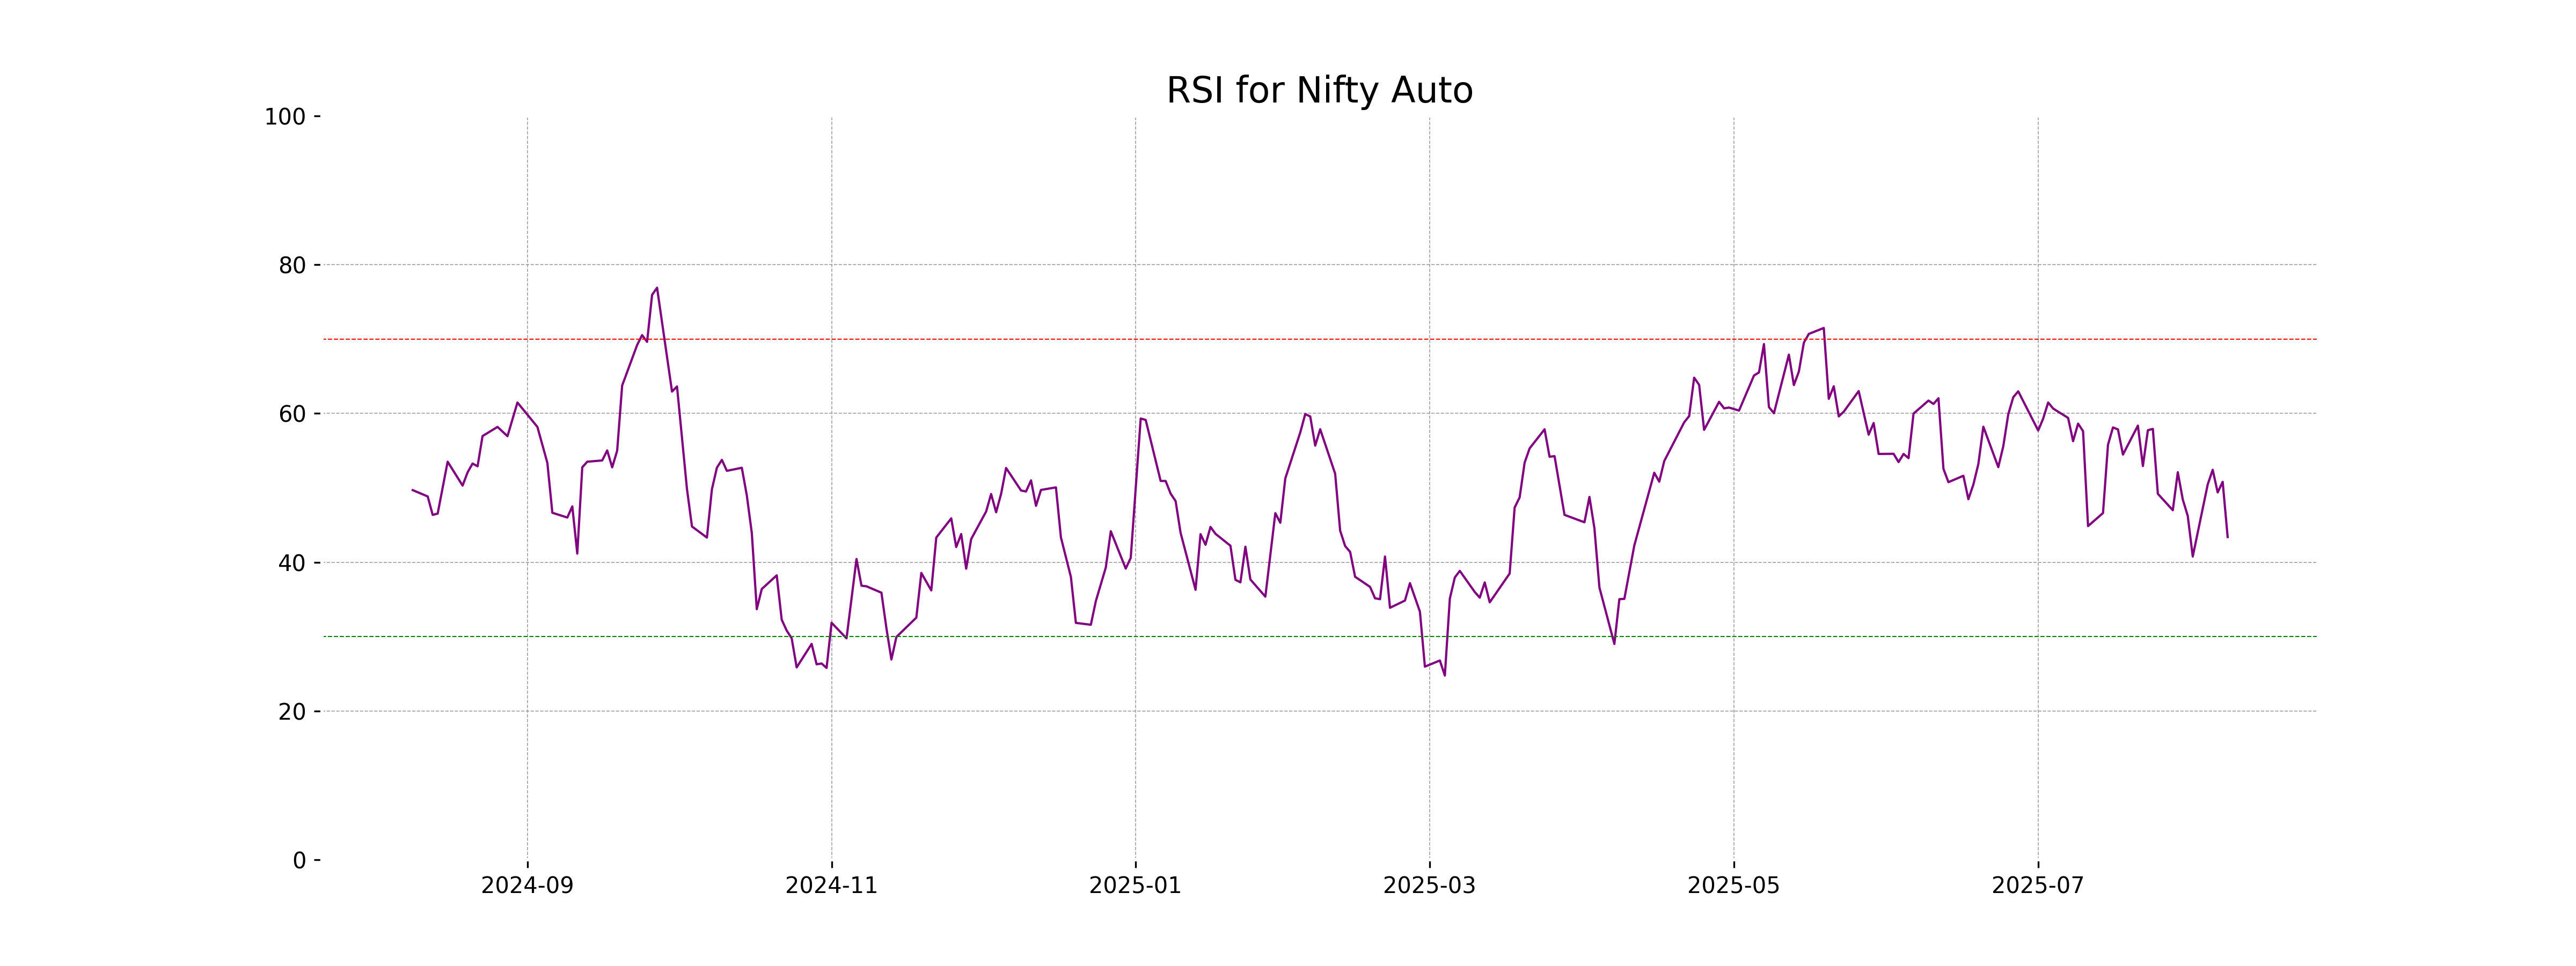
RSI Analysis
The RSI value of 43.39 for Nifty Auto suggests it is in a neutral state, slightly leaning towards being oversold but not excessively so. Generally, RSI values below 30 indicate an oversold condition, while above 70 indicate overbought. Thus, Nifty Auto is not currently in either extreme zone.
Analysis for Nifty Energy - August 08, 2025
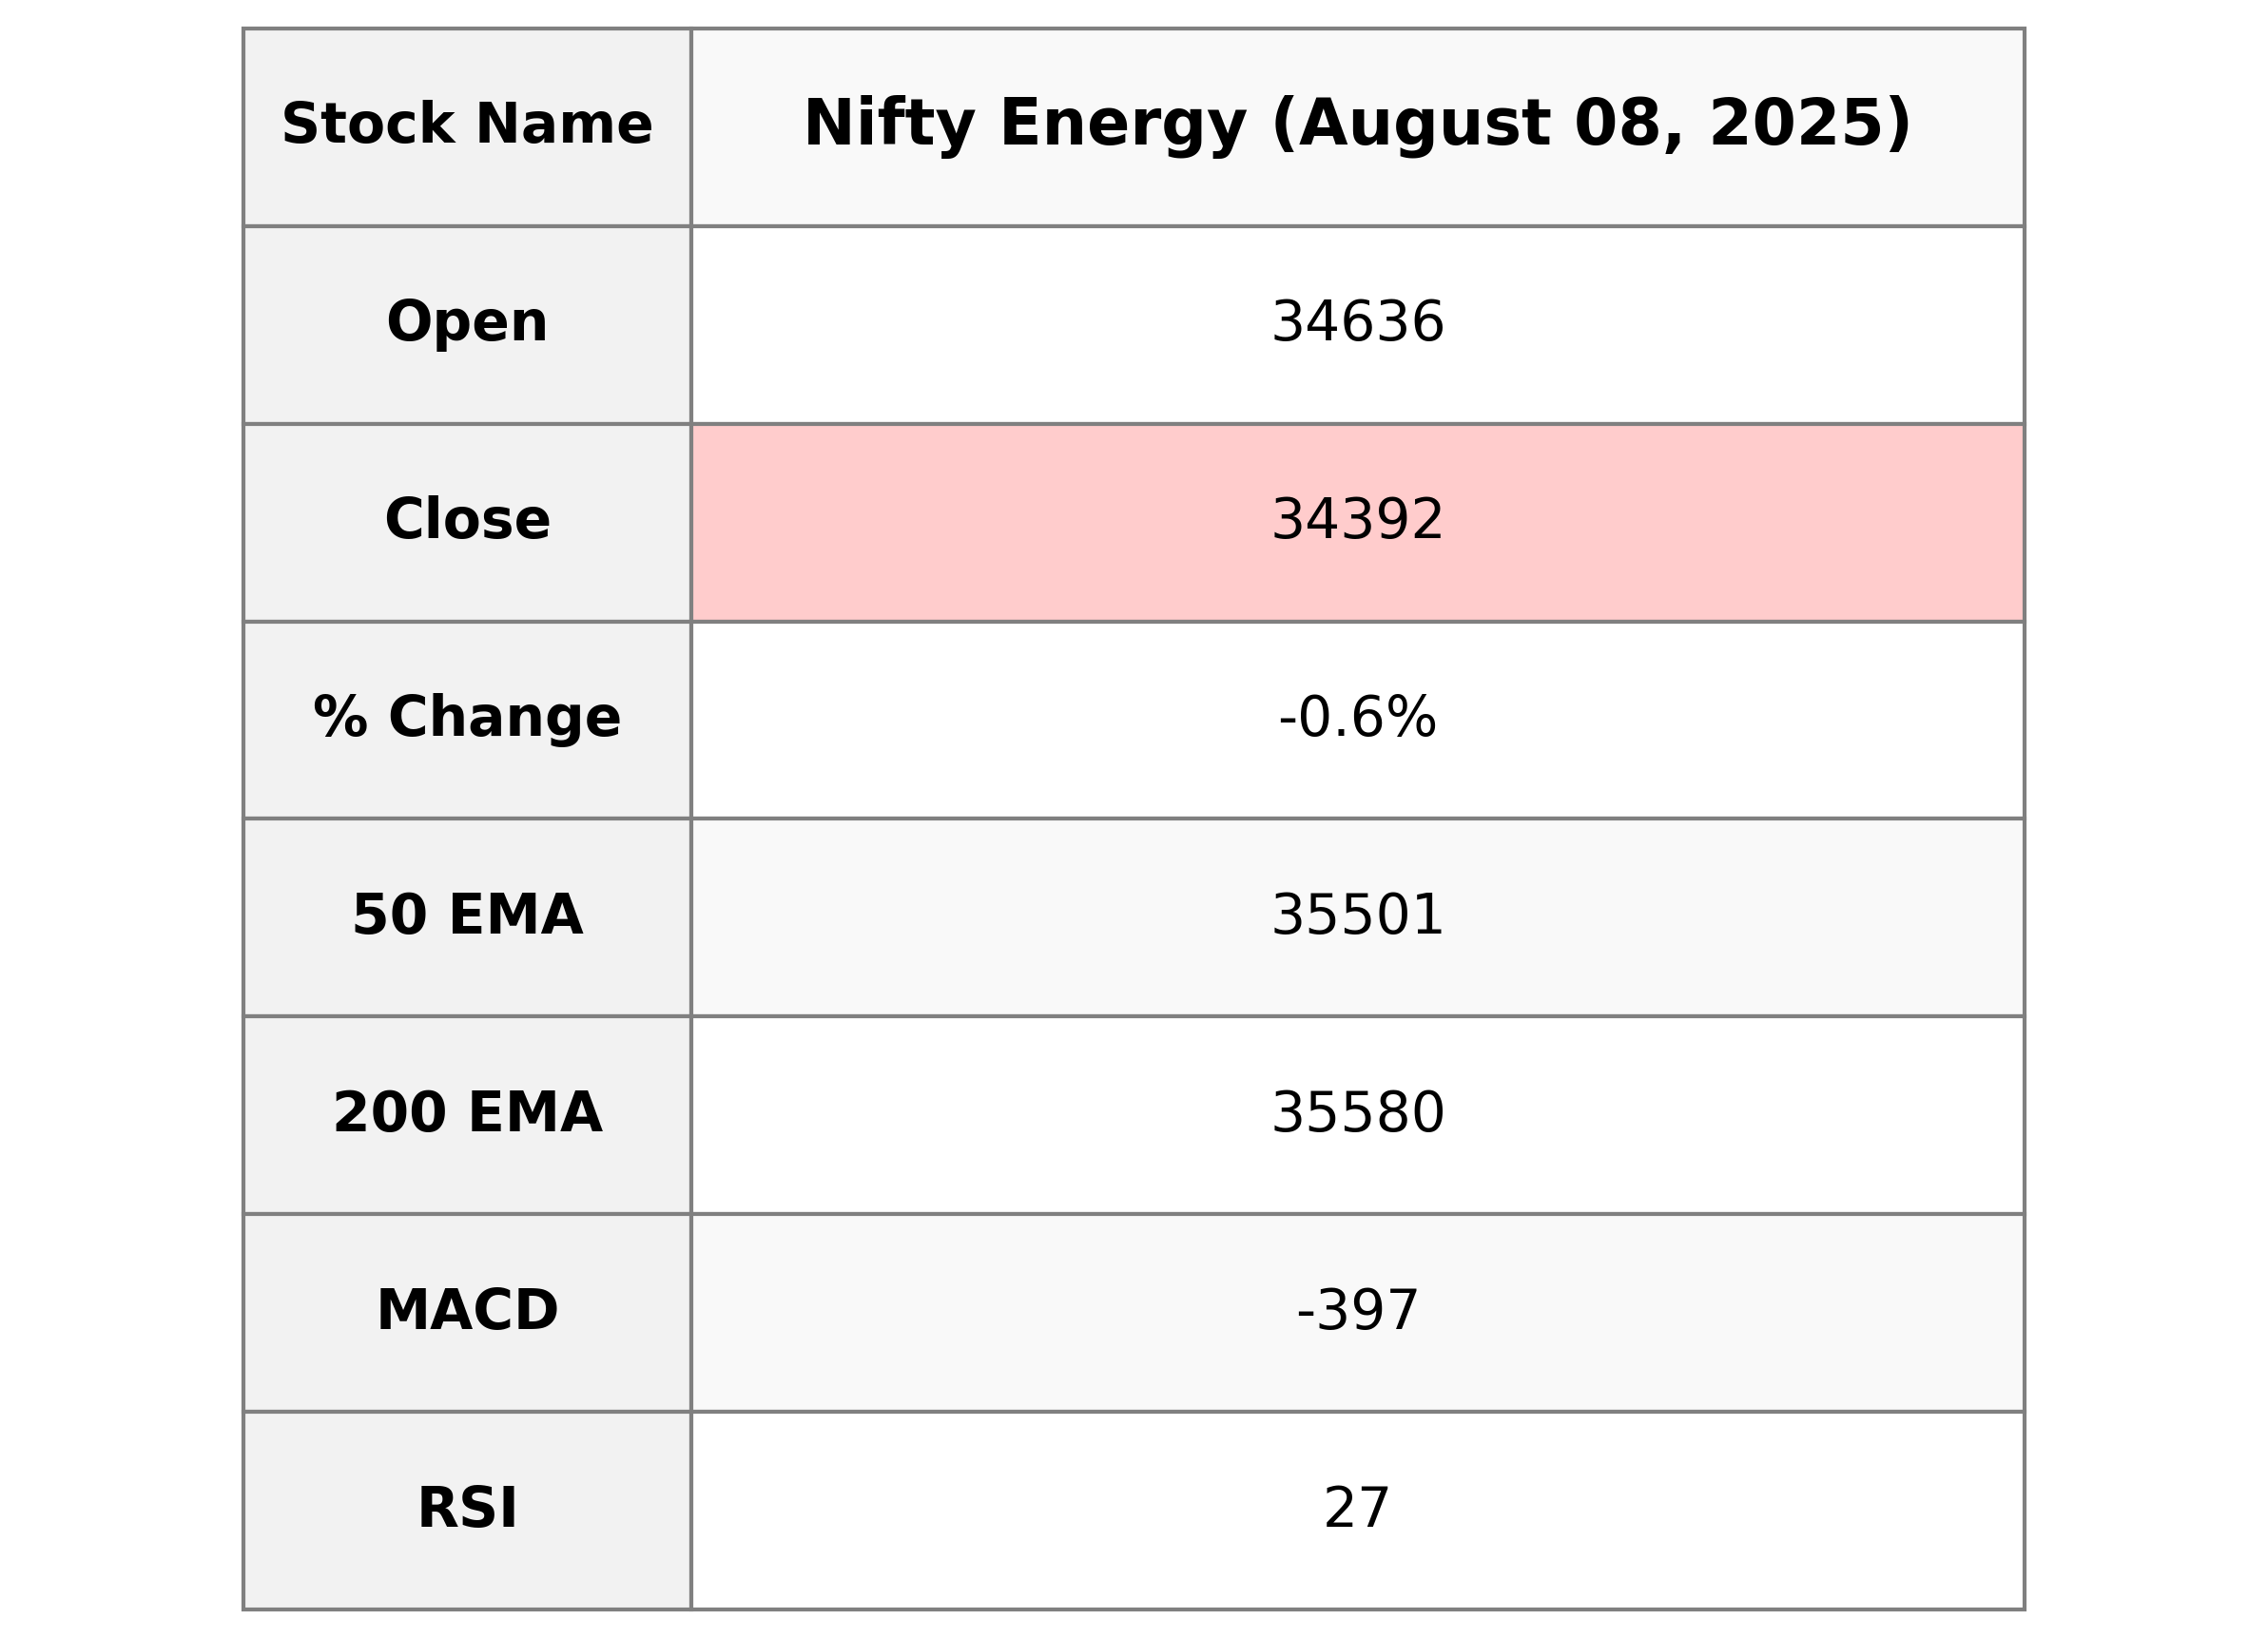
Nifty Energy Performance Summary: The Nifty Energy index opened at 34,635.55 and closed at 34,391.95, marking a decline of approximately 0.64%, translating to a decrease of 221.85 points. The index's RSI stood at 26.96, suggesting potential oversold conditions. Additionally, the MACD value indicates bearish momentum, as it sits considerably below the signal line.
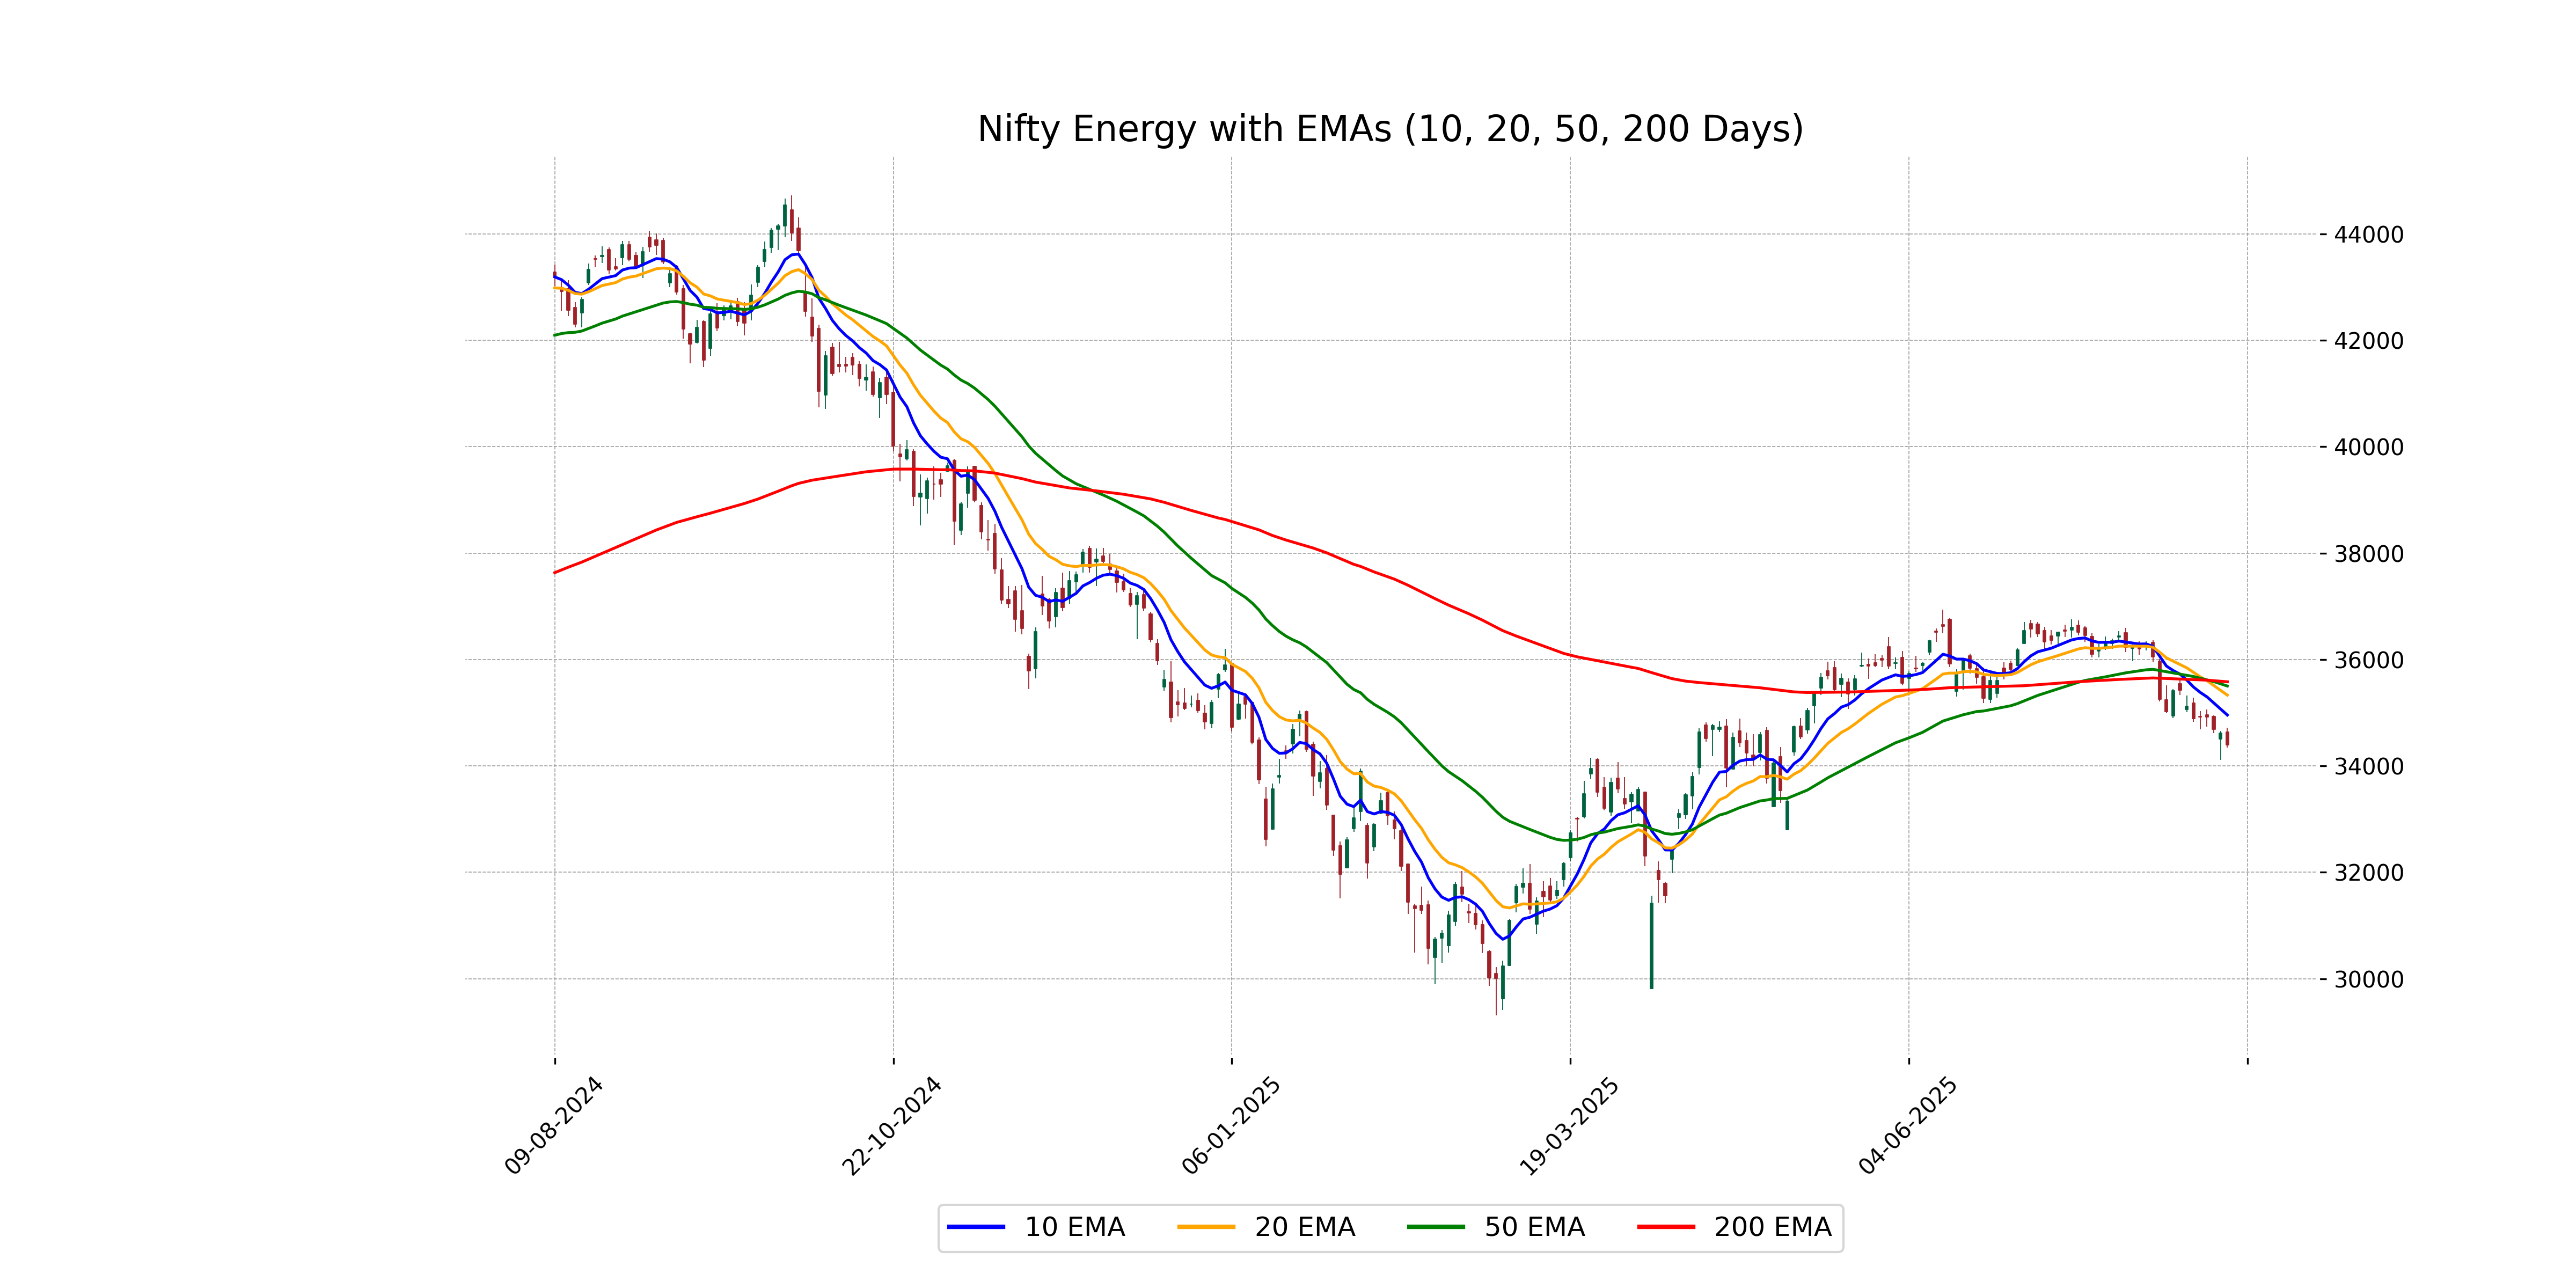
Relationship with Key Moving Averages
The closing price of Nifty Energy is 34,391.95, which is below all key moving averages: the 50-day EMA at 35,500.87, the 200-day EMA at 35,580.35, the 10-day EMA at 34,955.53, and the 20-day EMA at 35,329.18. This suggests a bearish trend, supported by the low RSI value of 26.96.
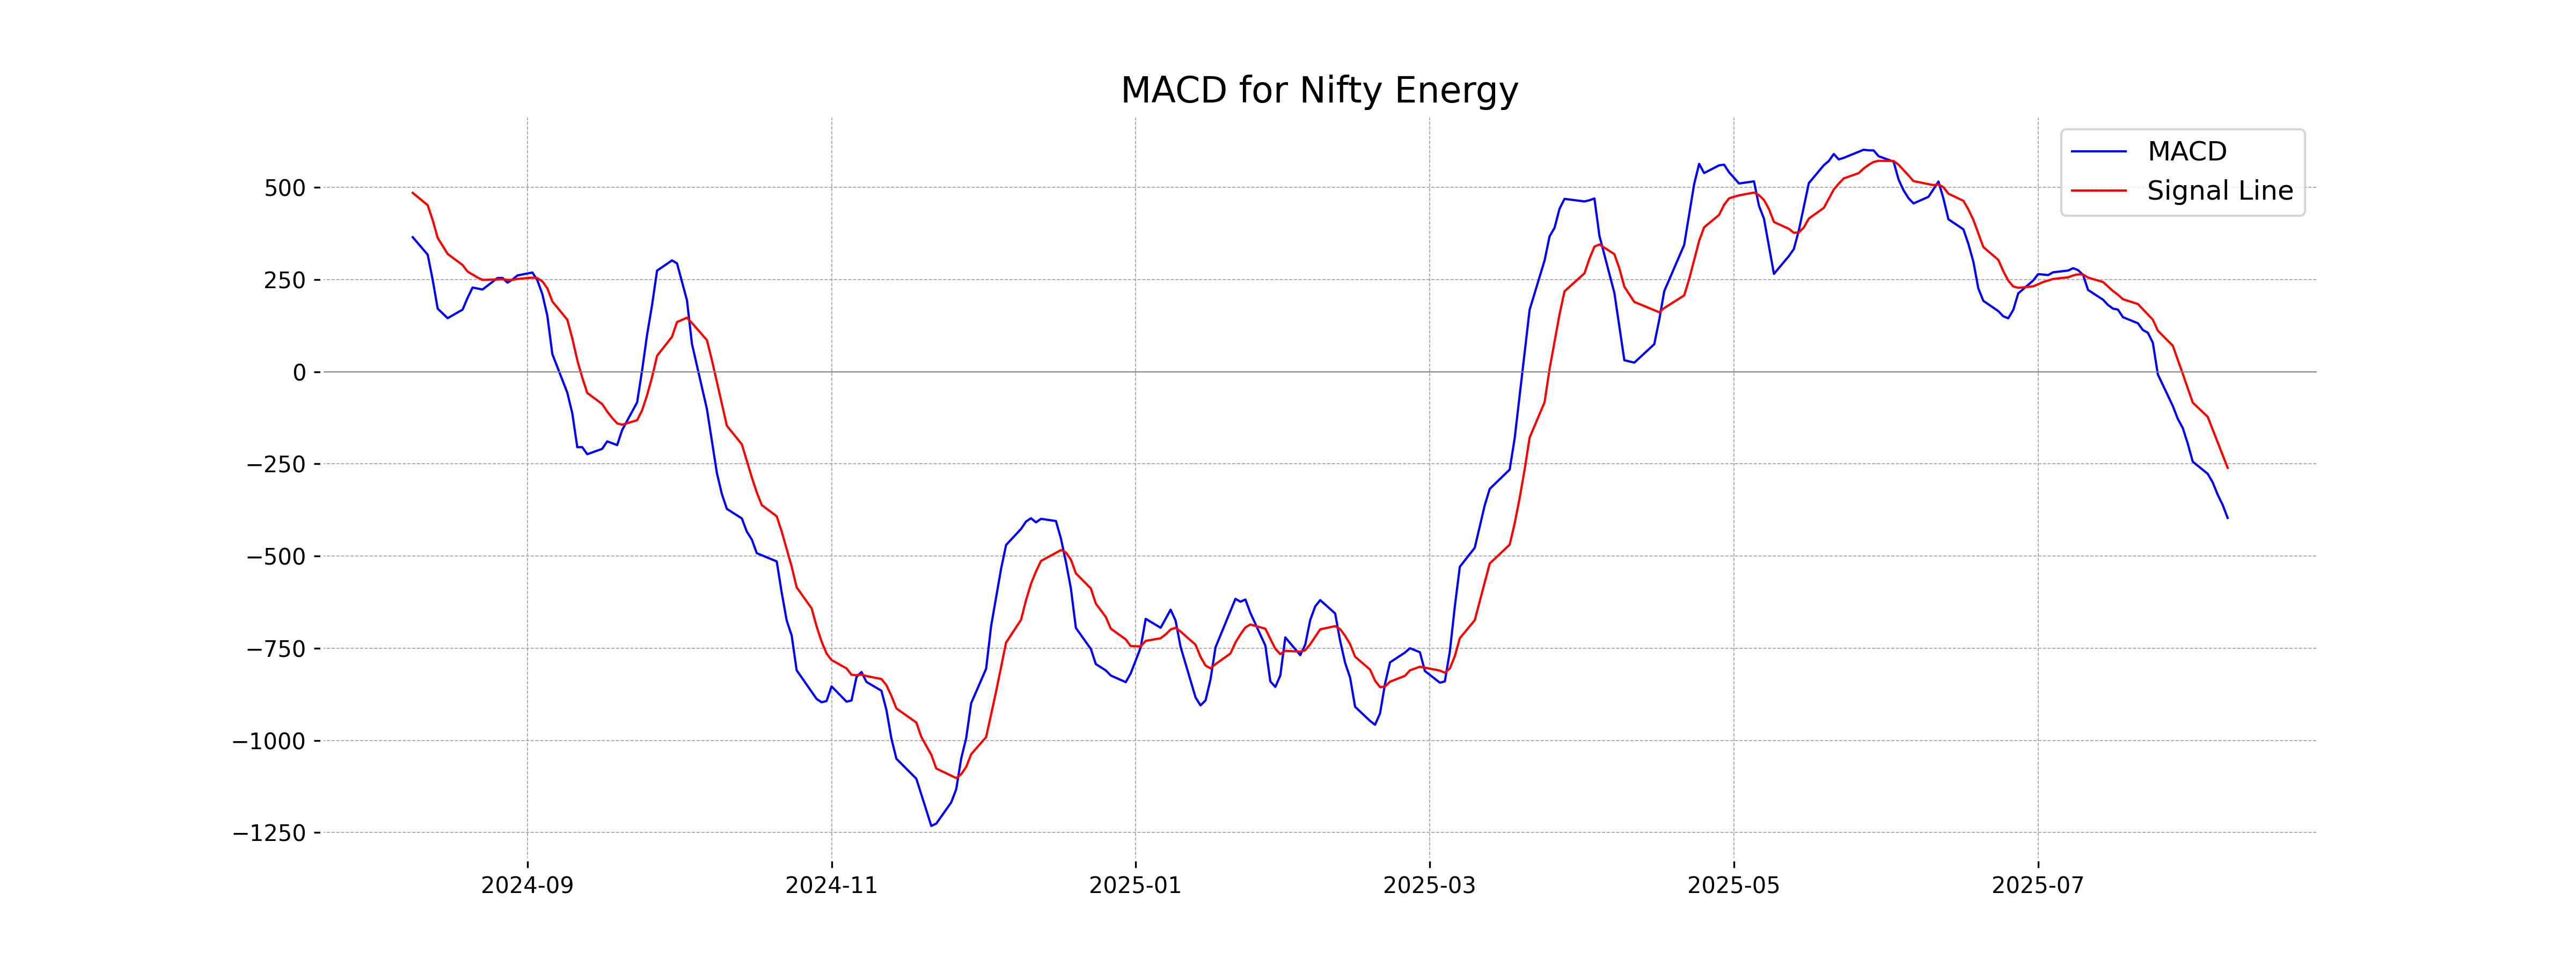
Moving Averages Trend (MACD)
Nifty Energy is exhibiting a bearish trend as observed by the MACD being well below the signal line, with MACD at -396.51 and Signal at -260.57. This indicates strong negative momentum and a potential for continued downside if conditions persist.
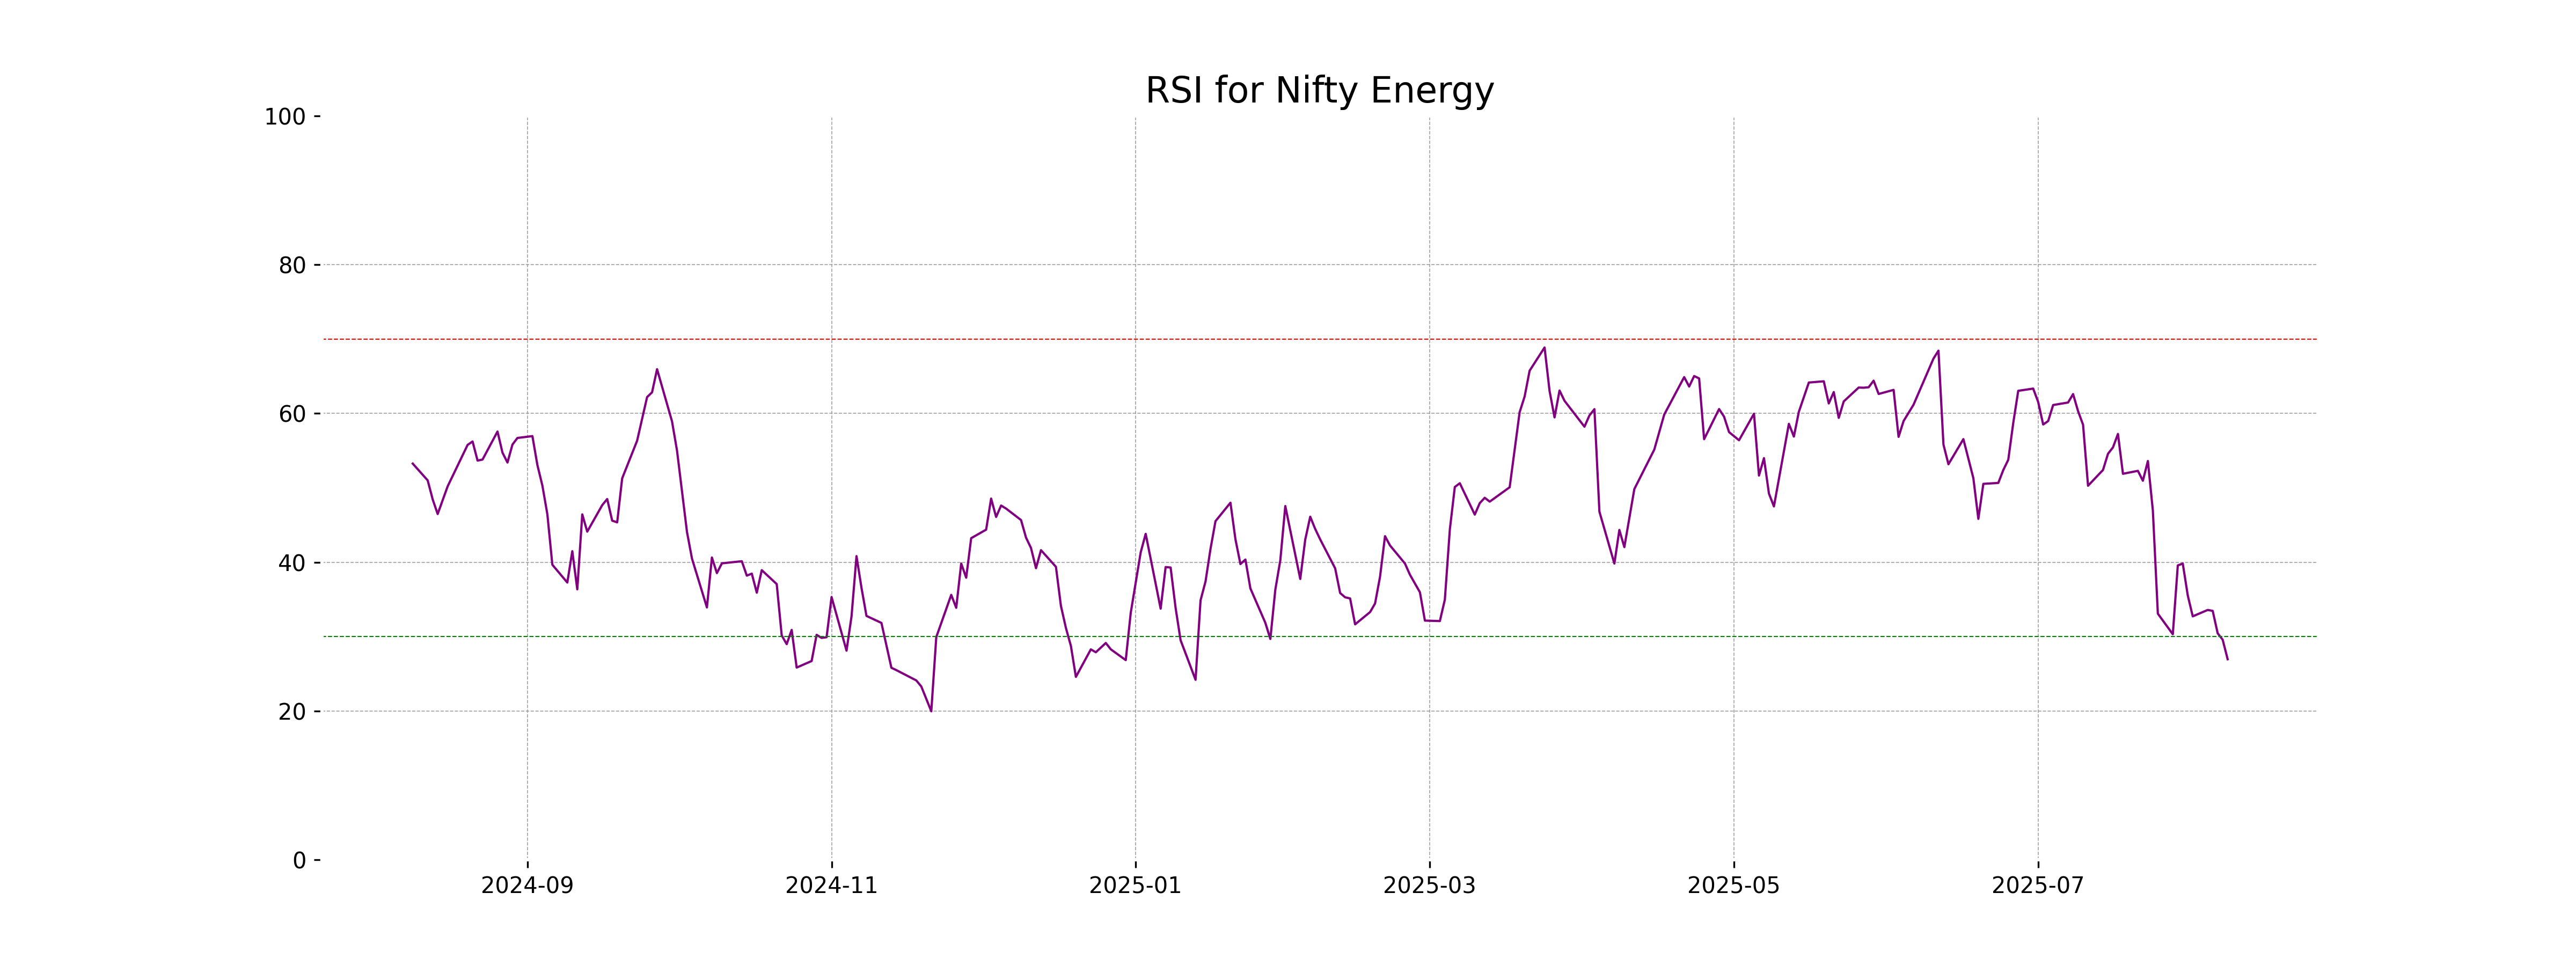
RSI Analysis
Relative Strength Index (RSI) Analysis for Nifty Energy: The RSI for Nifty Energy is 26.96, indicating that the stock is currently in the oversold territory. This suggests that the stock might be undervalued at the moment, and there could be potential for a price correction or upward movement.
Analysis for Nifty FMCG - August 08, 2025

Nifty FMCG Performance: The Nifty FMCG index opened at 55,343.95 and closed lower at 54,900.95, marking a decrease of 0.72% or a 397.55-point drop from its previous close of 55,298.5. The relative strength index (RSI) stands at 42.93, pointing towards weakening momentum in the market, while the MACD is negative at -46.57, signaling bearish conditions. The stock traded below its 50-day, 100-day, and 200-day exponential moving averages, indicating a potential downtrend. High volume data is not available for this stock.
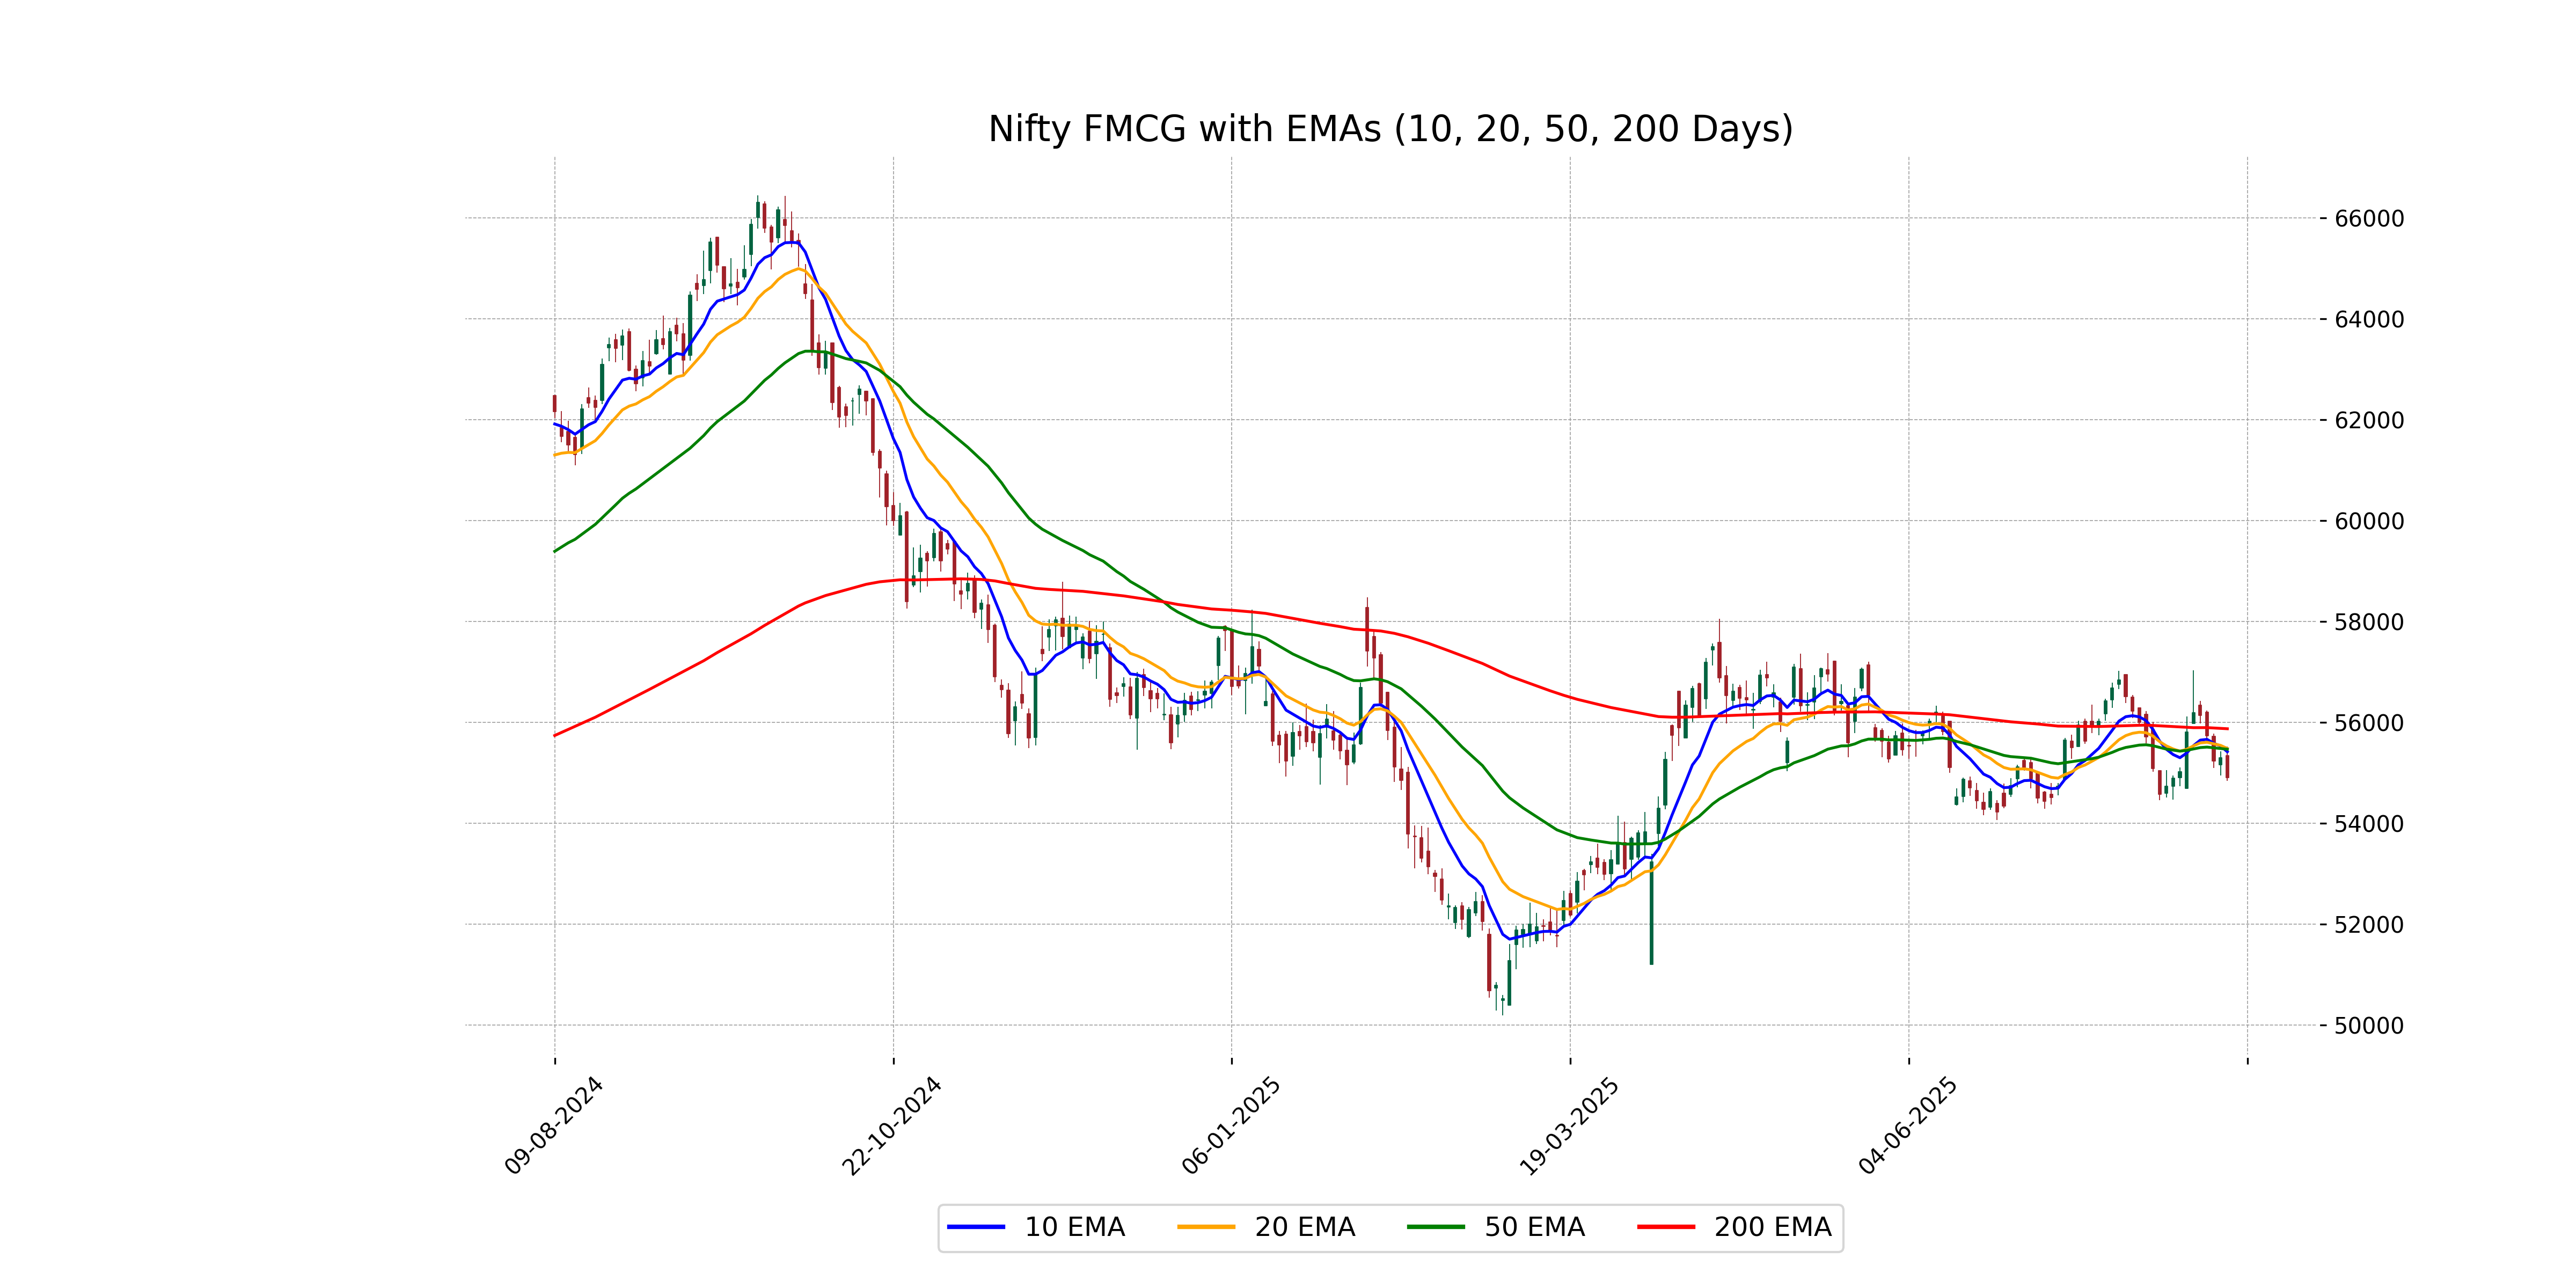
Relationship with Key Moving Averages
For Nifty FMCG, the closing price of 54,900.95 is below the 50-EMA (55,468.61), 200-EMA (55,874.43), 10-EMA (55,418.25), and 20-EMA (55,483.93), indicating a bearish trend with a negative price momentum. The RSI at 42.93 suggests that the index is approaching oversold territory.
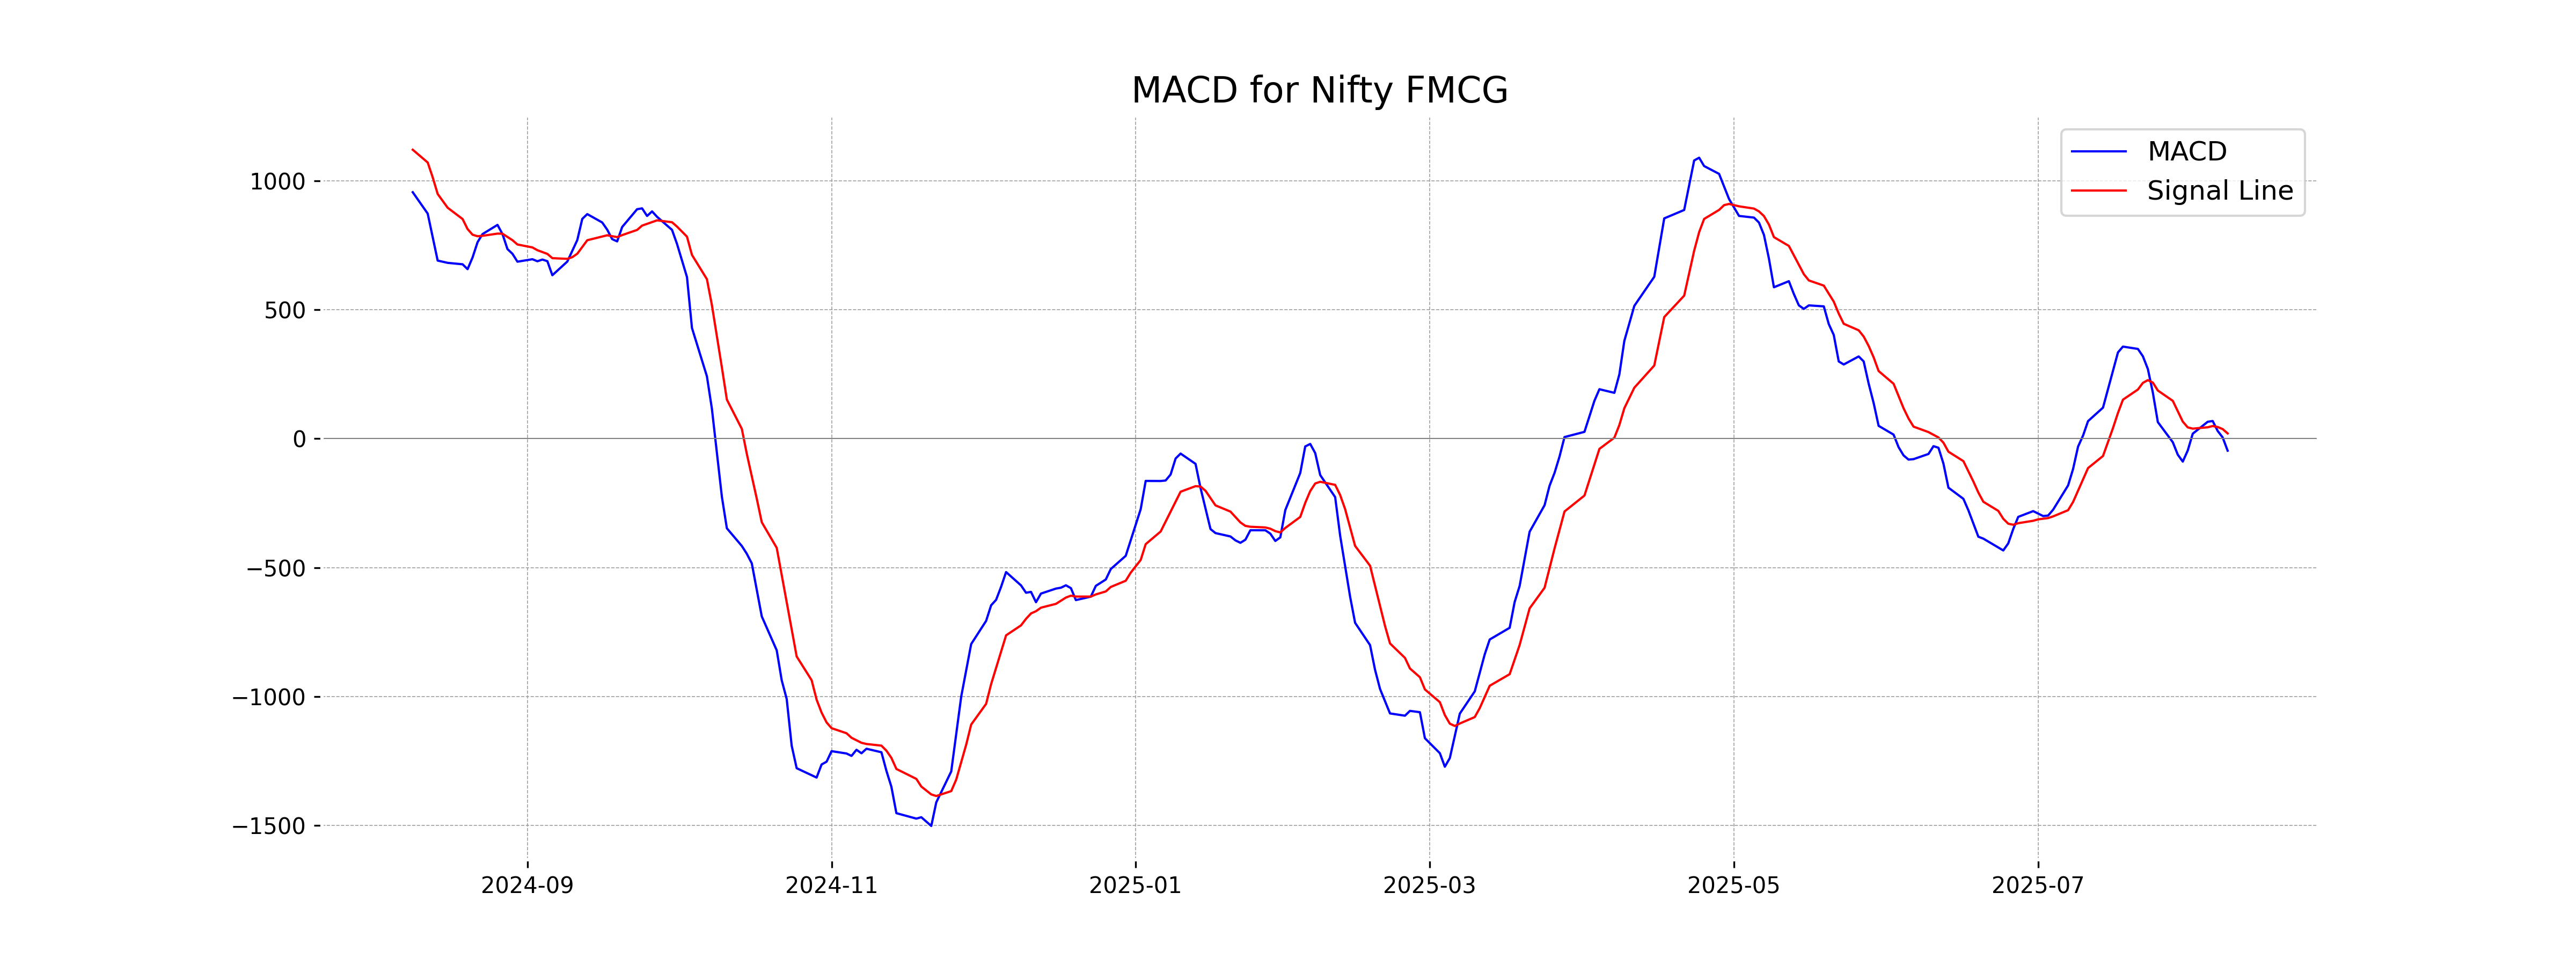
Moving Averages Trend (MACD)
The MACD for Nifty FMCG is currently at -46.57, with the MACD signal line at 20.45. This indicates that the MACD line is below the signal line, suggesting bearish momentum. Additionally, the negative MACD value suggests a potential downtrend in the short term.
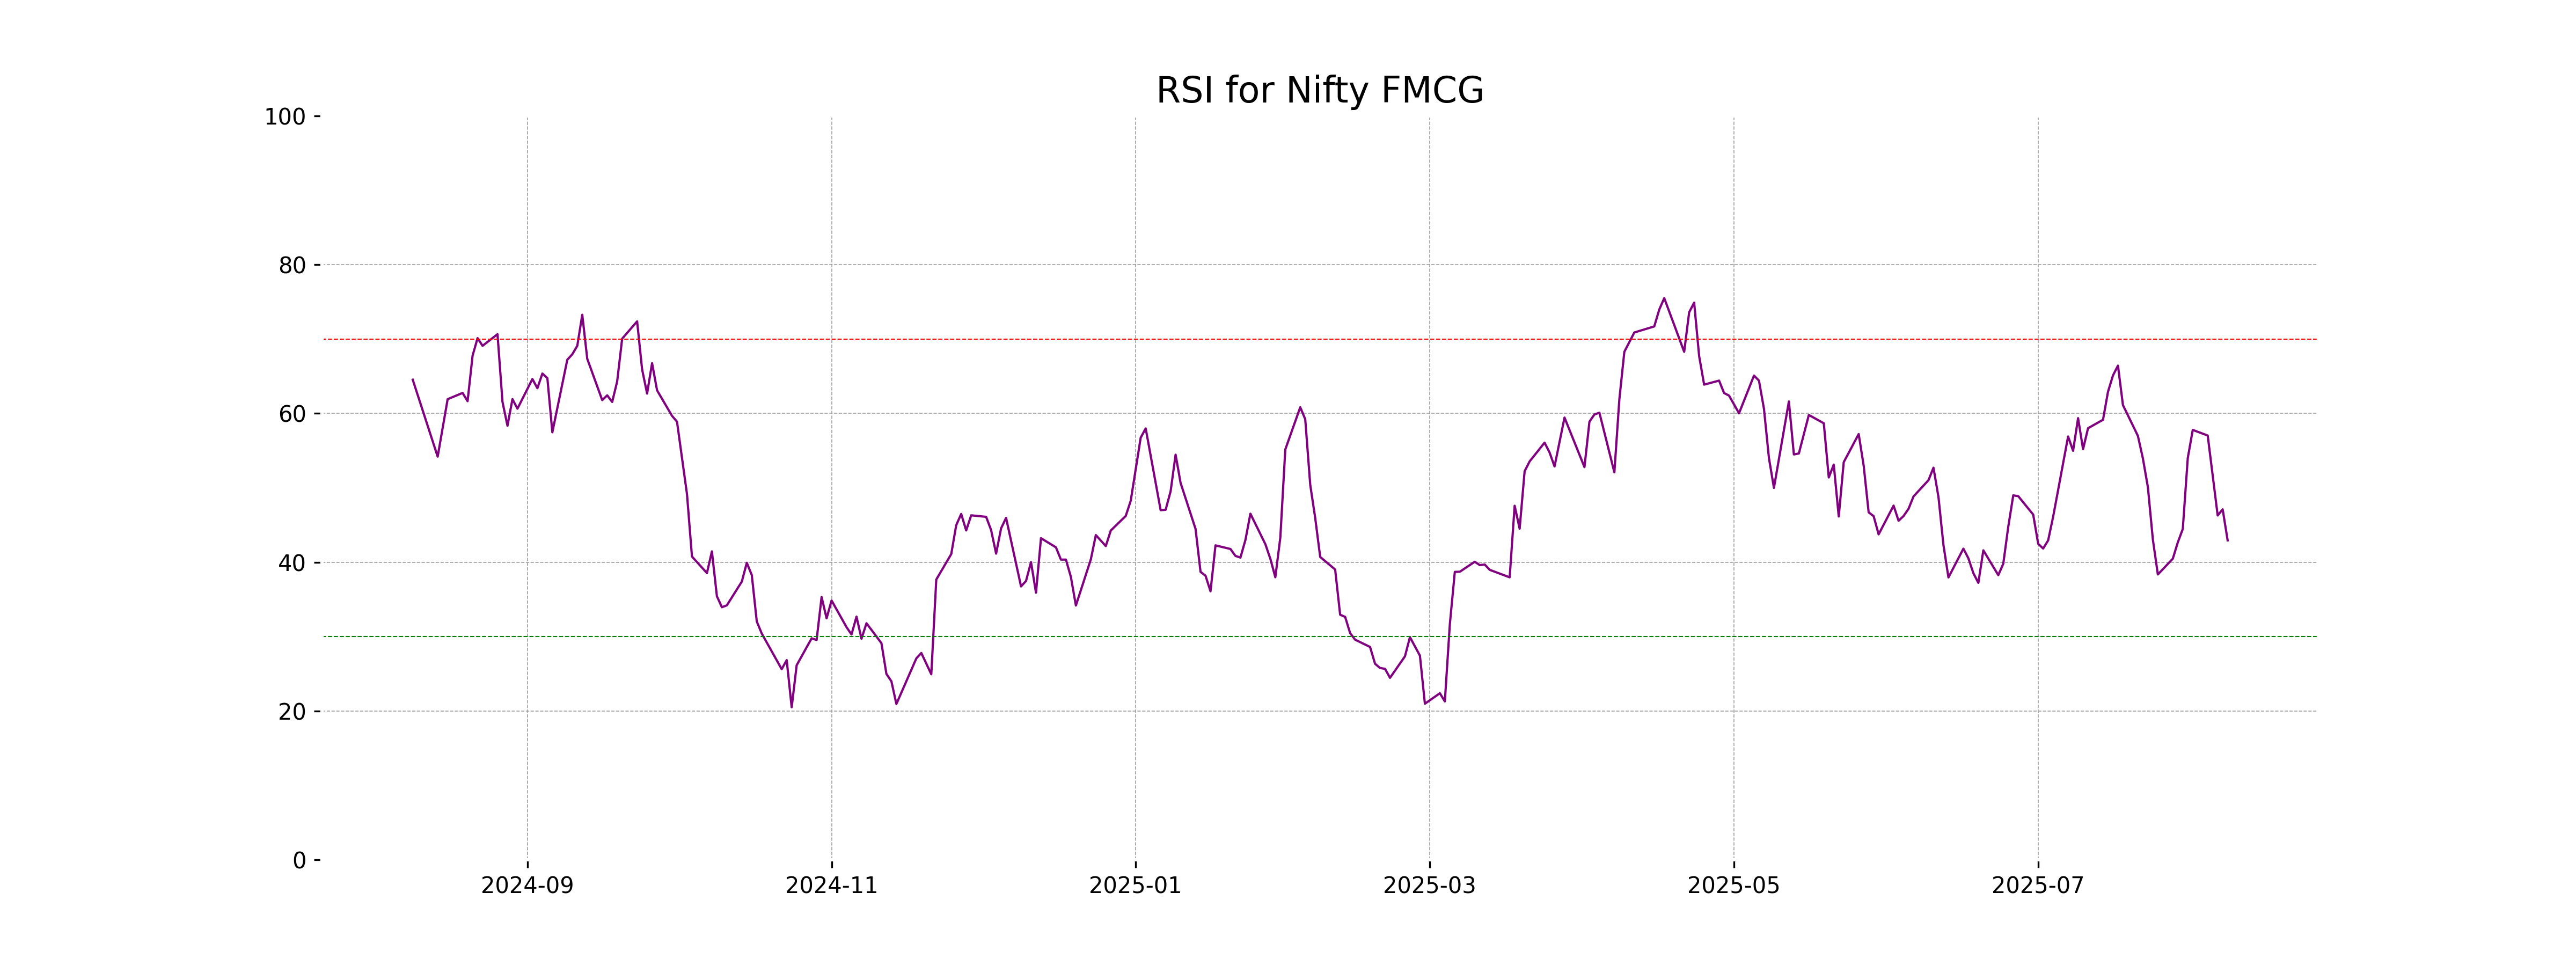
RSI Analysis
The Relative Strength Index (RSI) for Nifty FMCG is 42.93, suggesting that the stock is currently in a neutral territory and not facing strong overbought or oversold conditions. This level indicates that there might be some bearish momentum, but it's not in the oversold threshold below 30. Traders may want to wait for additional signals before making trading decisions based on RSI alone.
Analysis for Nifty Infra - August 08, 2025
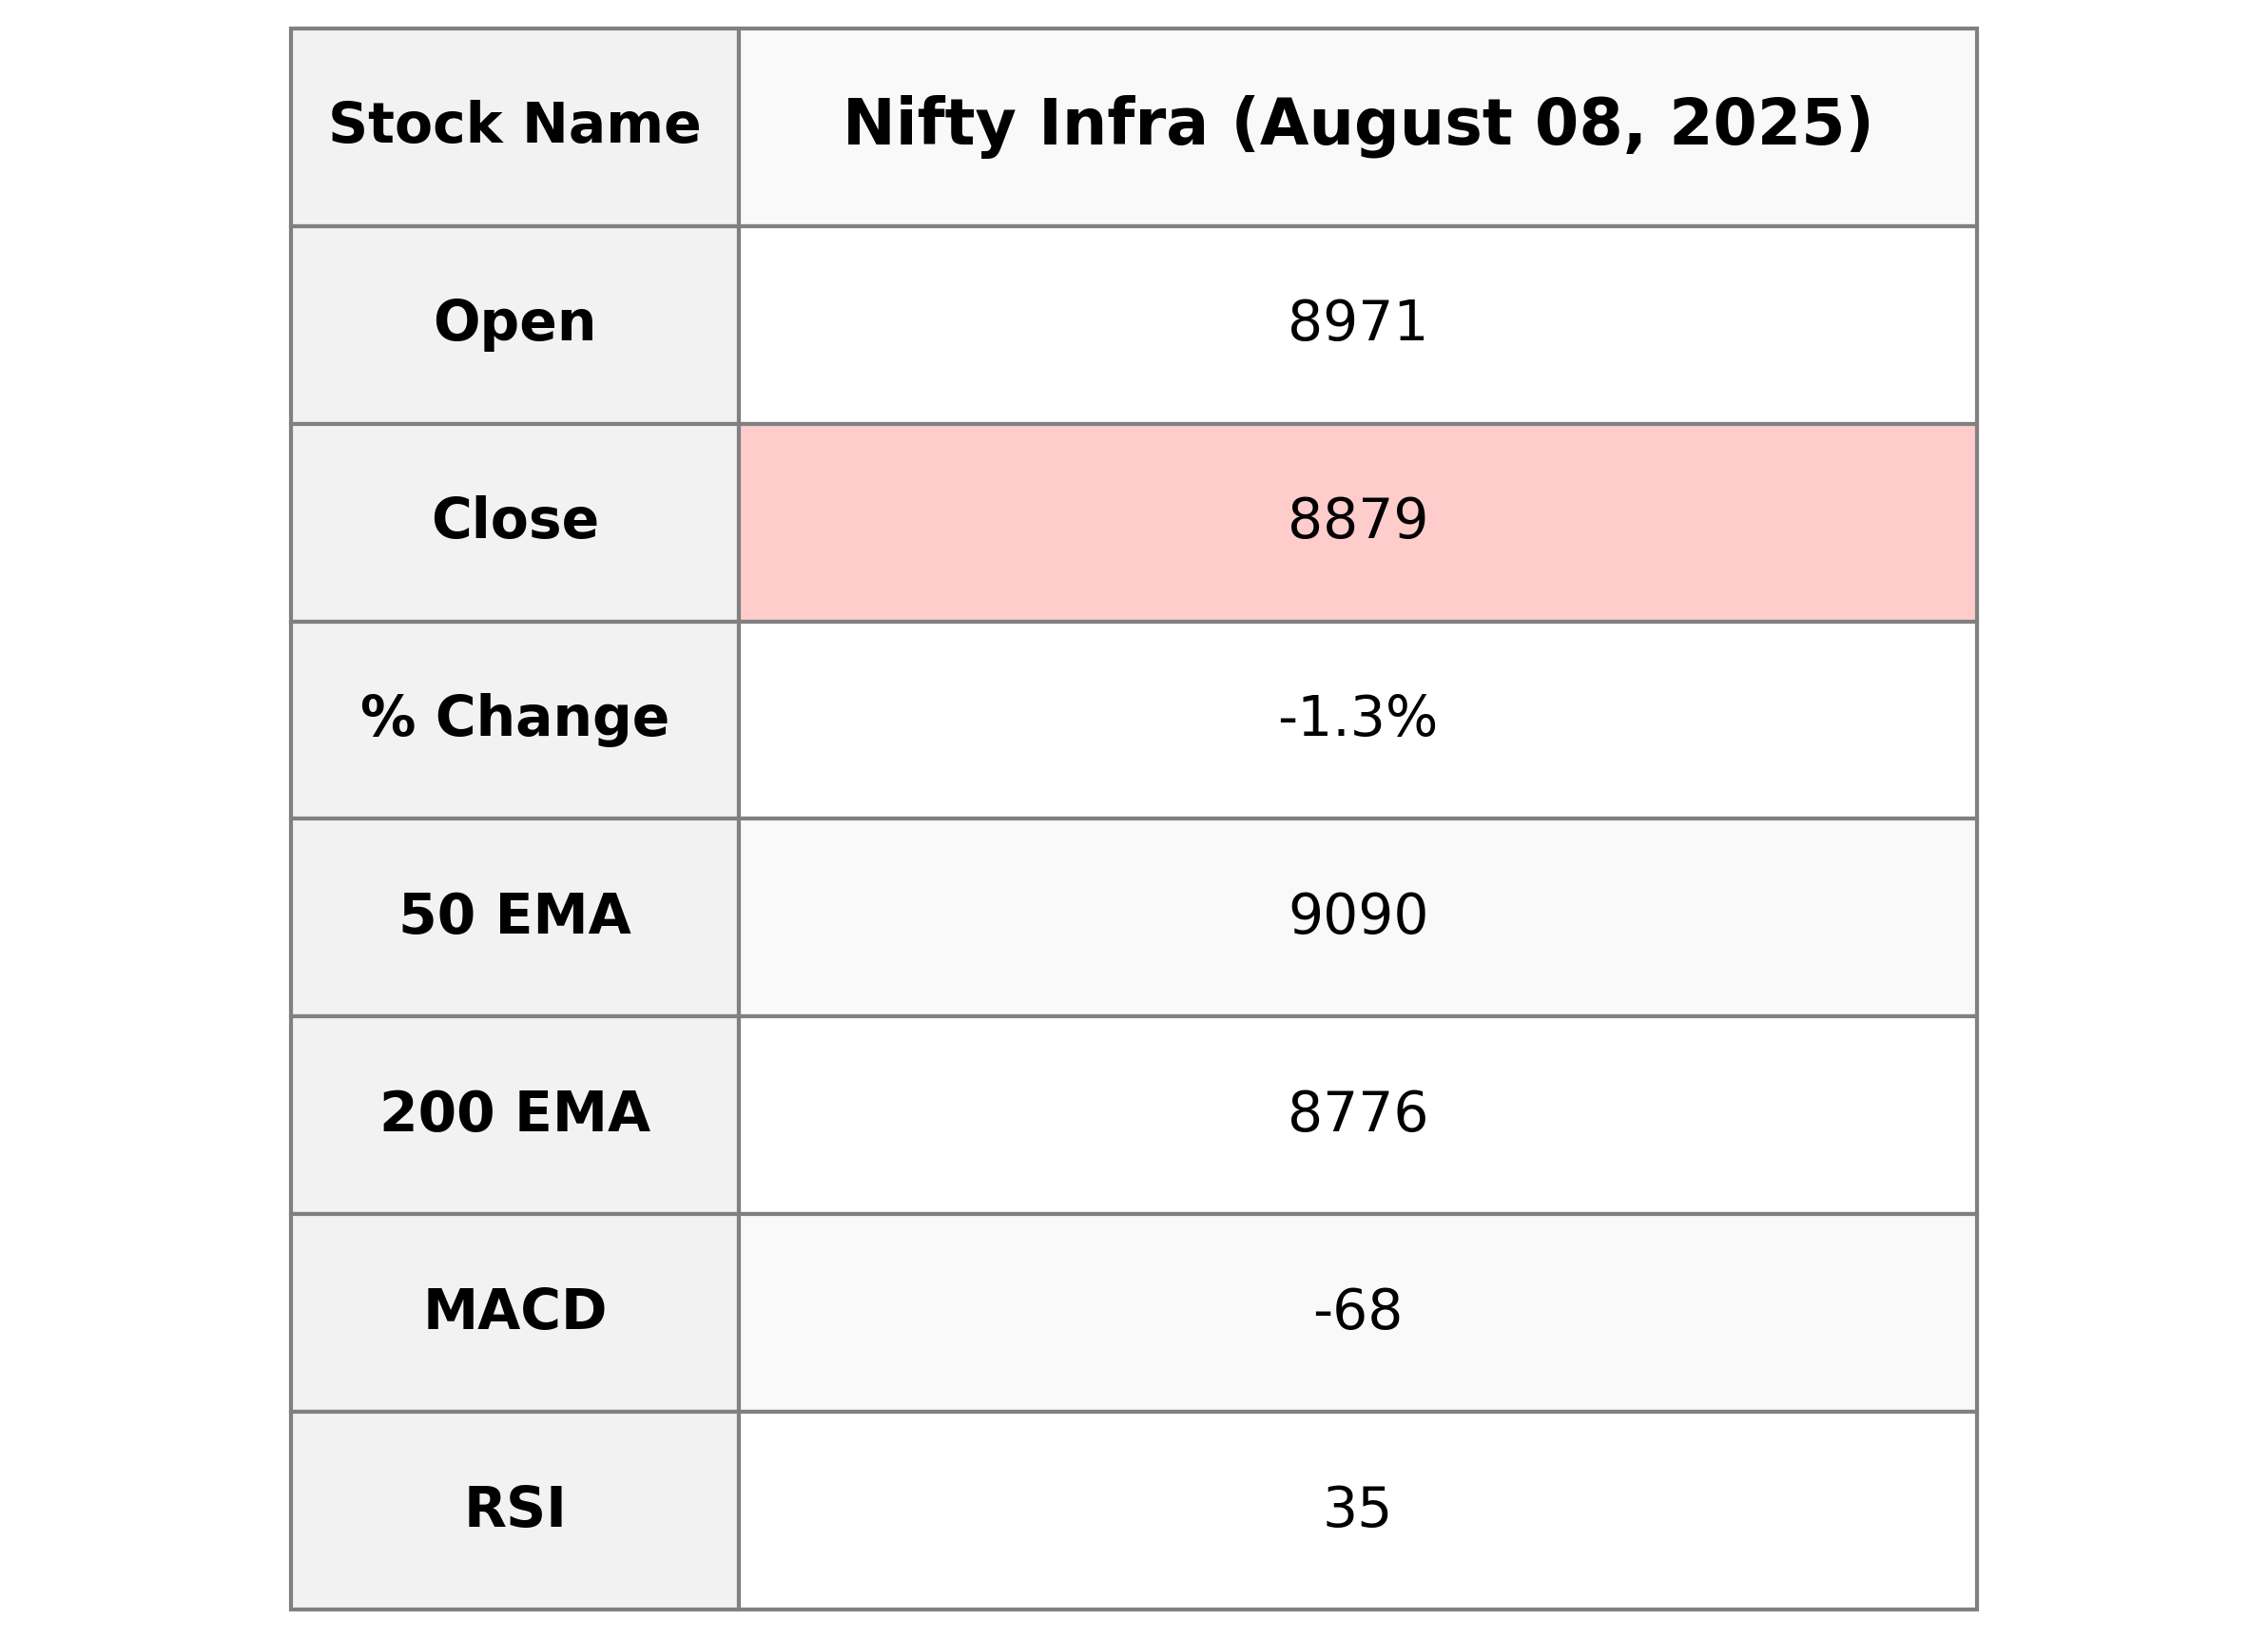
The Nifty Infra index opened at 8970.9 and closed at 8879.1, experiencing a decline of 1.30% with a points change of -116.9. The index is showing bearish sentiment with an RSI of 34.76, suggesting potential oversold conditions, while the MACD indicates a negative trend.
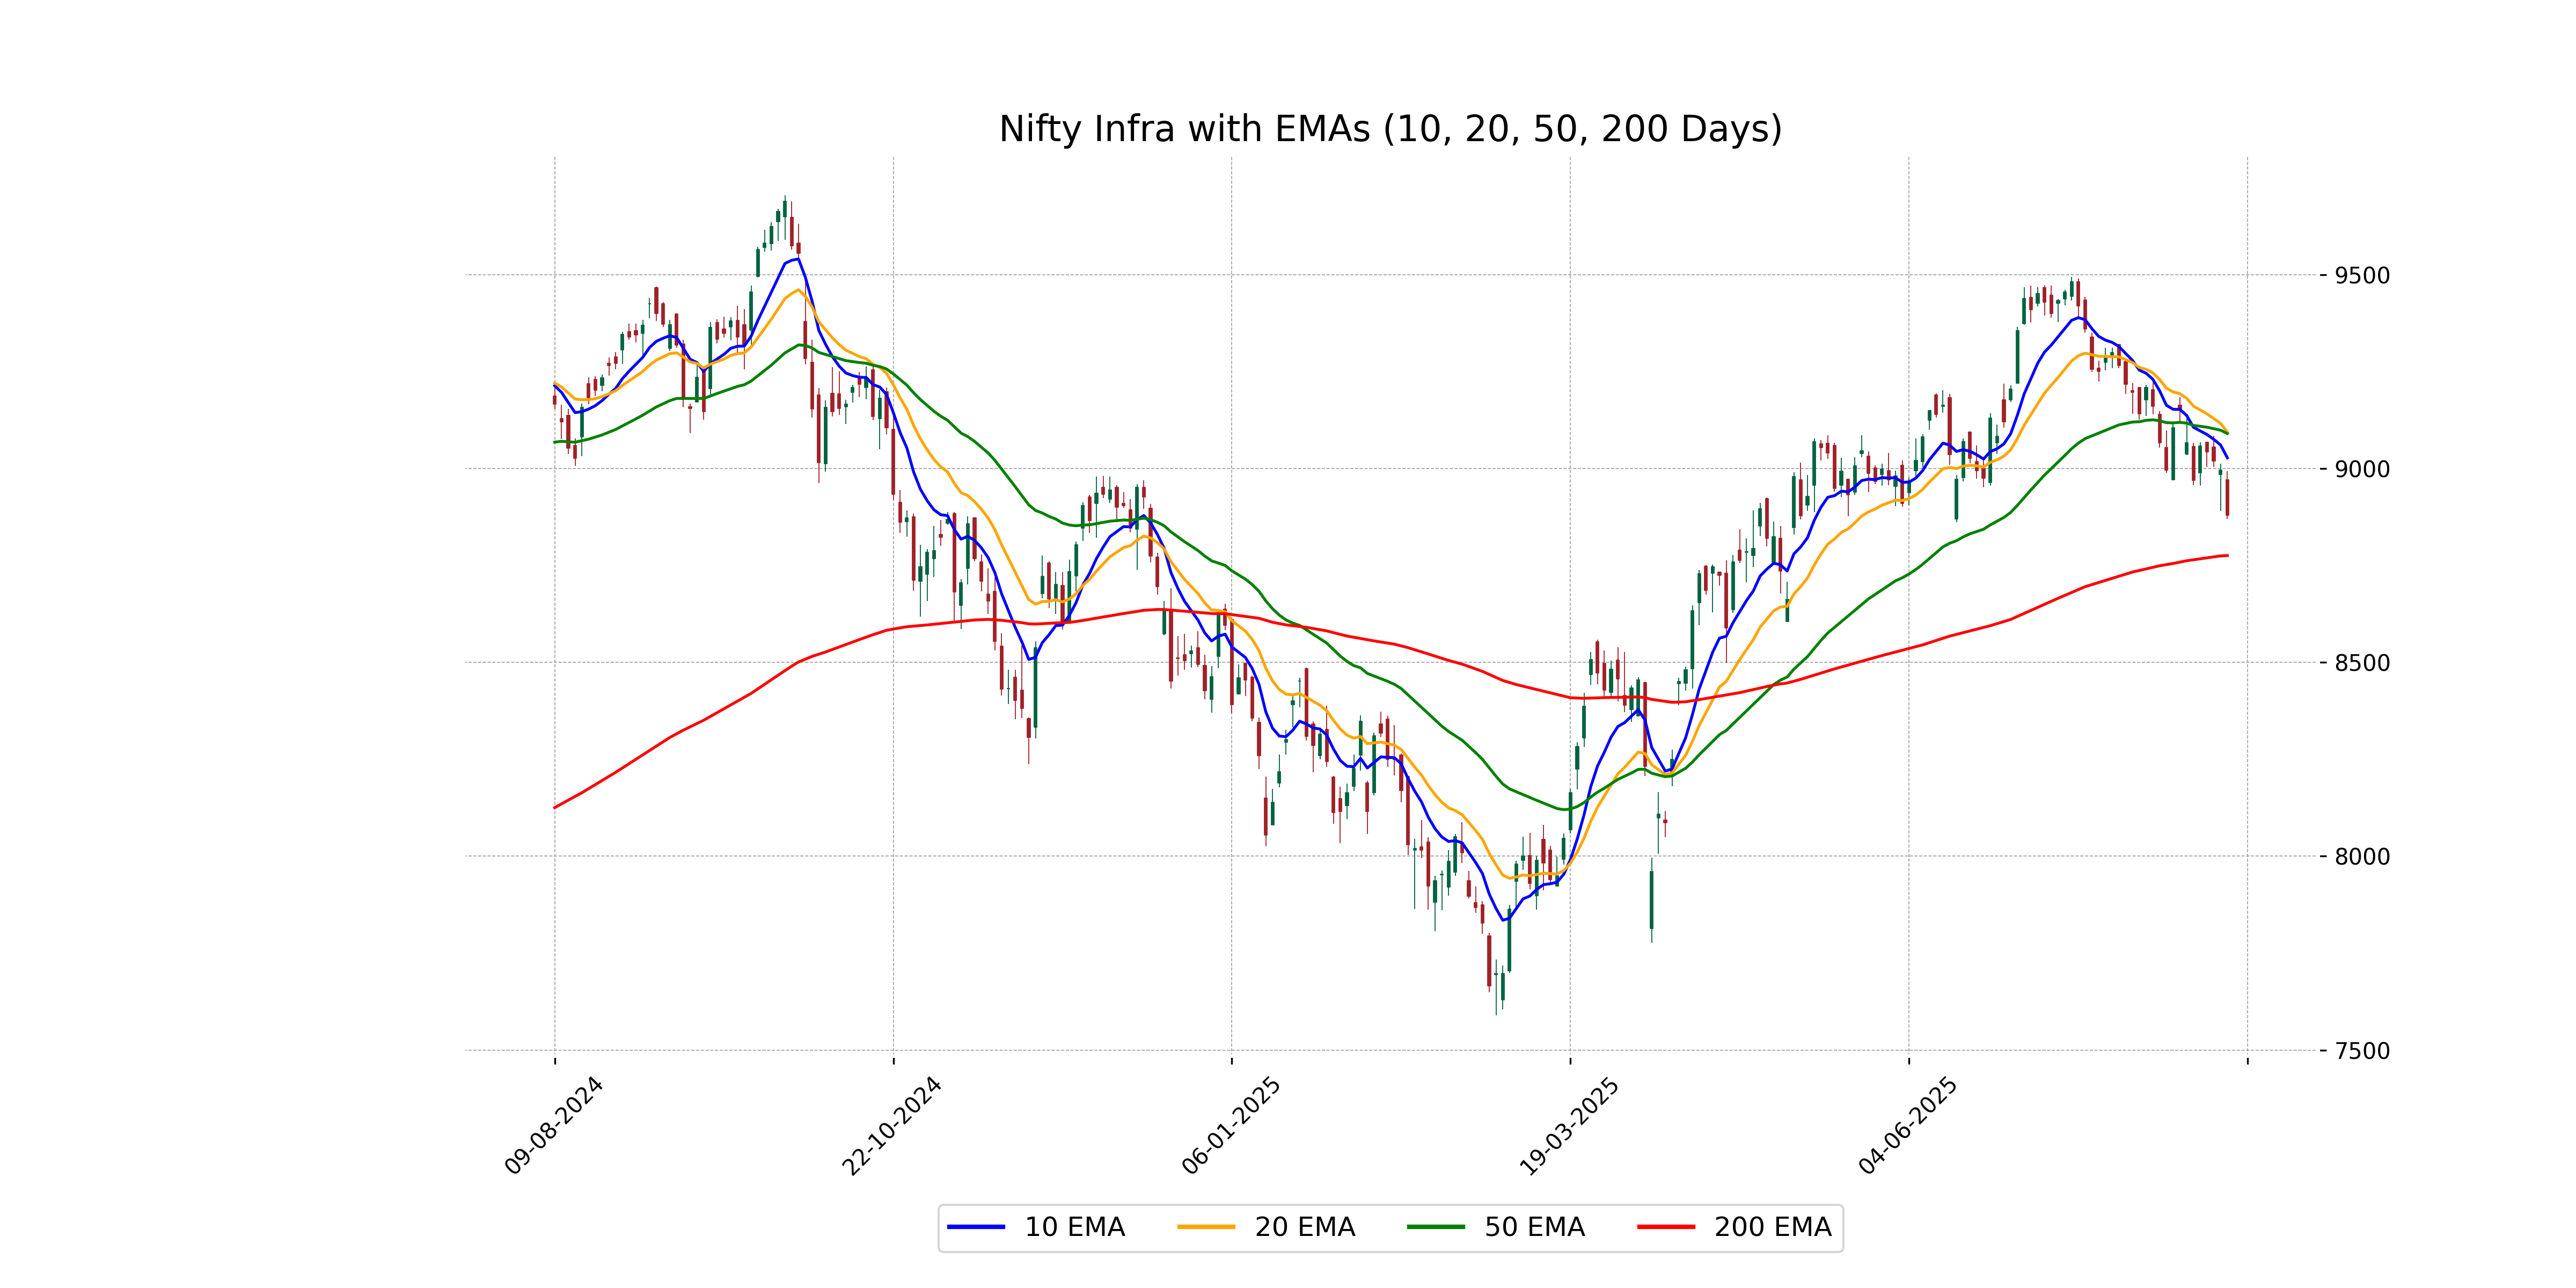
Relationship with Key Moving Averages
Nifty Infra's closing price of 8879.10 is below its 50-day EMA of 9090.34 and 10-day EMA of 9027.75, but above its 200-day EMA of 8775.66. This suggests a short-term bearish trend with potential longer-term support.
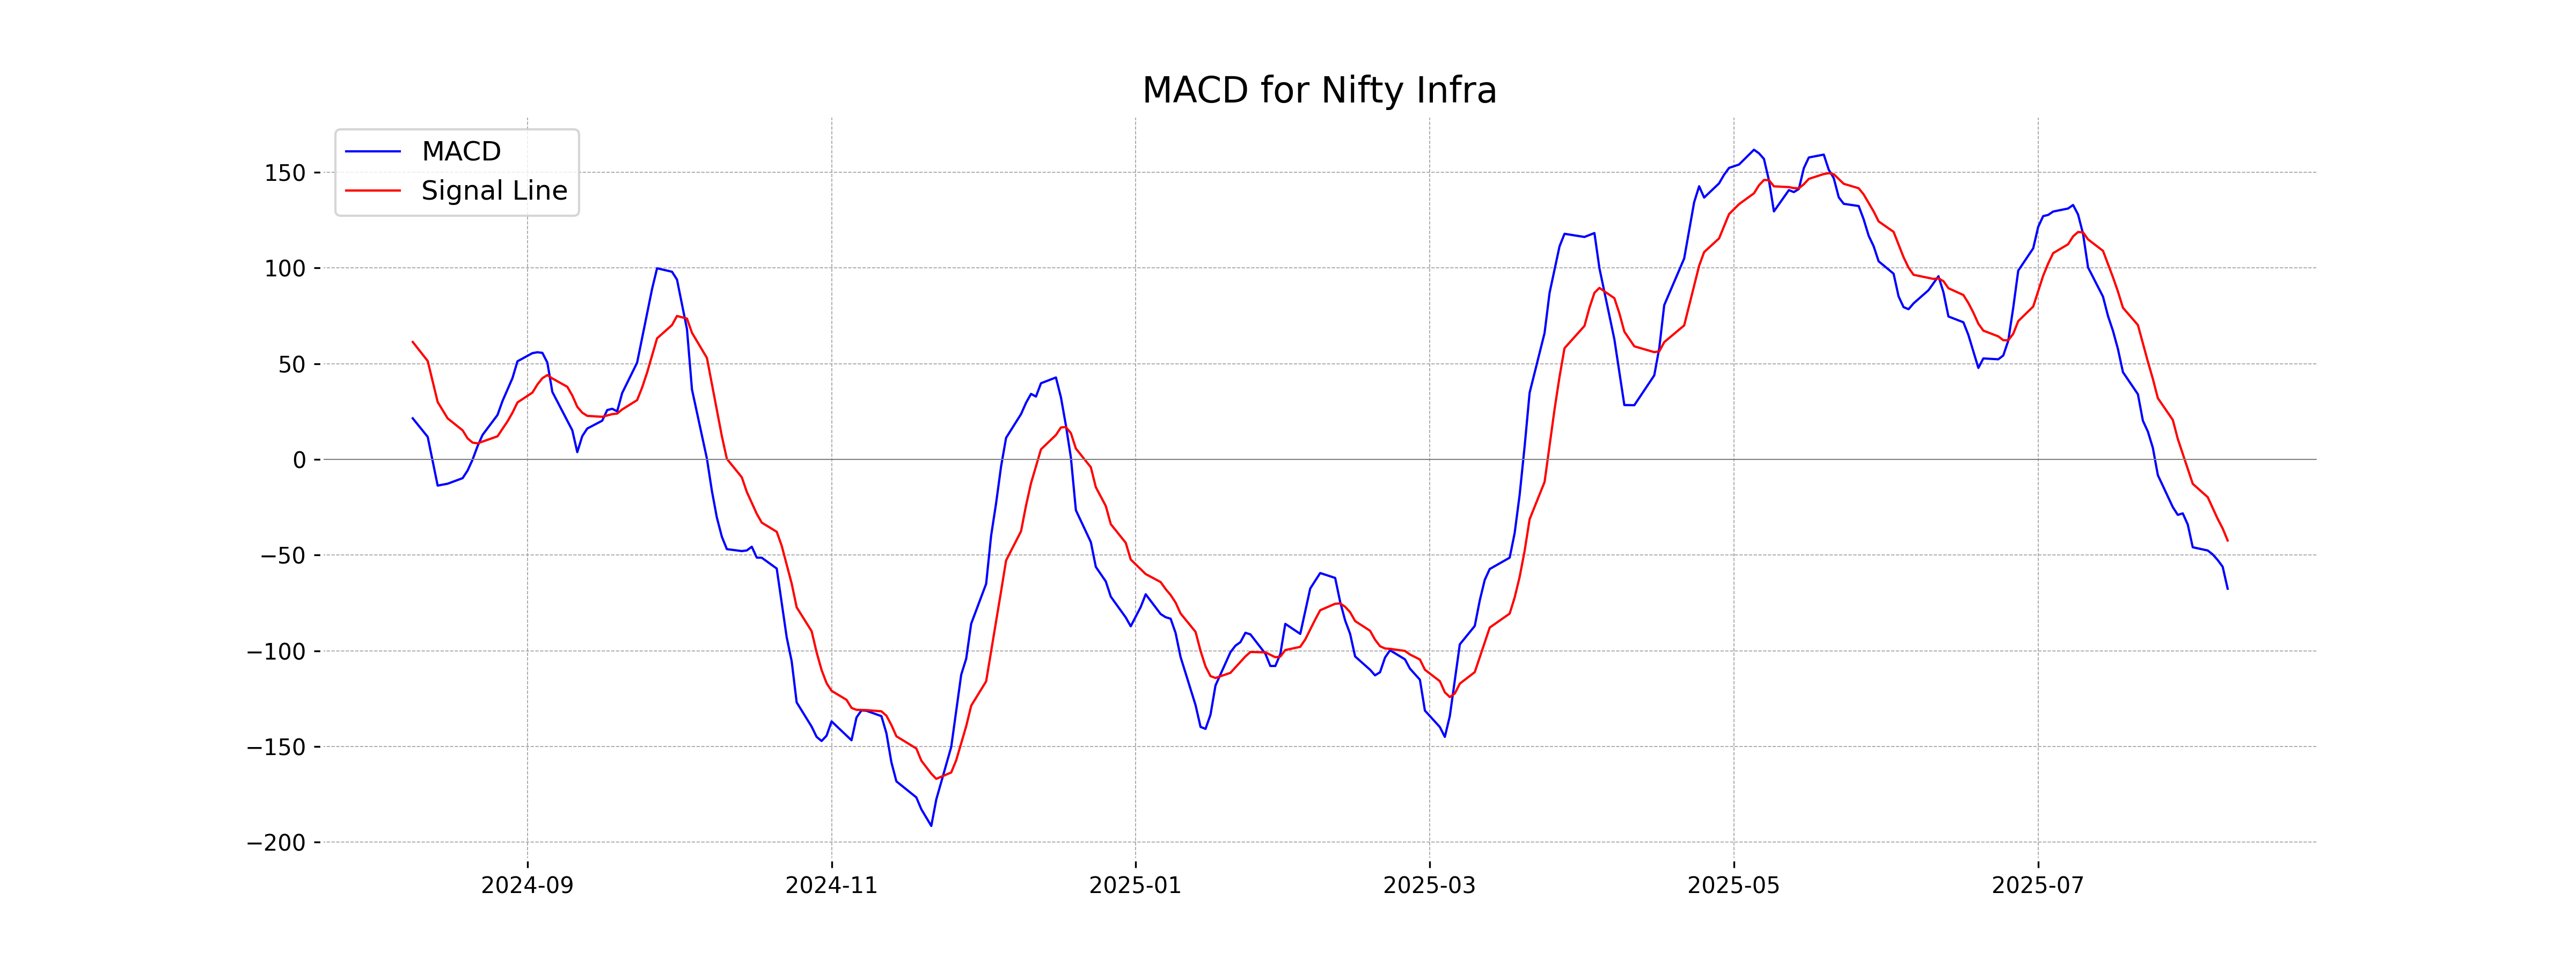
Moving Averages Trend (MACD)
The MACD value for Nifty Infra is -67.57, which is below the MACD Signal of -42.40. This indicates a bearish momentum in the short term, suggesting potential further declines unless a reversal occurs.
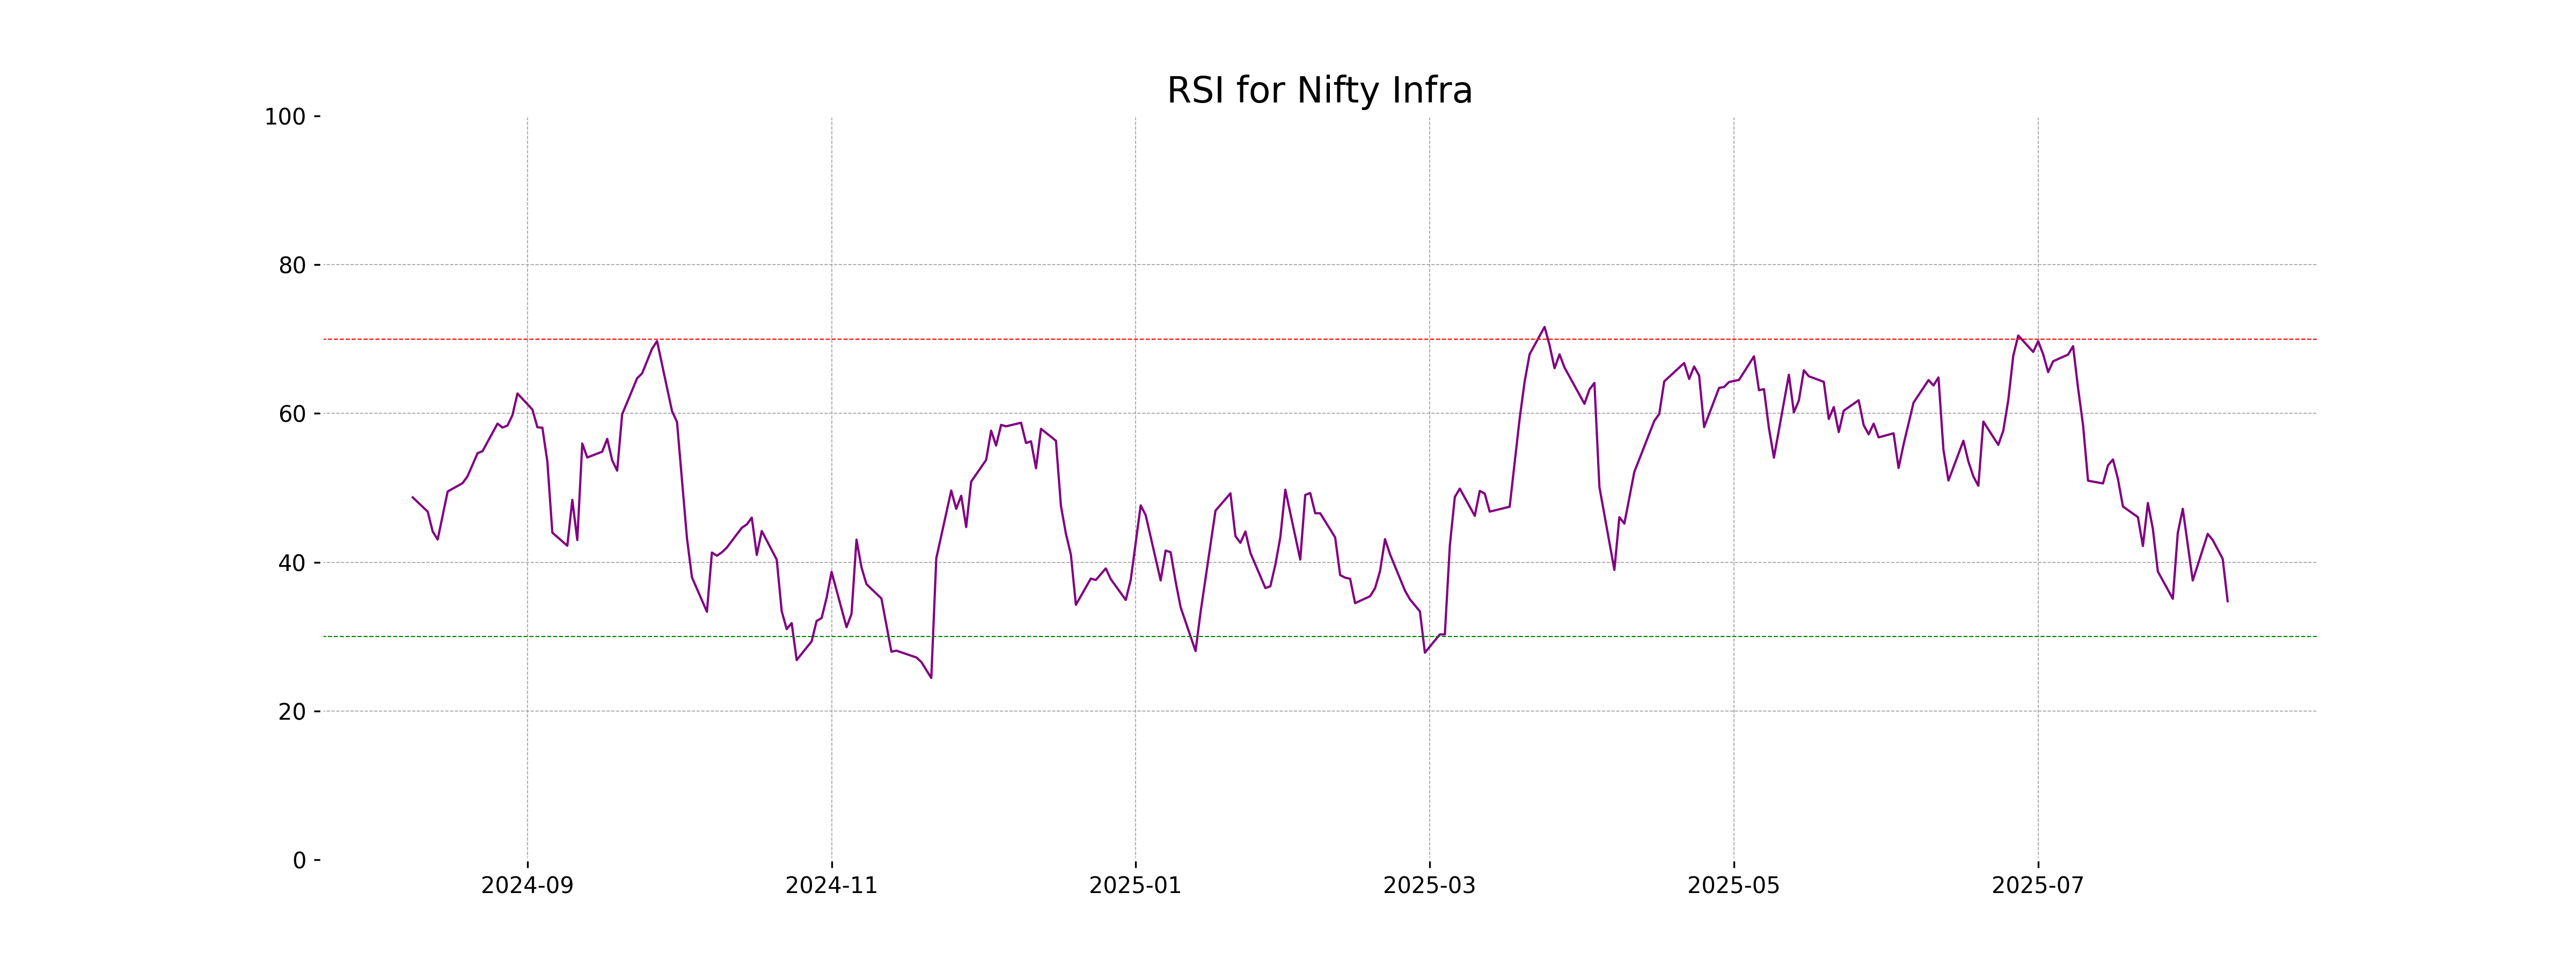
RSI Analysis
The RSI for Nifty Infra is 34.76, indicating that the stock is approaching oversold conditions. Generally, an RSI below 30 is considered oversold, suggesting potential for a price reversal. However, it's important to consider other technical indicators and market conditions before making any investment decisions.
Analysis for Nifty IT - August 08, 2025
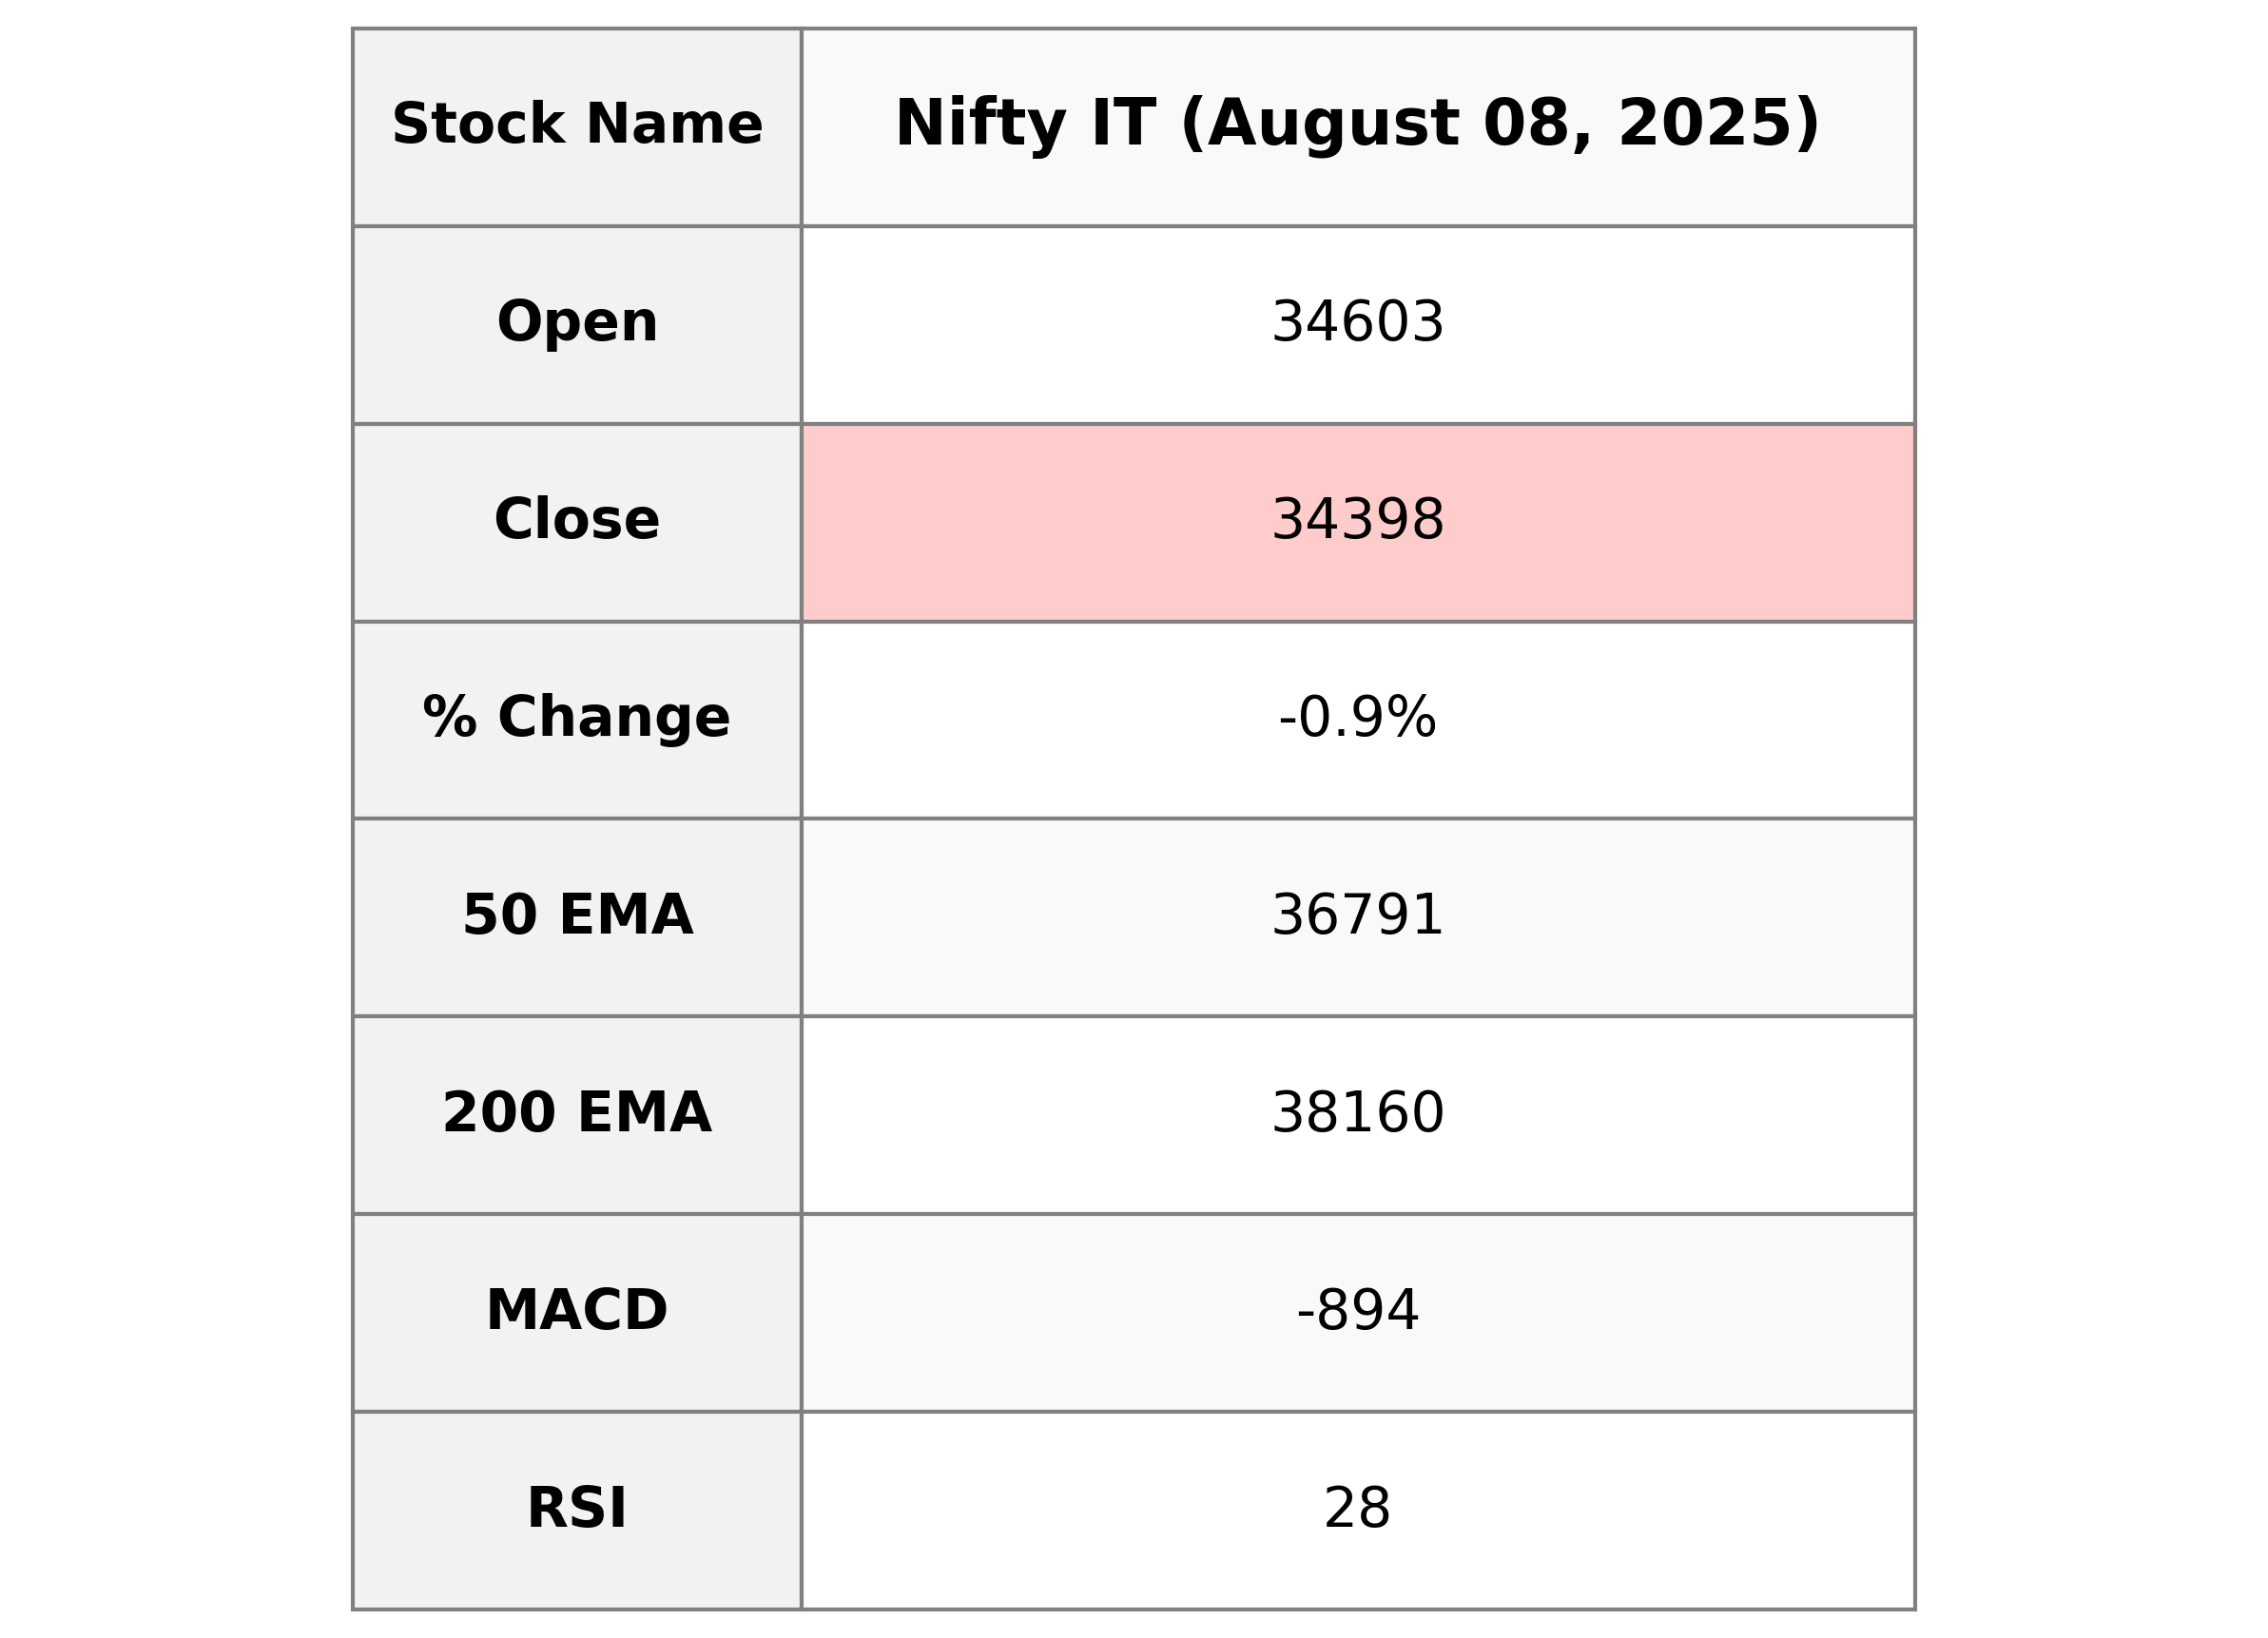
Nifty IT opened at 34603.0 and closed at 34398.5, showing a decline with a percentage change of -0.94% and a points drop of -328.3. The Relative Strength Index (RSI) is at 28.49, indicating it is in the oversold territory, while the Moving Average Convergence Divergence (MACD) indicates a bearish trend with a value of -893.81.
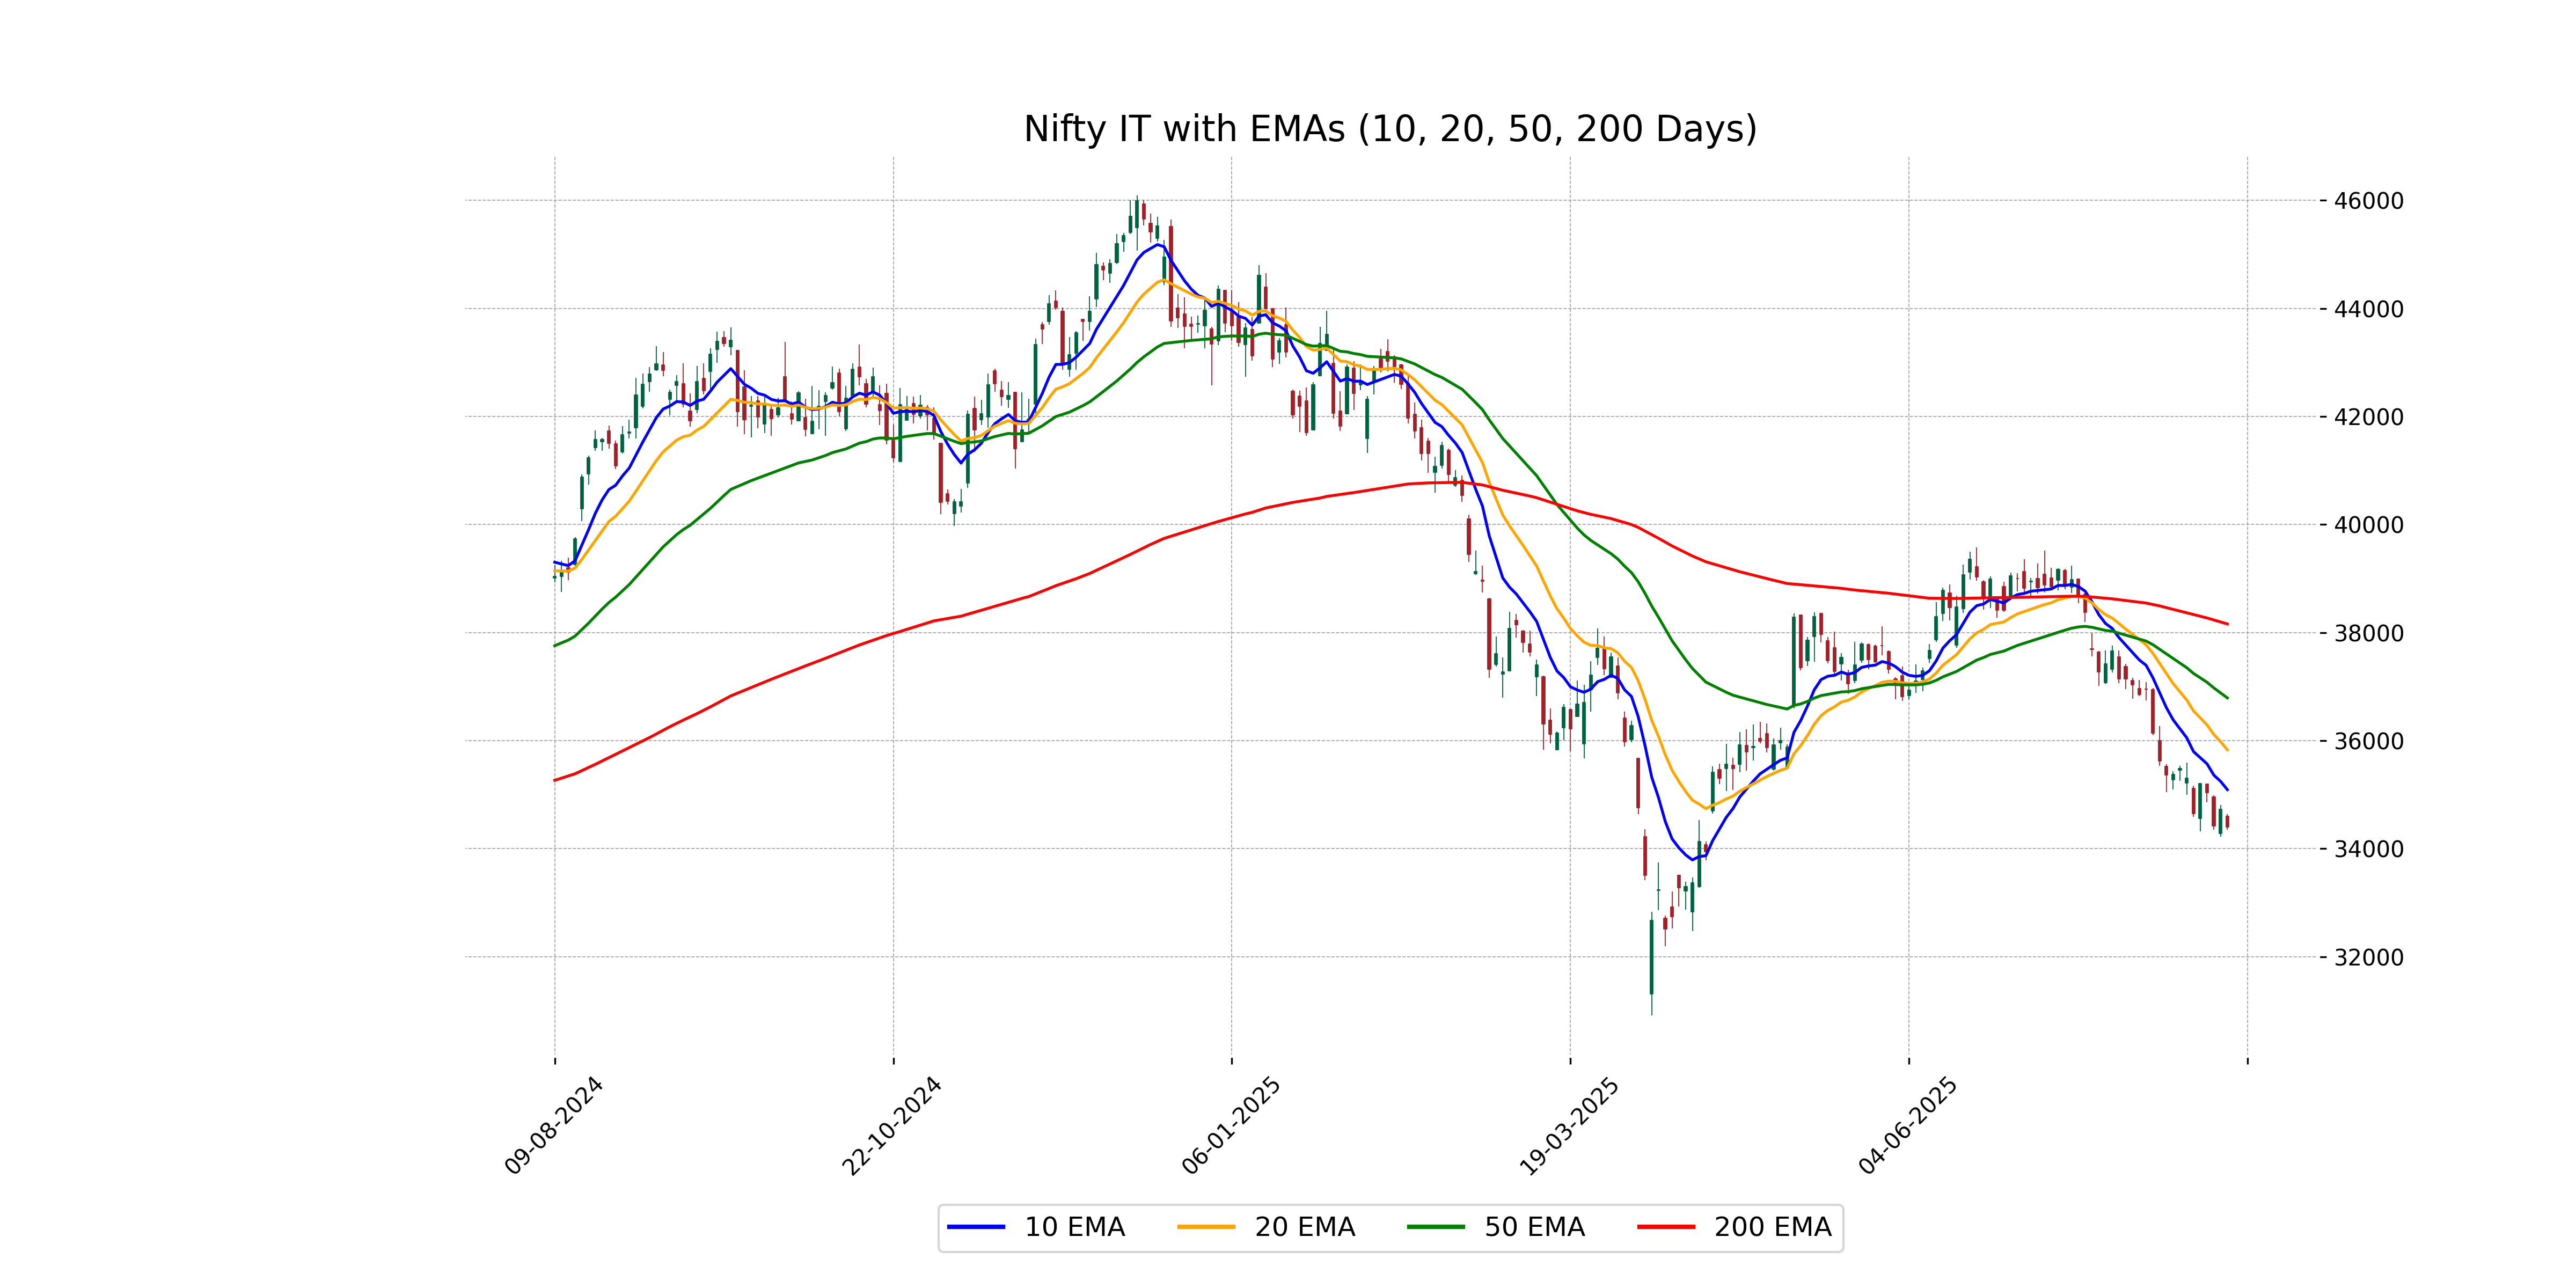
Relationship with Key Moving Averages
The Nifty IT index's current close of 34,398.5 is below all its key moving averages, including the 50 EMA at 36,790.95, the 200 EMA at 38,159.86, the 10 EMA at 35,092.88, and the 20 EMA at 35,830.98. This indicates a bearish trend, supported by an RSI of 28.49, suggesting the index is in the oversold territory.
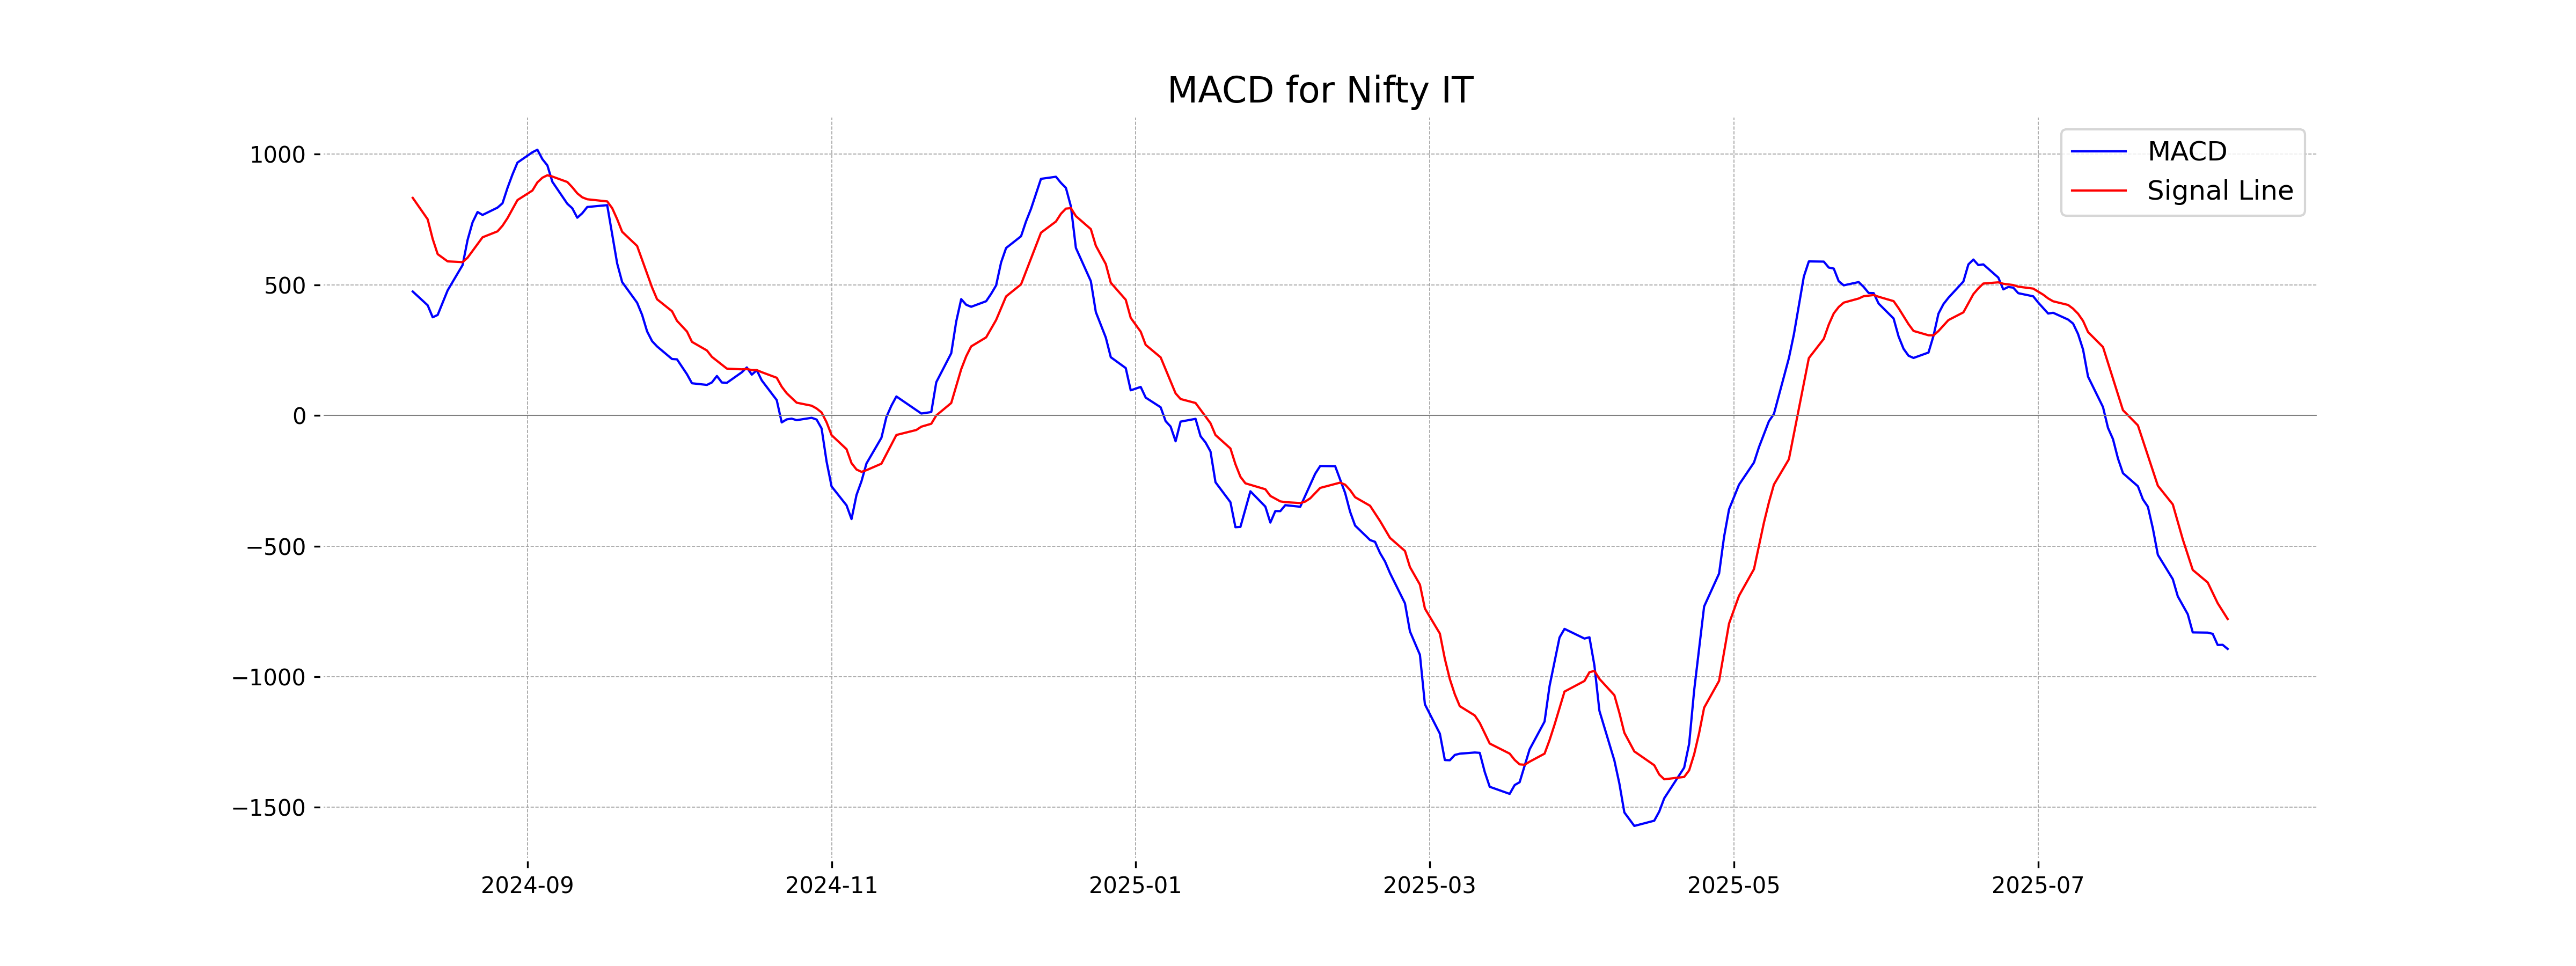
Moving Averages Trend (MACD)
MACD Analysis for Nifty IT The MACD value of -893.81 compared with the MACD Signal Line at -779.20 suggests a bearish sentiment, with the increasing distance indicating a strong downward momentum. This aligns with the low RSI of 28.49, reflecting possible oversold conditions.
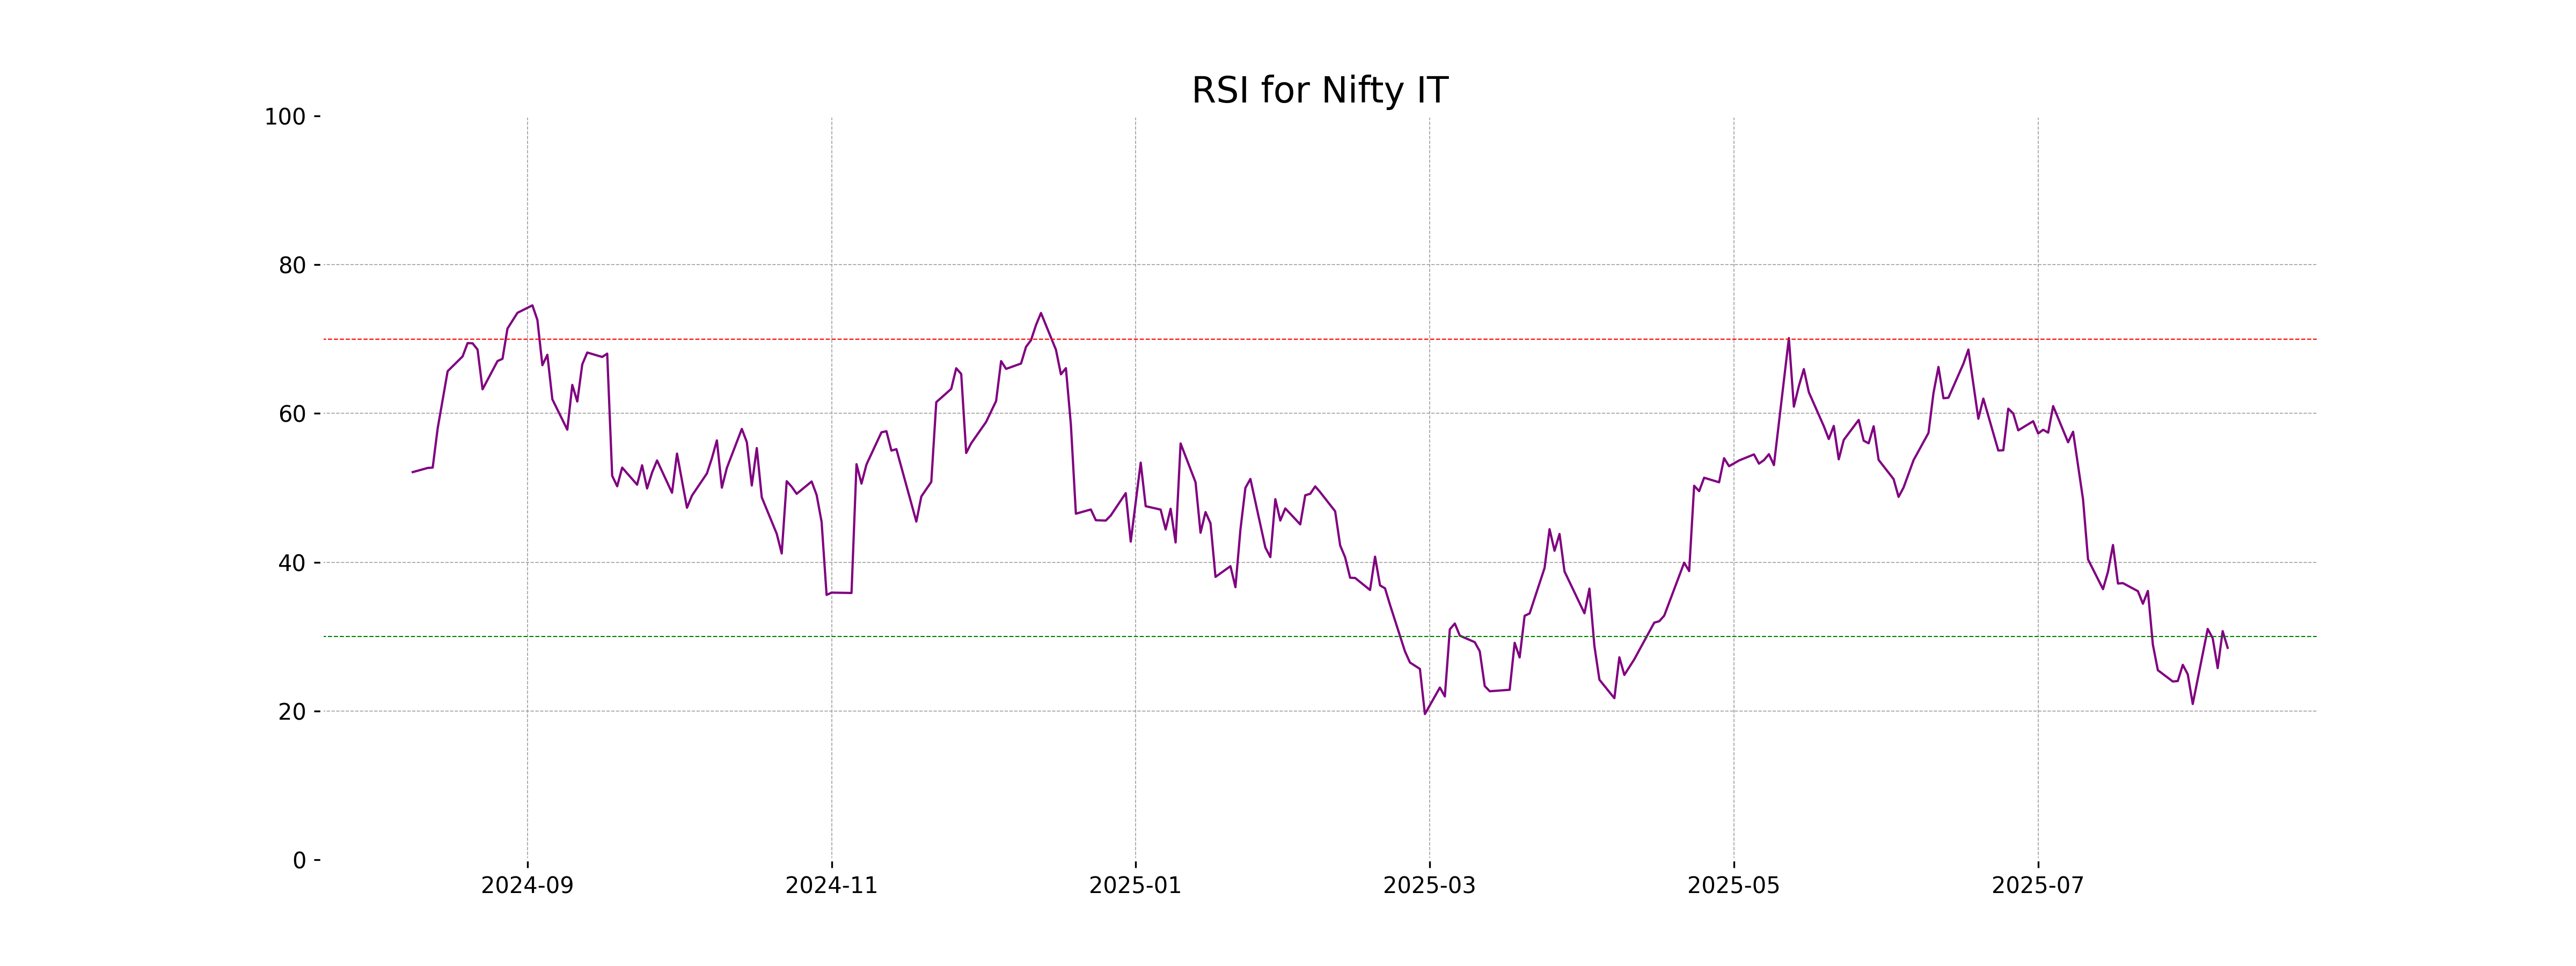
RSI Analysis
The RSI for Nifty IT is 28.49, indicating that the stock is in an oversold condition. This suggests potential for a reversal to the upside or a pause in the current downward trend. However, other indicators and market conditions should also be considered.
Analysis for Nifty Metal - August 08, 2025
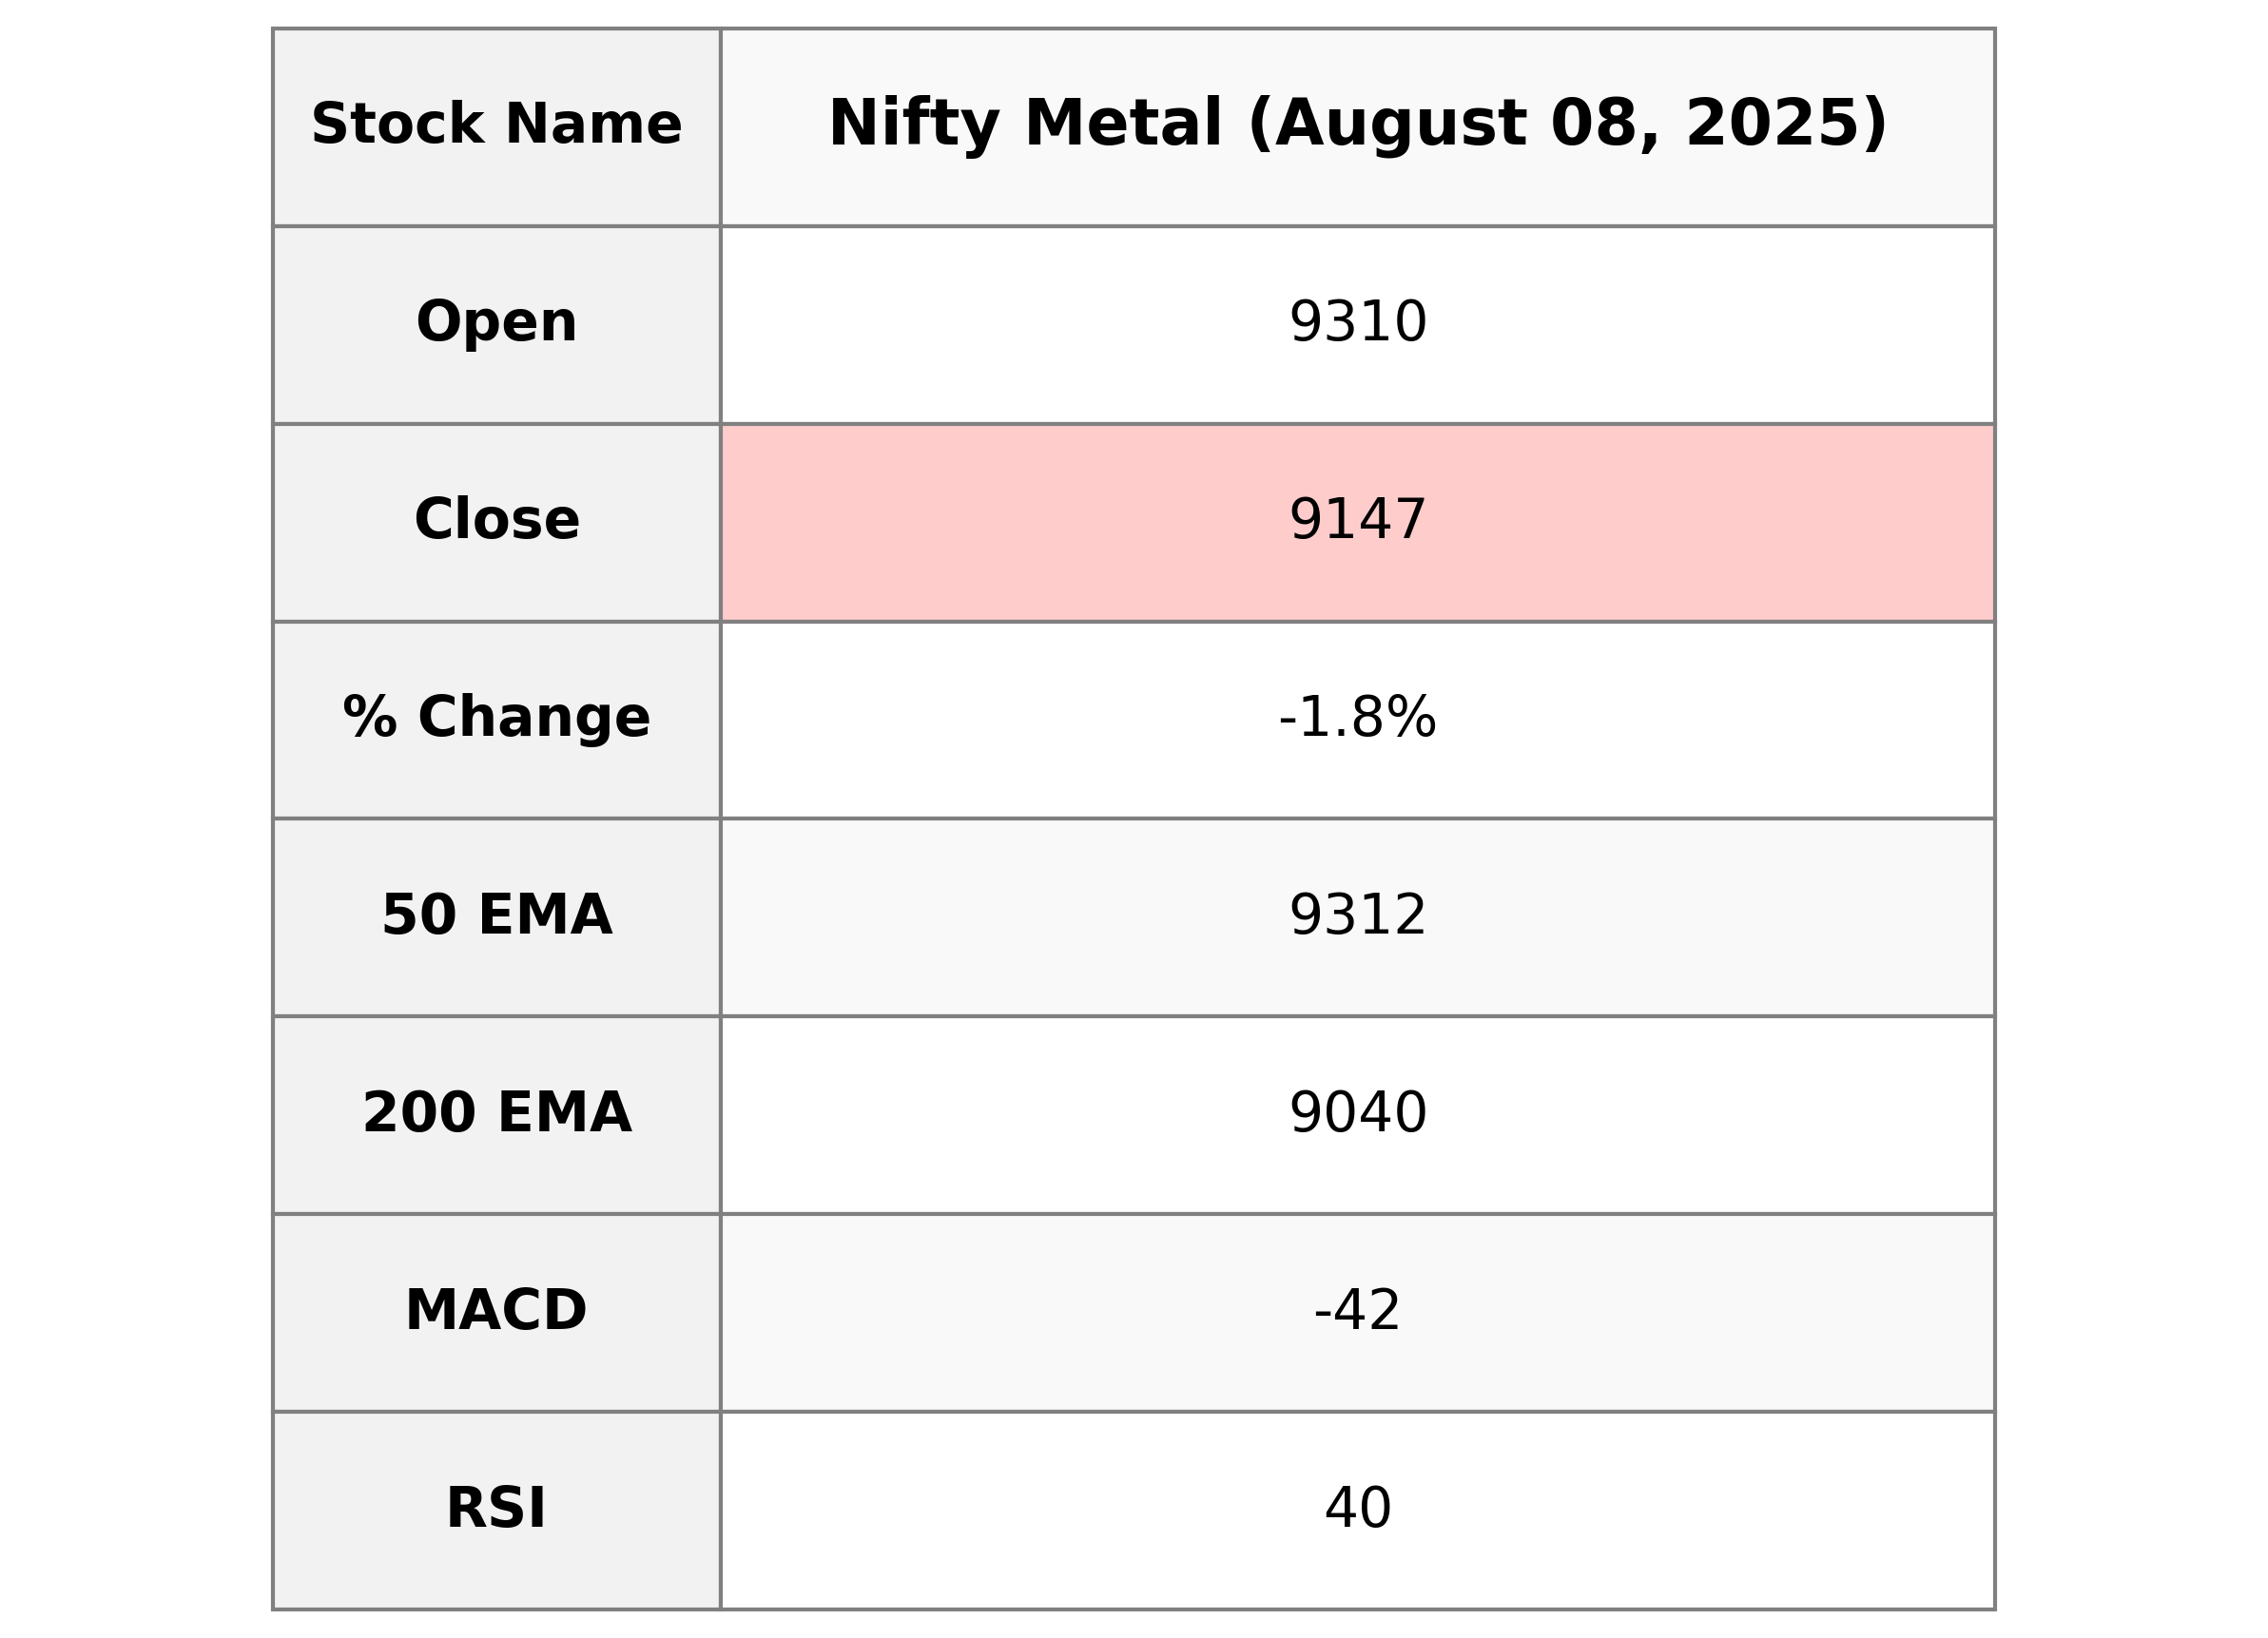
The Nifty Metal index opened at 9309.65 and closed at 9147.10, showing a decline with a percentage change of -1.76% from the previous close of 9310.65. The index traded between a high of 9327.30 and a low of 9127.25, with the Relative Strength Index (RSI) indicating a value of 39.94. Additionally, the Moving Average Convergence Divergence (MACD) shows a negative value of -42.14, suggesting bearish momentum.
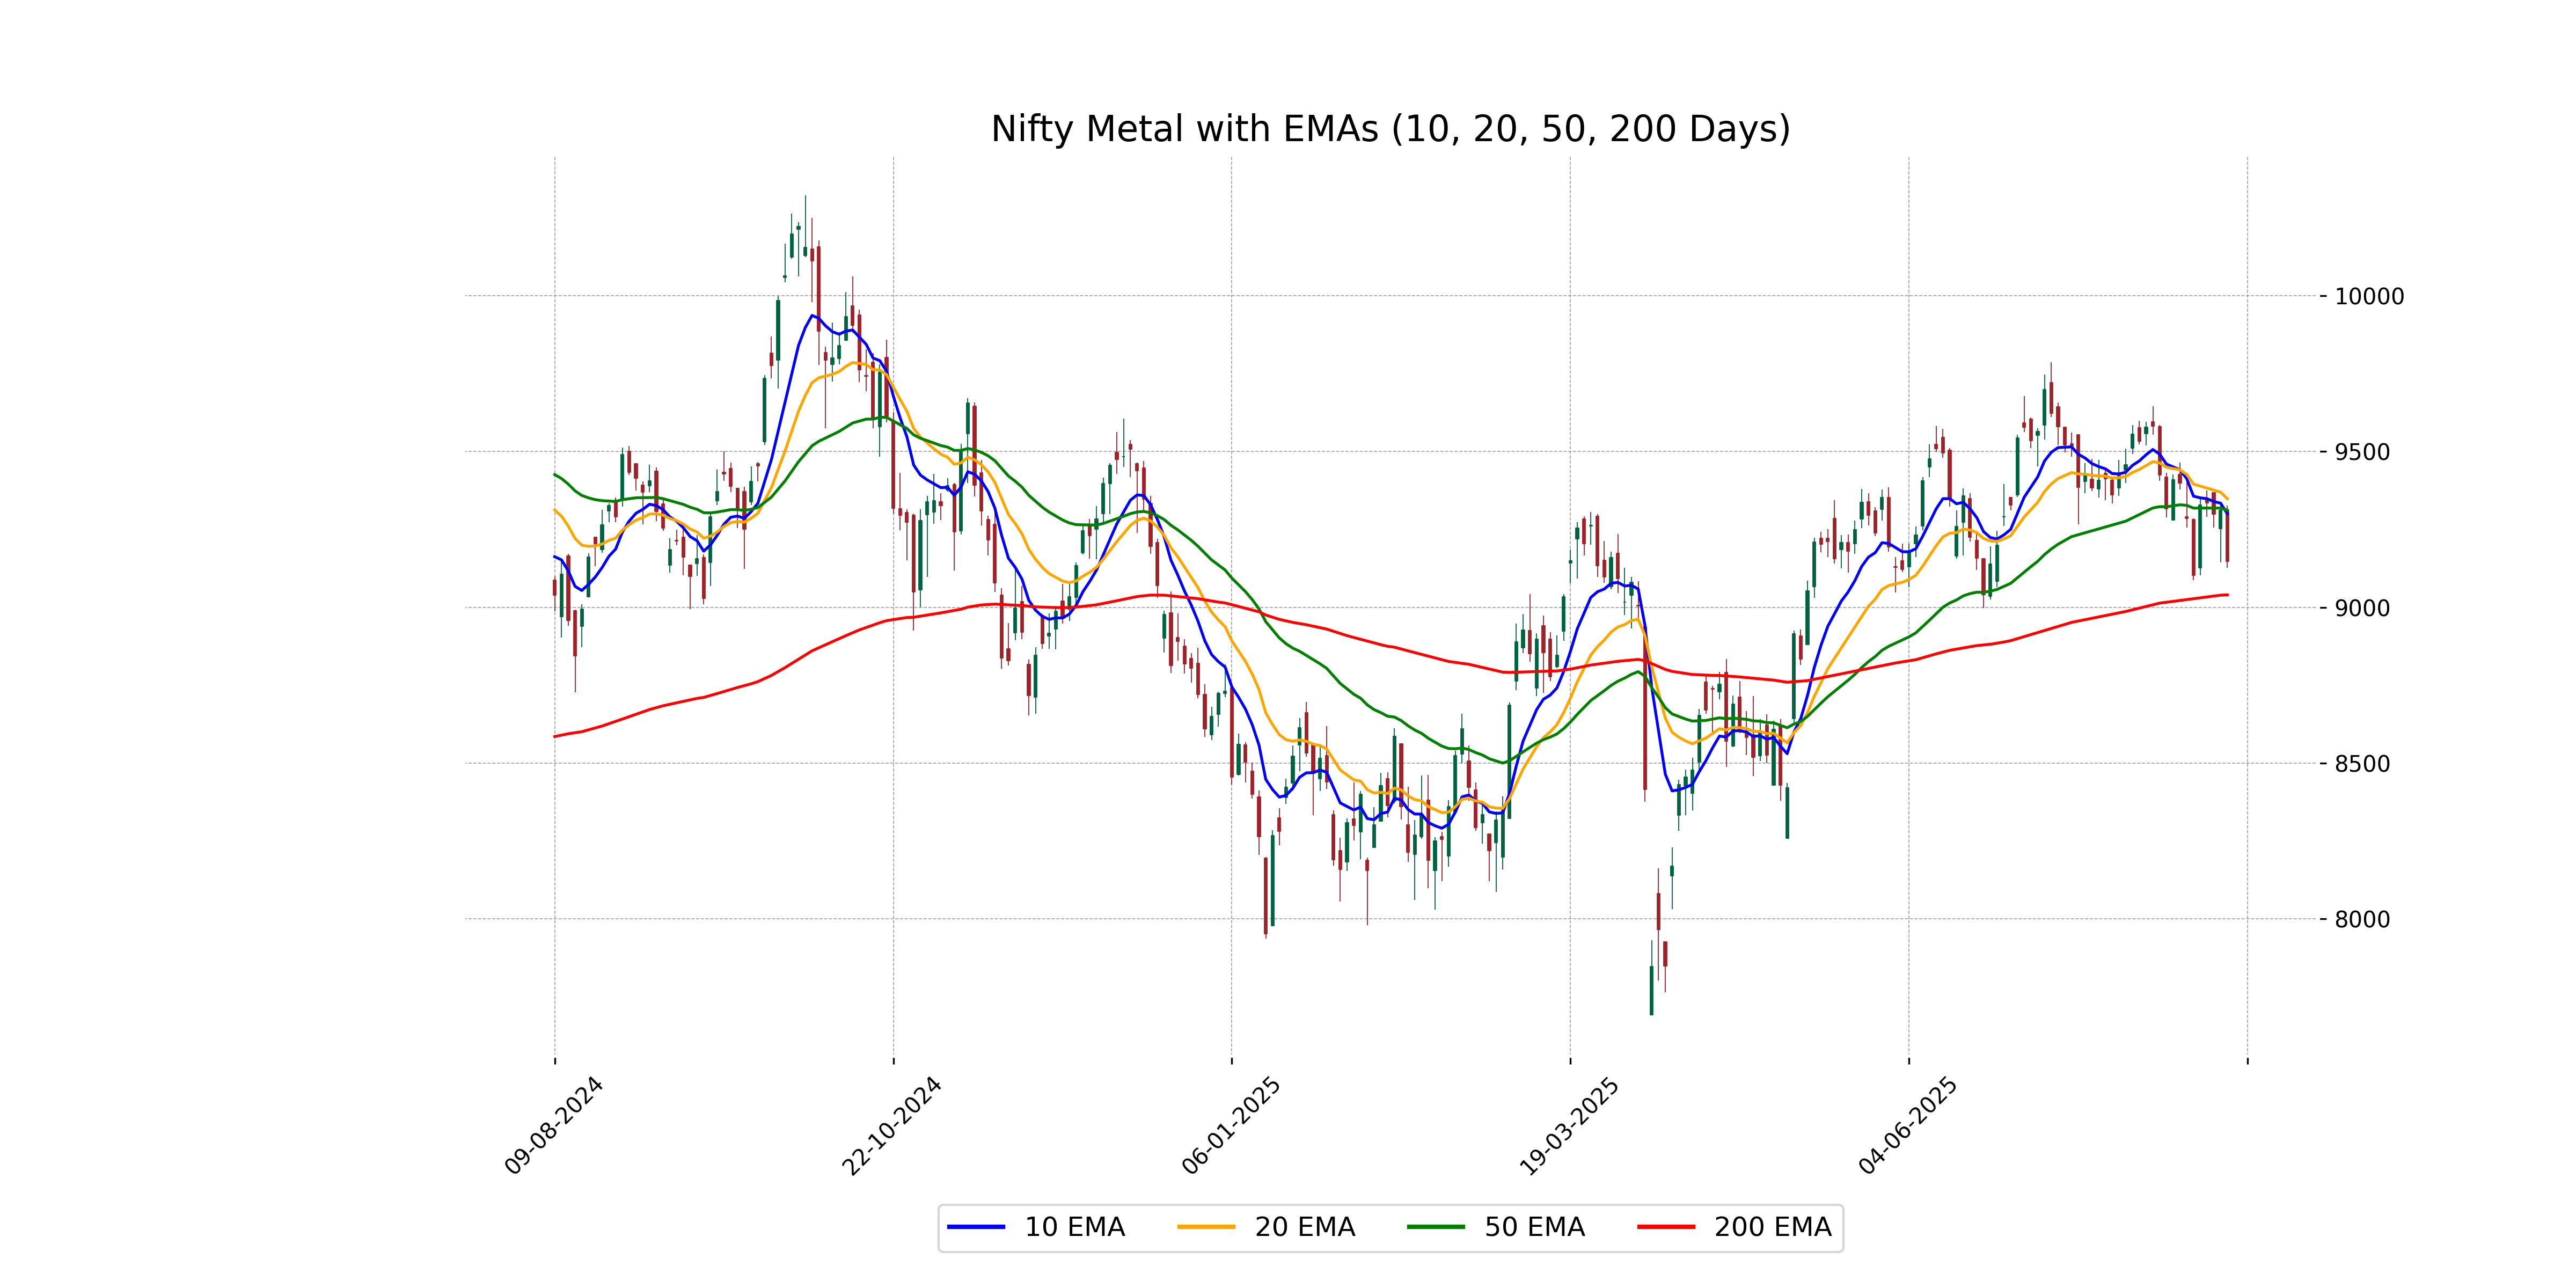
Relationship with Key Moving Averages
Nifty Metal closed below its 10-day, 20-day, and 50-day EMA, indicating a short-term bearish trend. Its closing price of 9147.10 is significantly lower than the key EMAs (10-day EMA: 9300.25, 20-day EMA: 9348.54, 50-day EMA: 9311.70), suggesting downward pressure. The 200-day EMA is at 9039.88, providing a longer-term support level.
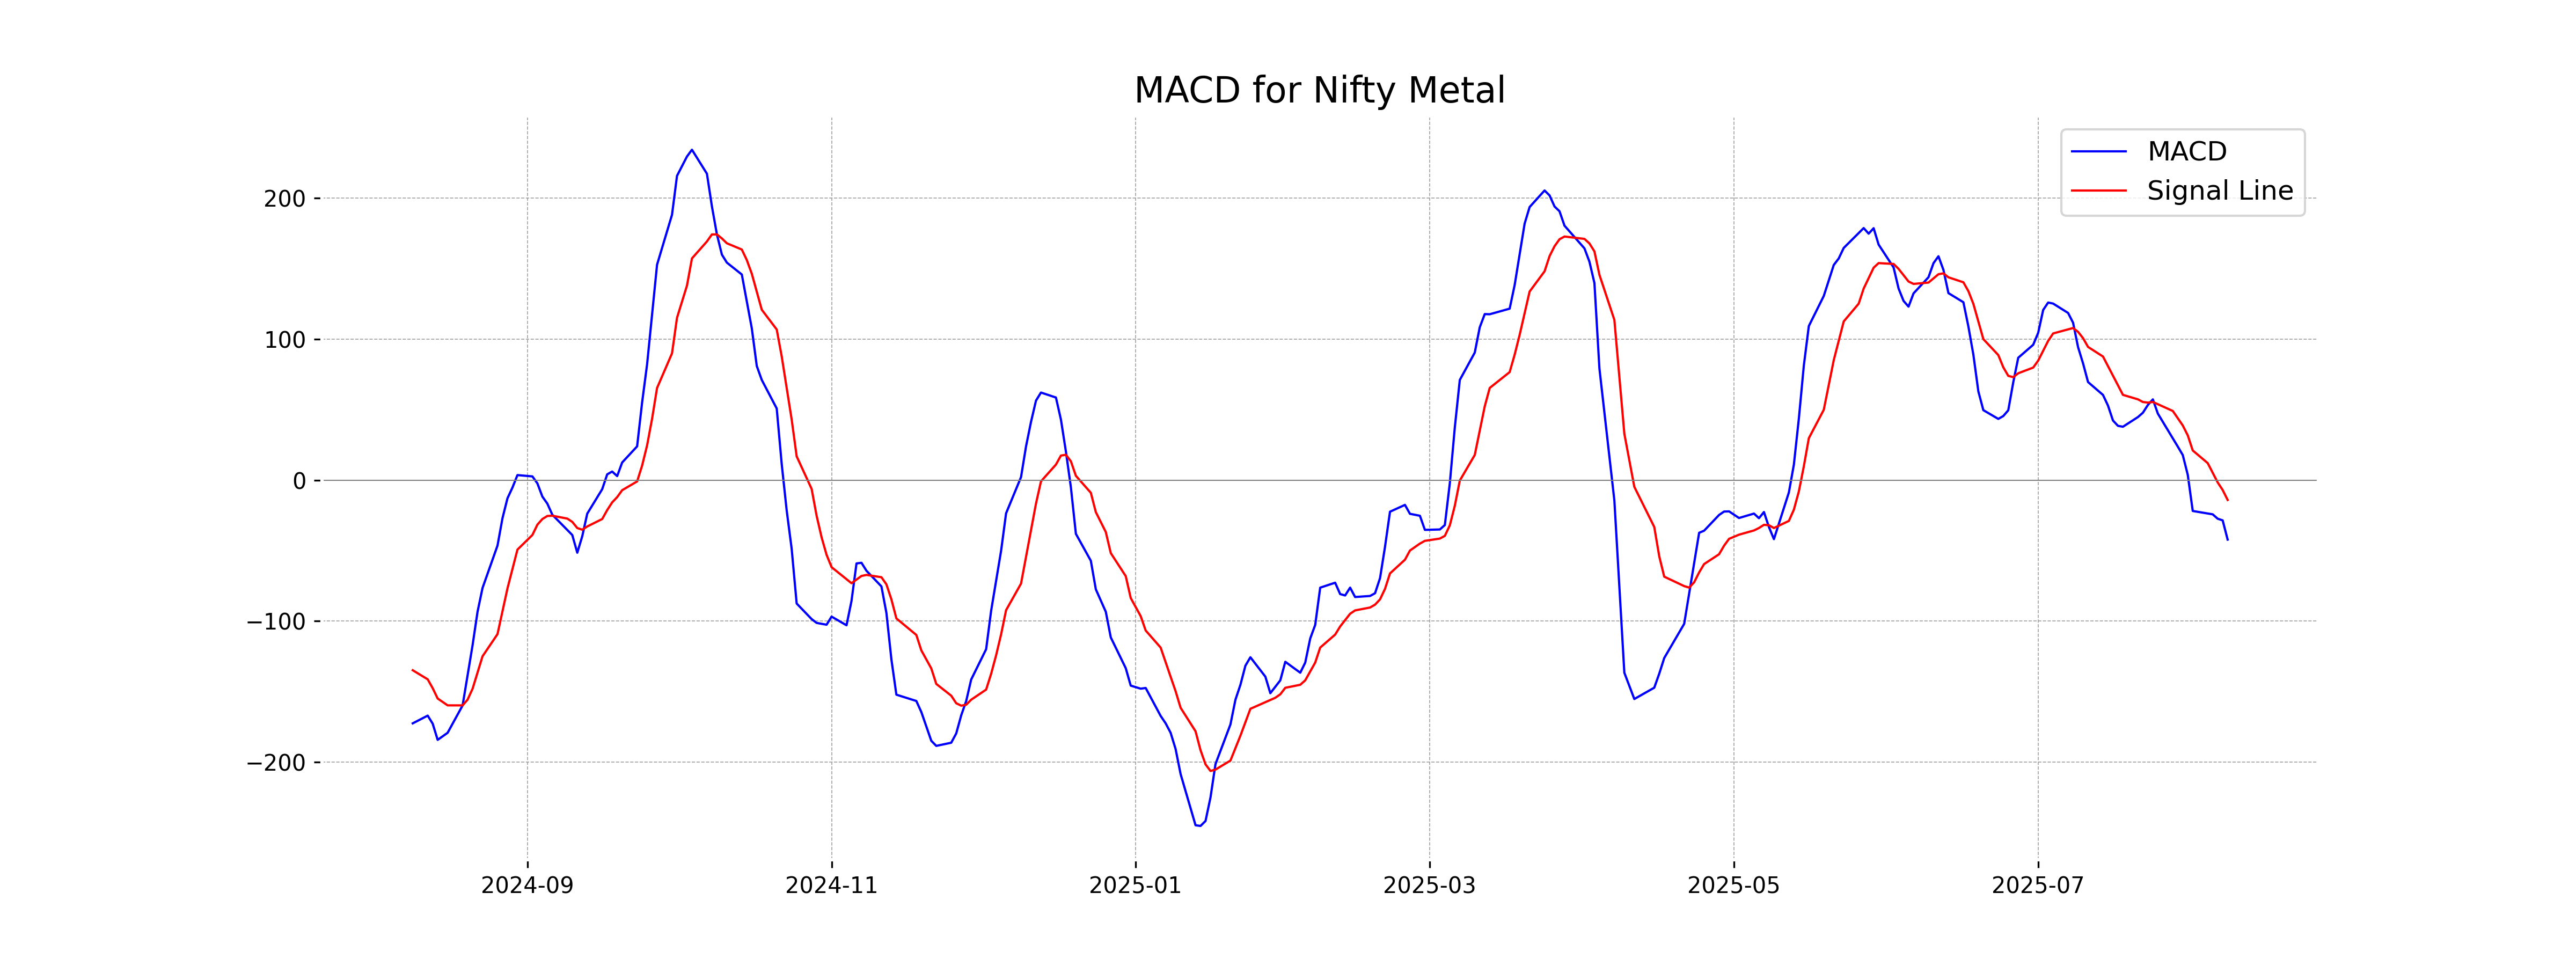
Moving Averages Trend (MACD)
The MACD for Nifty Metal is at -42.14, which is below the MACD signal line at -14.00, indicating a bearish trend. The negative MACD value suggests that the stock is experiencing downward momentum.
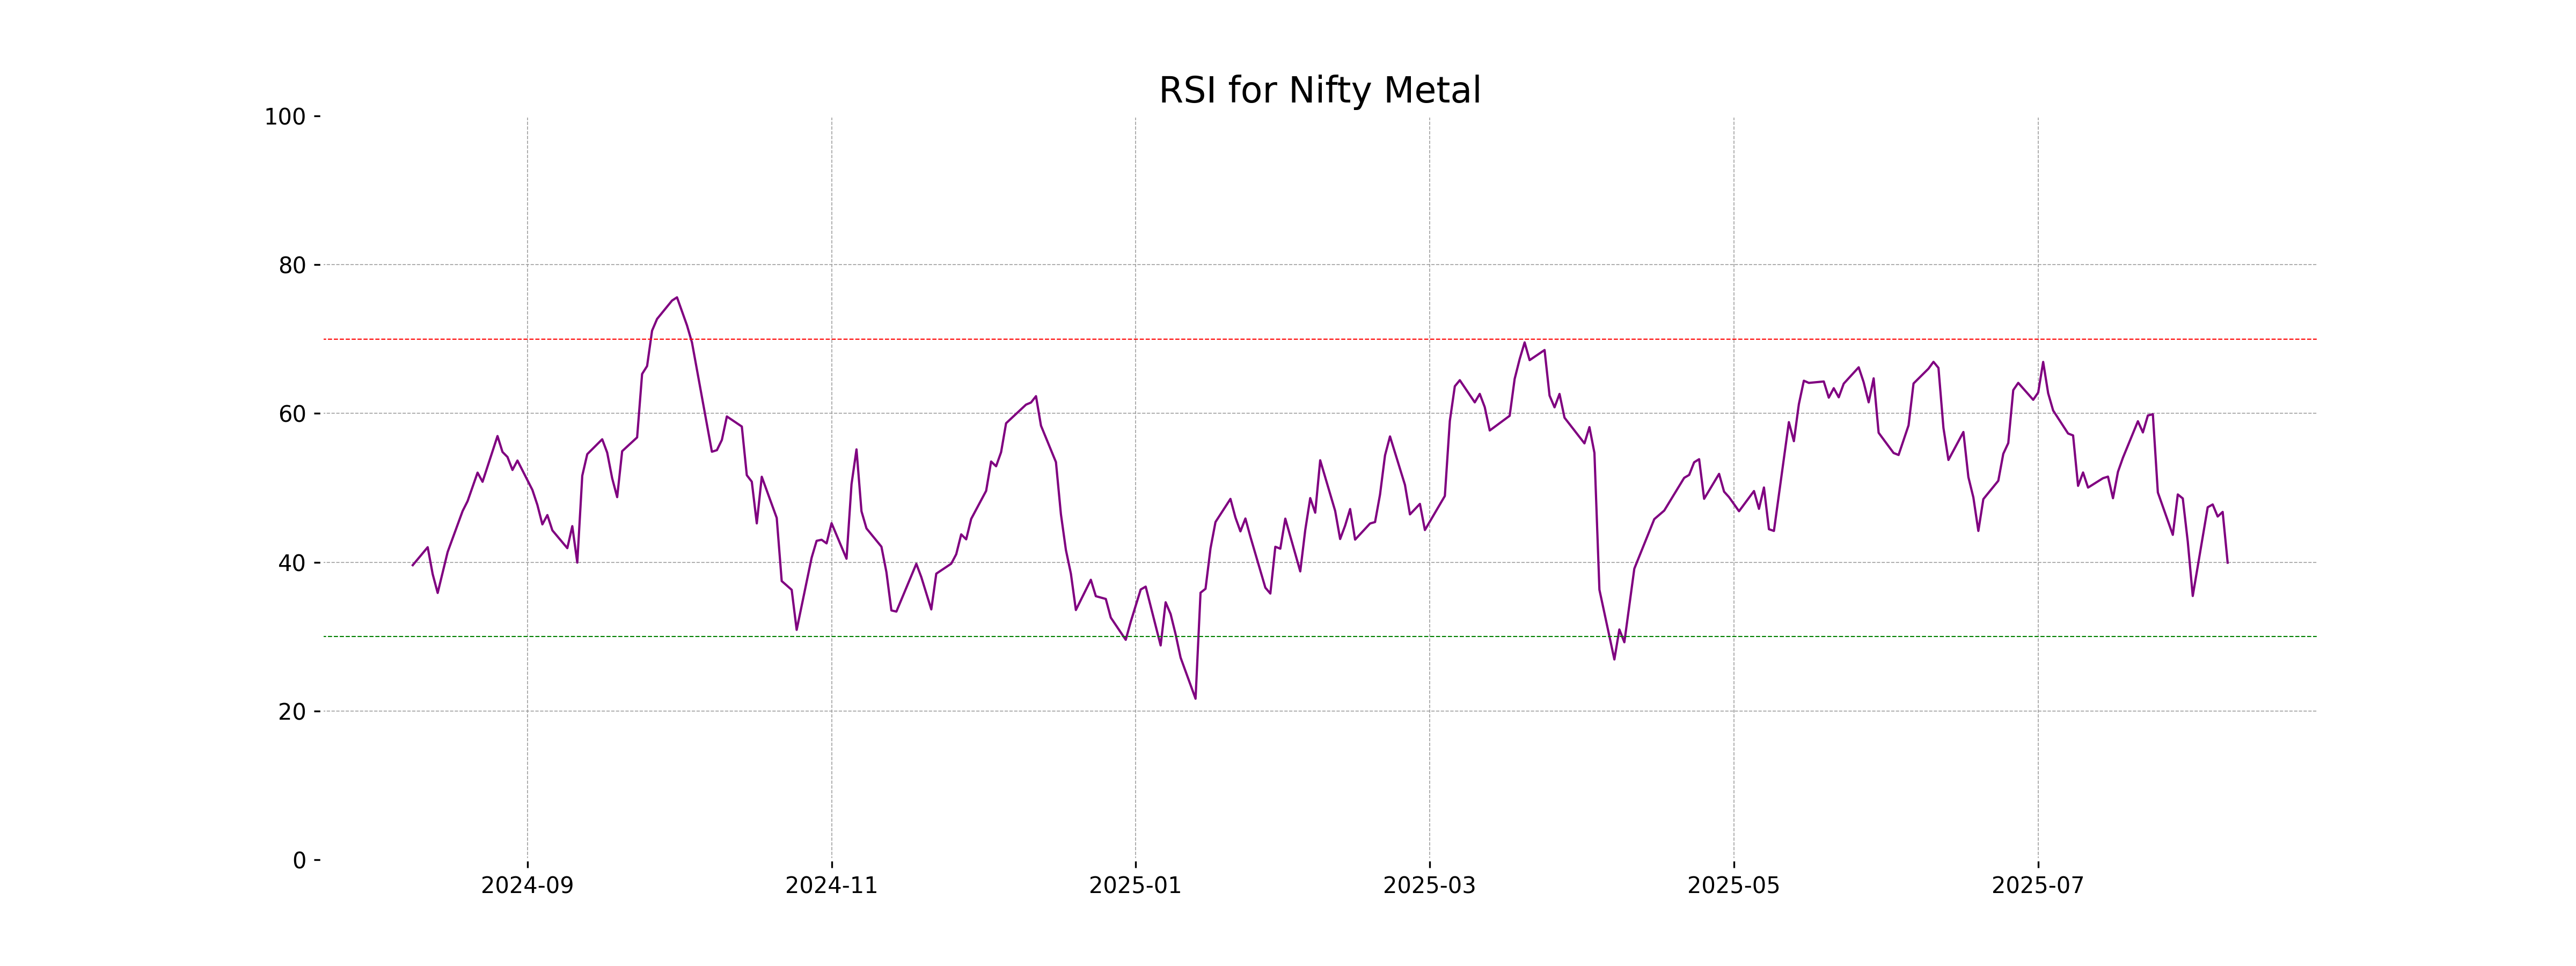
RSI Analysis
Nifty Metal RSI Analysis: The Relative Strength Index (RSI) for Nifty Metal stands at 39.94, indicating that the stock is approaching oversold territory. This level suggests that the stock may be undervalued and could experience a potential reversal or upward movement if the downward trend continues.
Analysis for Nifty Bank - August 08, 2025
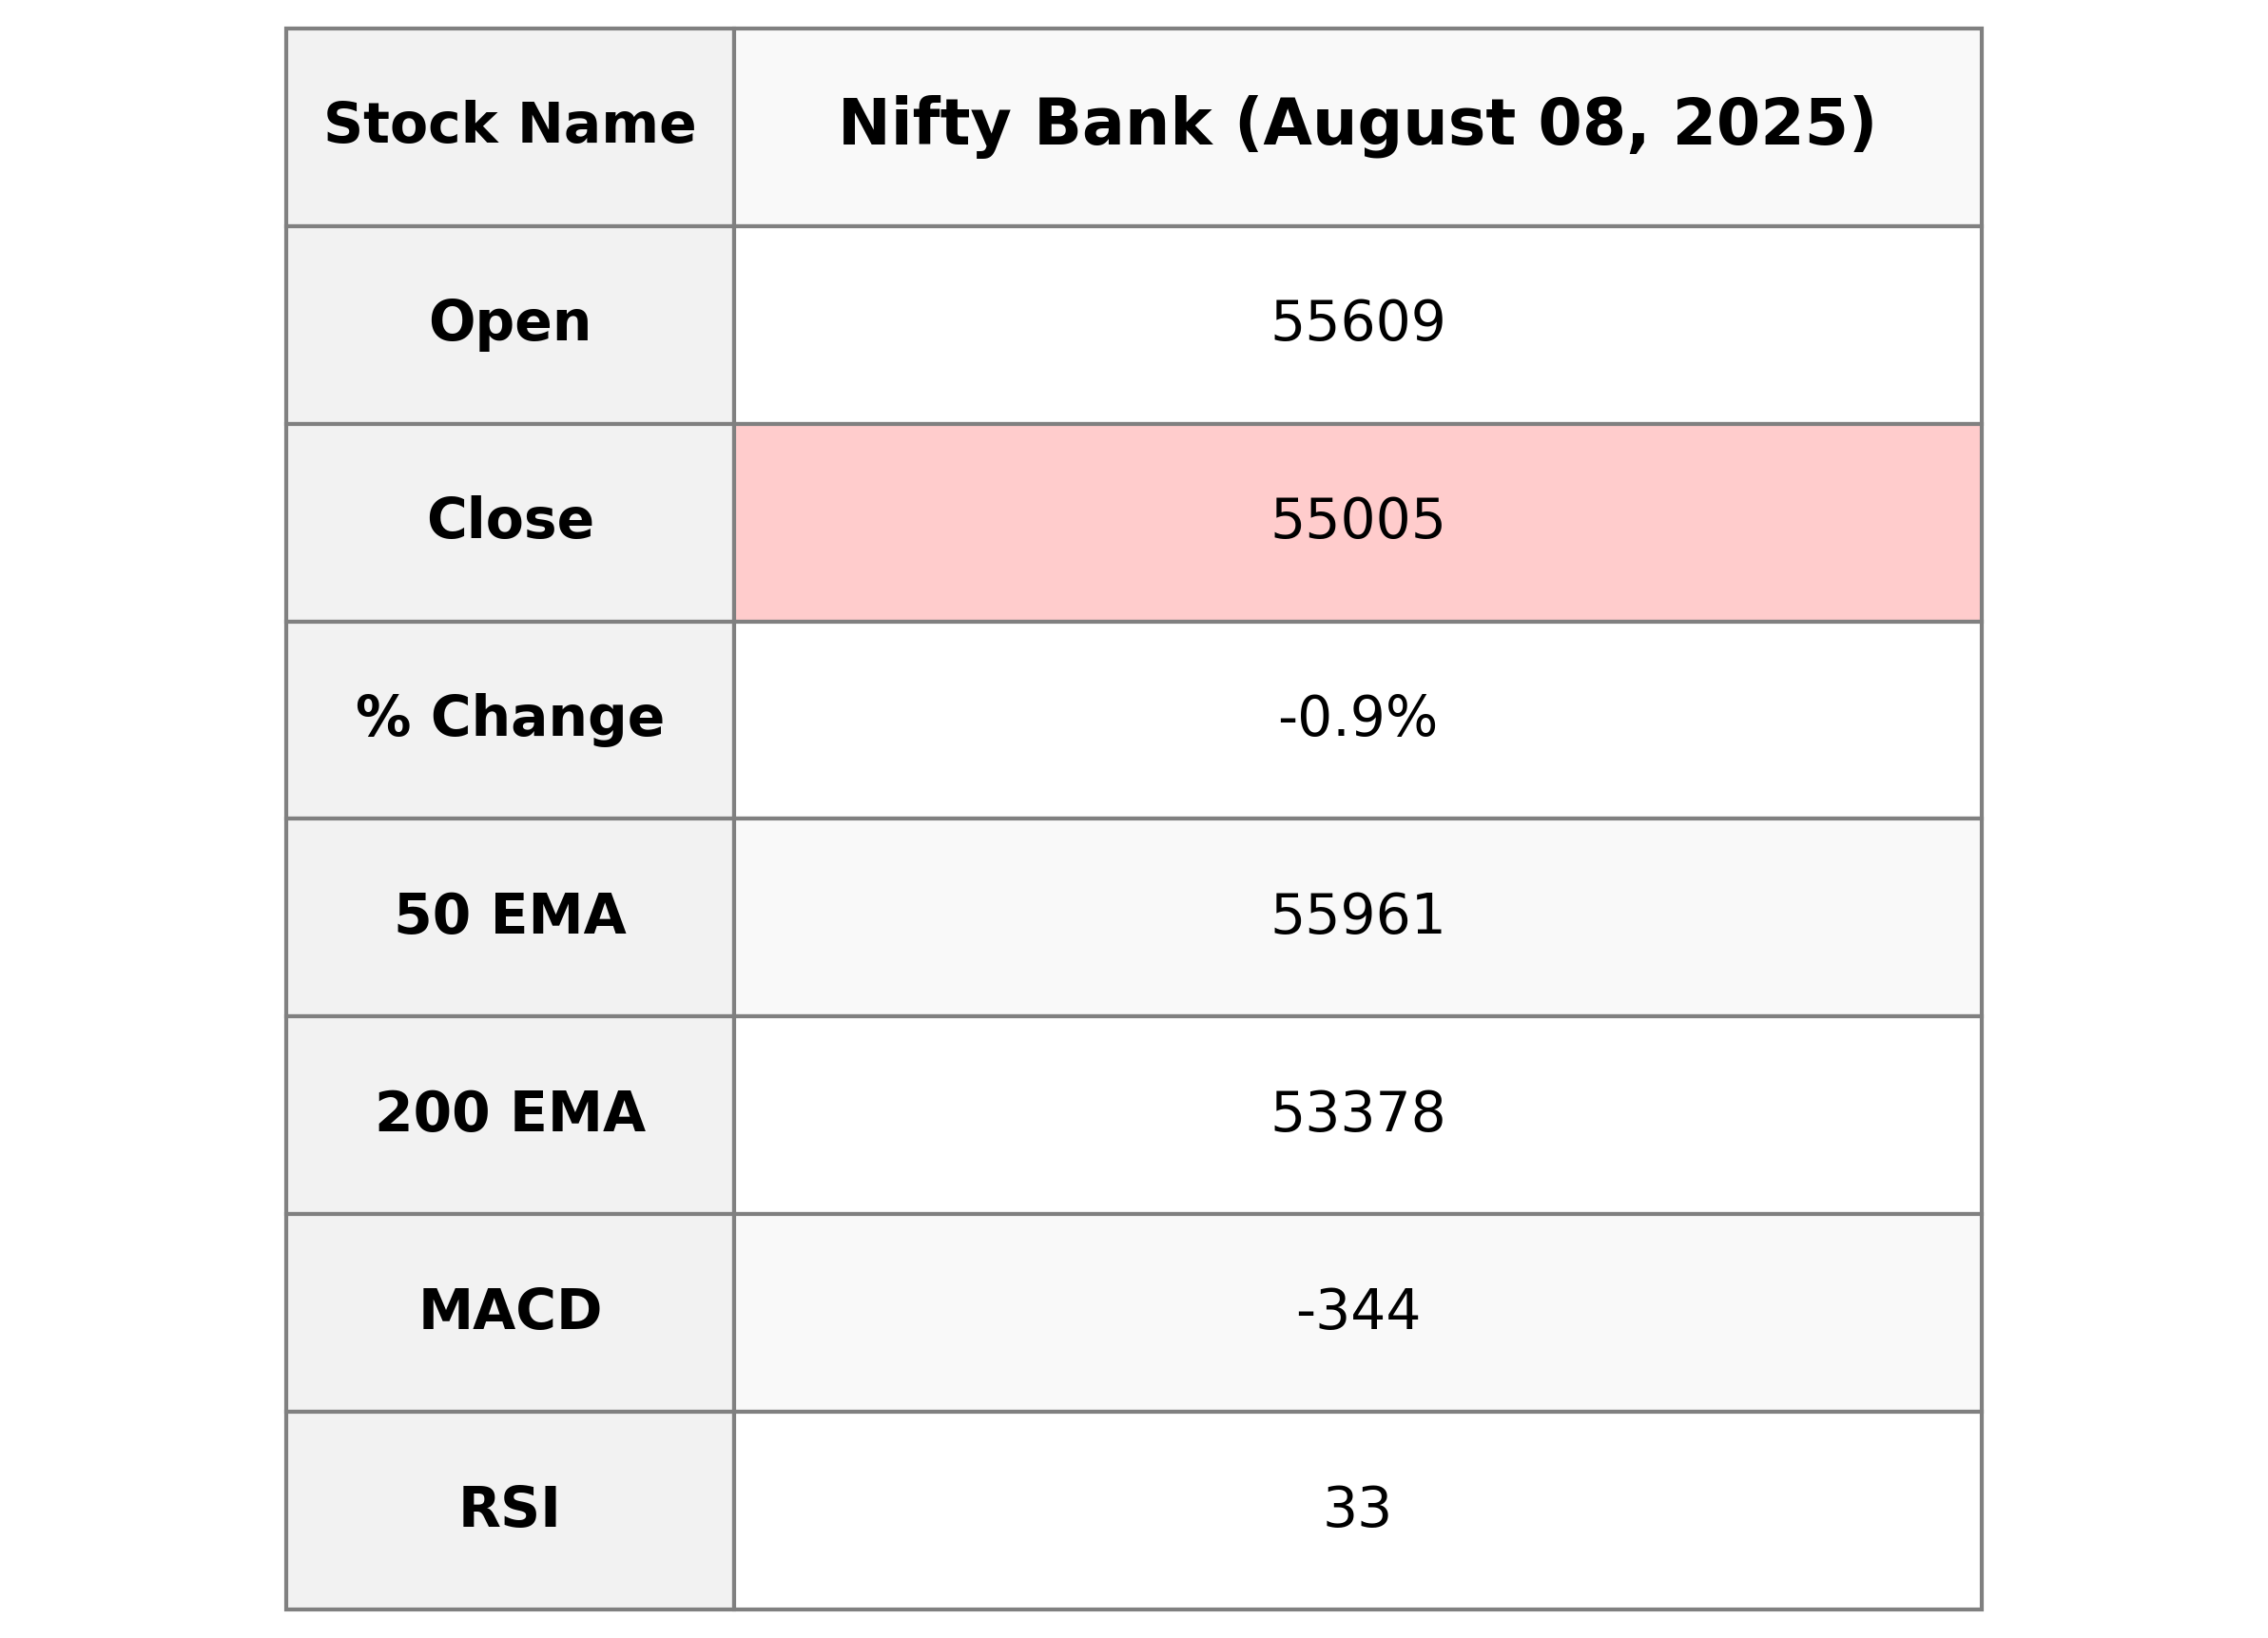
Nifty Bank opened at 55,609.35 and closed at 55,004.90, marking a decrease of 0.93% with a drop of 516.25 points. The Relative Strength Index (RSI) is at 33.25, indicating a potentially oversold condition. The MACD shows bearish momentum with a value of -344.04 compared to the MACD signal line at -176.17. The stock's current value is below both the 50-EMA of 55,961.23 and the 20-EMA of 56,041.04.
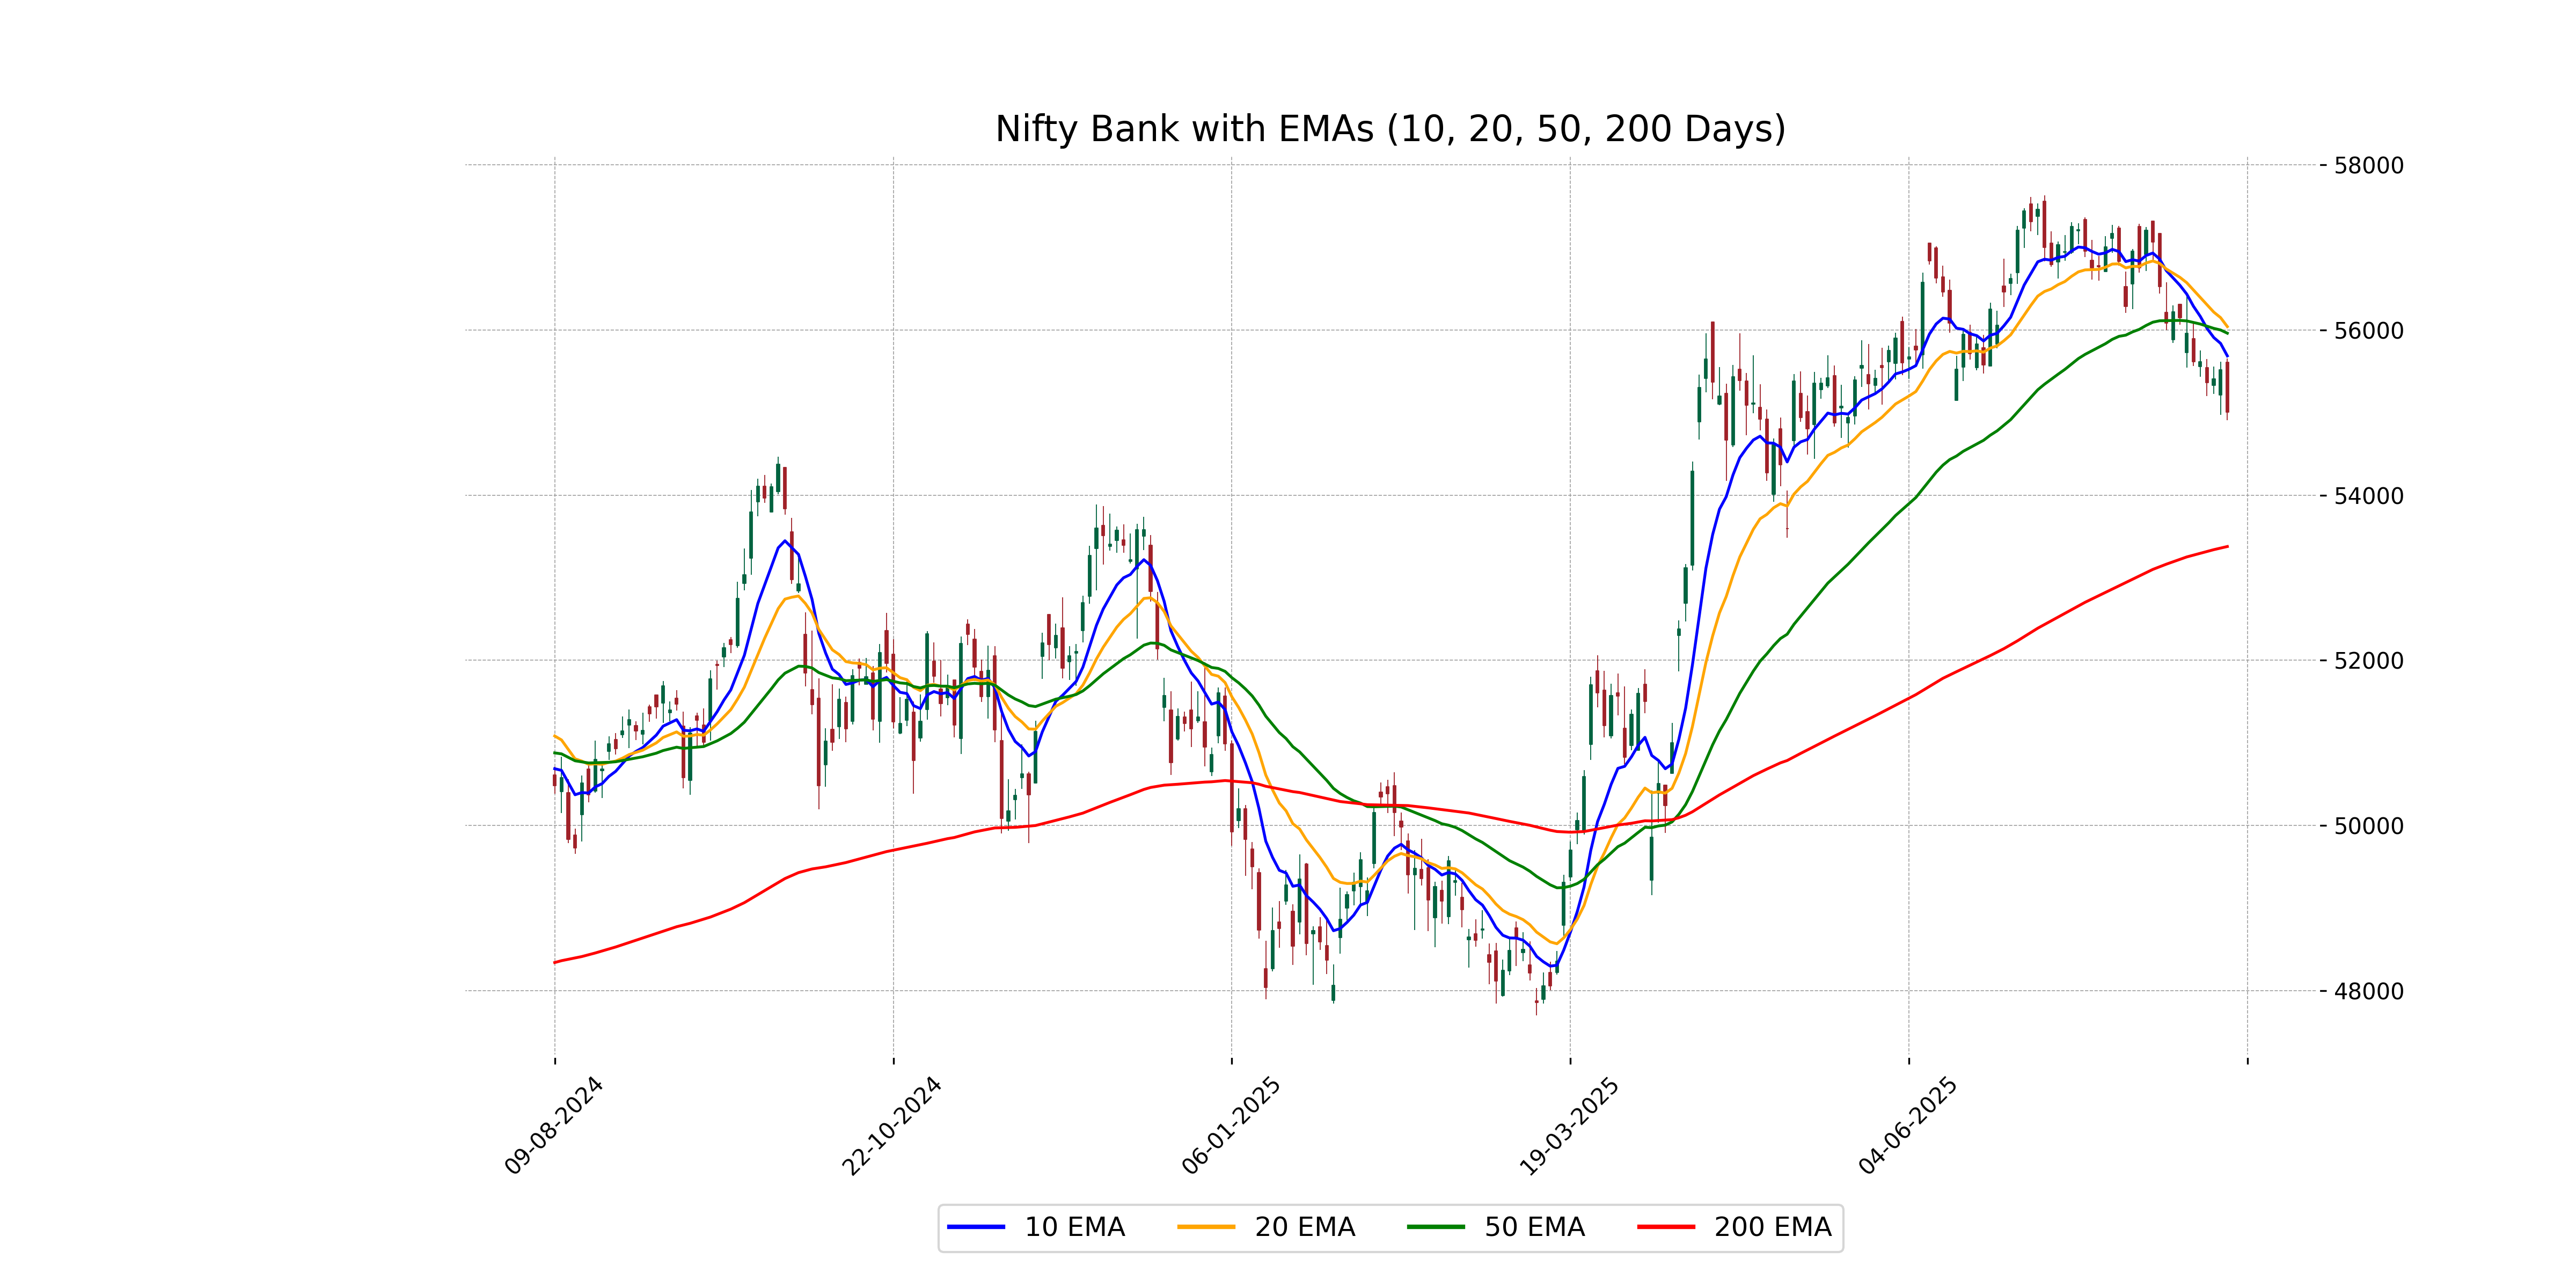
Relationship with Key Moving Averages
The Nifty Bank index's current close of 55004.90 is below its 50-day EMA at 55961.23 and also below the 10-day and 20-day EMAs, indicating a bearish trend in the short term. Additionally, the MACD is negative at -344.04, suggesting a continuation of the downward momentum. The RSI of 33.25 also signals that the index is approaching oversold territory.
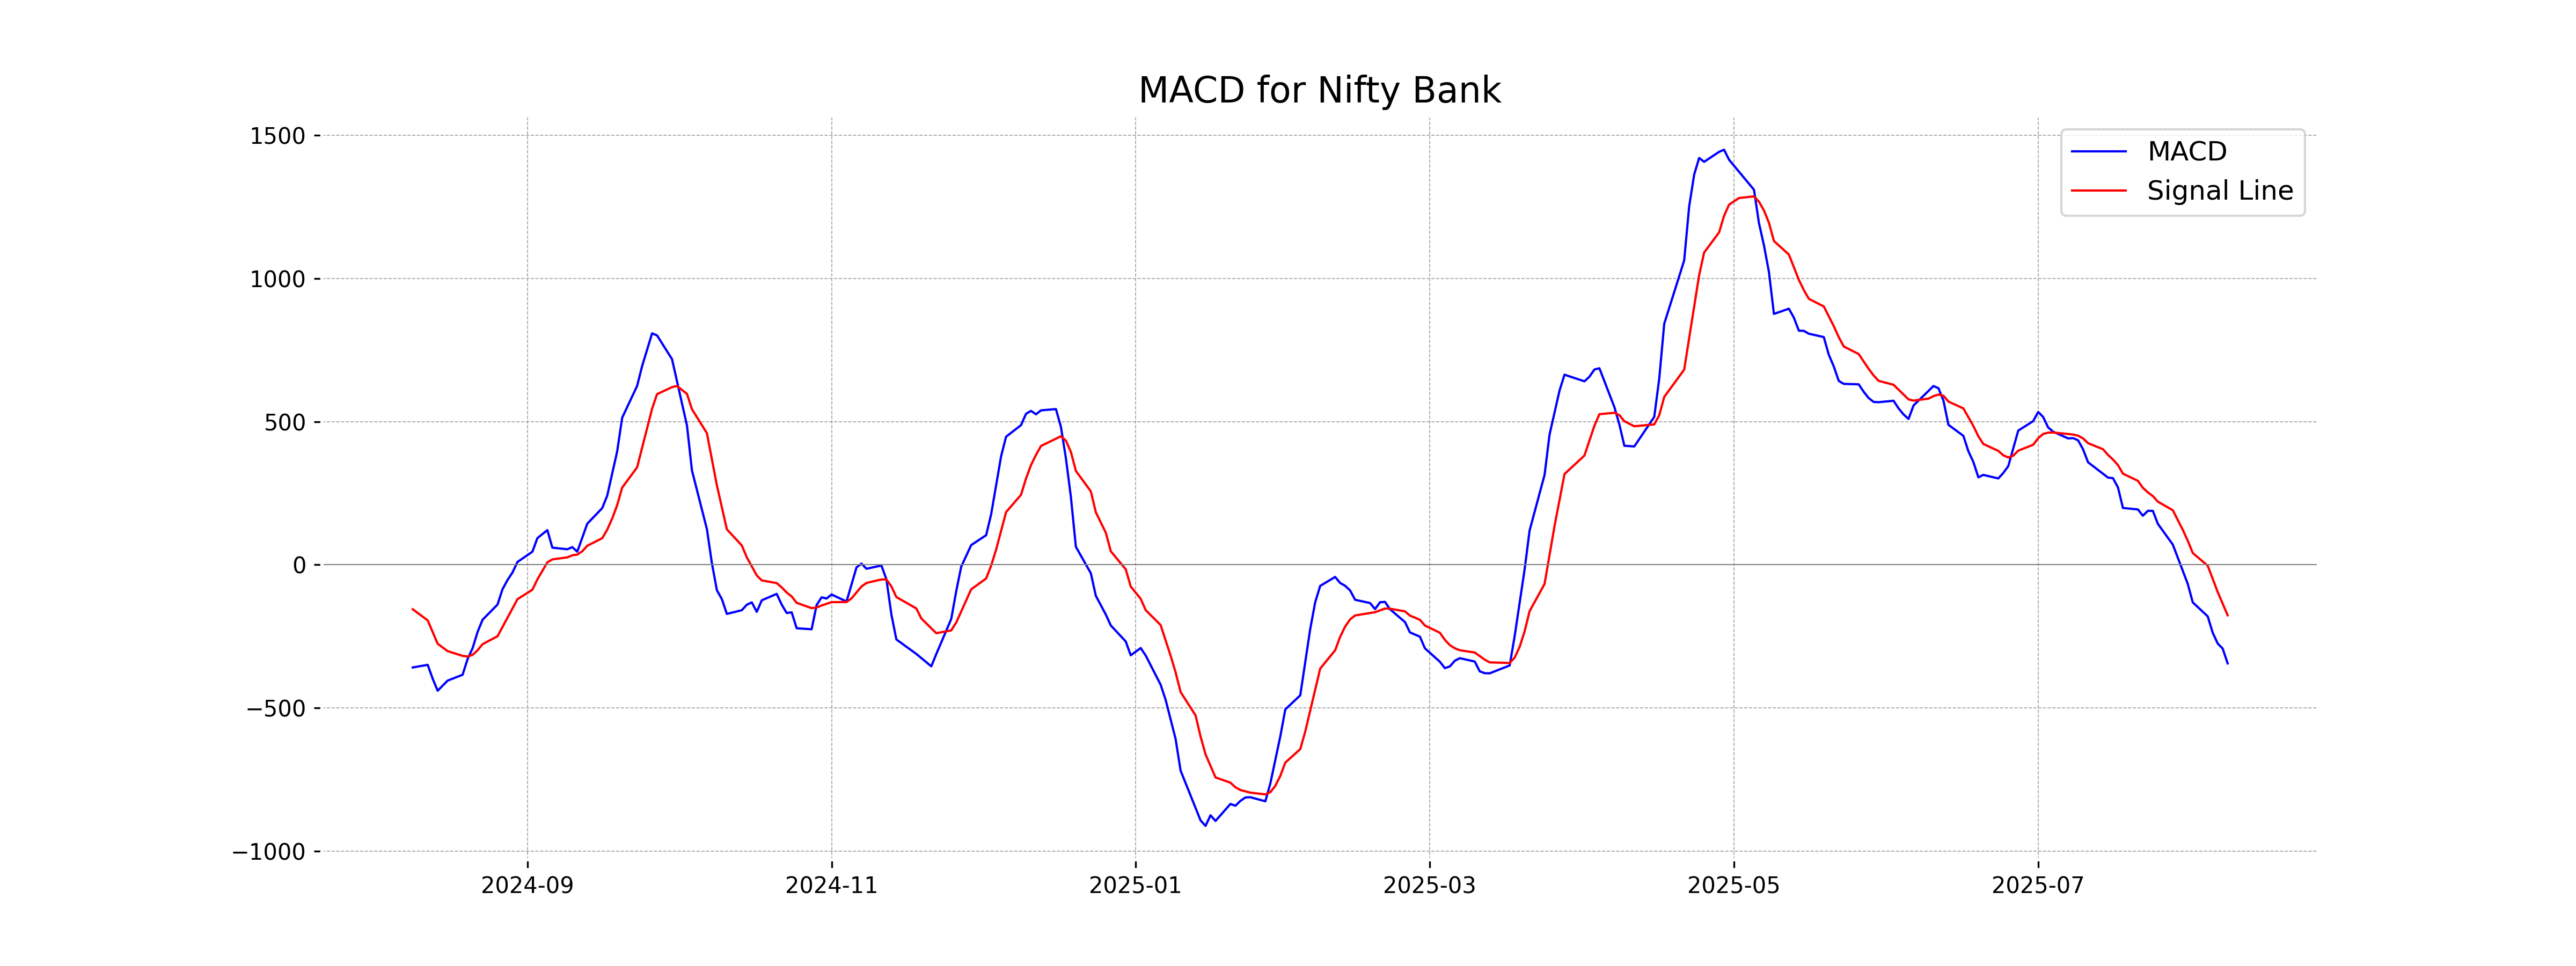
Moving Averages Trend (MACD)
MACD Analysis for Nifty Bank: The MACD value is -344.04, and the MACD Signal is -176.17, indicating a bearish trend as the MACD is below the signal line. This suggests that the momentum may be shifting downwards.
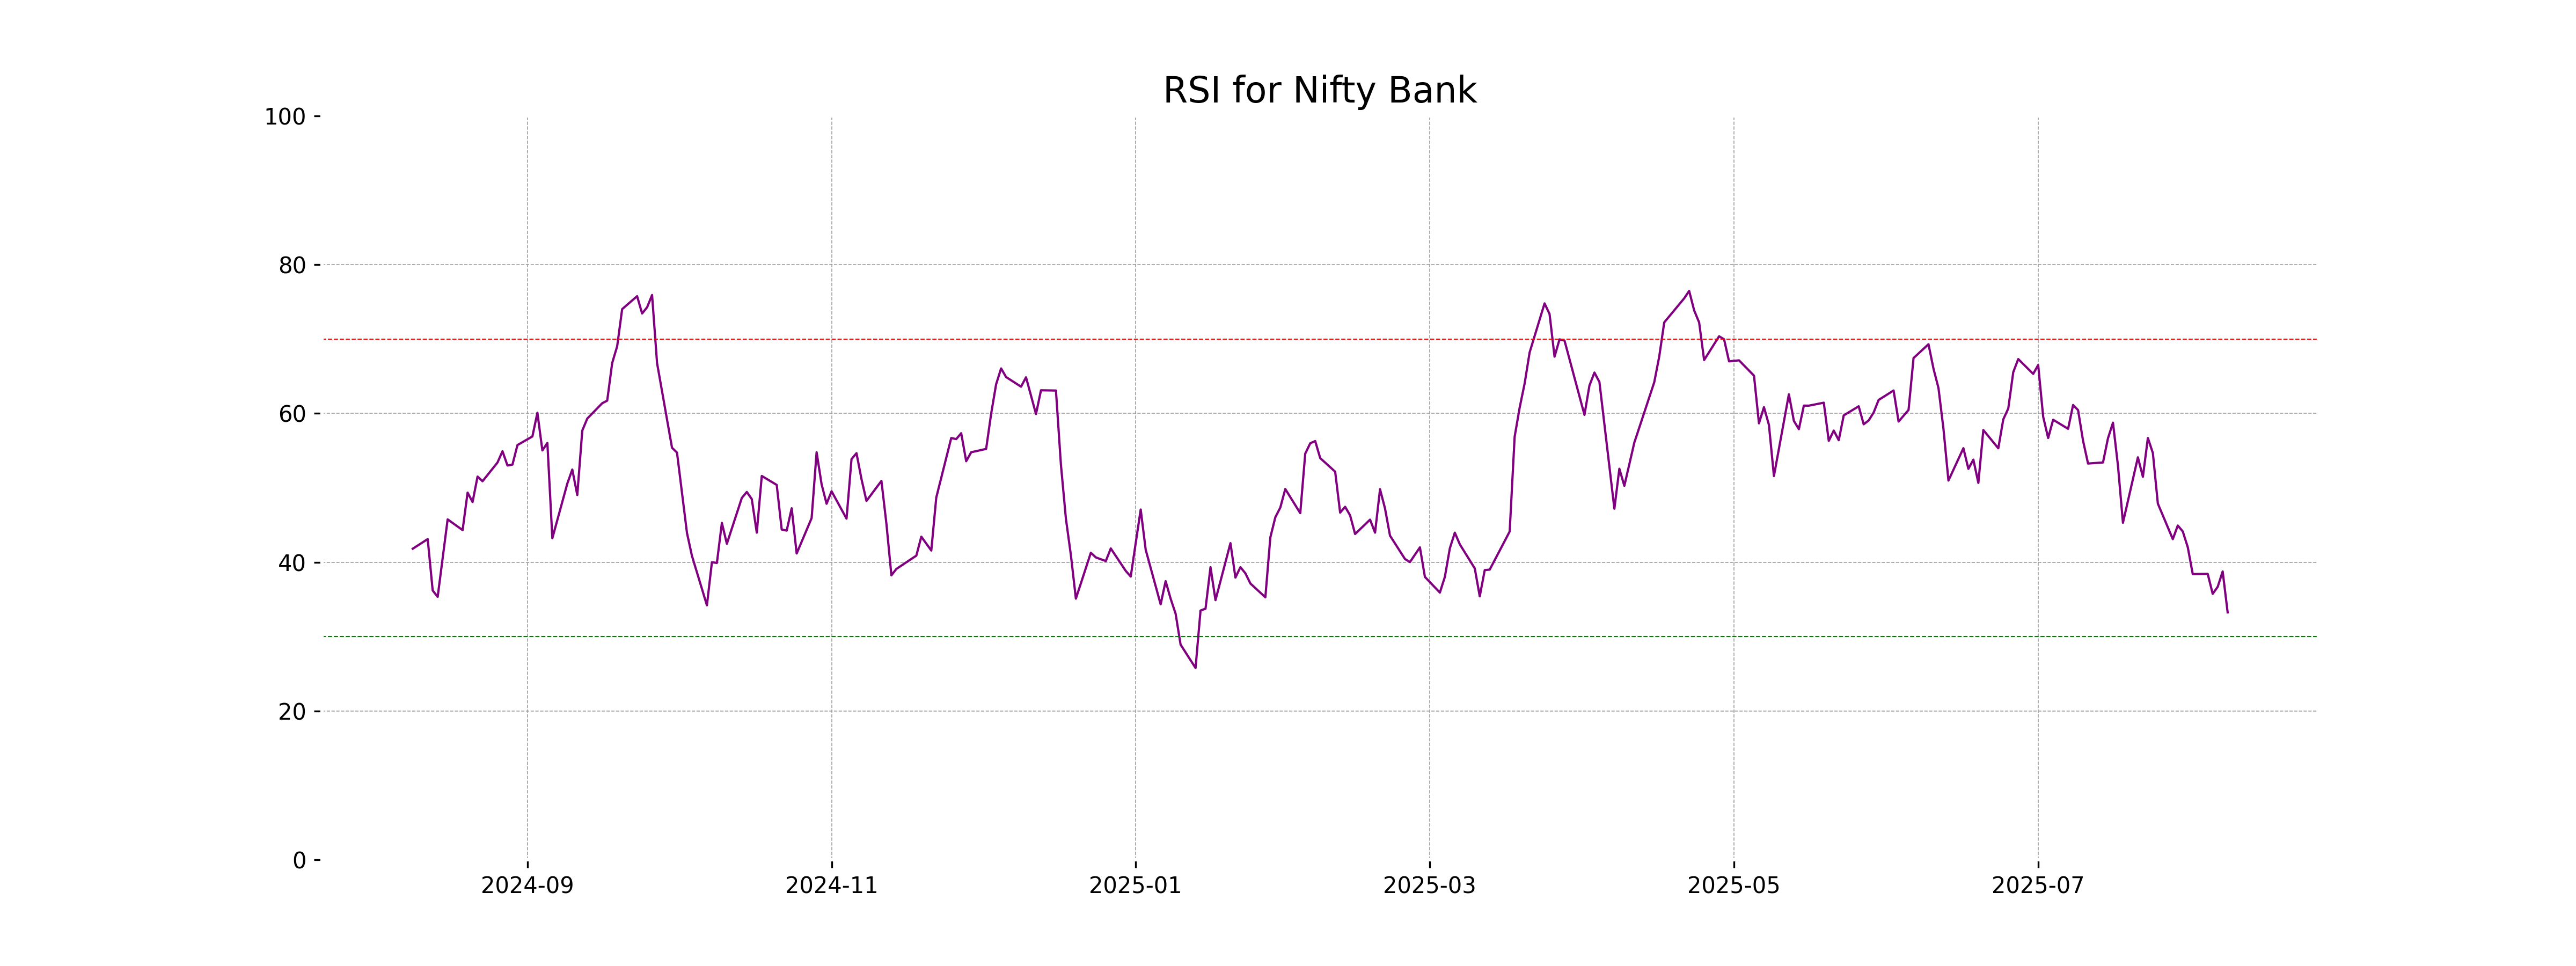
RSI Analysis
The RSI for Nifty Bank is currently at 33.25, which suggests that the stock is approaching the oversold territory. This could indicate potential for a reversal or consolidation in the near term, but caution is advised as it remains close to oversold conditions.
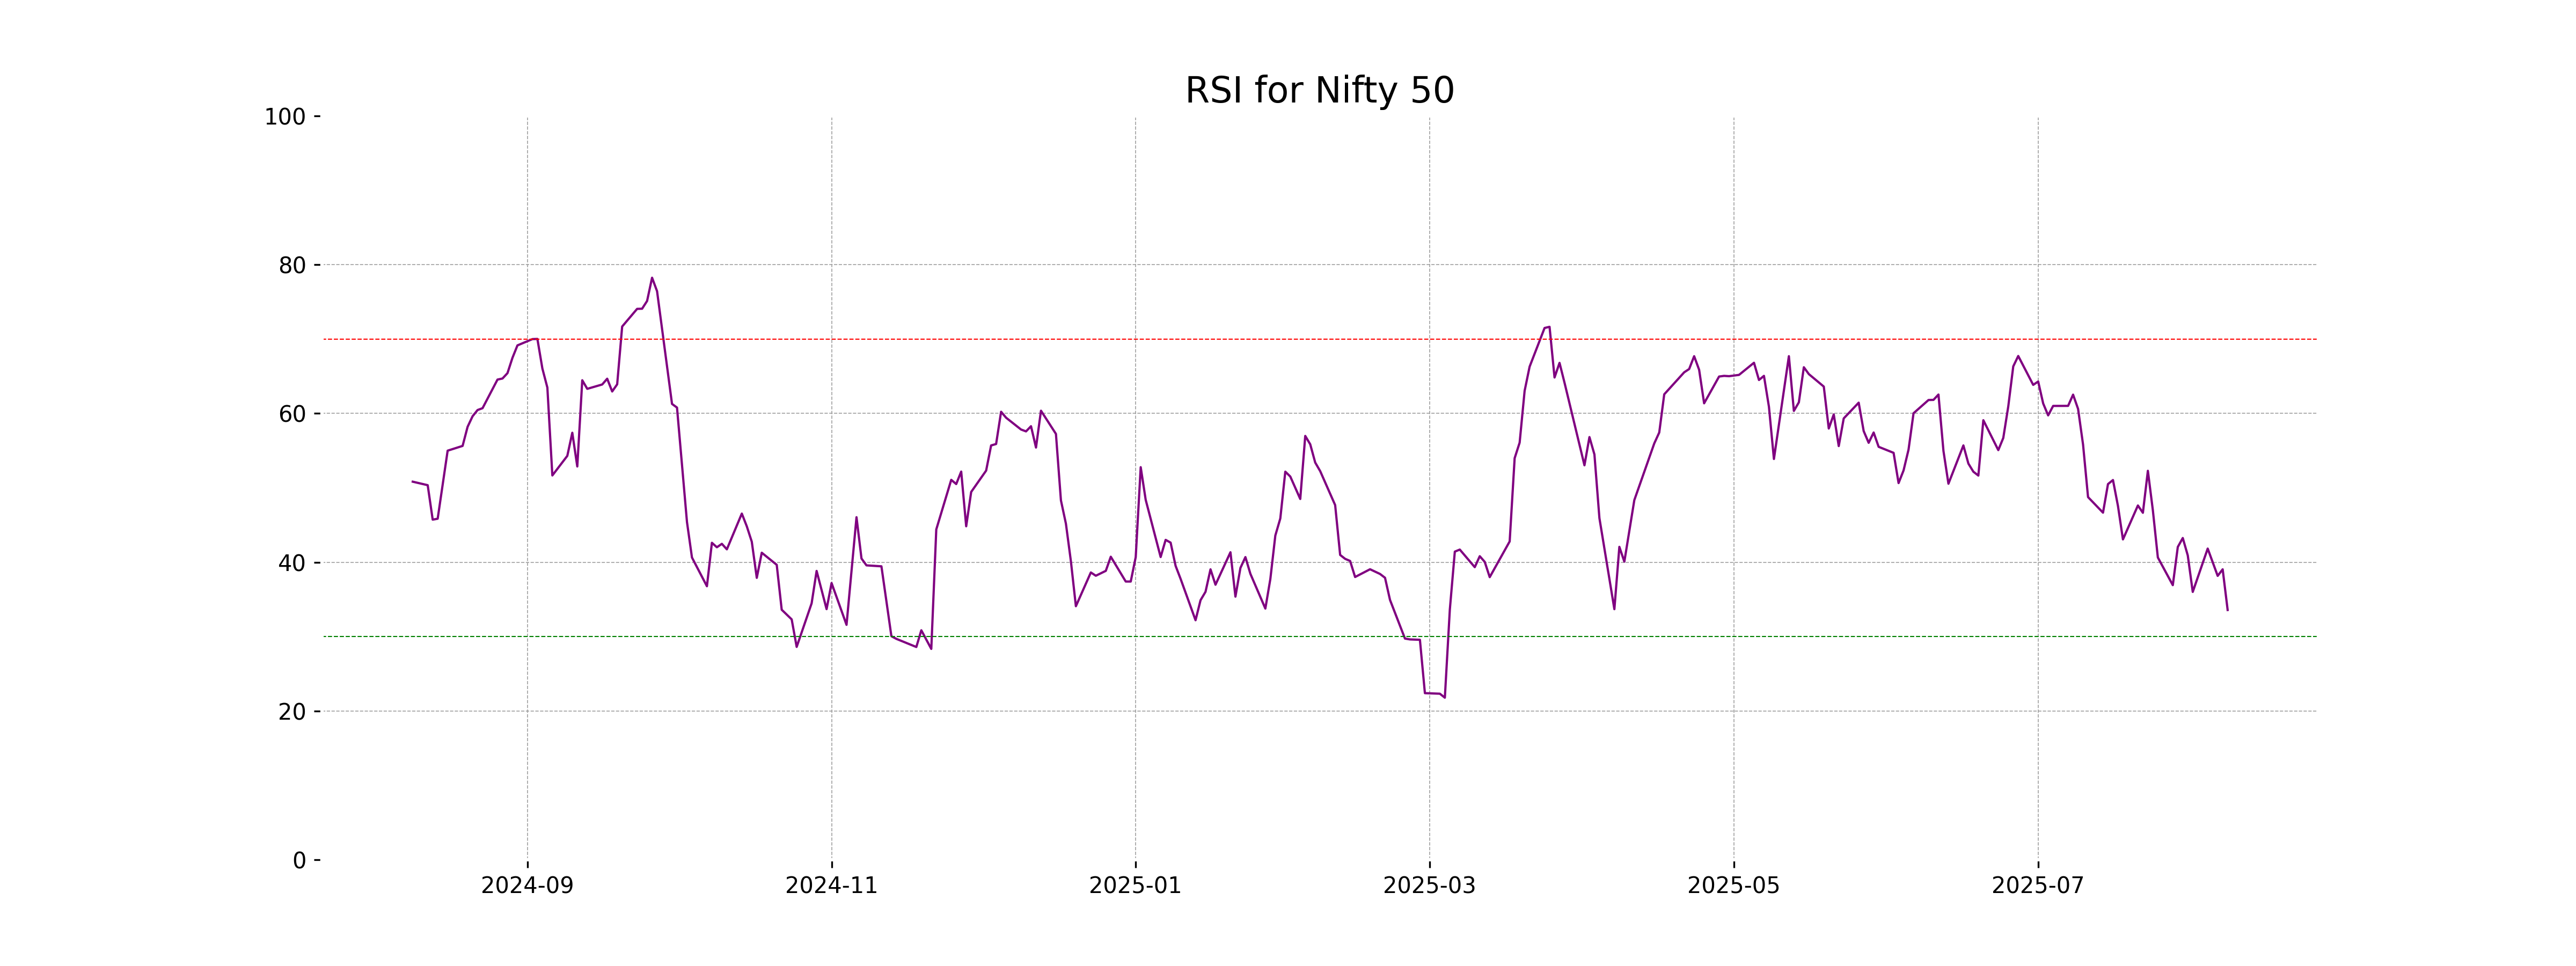
Analysis for Nifty 50 - August 08, 2025
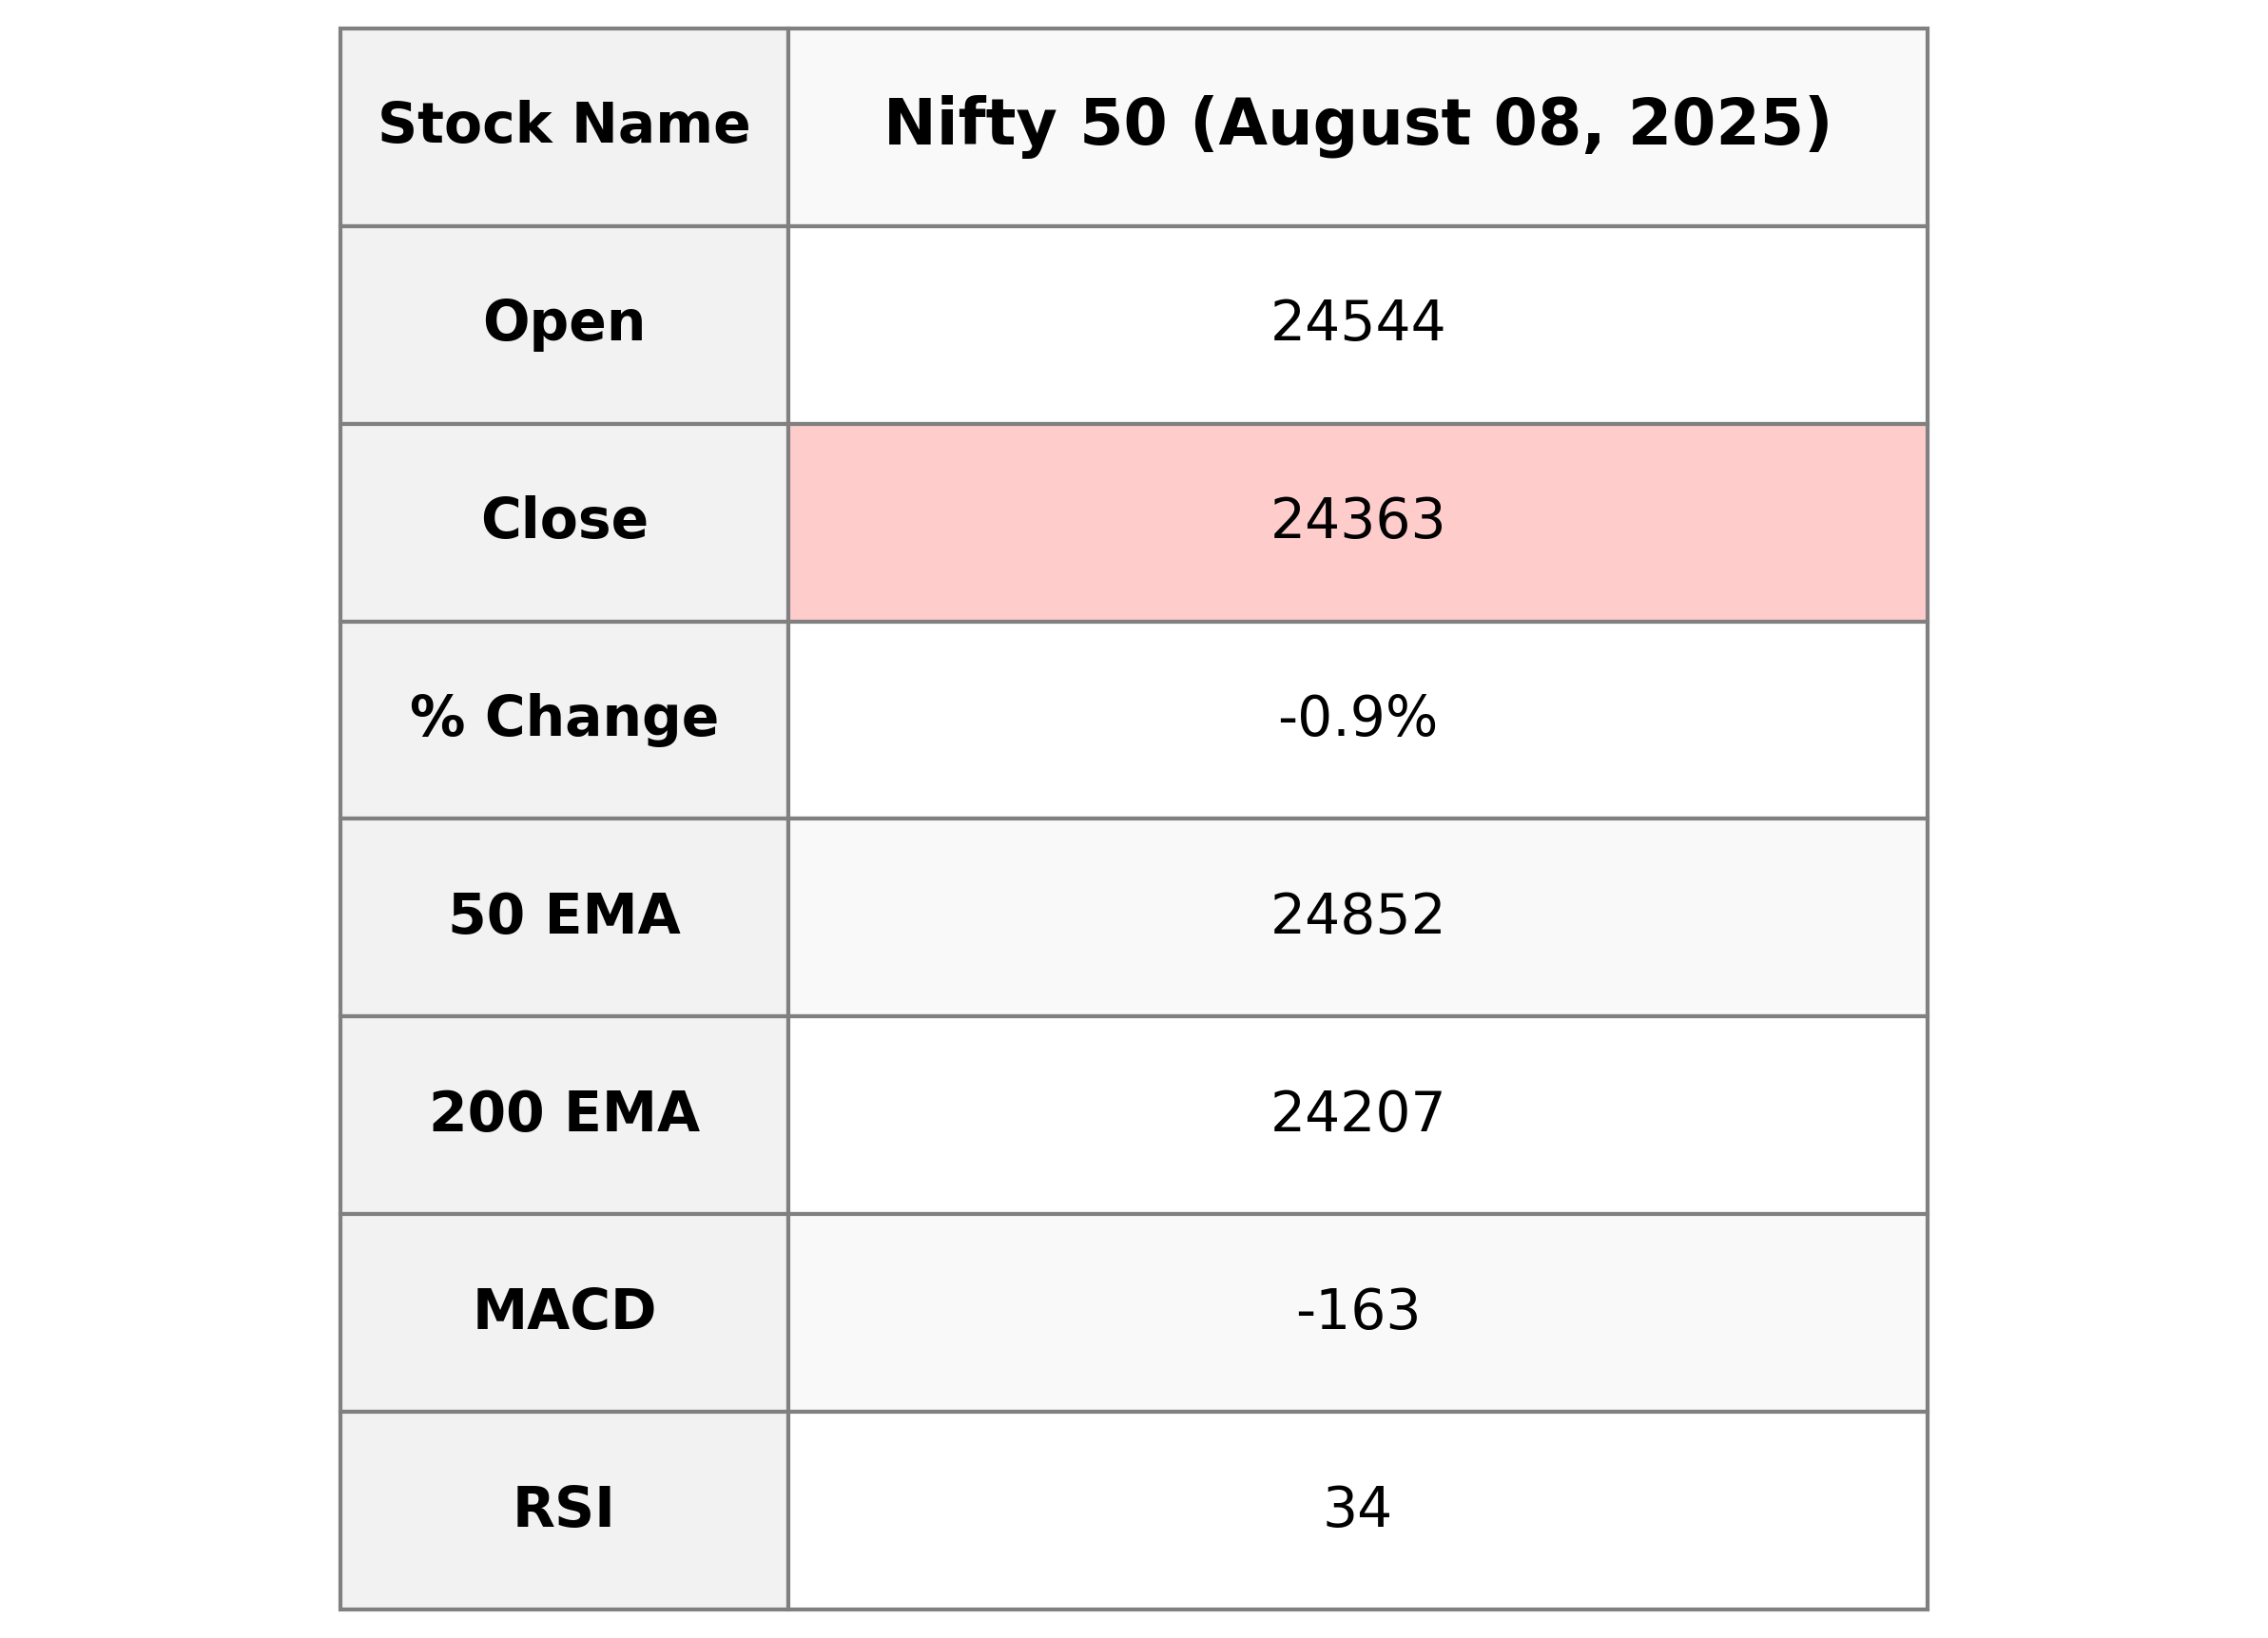
Nifty 50 Performance Summary: The Nifty 50 closed at 24,363.30, reflecting a decrease of 0.95% from its previous close of 24,596.15, with a points change of -232.85. The day's trading saw a high of 24,585.50 and a low of 24,337.50. The current RSI stands at 33.58, indicating potential bearish momentum, as it is below the neutral 50 mark. Additionally, the MACD of -163.30 suggests further bearish sentiment, diverging from the MACD Signal at -109.38.
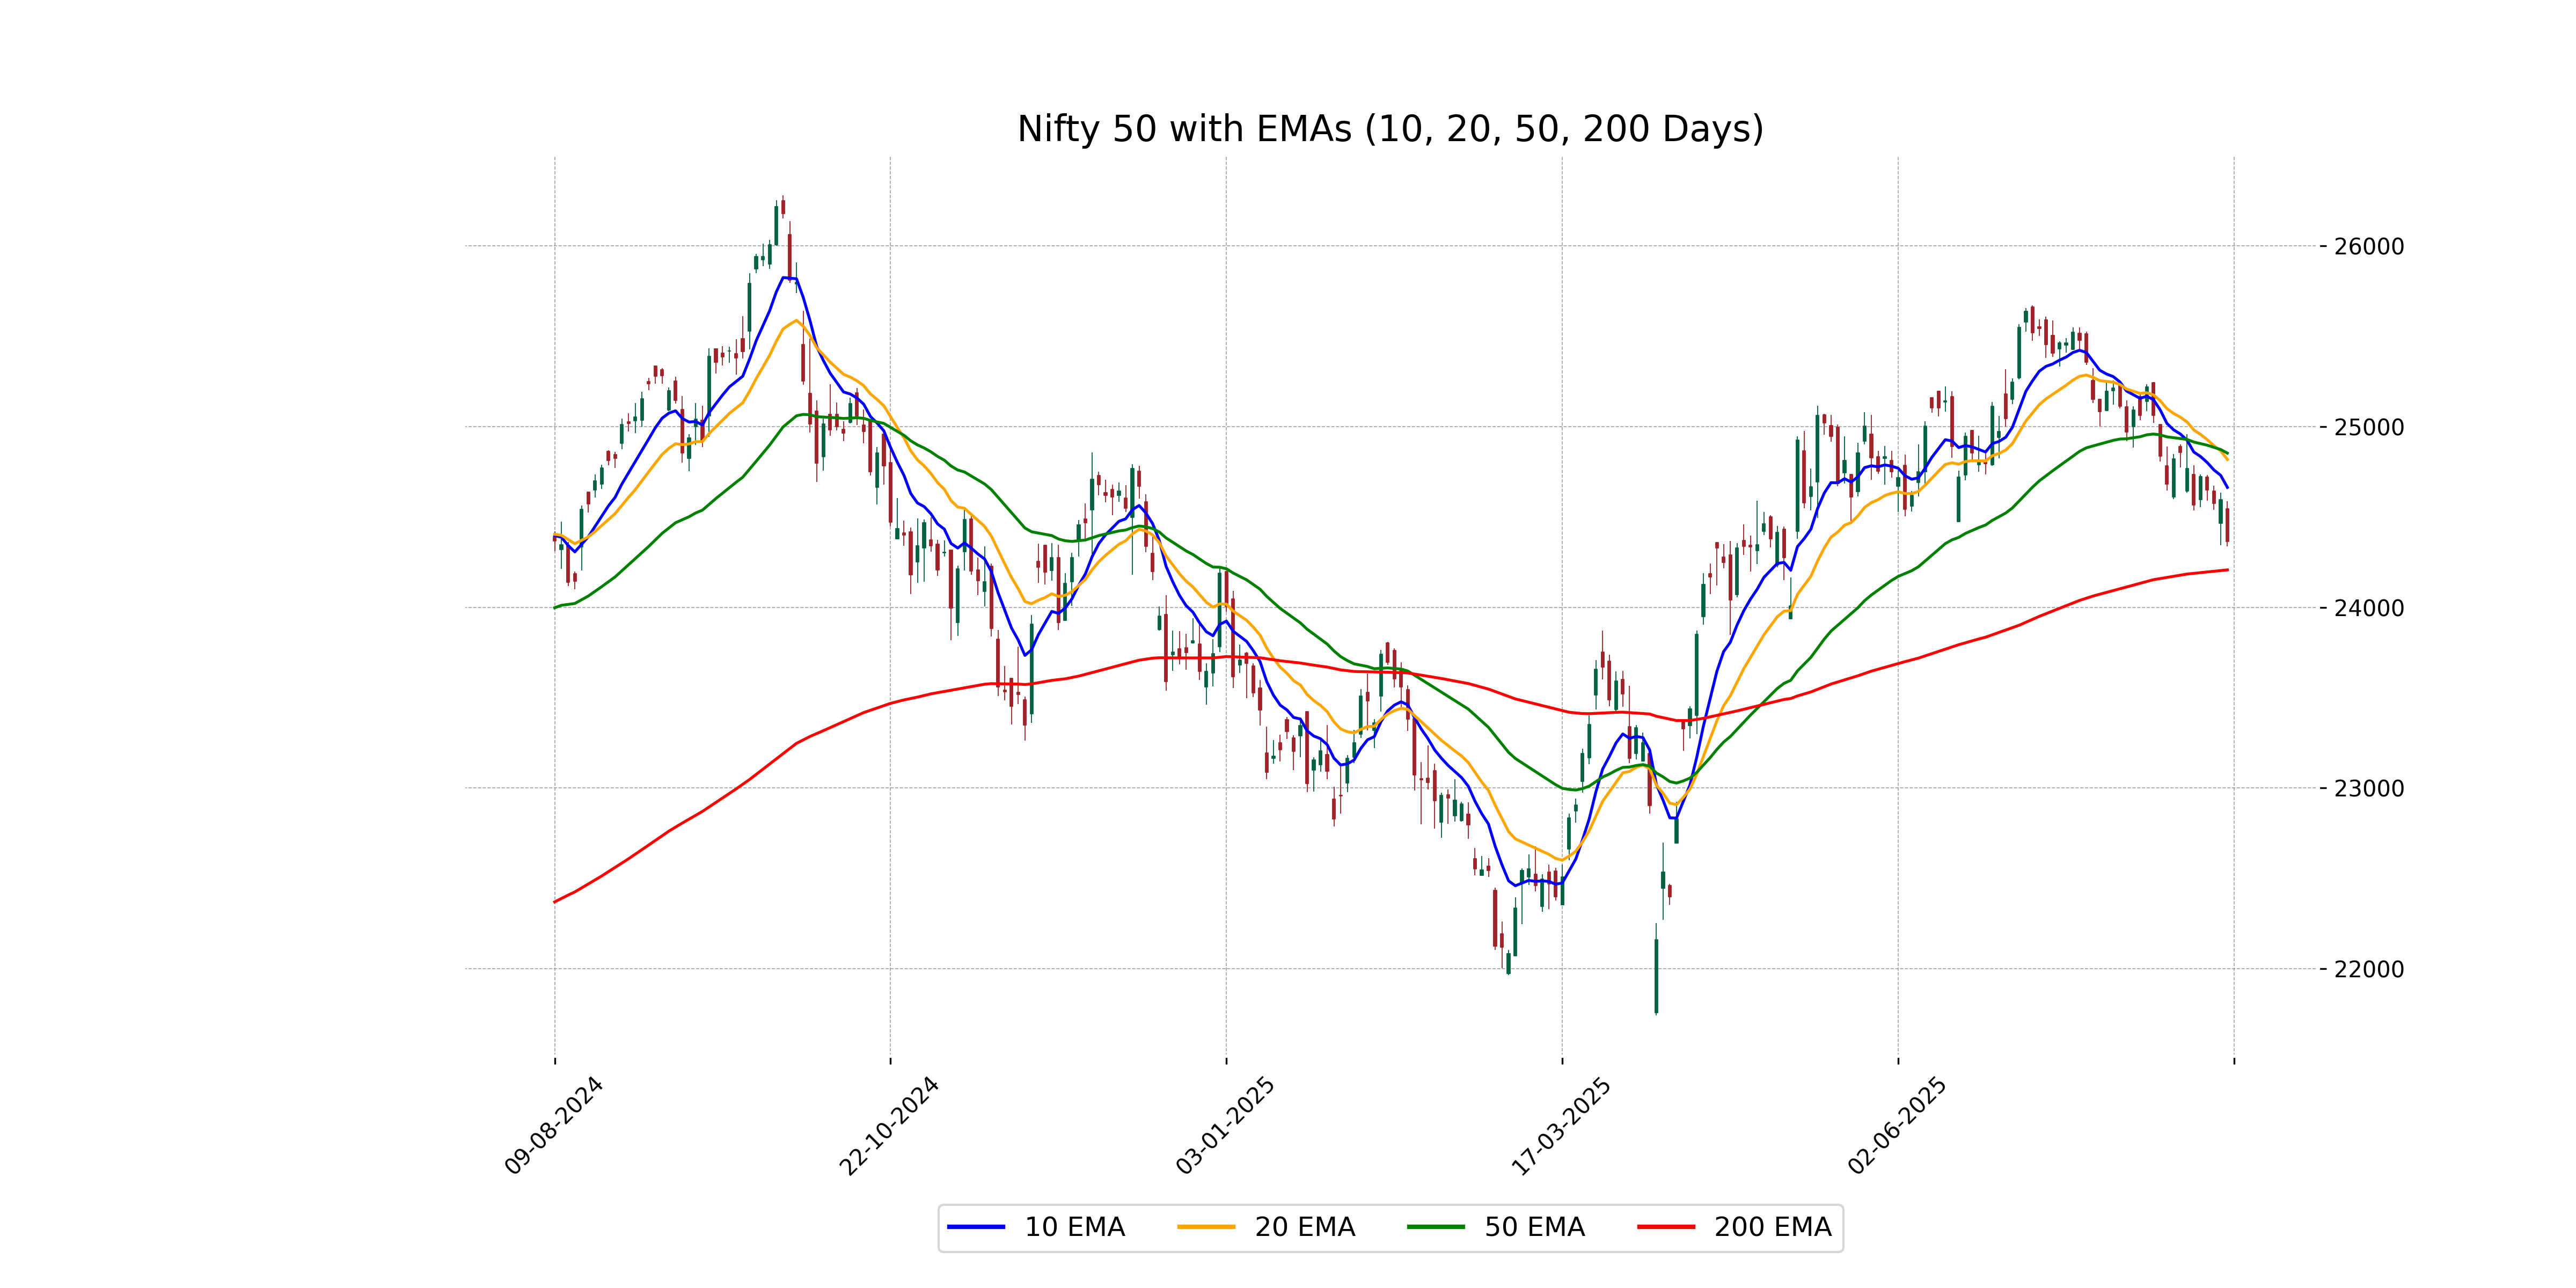
Relationship with Key Moving Averages
The closing price of Nifty 50 at 24,363.30 is below its 50 EMA (24,852.50) and 10 EMA (24,663.01), indicating a bearish trend in the short term. However, it remains above the 200 EMA (24,206.73), suggesting that the longer-term trend may still be supported.
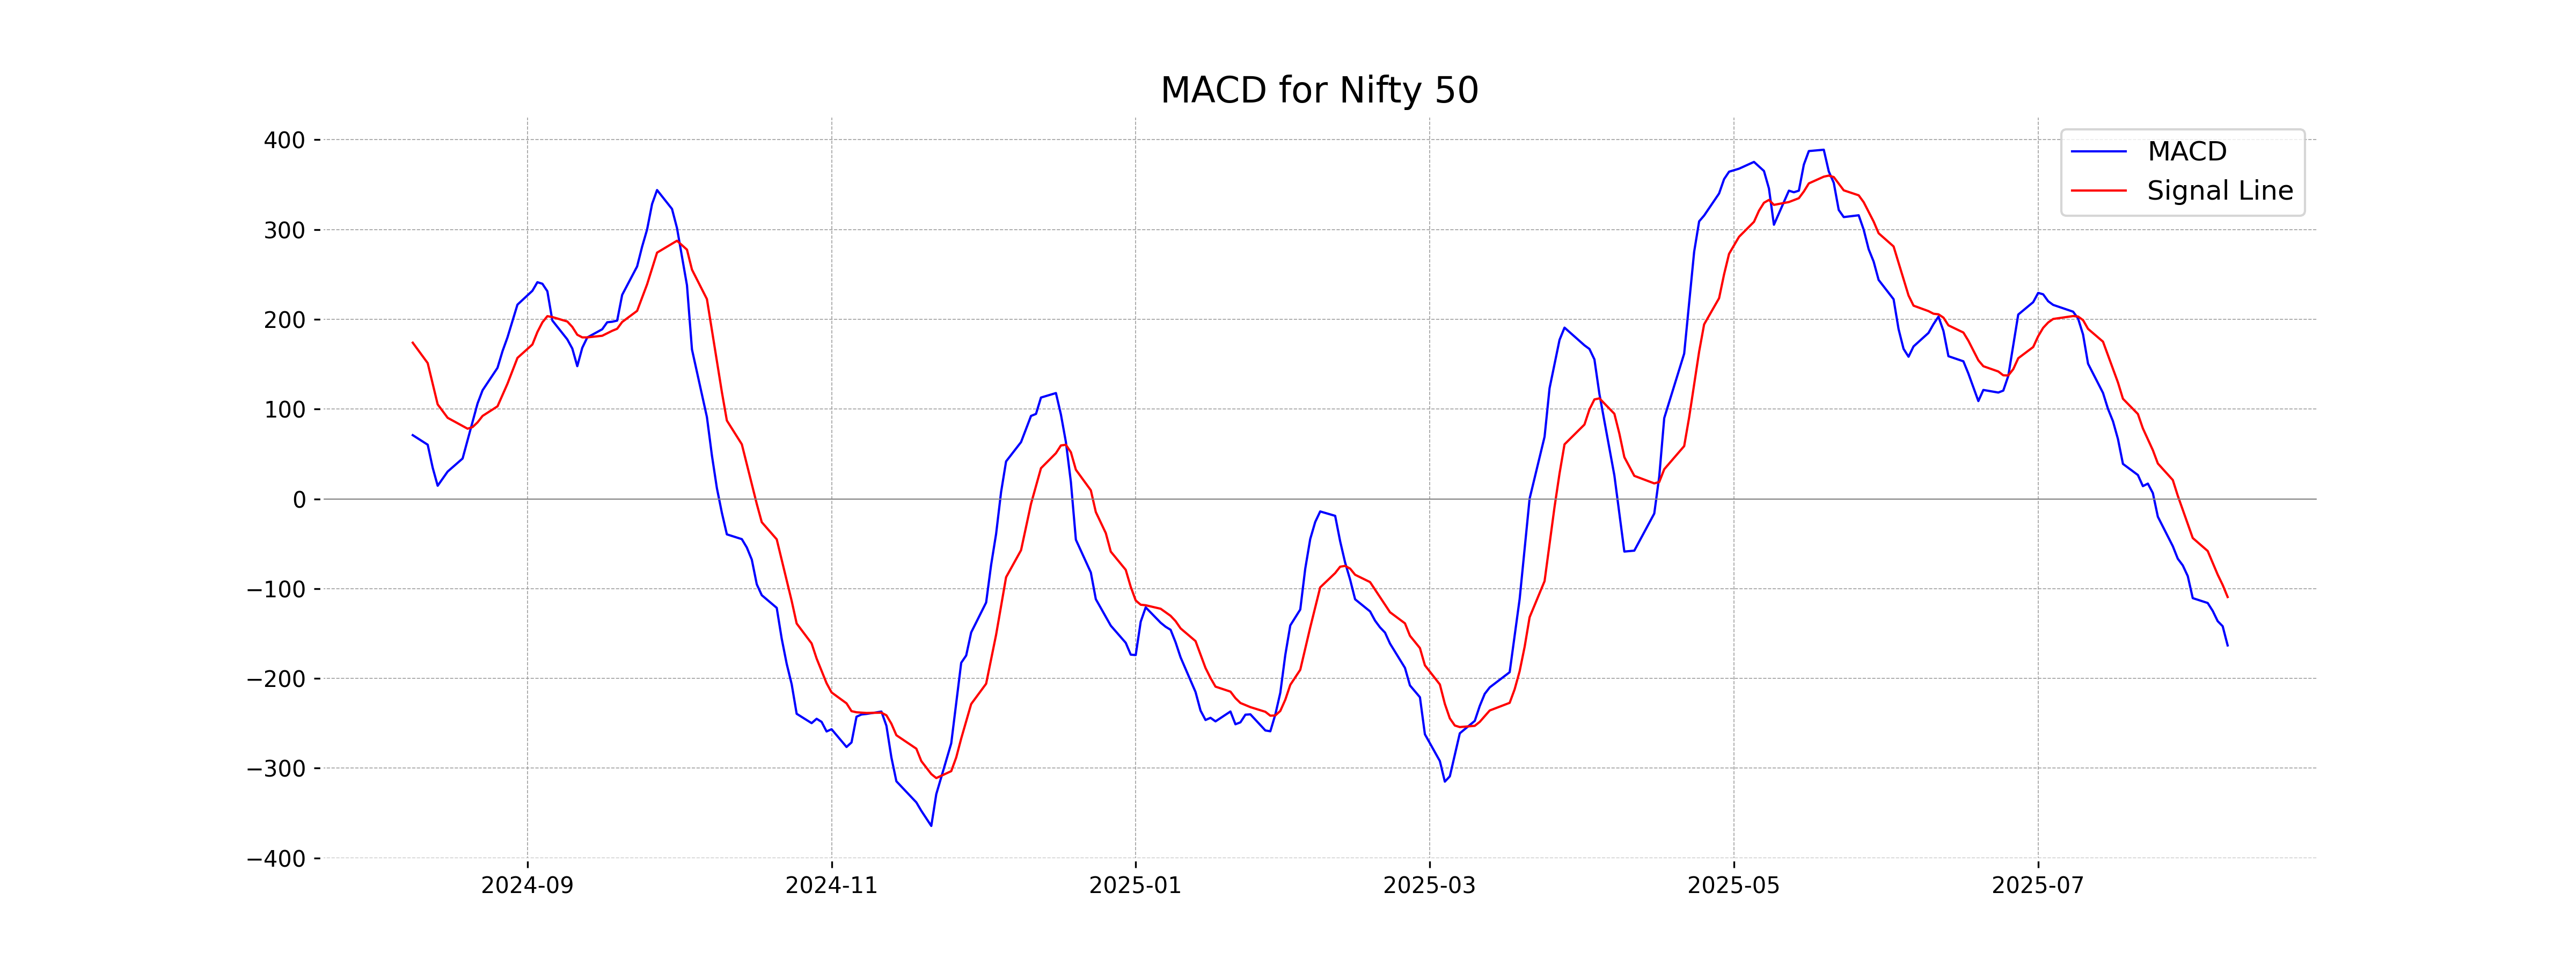
Moving Averages Trend (MACD)
The MACD analysis for Nifty 50 indicates a bearish trend as the MACD value of -163.30 is below the MACD Signal of -109.38. This suggests that downward momentum is strengthening. Investors might interpret this as a potential signal for caution regarding further declines.
RSI Analysis
The Relative Strength Index (RSI) for Nifty 50 is 33.58, which is below the commonly used 30 threshold that suggests the index might be nearing oversold conditions. This indicates potential bearish sentiment, as values below 30 typically signal that the security is oversold, suggesting a possible buying opportunity.