Indian Stock Market Sector-wise Performance: Which Sector is performed Well Today - April 16, 2025
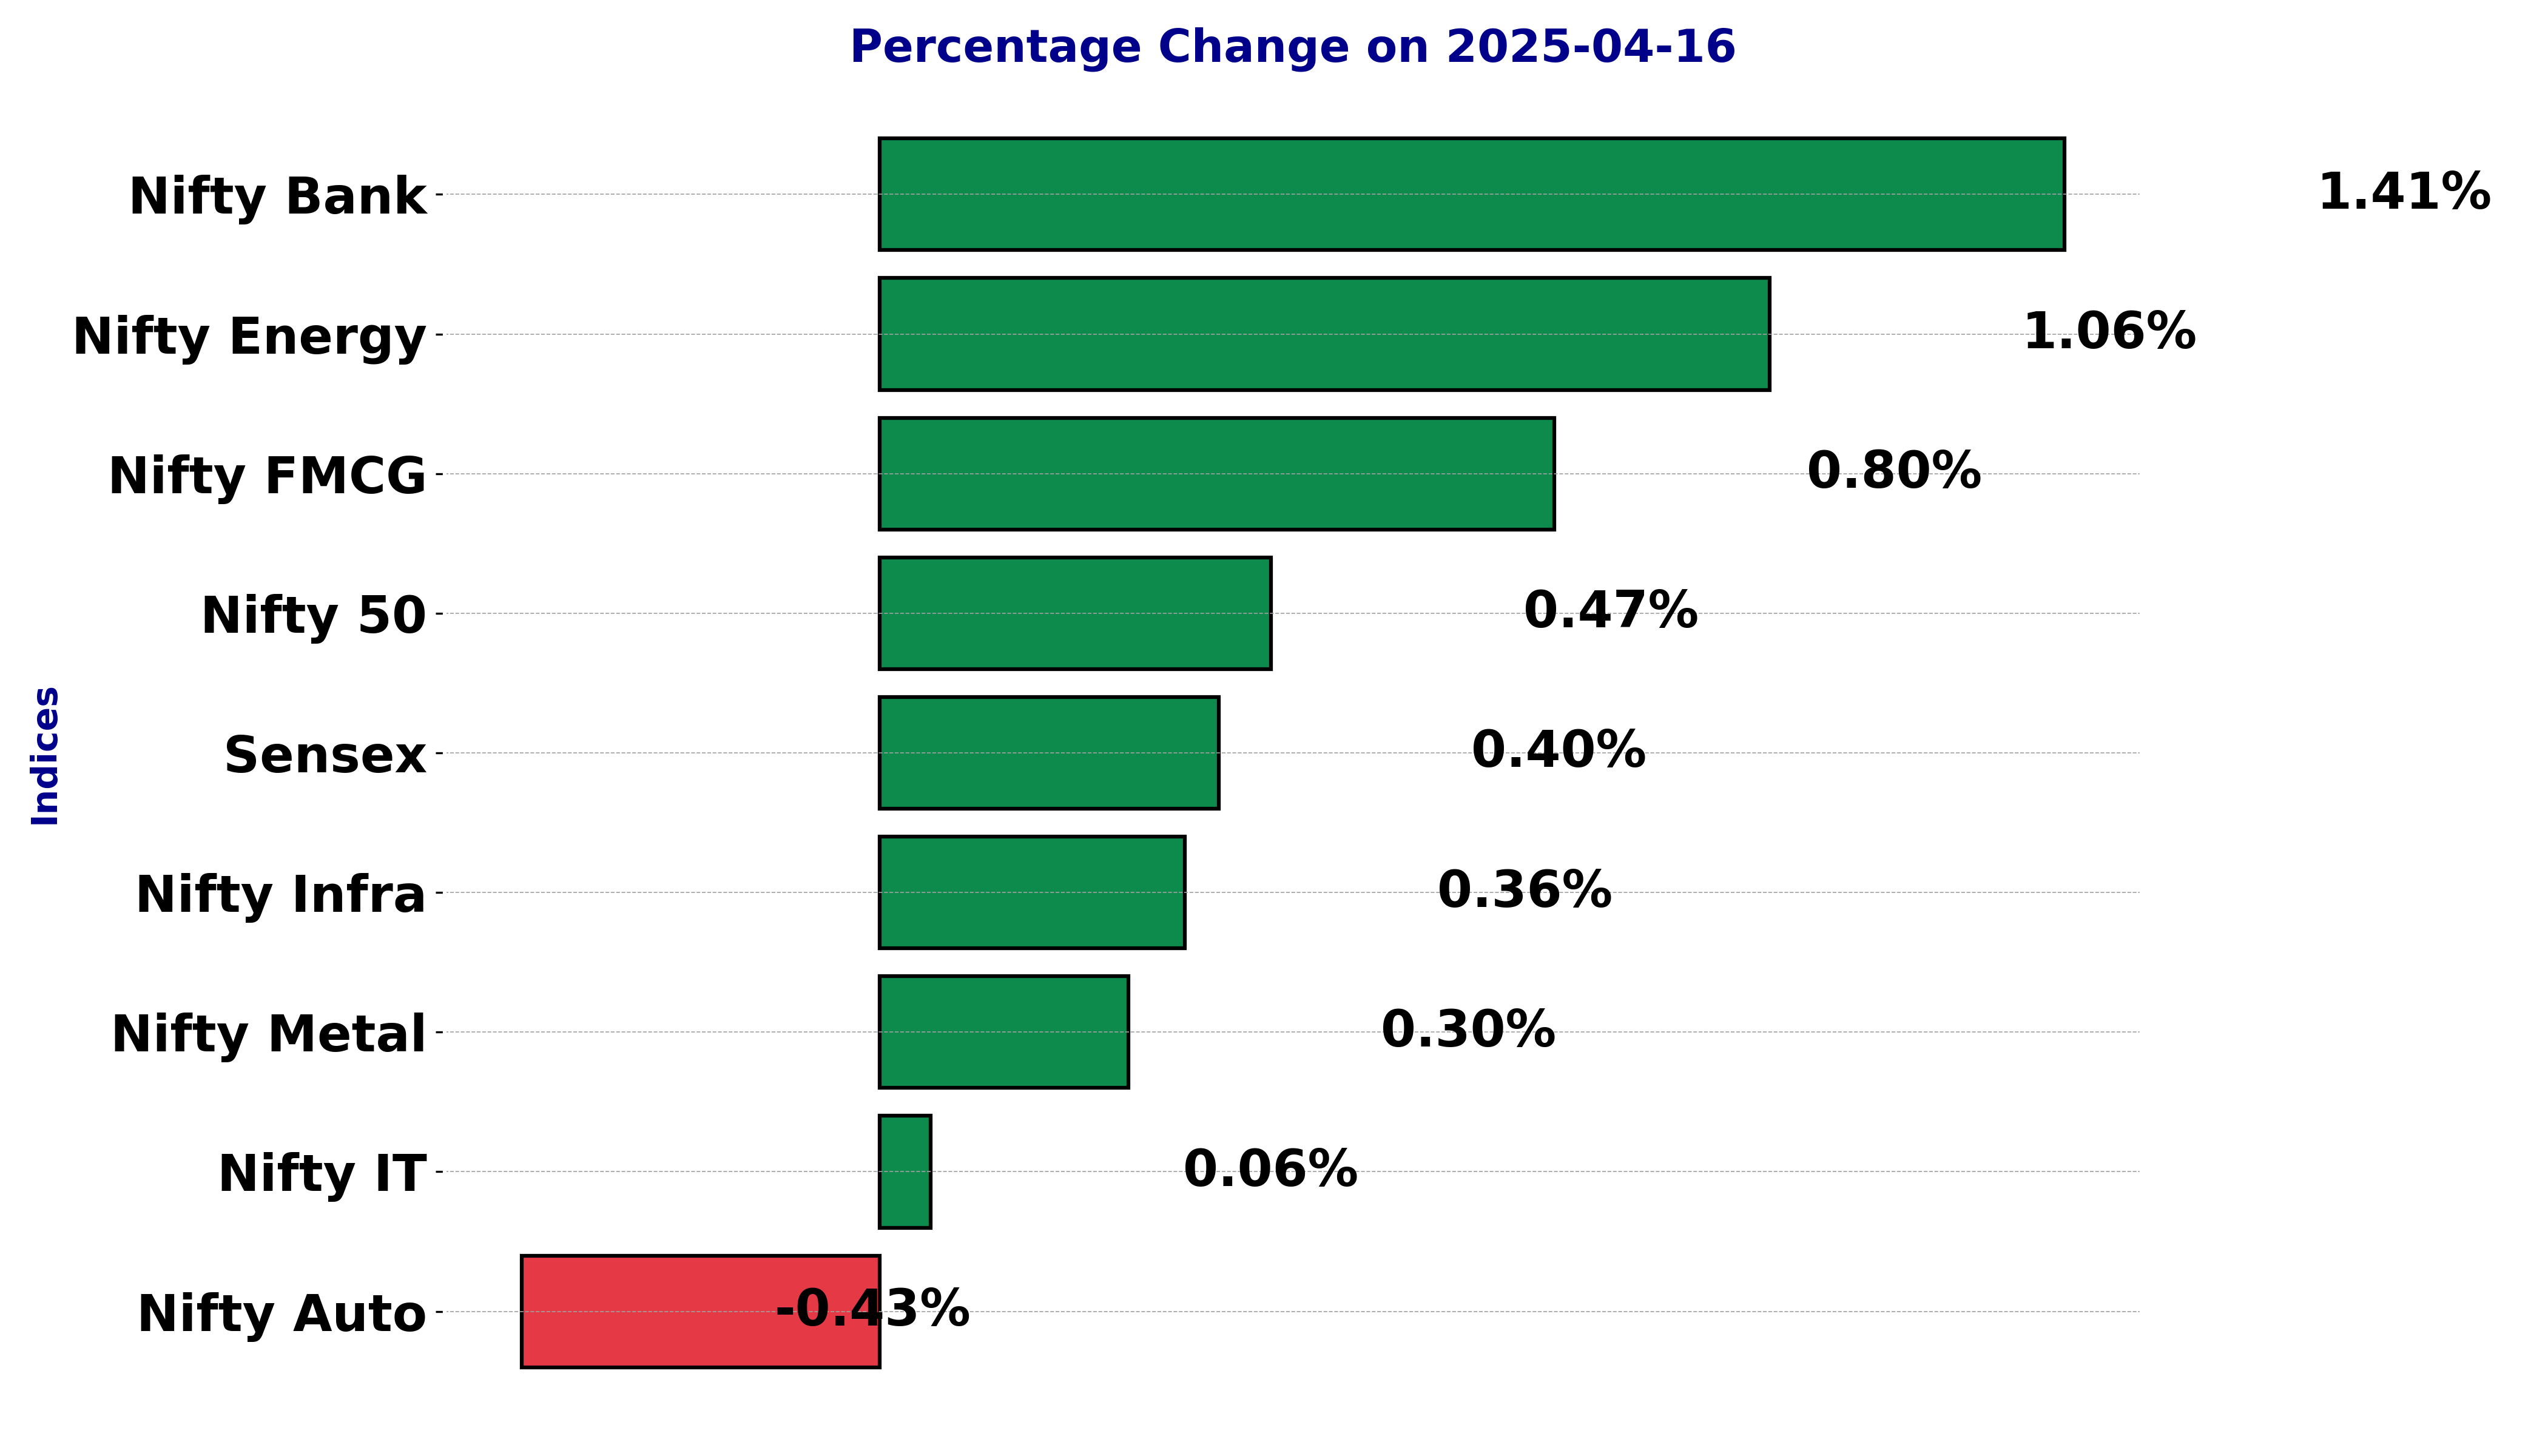
The latest stock market session witnessed varied movements across different sectors, reflecting a mixed pattern of gains and losses among major indices. One of the most remarkable performances was seen in the Nifty Bank, which surged by an impressive 1.41%. This notable increase highlights the robust performance within the banking sector, contributing significantly to the overall market uplift. Another key sector, the Nifty Energy, posted a substantial gain of 1.06%. This indicates a strong upward momentum in the energy sector, driven by factors such as positive investor sentiment and favorable market conditions. The Nifty FMCG also recorded a solid performance, advancing by 0.80%, showcasing resilience and an optimistic outlook within the fast-moving consumer goods sector. On the other hand, the Nifty Auto experienced a decline of 0.42%, marking a challenging day for the automotive sector. This downward movement could be attributed to factors such as supply chain disruptions or weaker demand, affecting investor confidence. Additionally, the Nifty IT showed a marginal increase of 0.06%. Despite this small gain, the information technology sector remains an area of interest for investors, albeit with cautious optimism. The Nifty Metal edged up by 0.29%, reflecting a modest gain and indicating steady interest in the metal sector. The benchmark indices, including the Sensex and the Nifty, demonstrated moderate gains of 0.40% and 0.46%, respectively. These movements reflect an overall positive sentiment in the broader market, with investors capitalizing on growth opportunities in specific sectors. The standout performance by the Nifty Bank offers insights into the prevailing factors driving the market. The rally in banking stocks indicates positive developments such as robust earnings reports, regulatory stability, or favorable economic indicators supporting the financial sector. In summary, the stock market exhibited a balanced mix of sectoral performances. While the banking and energy sectors led the charge with remarkable gains, the automotive sector faced headwinds with a noticeable decline. These market movements underline the dynamic nature of stock trading and the various factors influencing investor decisions.
Analysis for Sensex - April 16, 2025
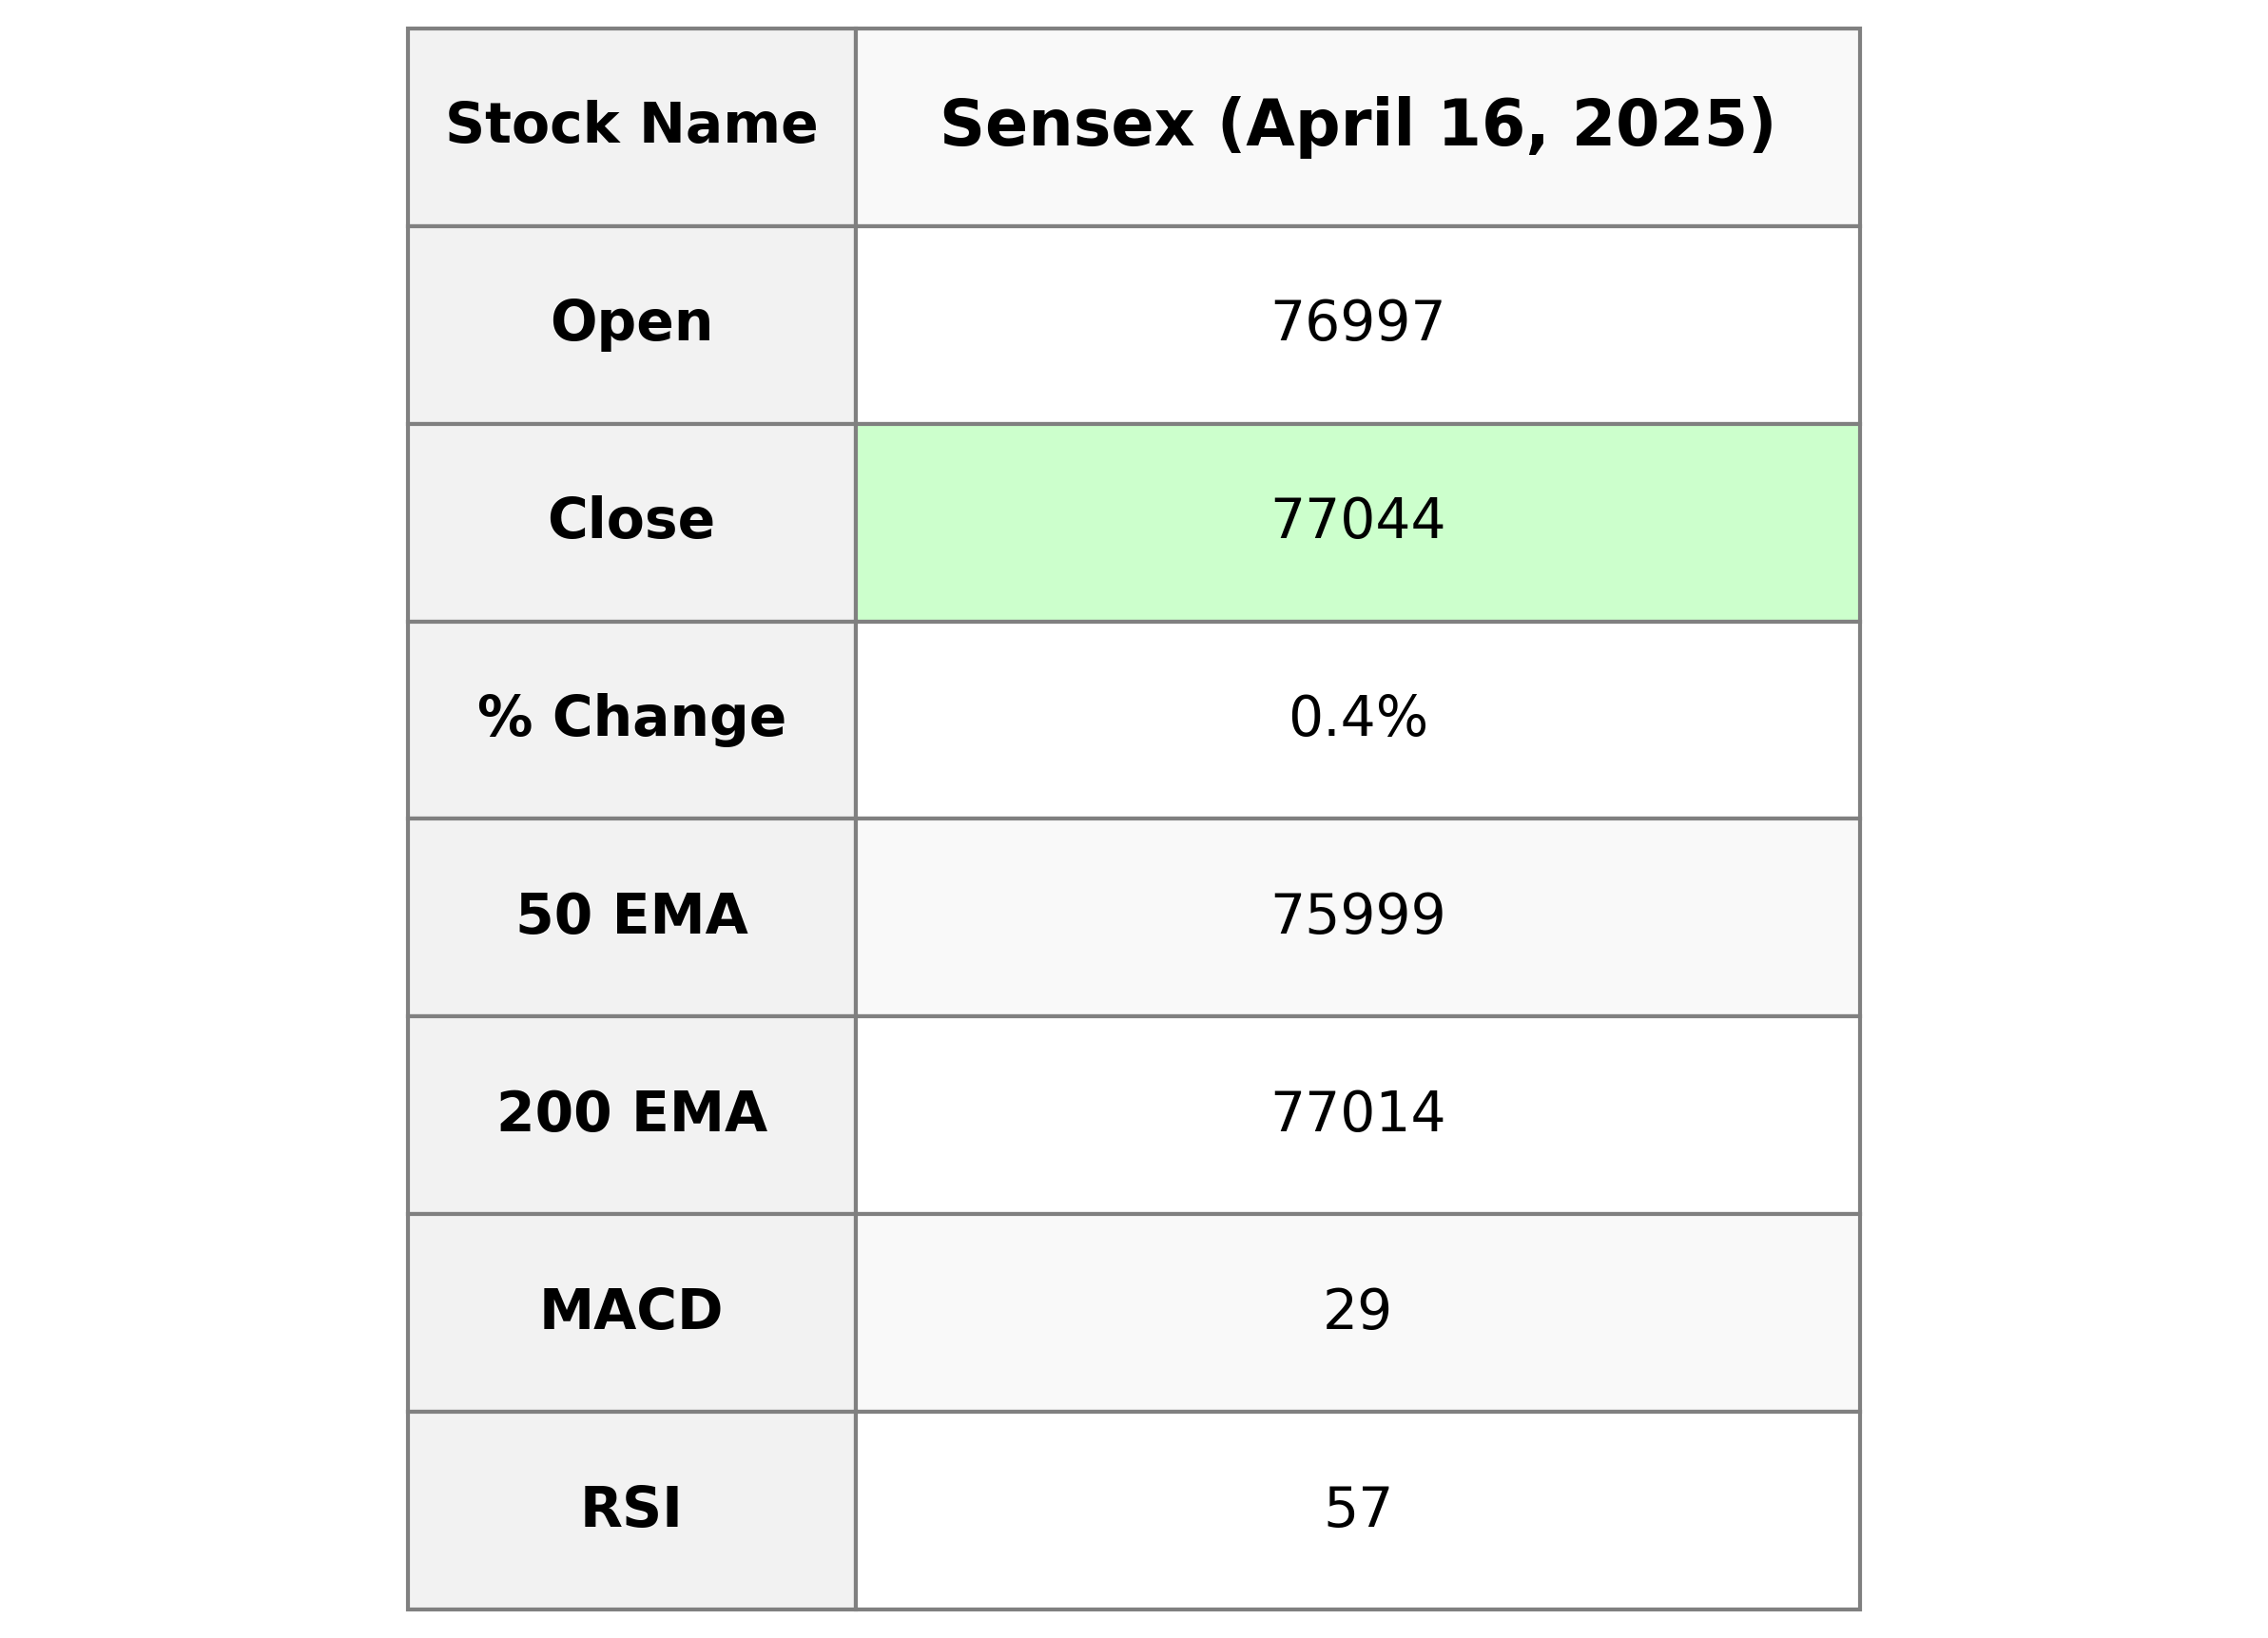
Sensex opened at 76996.78 and closed at 77044.29, marking a gain with a points change of 309.40 from the previous close of 76734.89. The index showed a modest upward movement with a percentage change of approximately 0.40%. Technical indicators like the RSI at 57.01 suggest a neutral momentum, and the MACD of 29.34 indicates a positive trend compared to its signal line.
Relationship with Key Moving Averages
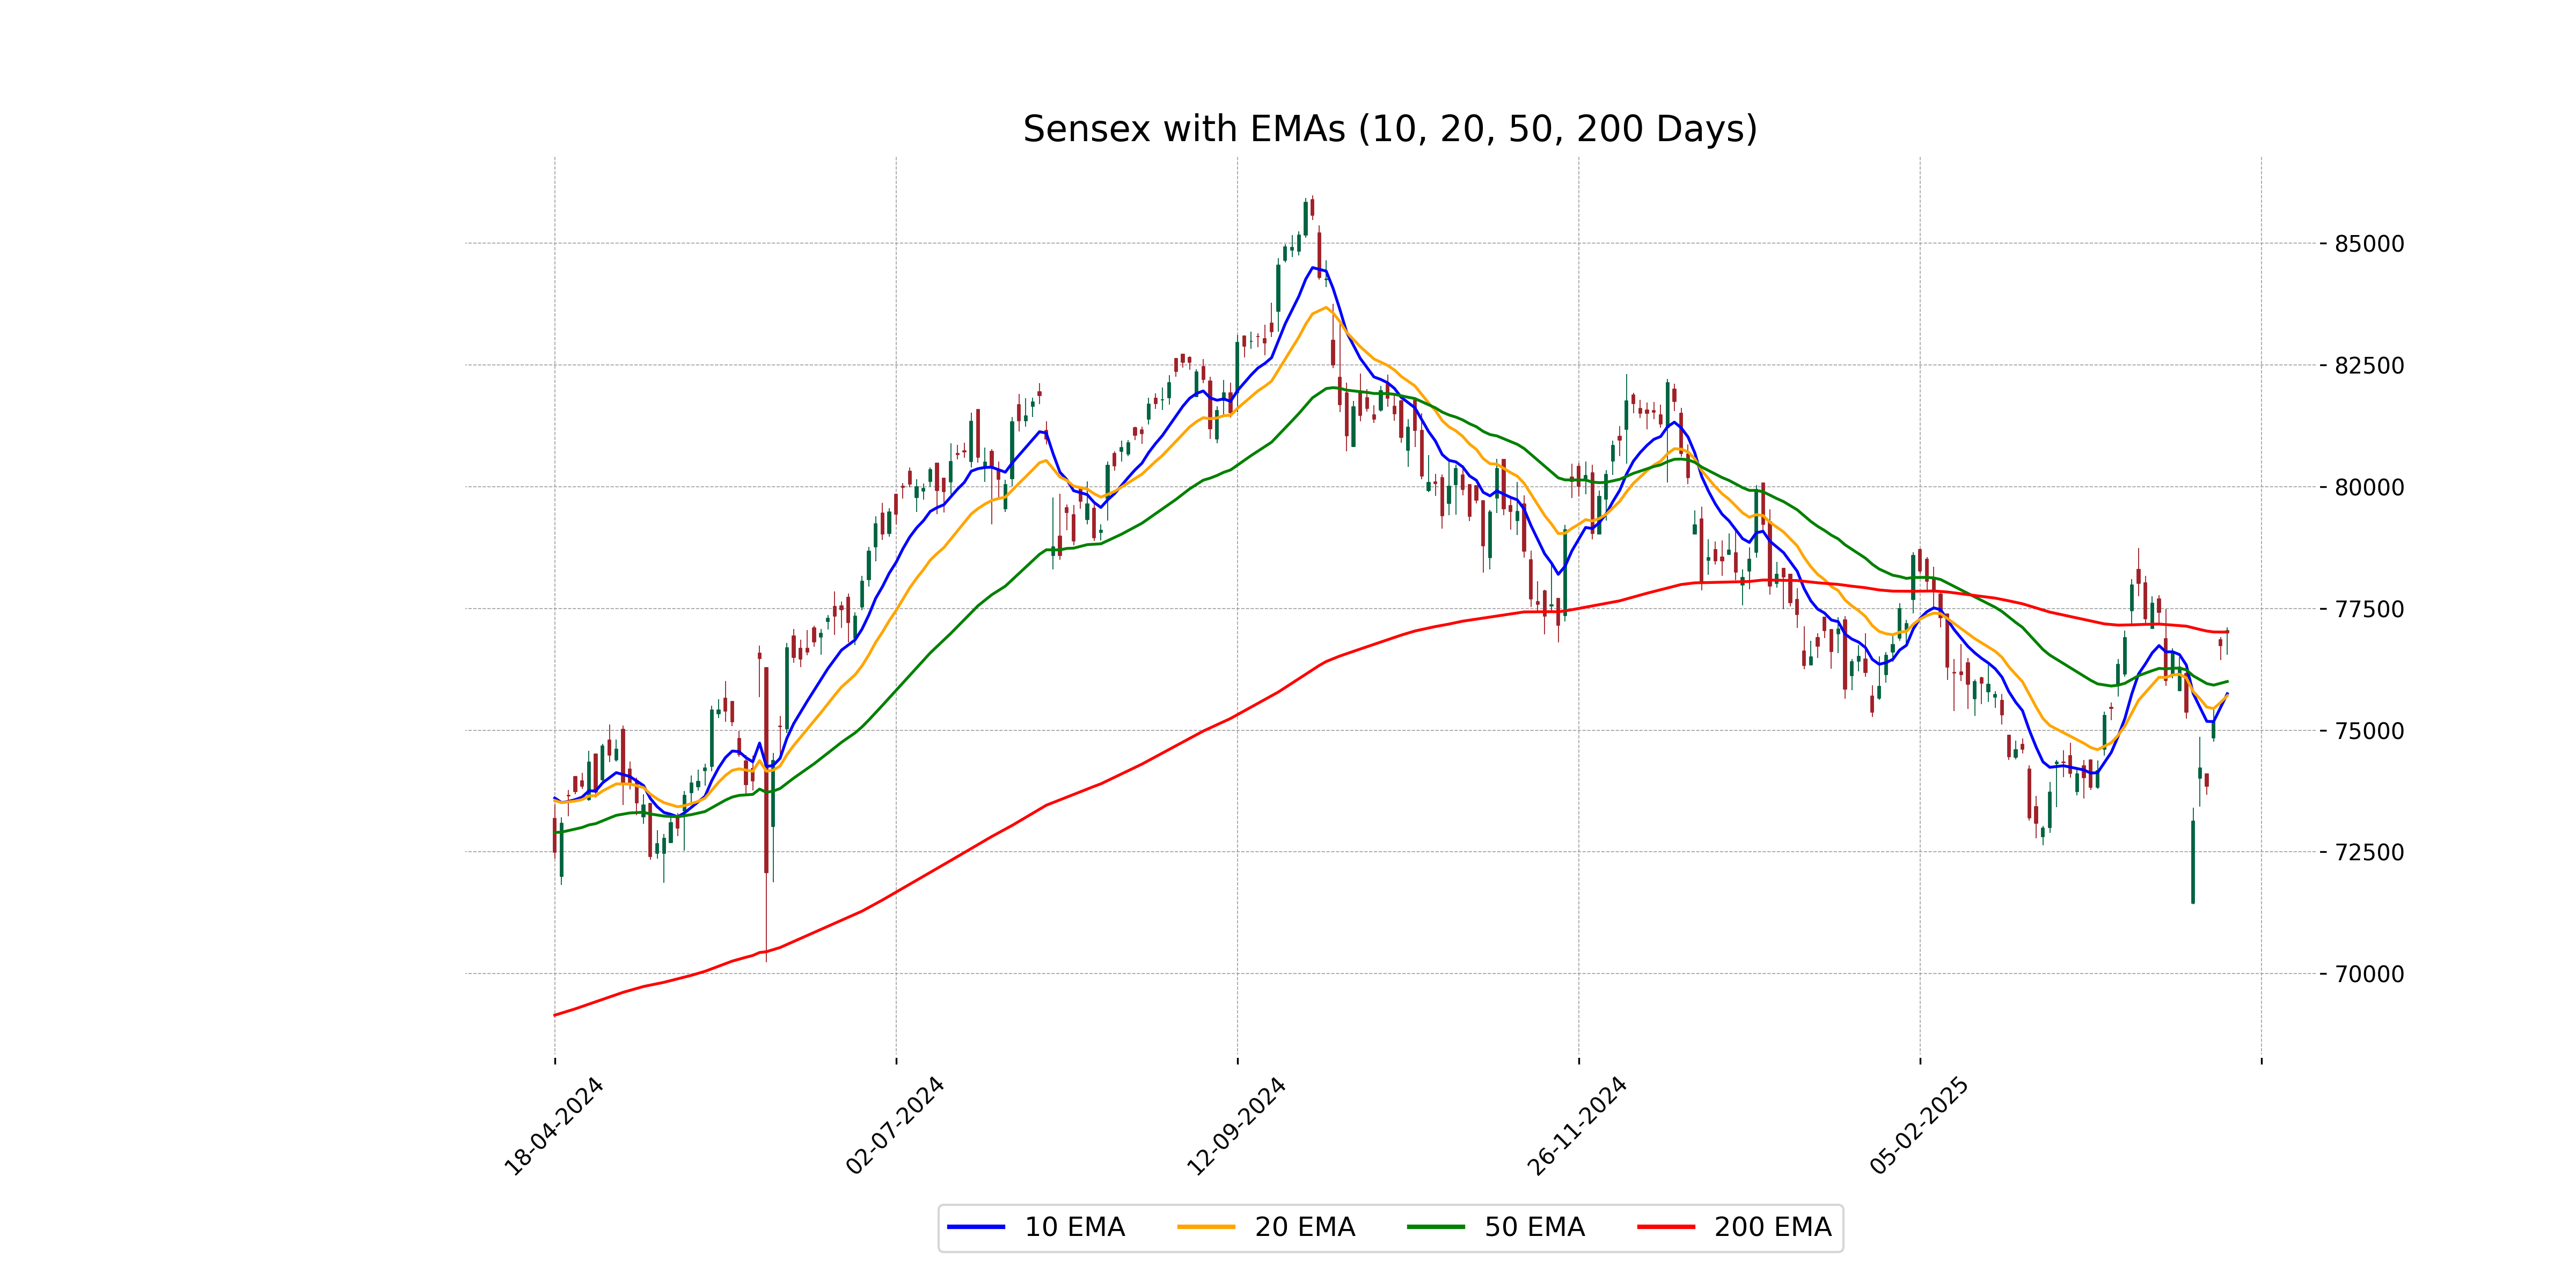
The closing price of the Sensex is above its 50-day EMA of 75999.2619, indicating short-term upward momentum. It is also slightly above the 200-day EMA of 77013.9937, suggesting long-term positive sentiment. These positions against the key moving averages indicate bullish conditions in the market.
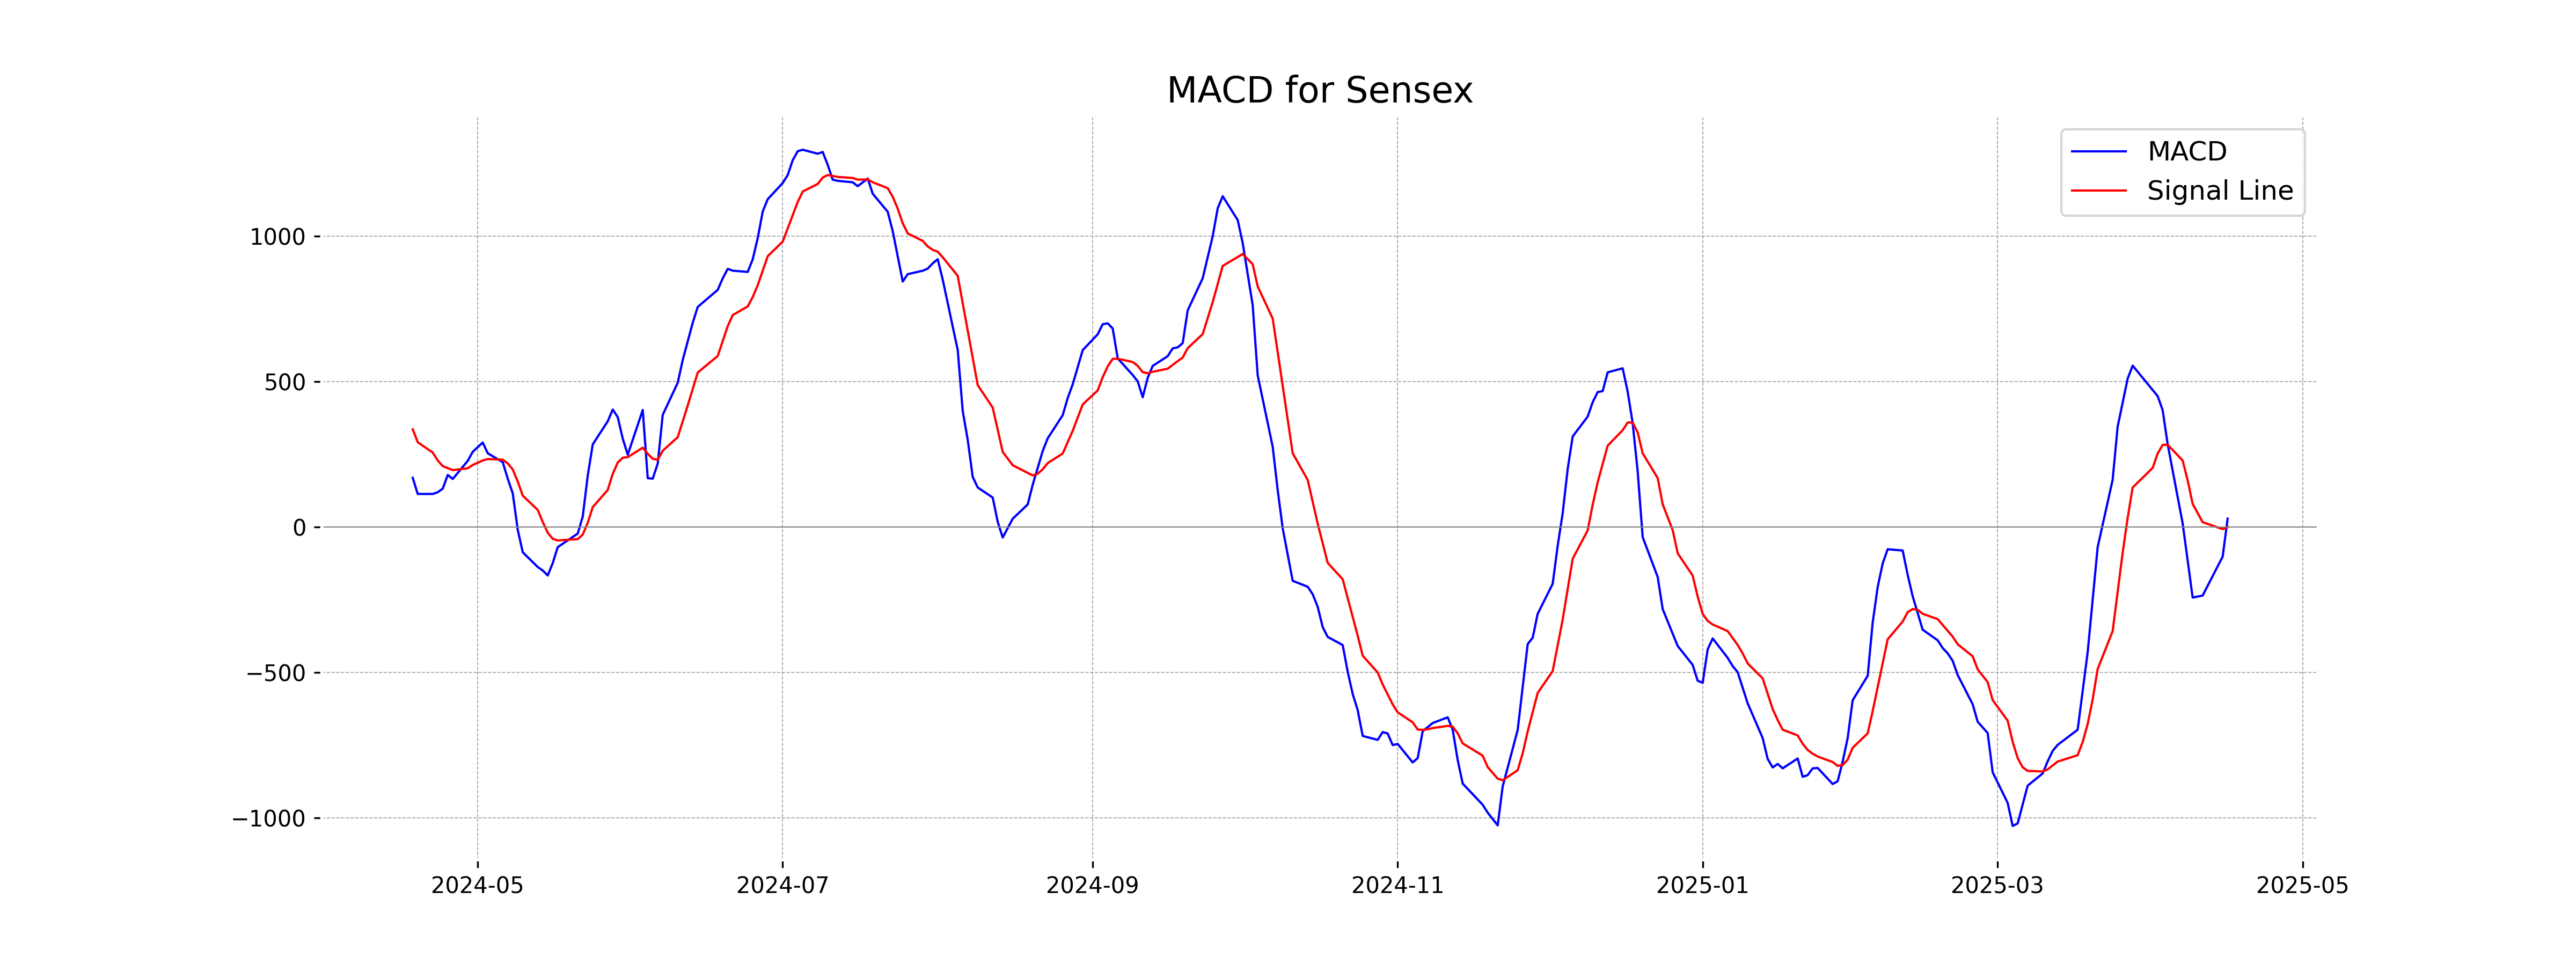
Moving Averages Trend (MACD)
The MACD for Sensex is significantly above the Signal Line, indicating a bullish momentum. With a MACD of 29.34 compared to the Signal Line at 0.60, it suggests a strong upward trend.
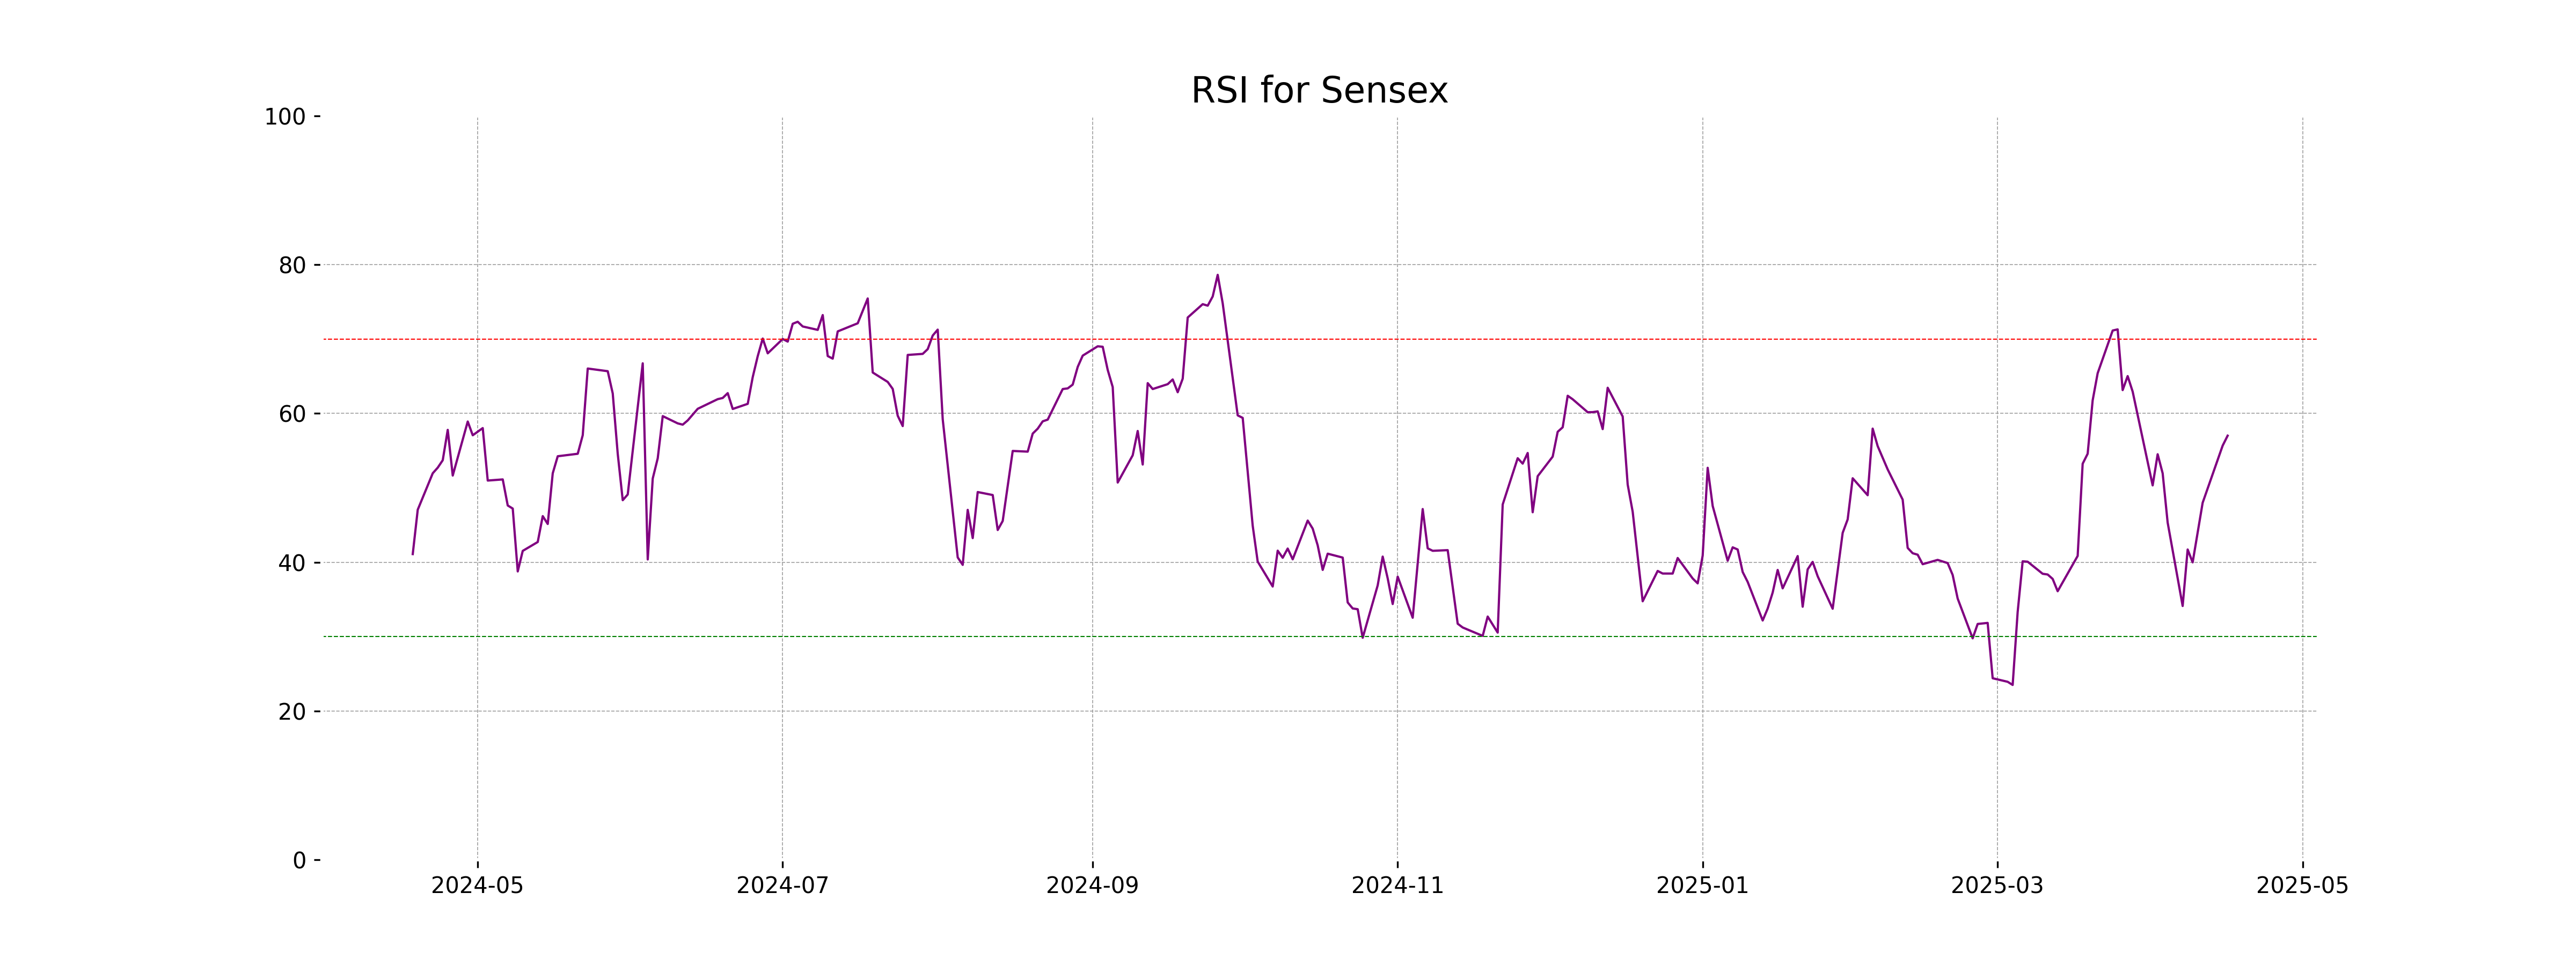
RSI Analysis
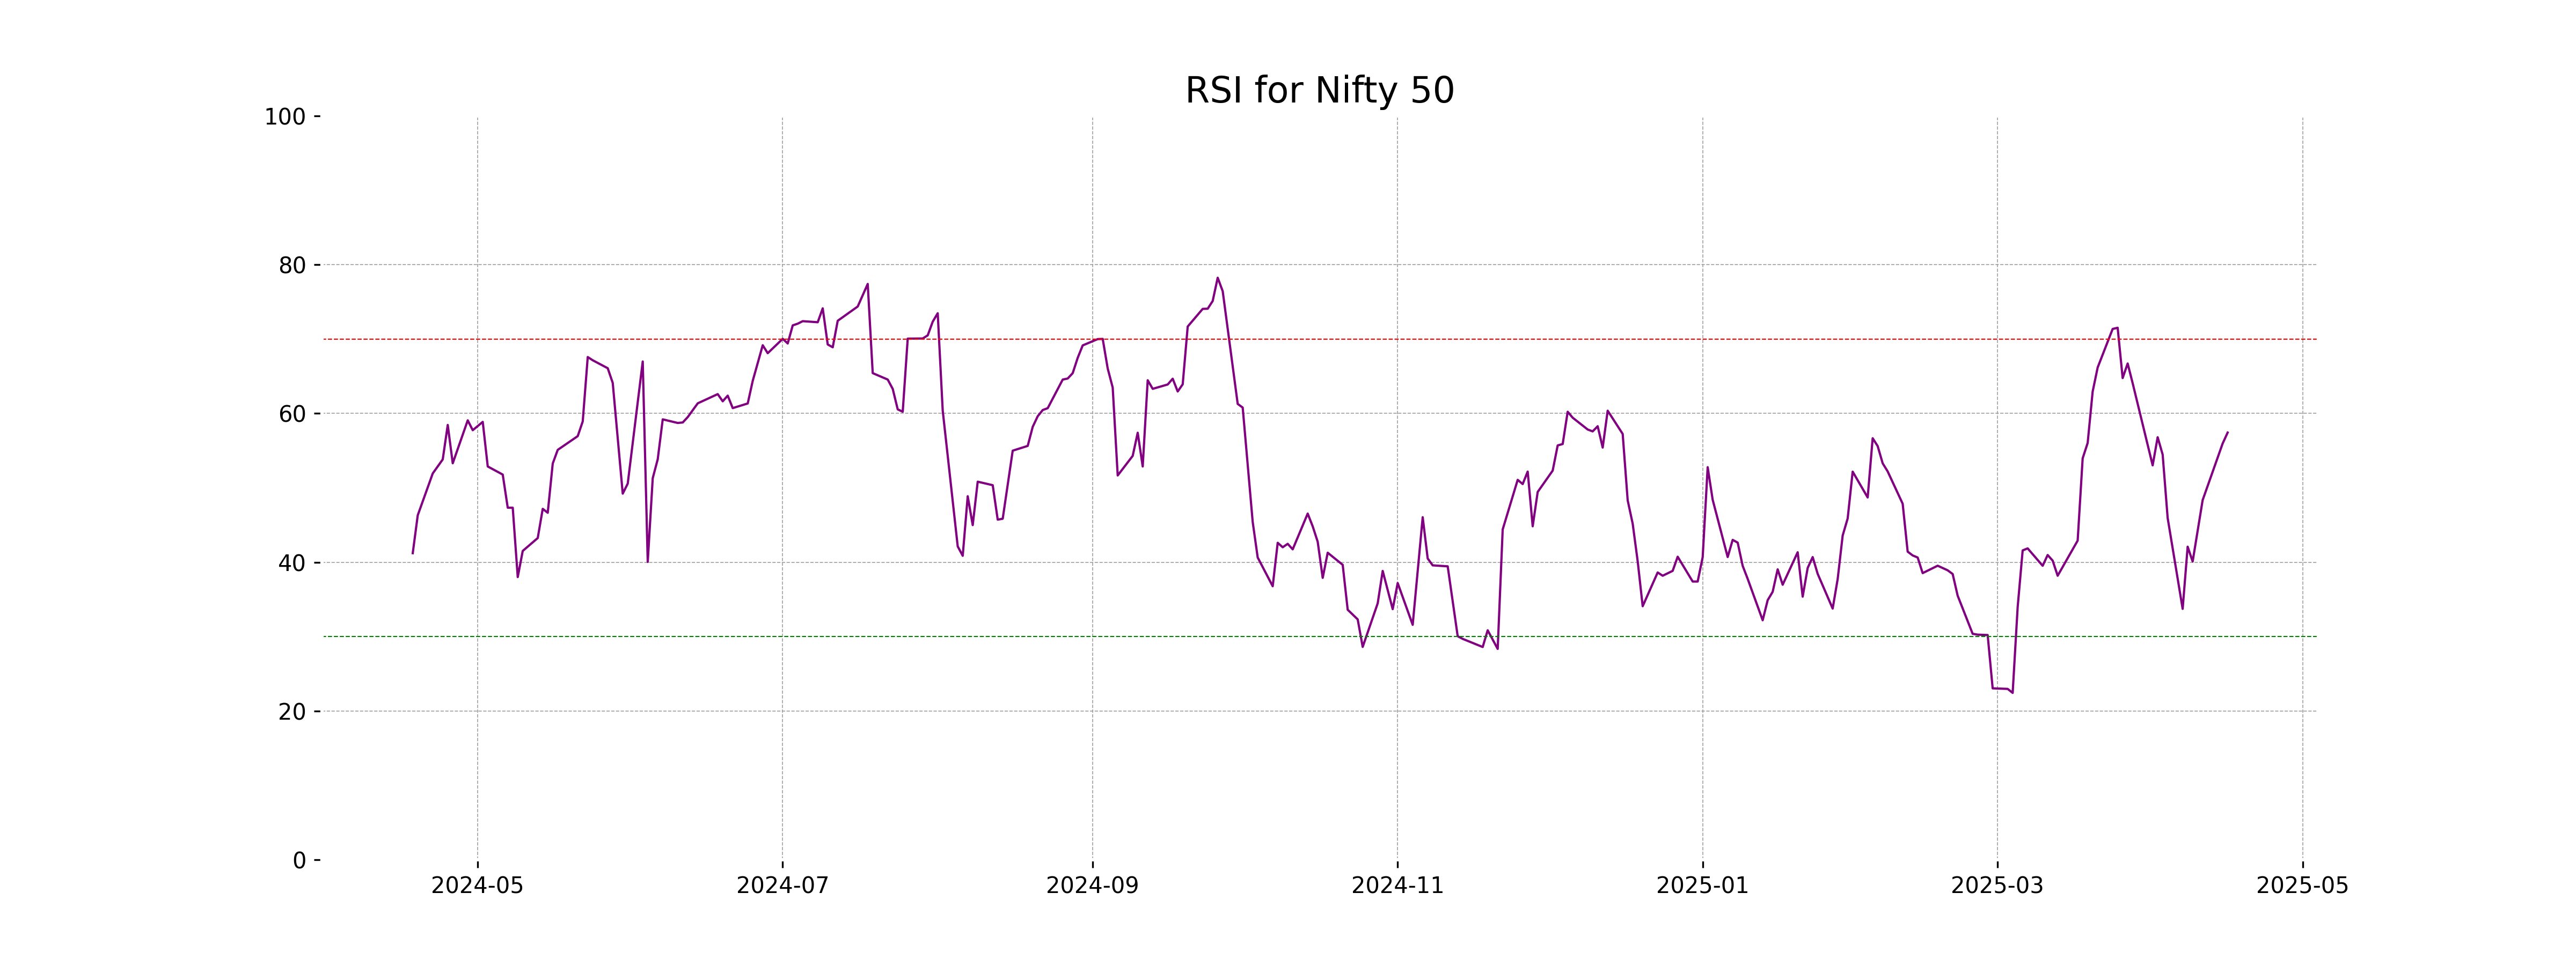
The Relative Strength Index (RSI) for Sensex is 57.01. This indicates that the market is currently in a neutral zone, as an RSI below 30 typically suggests the market is oversold, while above 70 indicates it is overbought. Therefore, Sensex is neither overbought nor oversold at the moment.
Analysis for Nifty Auto - April 16, 2025
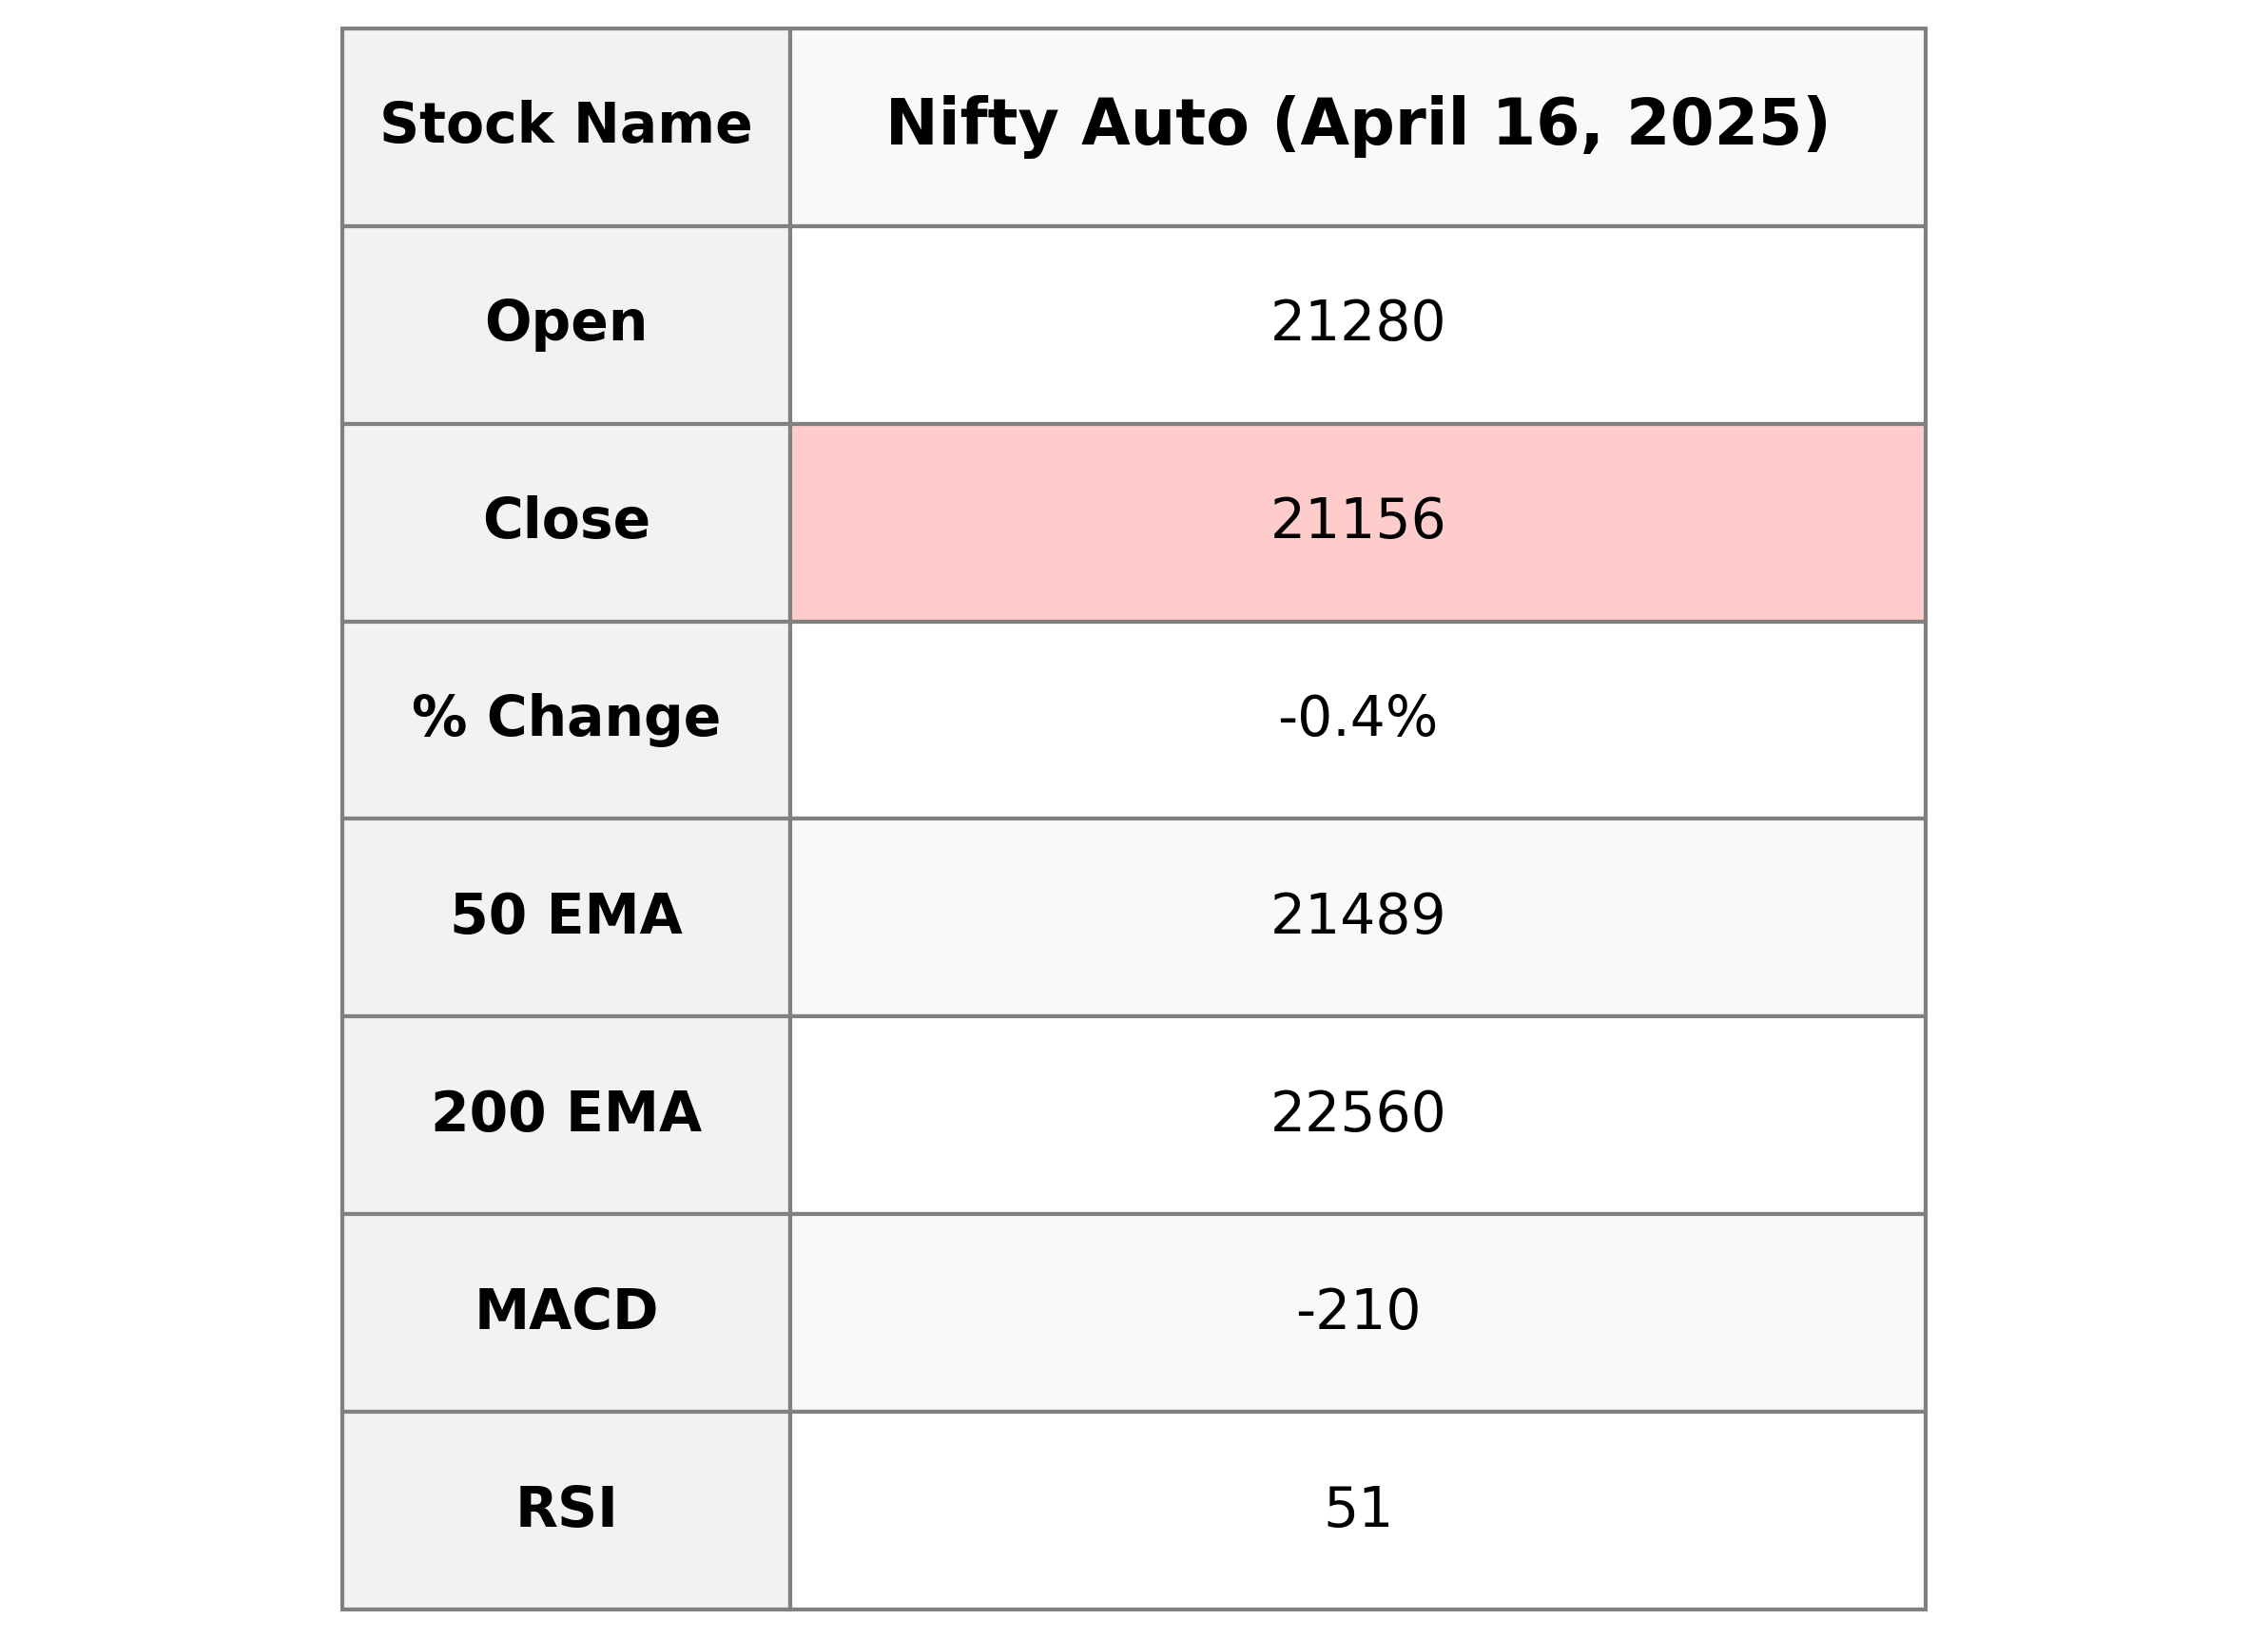
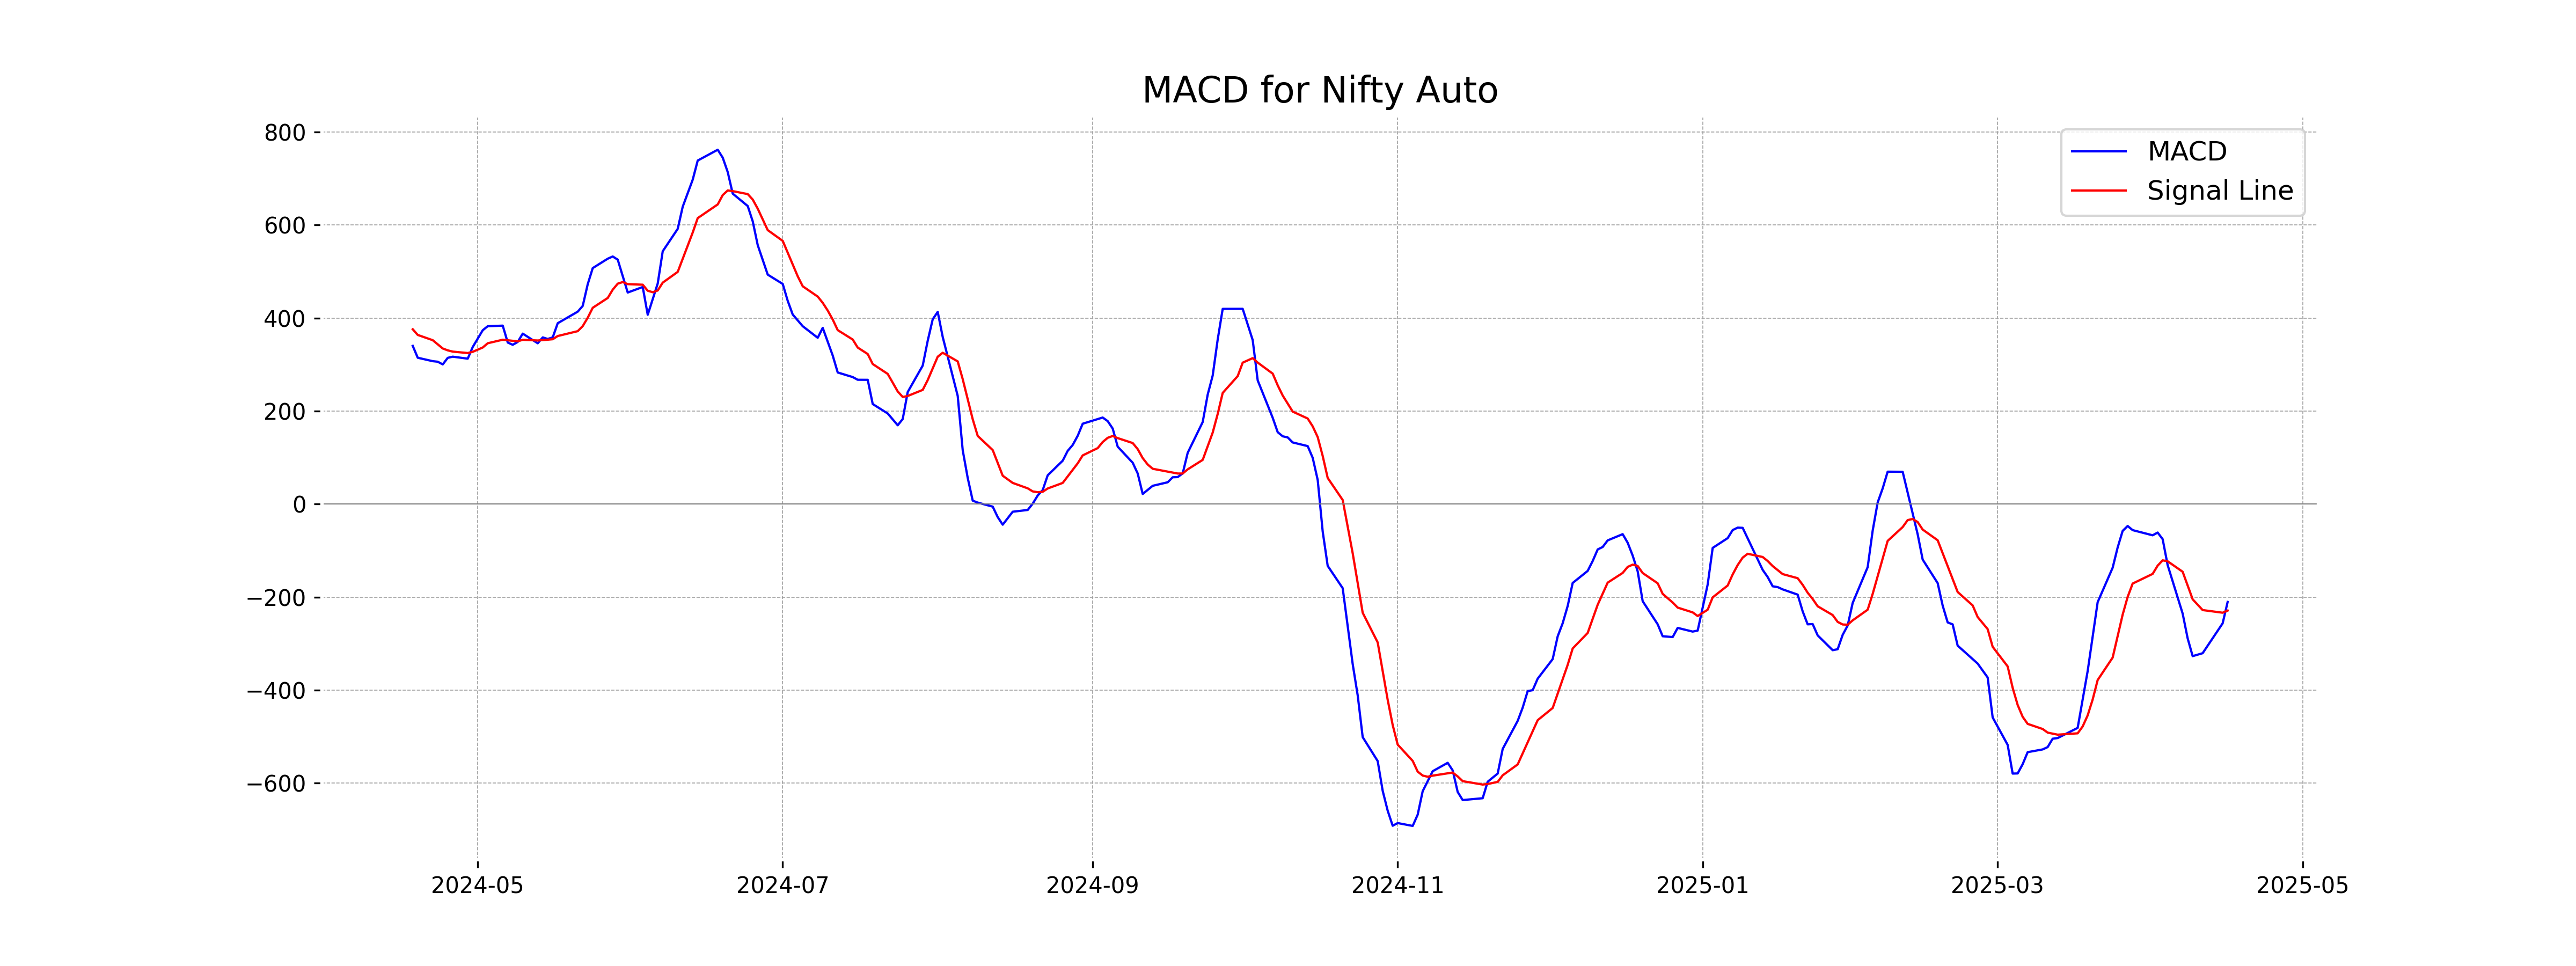
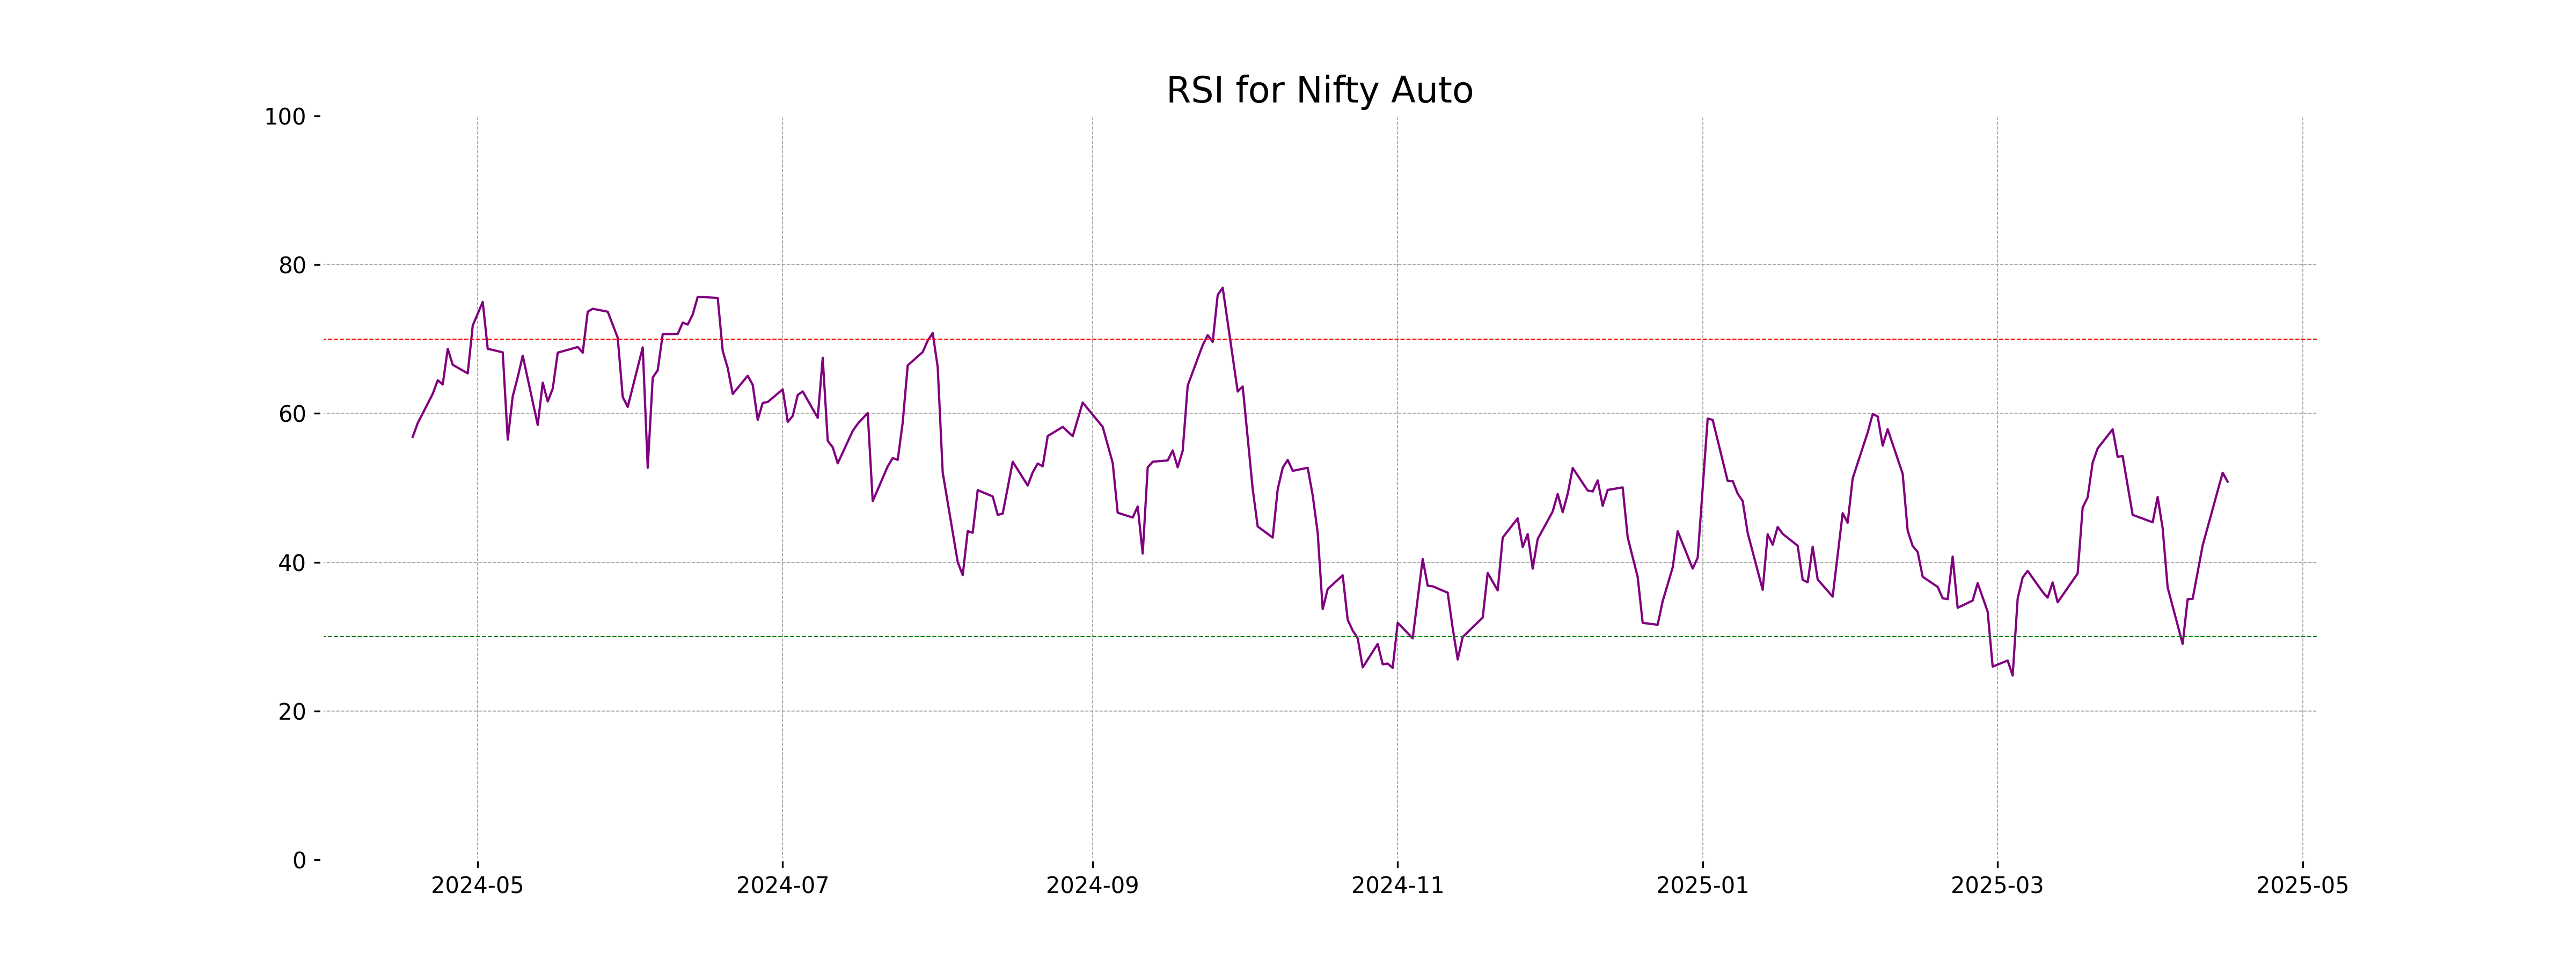
Nifty Auto opened at 21,280.35 and closed at 21,155.80, experiencing a decline of 0.43% from the previous close of 21,246.20. The index showed a reduction of 90.40 points, with trading ranging between a low of 21,058.60 and a high of 21,283.10. The technical indicators reveal MACD is at -210.42, signaling a bearish momentum, while the RSI is at 50.83, suggesting a neutral position.
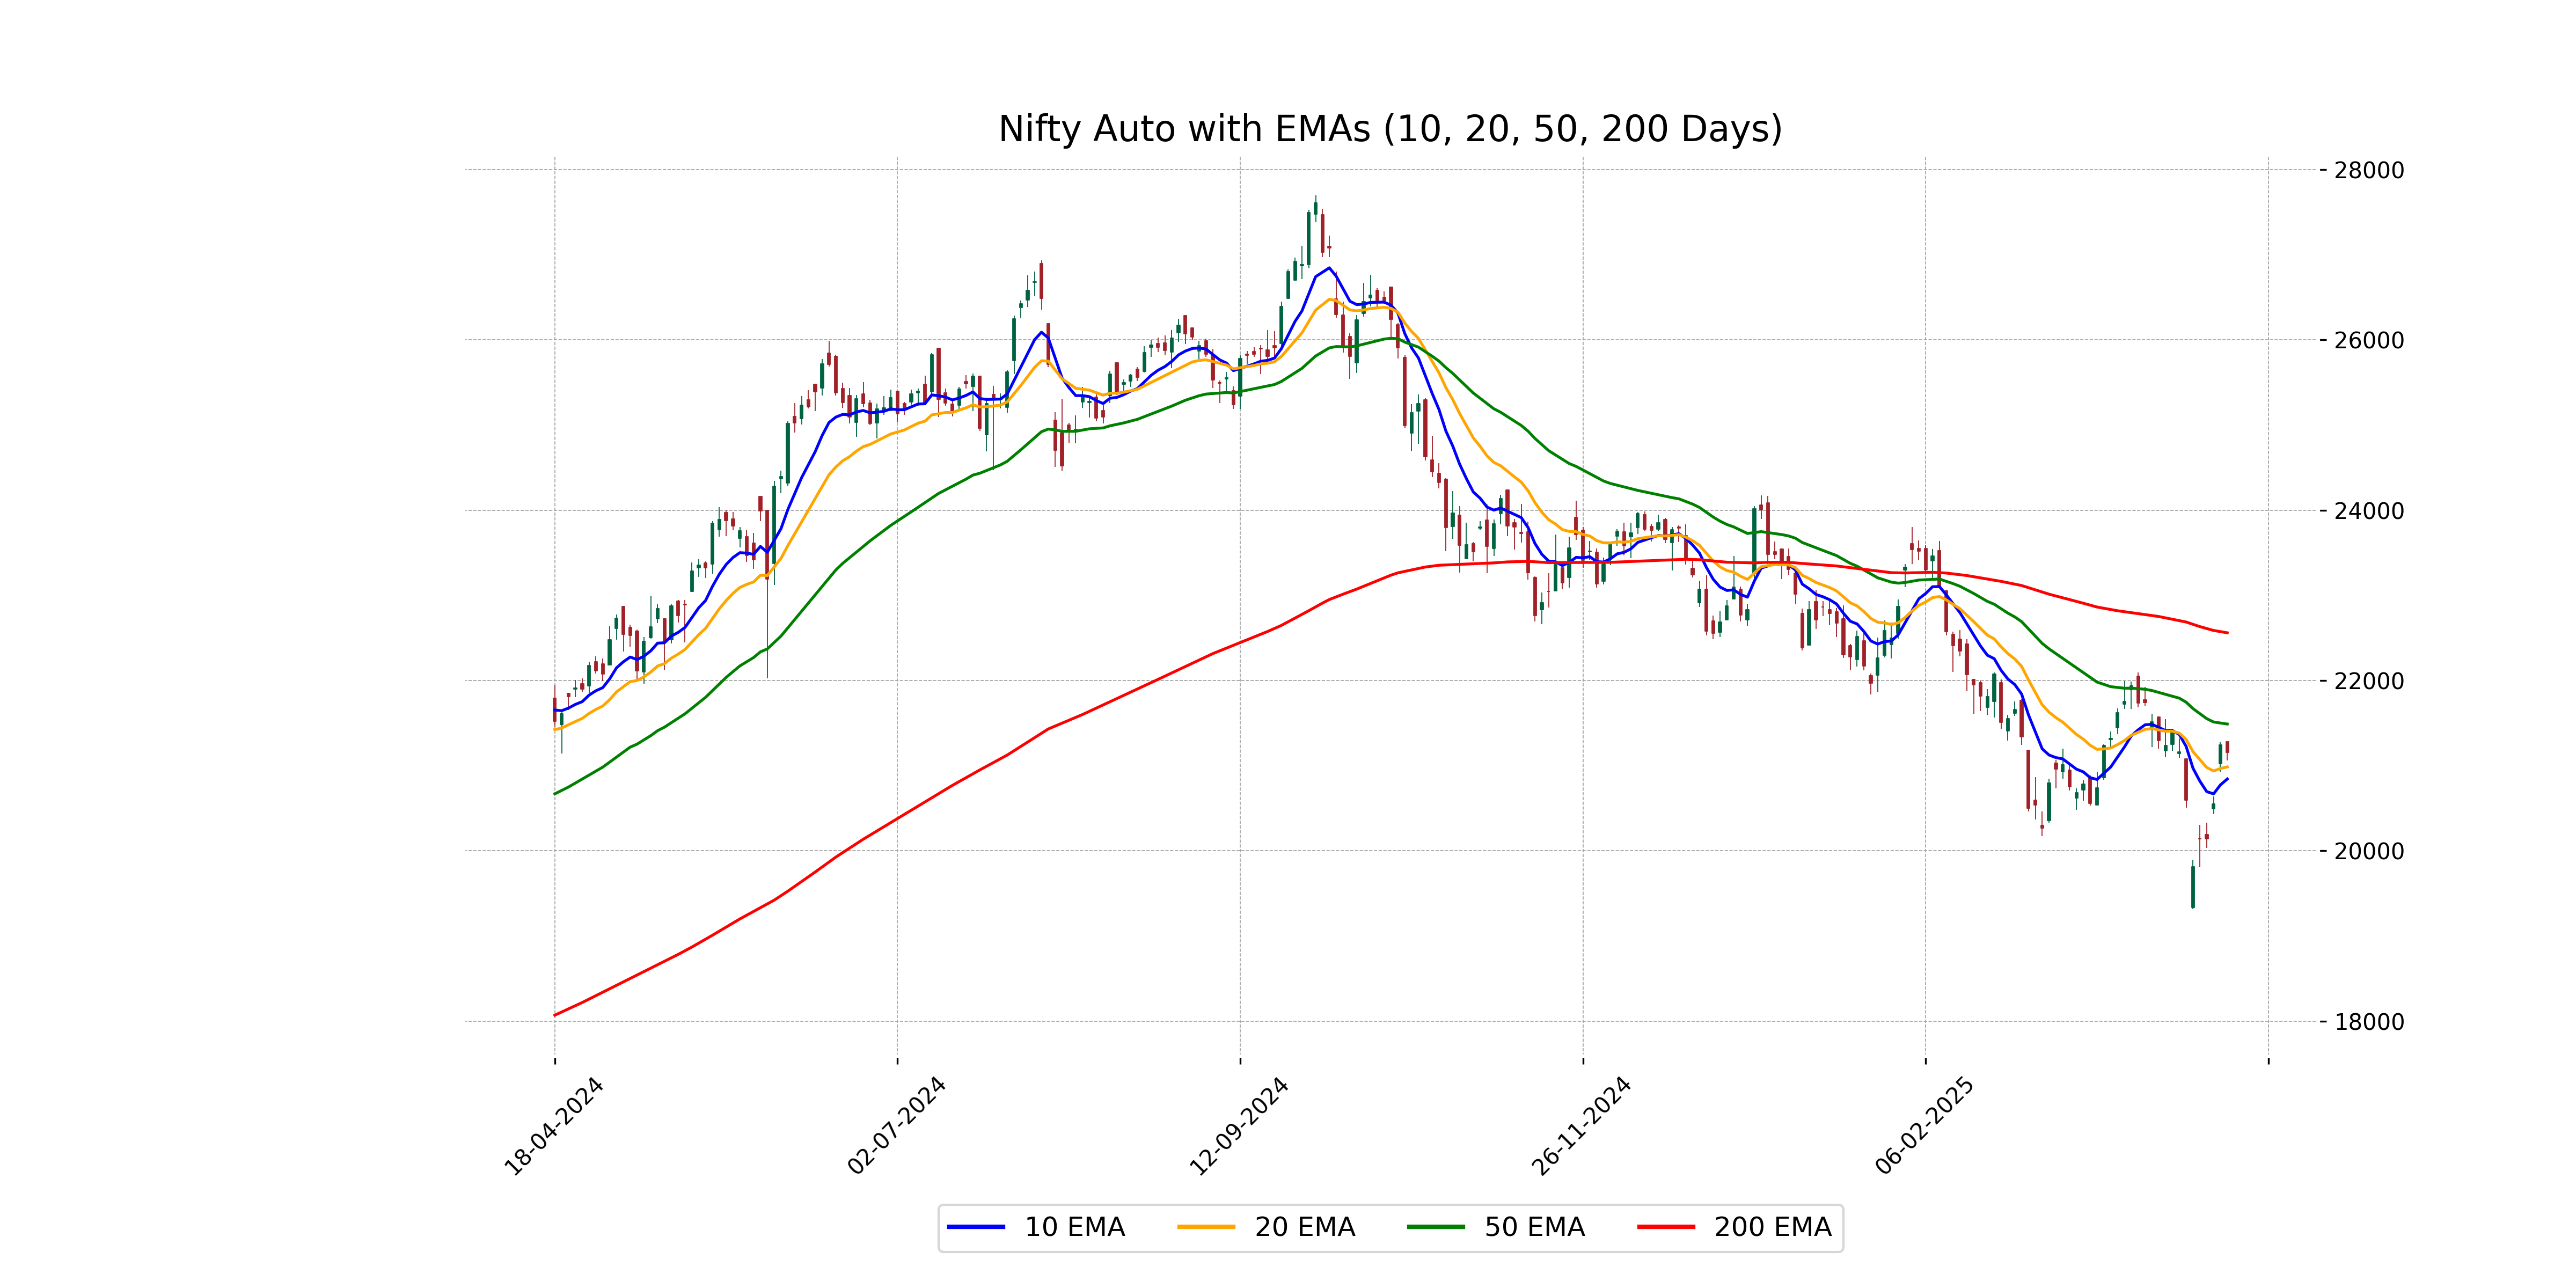
Relationship with Key Moving Averages
The closing price of Nifty Auto is below its 50-day EMA and significantly below the 200-day EMA, indicating a potential downtrend. However, it remains above the 10-day and 20-day EMAs, suggesting some short-term strength.
Moving Averages Trend (MACD)
Nifty Auto's MACD value of -210.42 is above its MACD Signal of -229.00, suggesting a potential weakening in bearish momentum. Although the MACD is negative, indicating a downtrend, the slight improvement above the signal line could hint at a possible trend reversal if the momentum continues to strengthen.
RSI Analysis
Nifty Auto RSI Analysis: The RSI (Relative Strength Index) for Nifty Auto is 50.83, which indicates a neutral position. An RSI around 50 often suggests a balance between bullish and bearish pressures, with no strong trend prevailing currently.
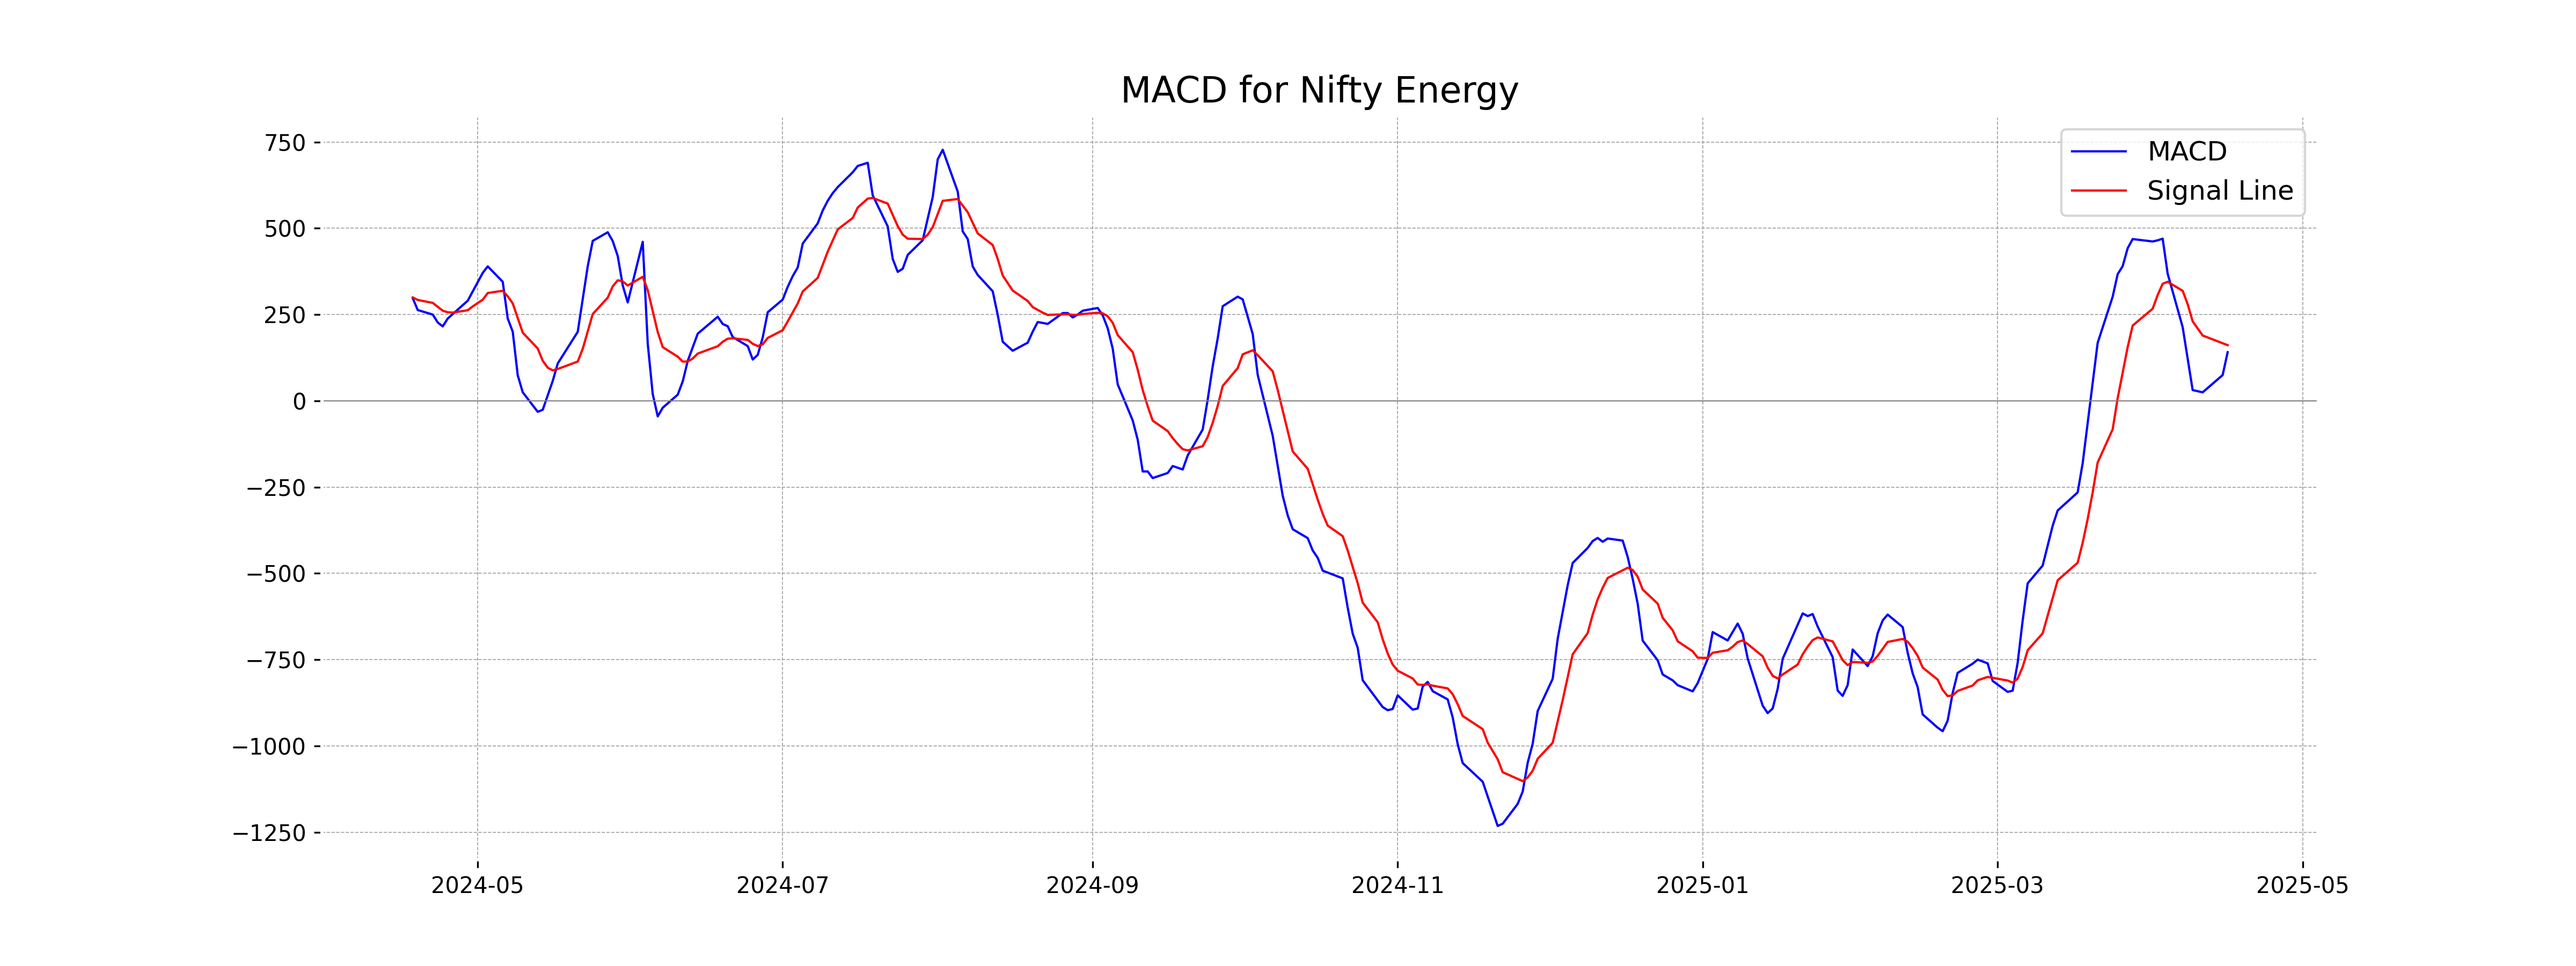
Analysis for Nifty Energy - April 16, 2025
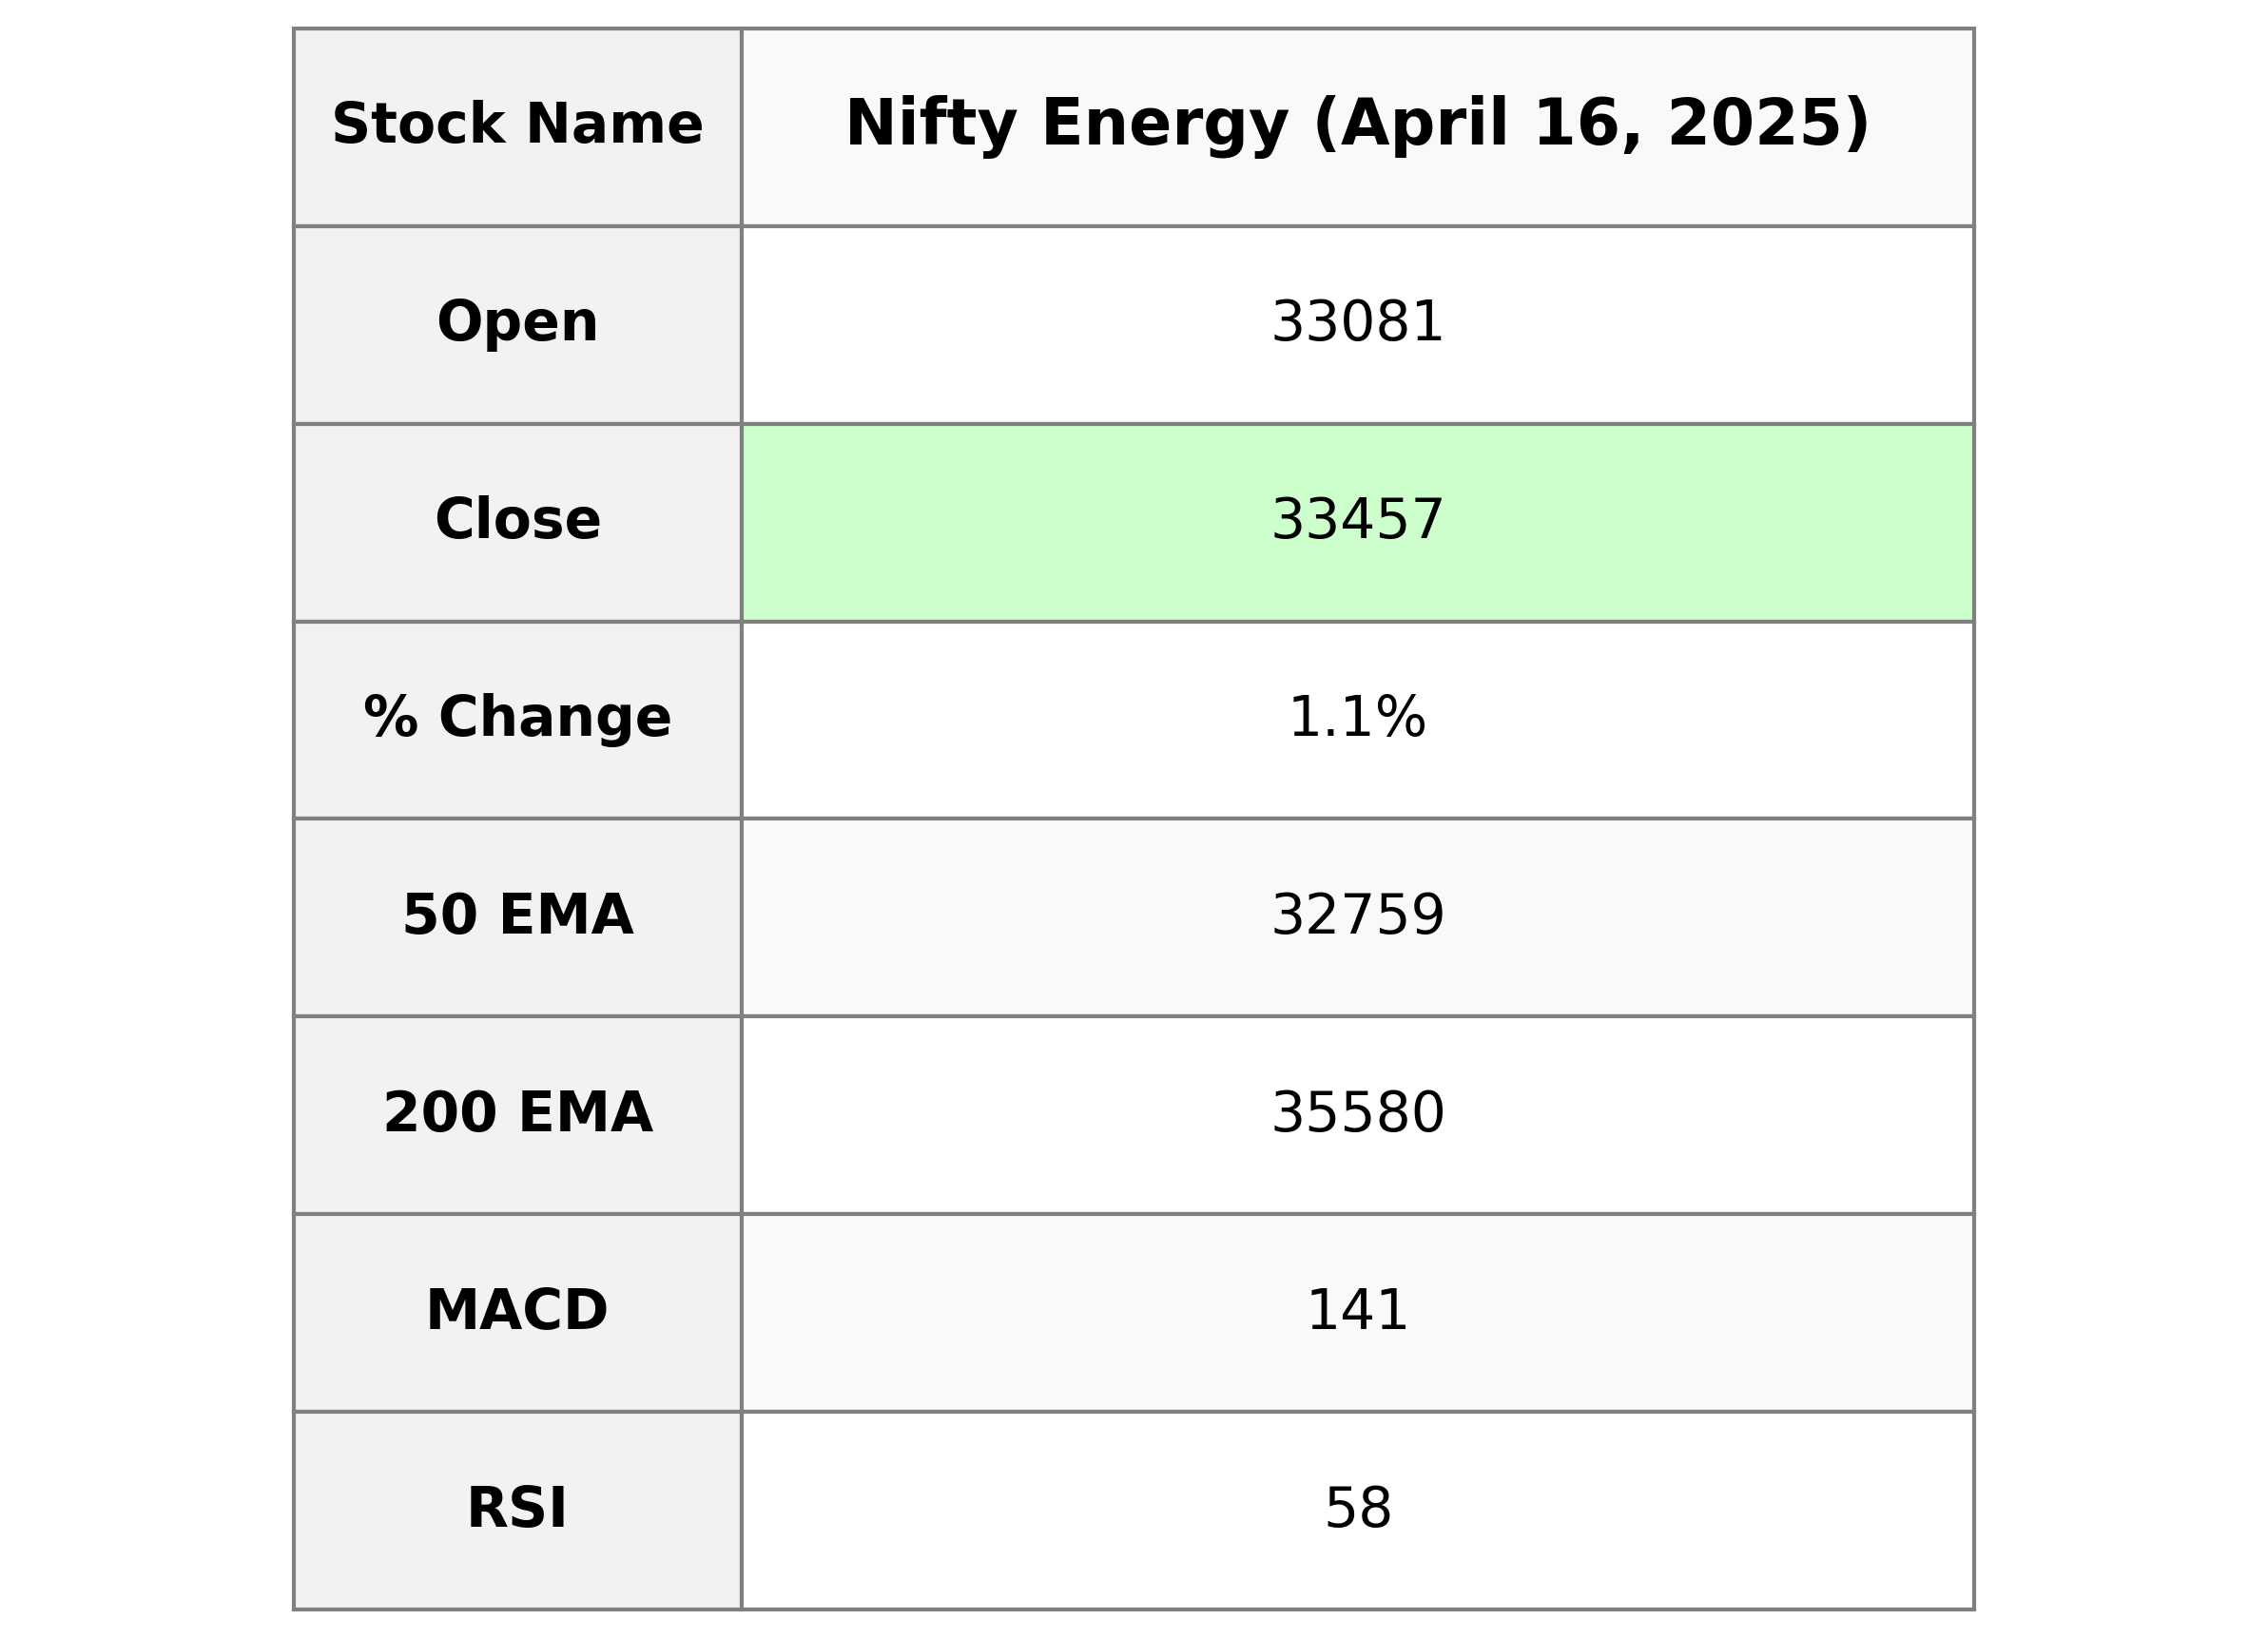
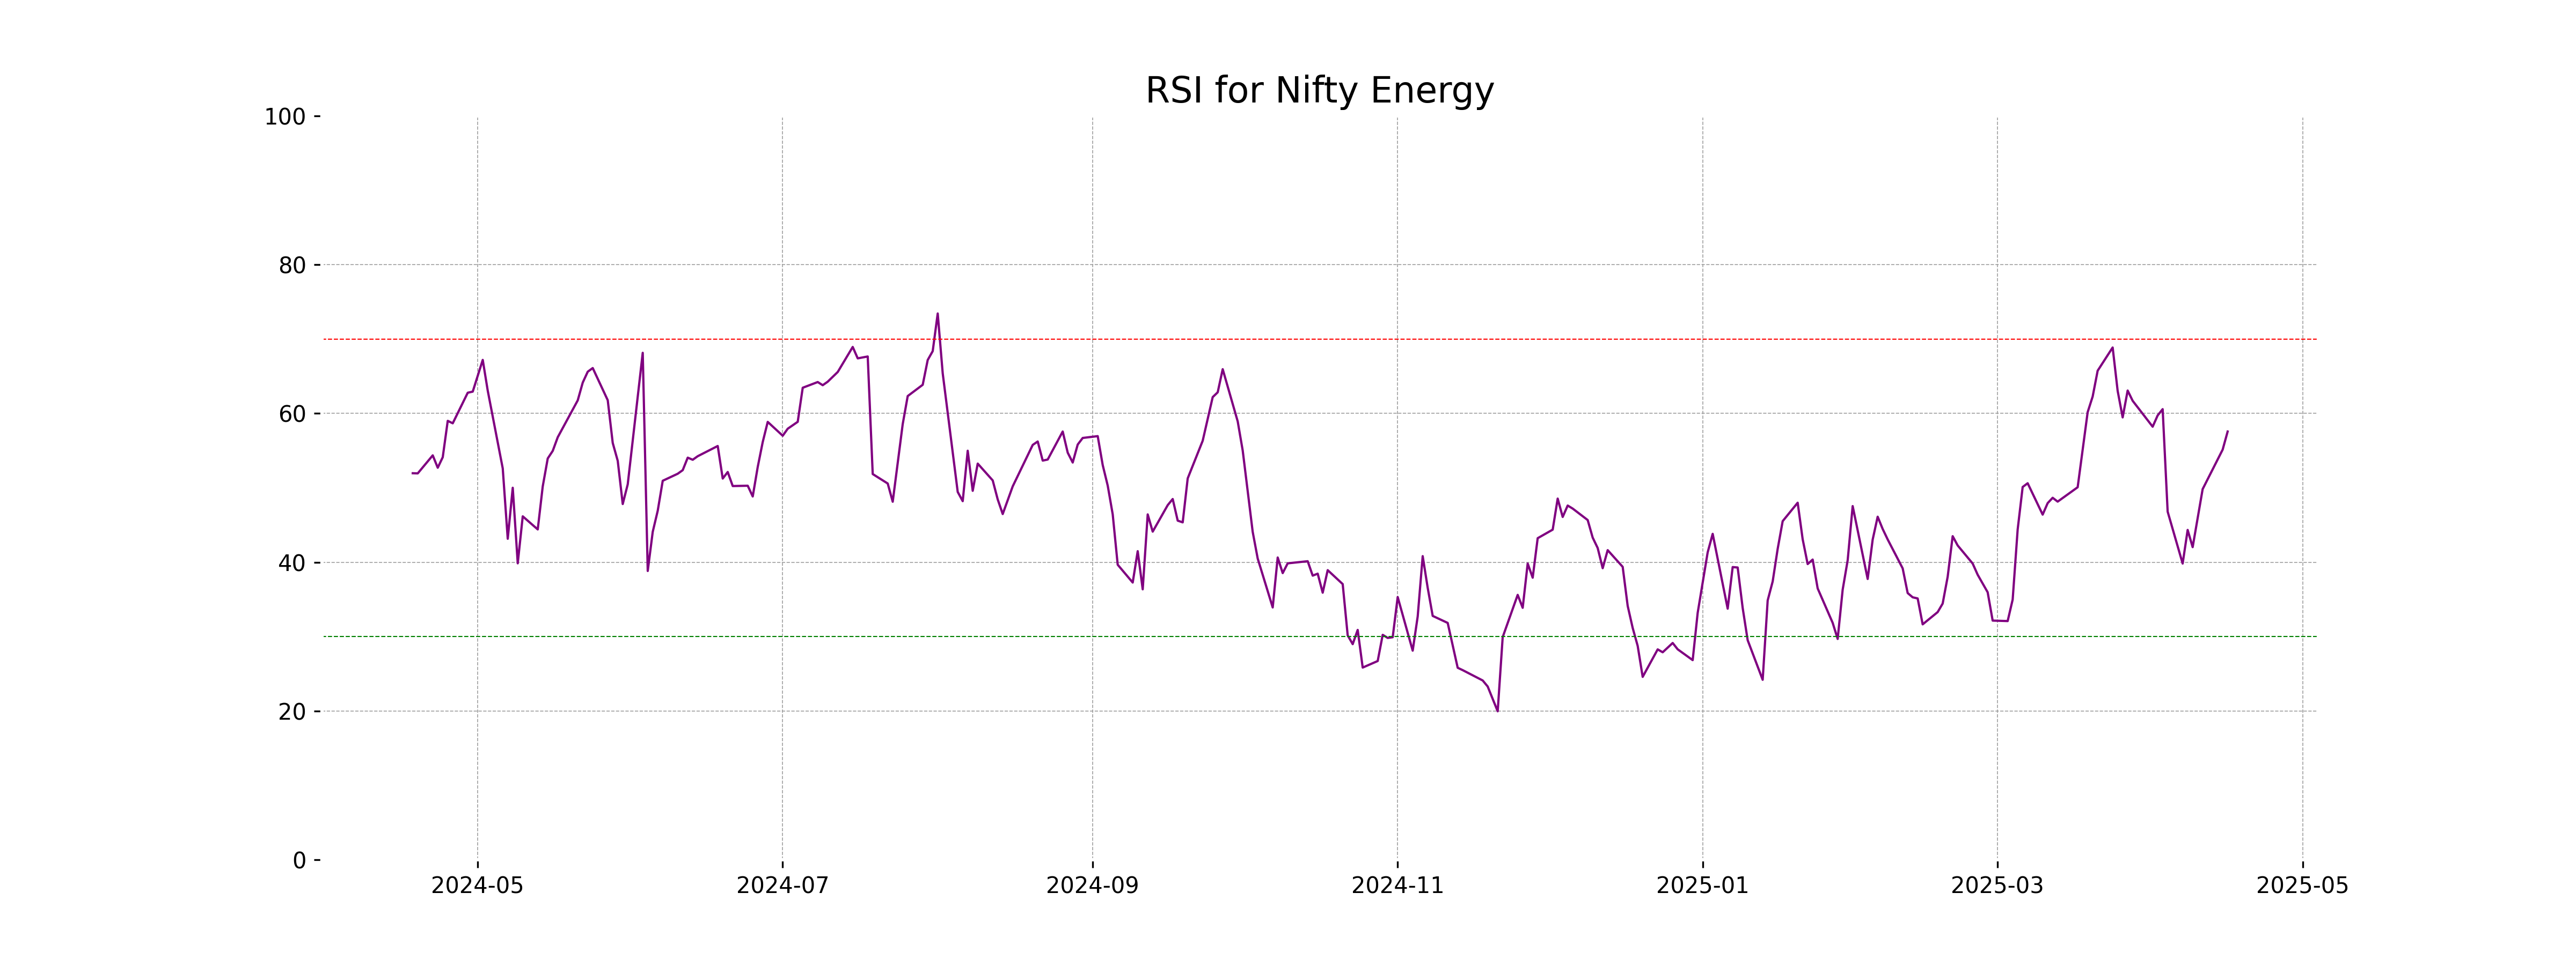
Nifty Energy opened at 33081.05 and closed at 33456.90, showing a positive change of 1.06% with a 350.35 point increase. The relative strength index (RSI) is 57.57, suggesting moderate strength, while the MACD is slightly below the signal line, indicating potential consolidation.
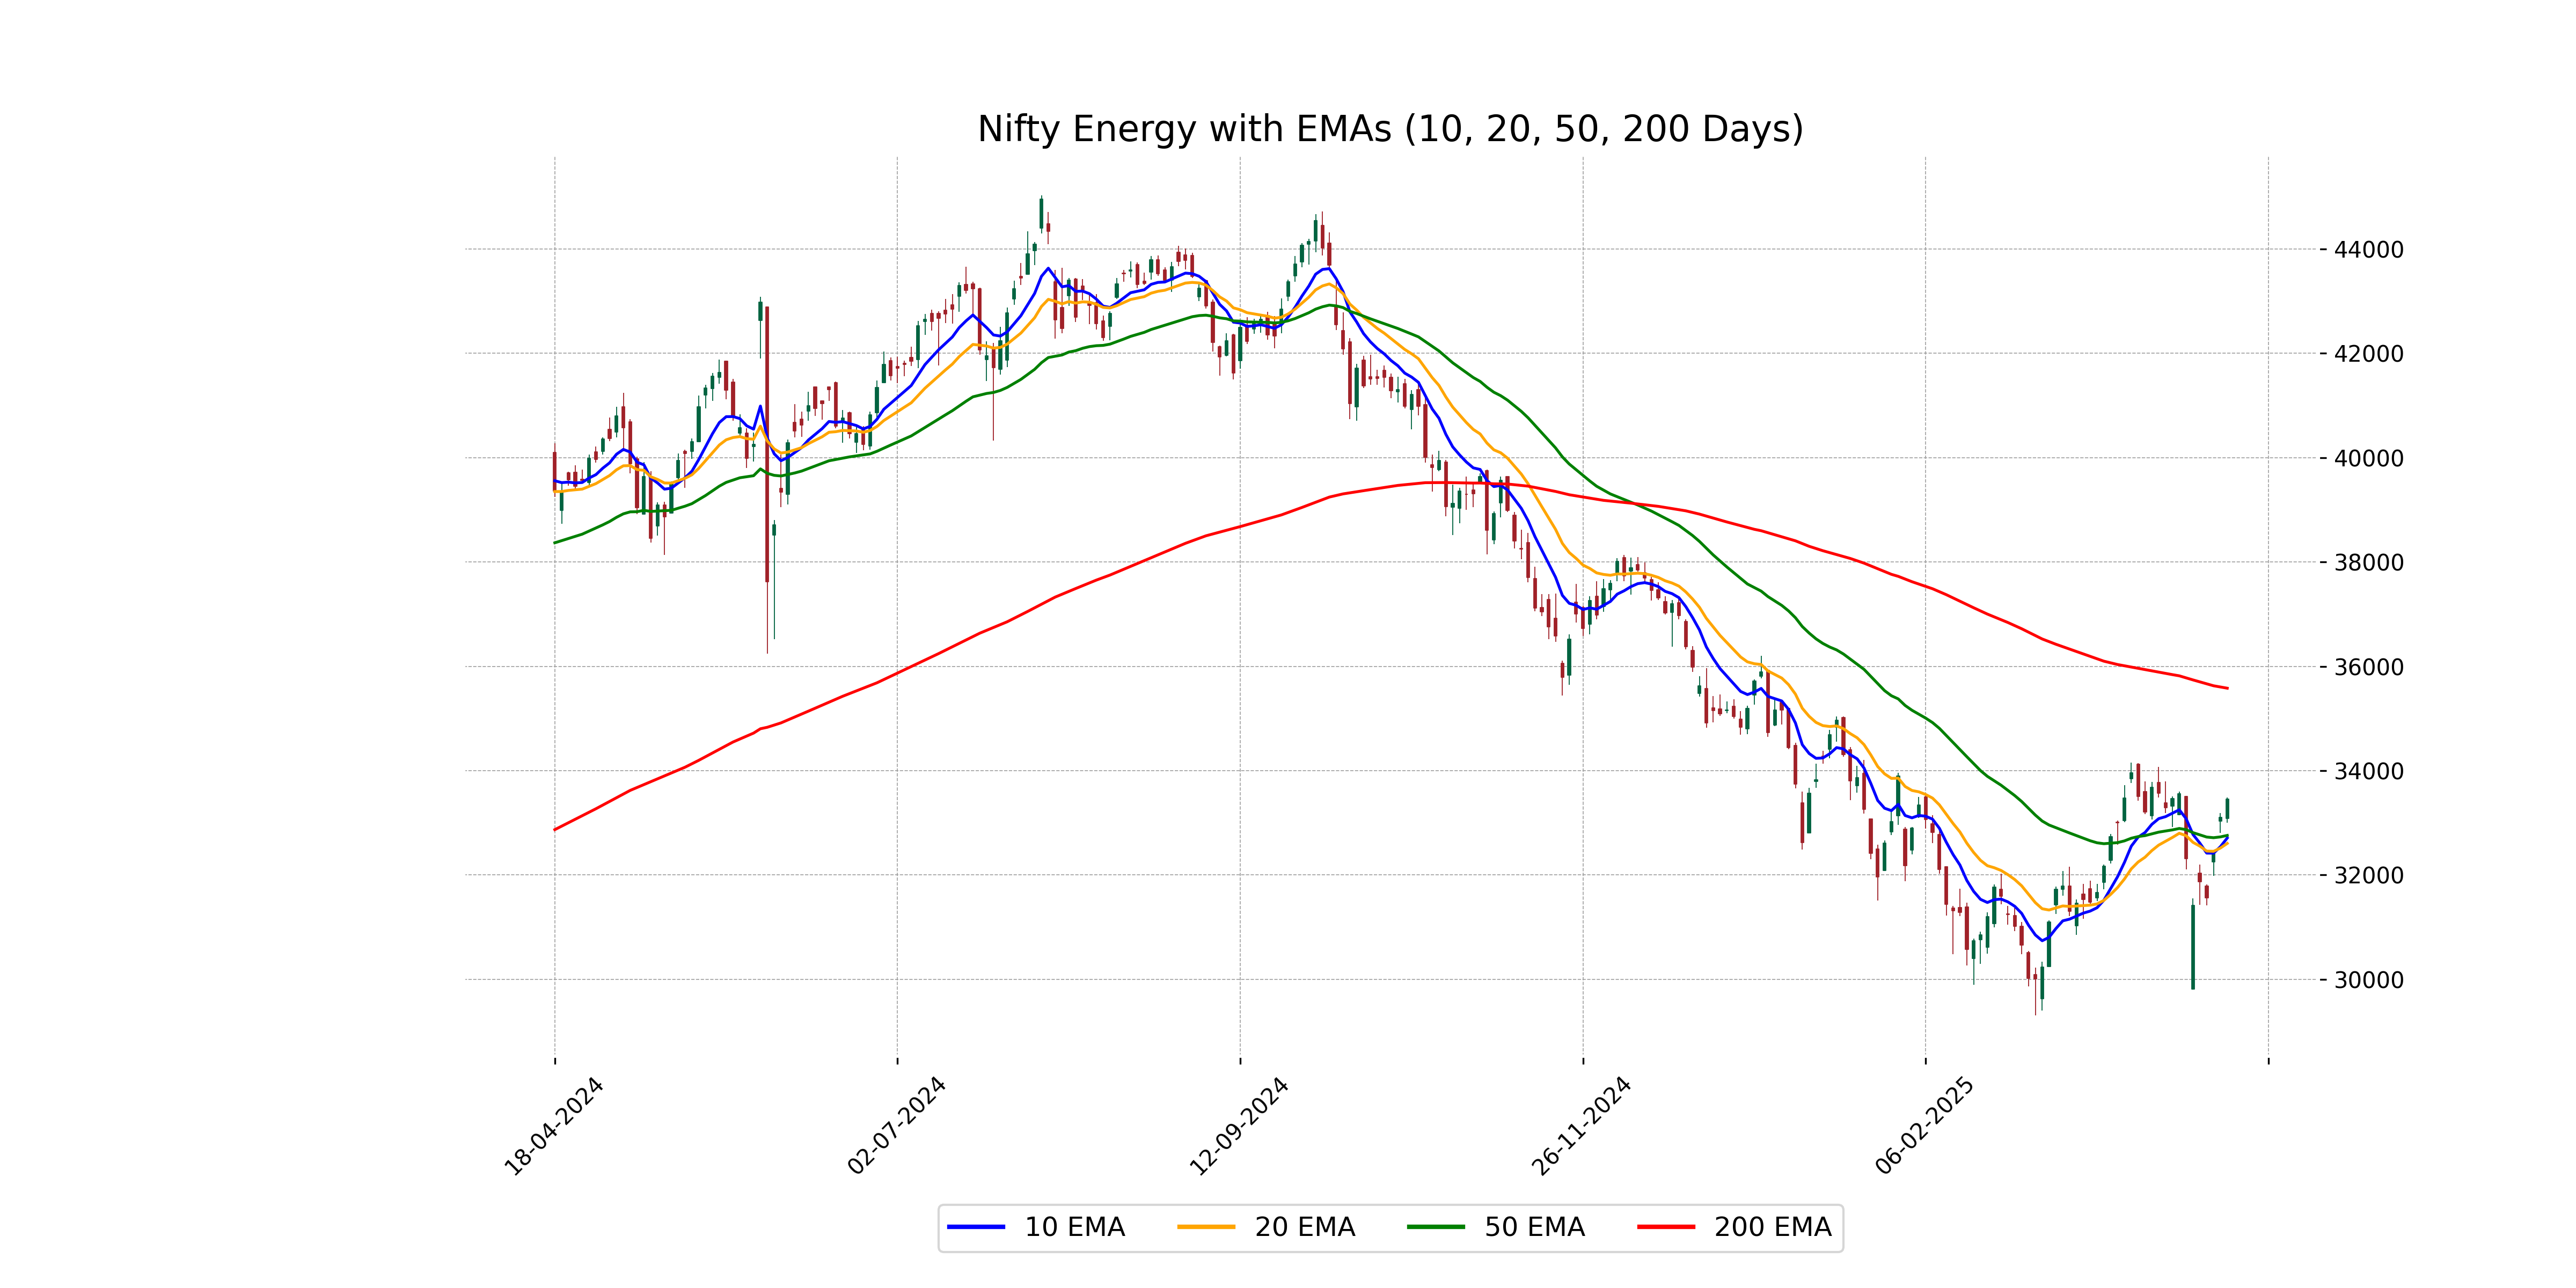
Relationship with Key Moving Averages
The Nifty Energy index closed above its 50 EMA (32,758.55) and 10 EMA (32,709.37), indicating short-term bullish momentum. However, it remains below its 200 EMA (35,580.05), suggesting potential longer-term resistance.
Moving Averages Trend (MACD)
The MACD for Nifty Energy is currently 140.98, which is below the MACD Signal of 161.30. This suggests a bearish sentiment as the MACD line is below the signal line, indicating potential weakness in momentum.
RSI Analysis
Based on the RSI value of 57.57, Nifty Energy is currently exhibiting a neutral to moderately bullish signal, suggesting that the index is neither in overbought nor oversold territory. This implies that the price action might continue in the current trend unless significant buying or selling pressure emerges.
Analysis for Nifty FMCG - April 16, 2025
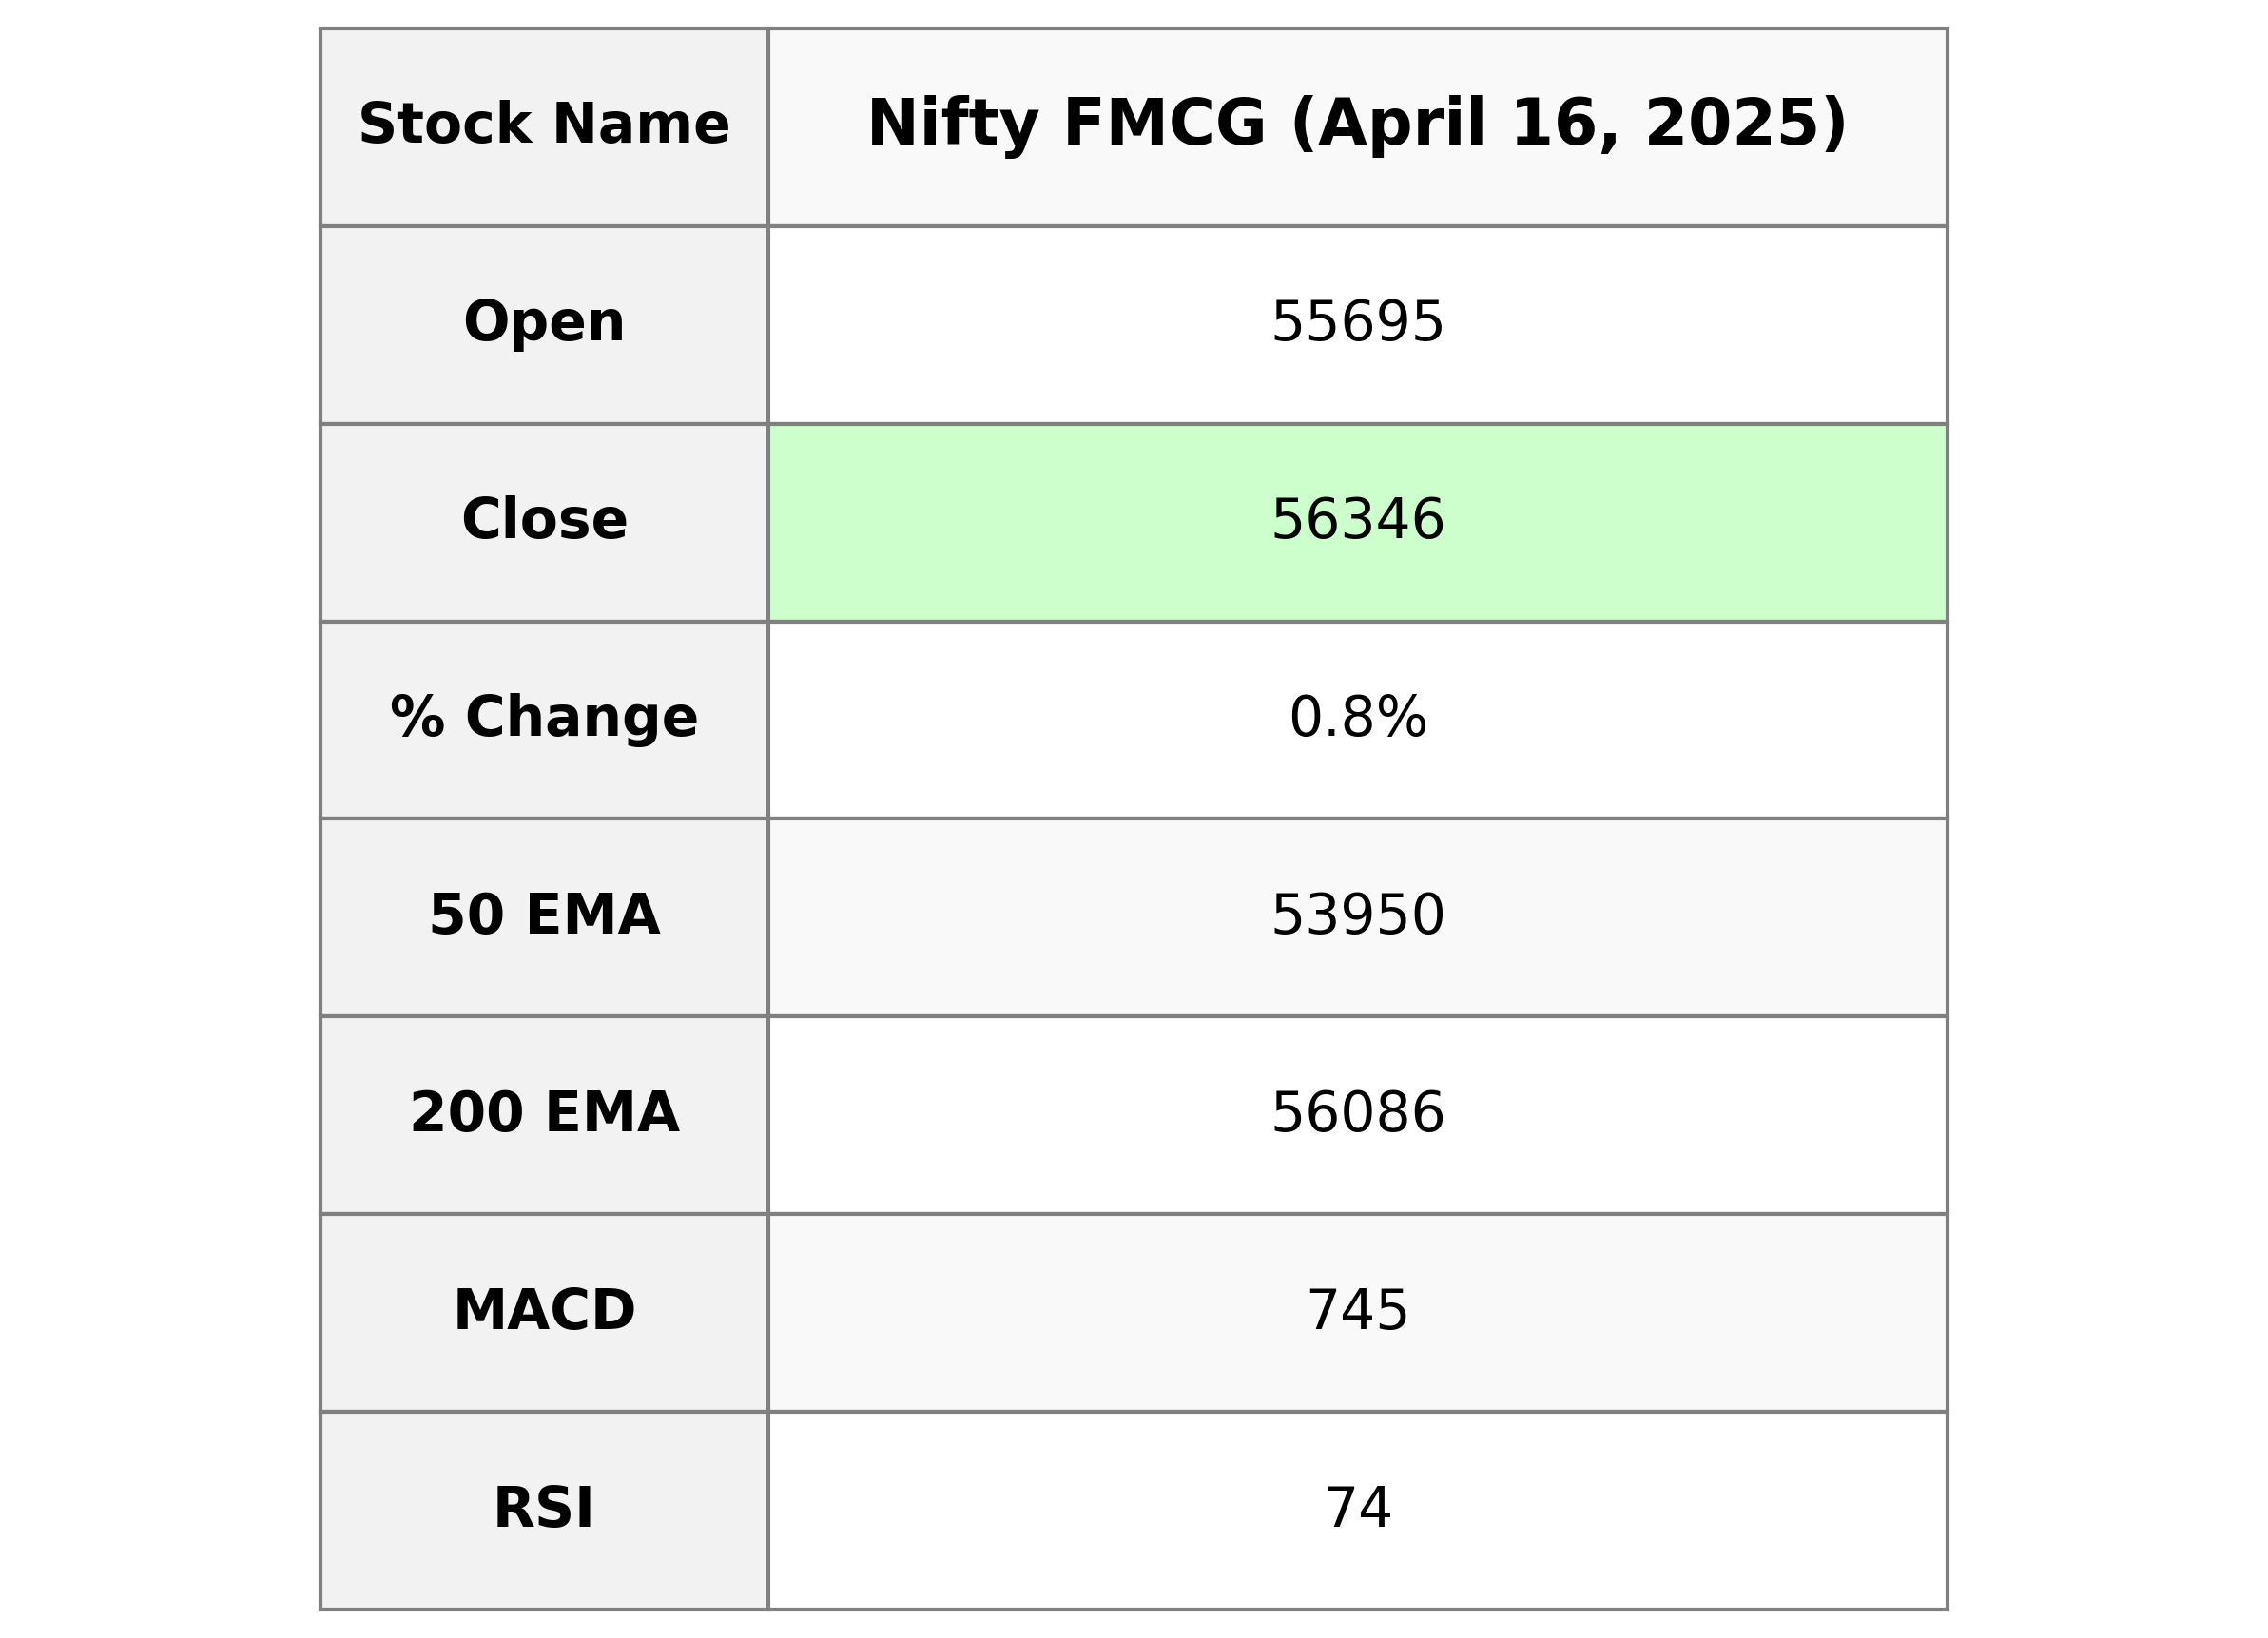
Nifty FMCG opened at 55,694.65 and closed at 56,345.60, marking a percentage change of 0.80% with a point increase of 448.65 from the previous close. The index experienced a high of 56,435.95 during the session. Technical indicators show a strong momentum with RSI at 73.96, indicating overbought conditions, and a MACD of 744.66, suggesting upward momentum.
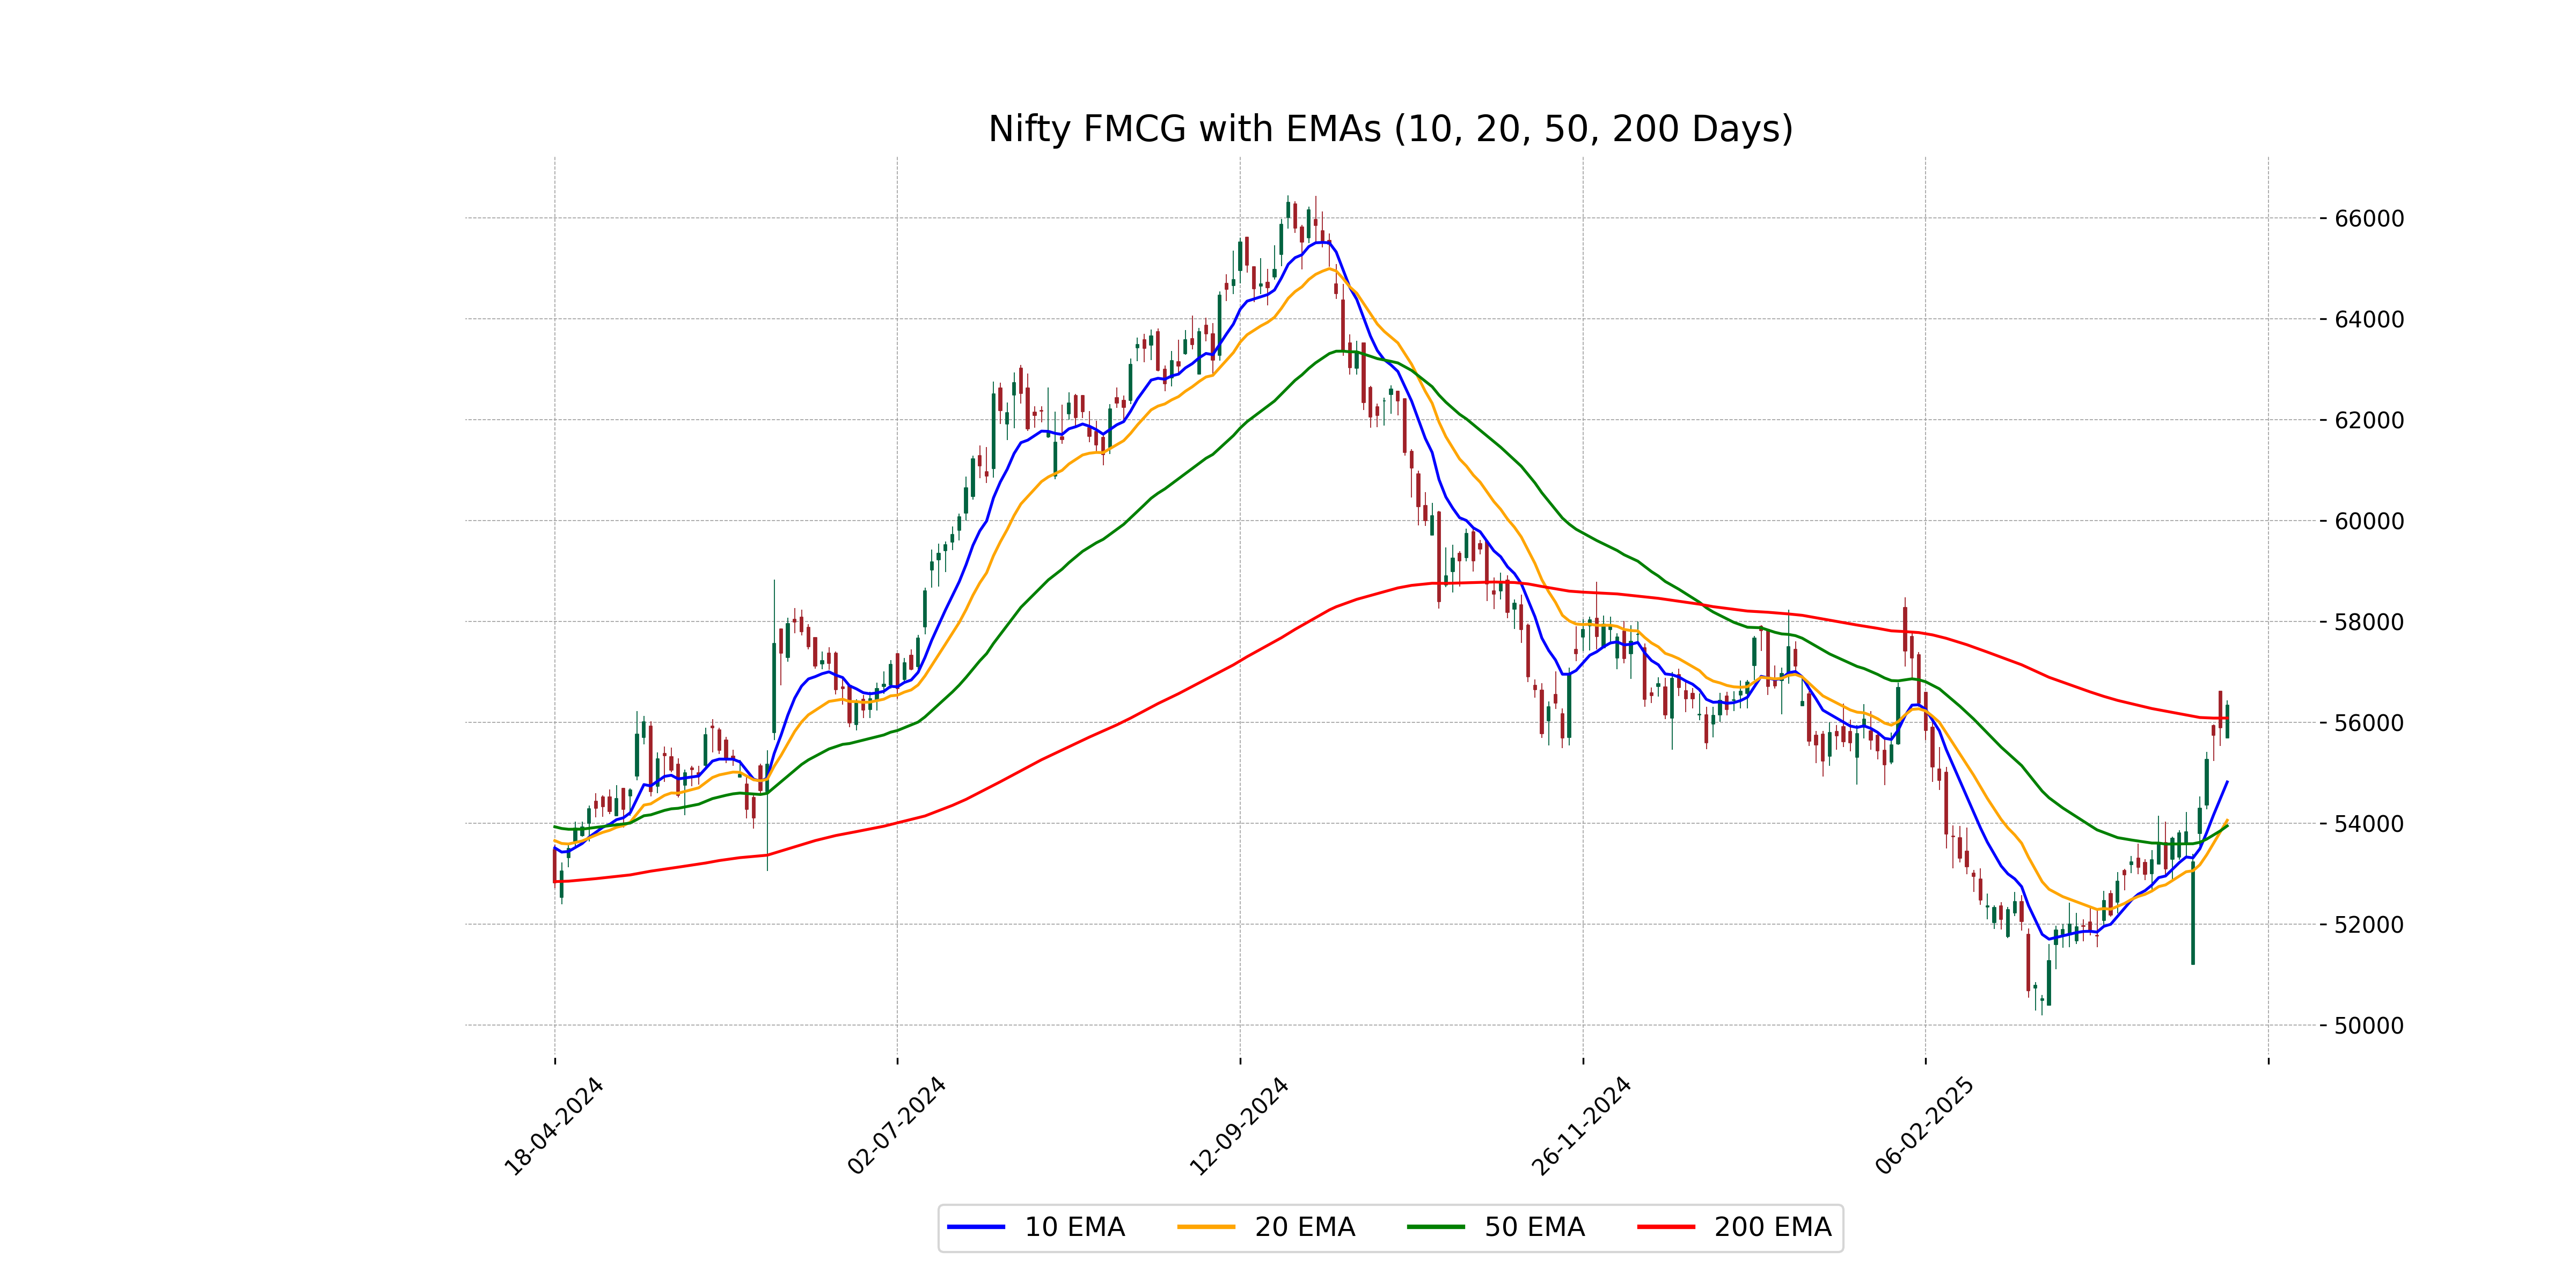
Relationship with Key Moving Averages
Nifty FMCG closed at 56345.60, which is above its 50 EMA of 53950.10 and 10 EMA of 54820.36, indicating a positive trend. It is slightly above the 200 EMA of 56086.15, suggesting bullish momentum in comparison to longer-term averages.
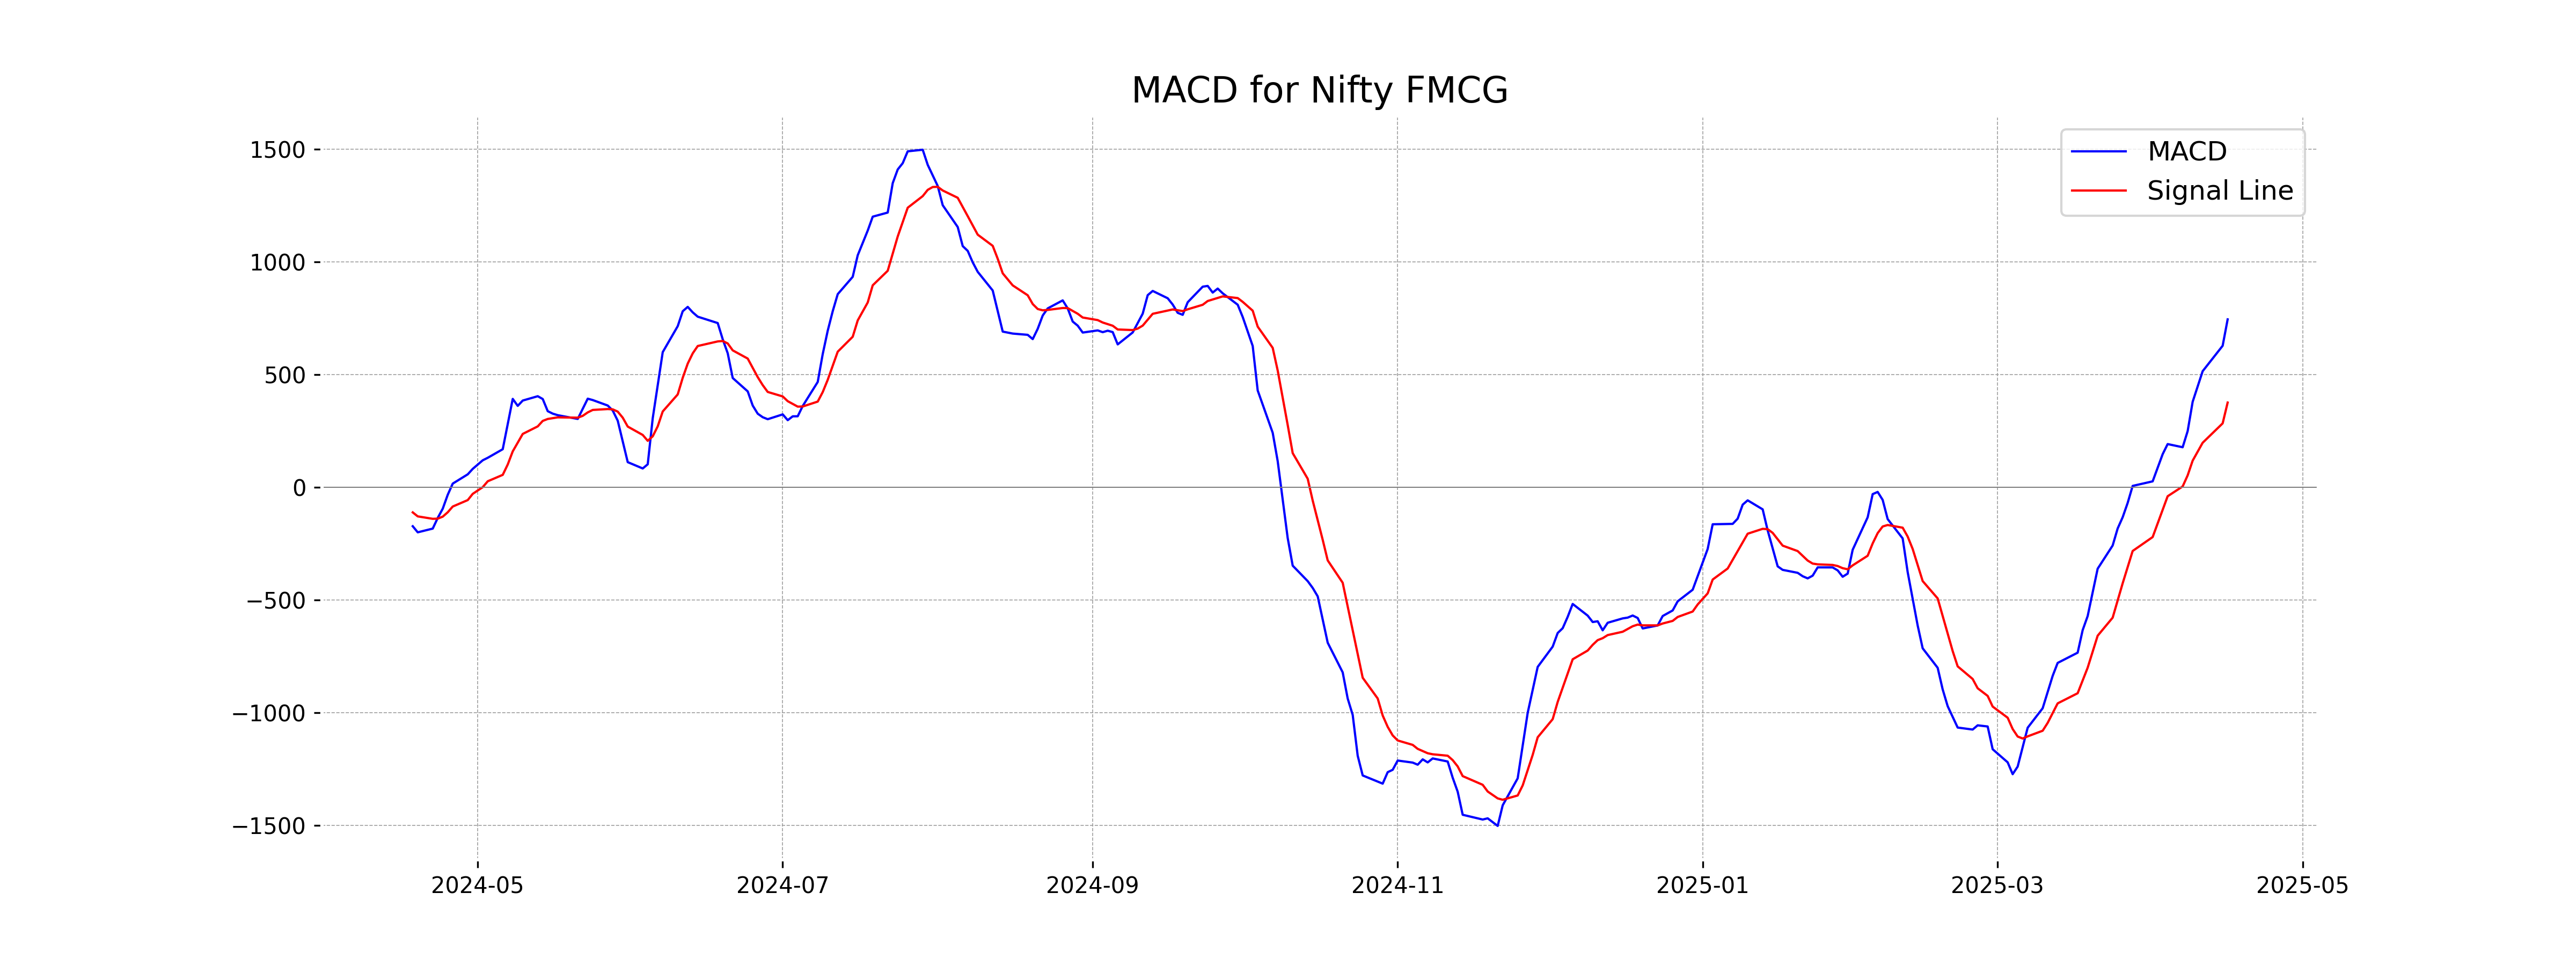
Moving Averages Trend (MACD)
Based on the provided data, the MACD for Nifty FMCG is 744.66, significantly higher than the MACD Signal at 375.79. This indicates strong bullish momentum as the MACD line is well above the signal line, suggesting potential for further upward movement.
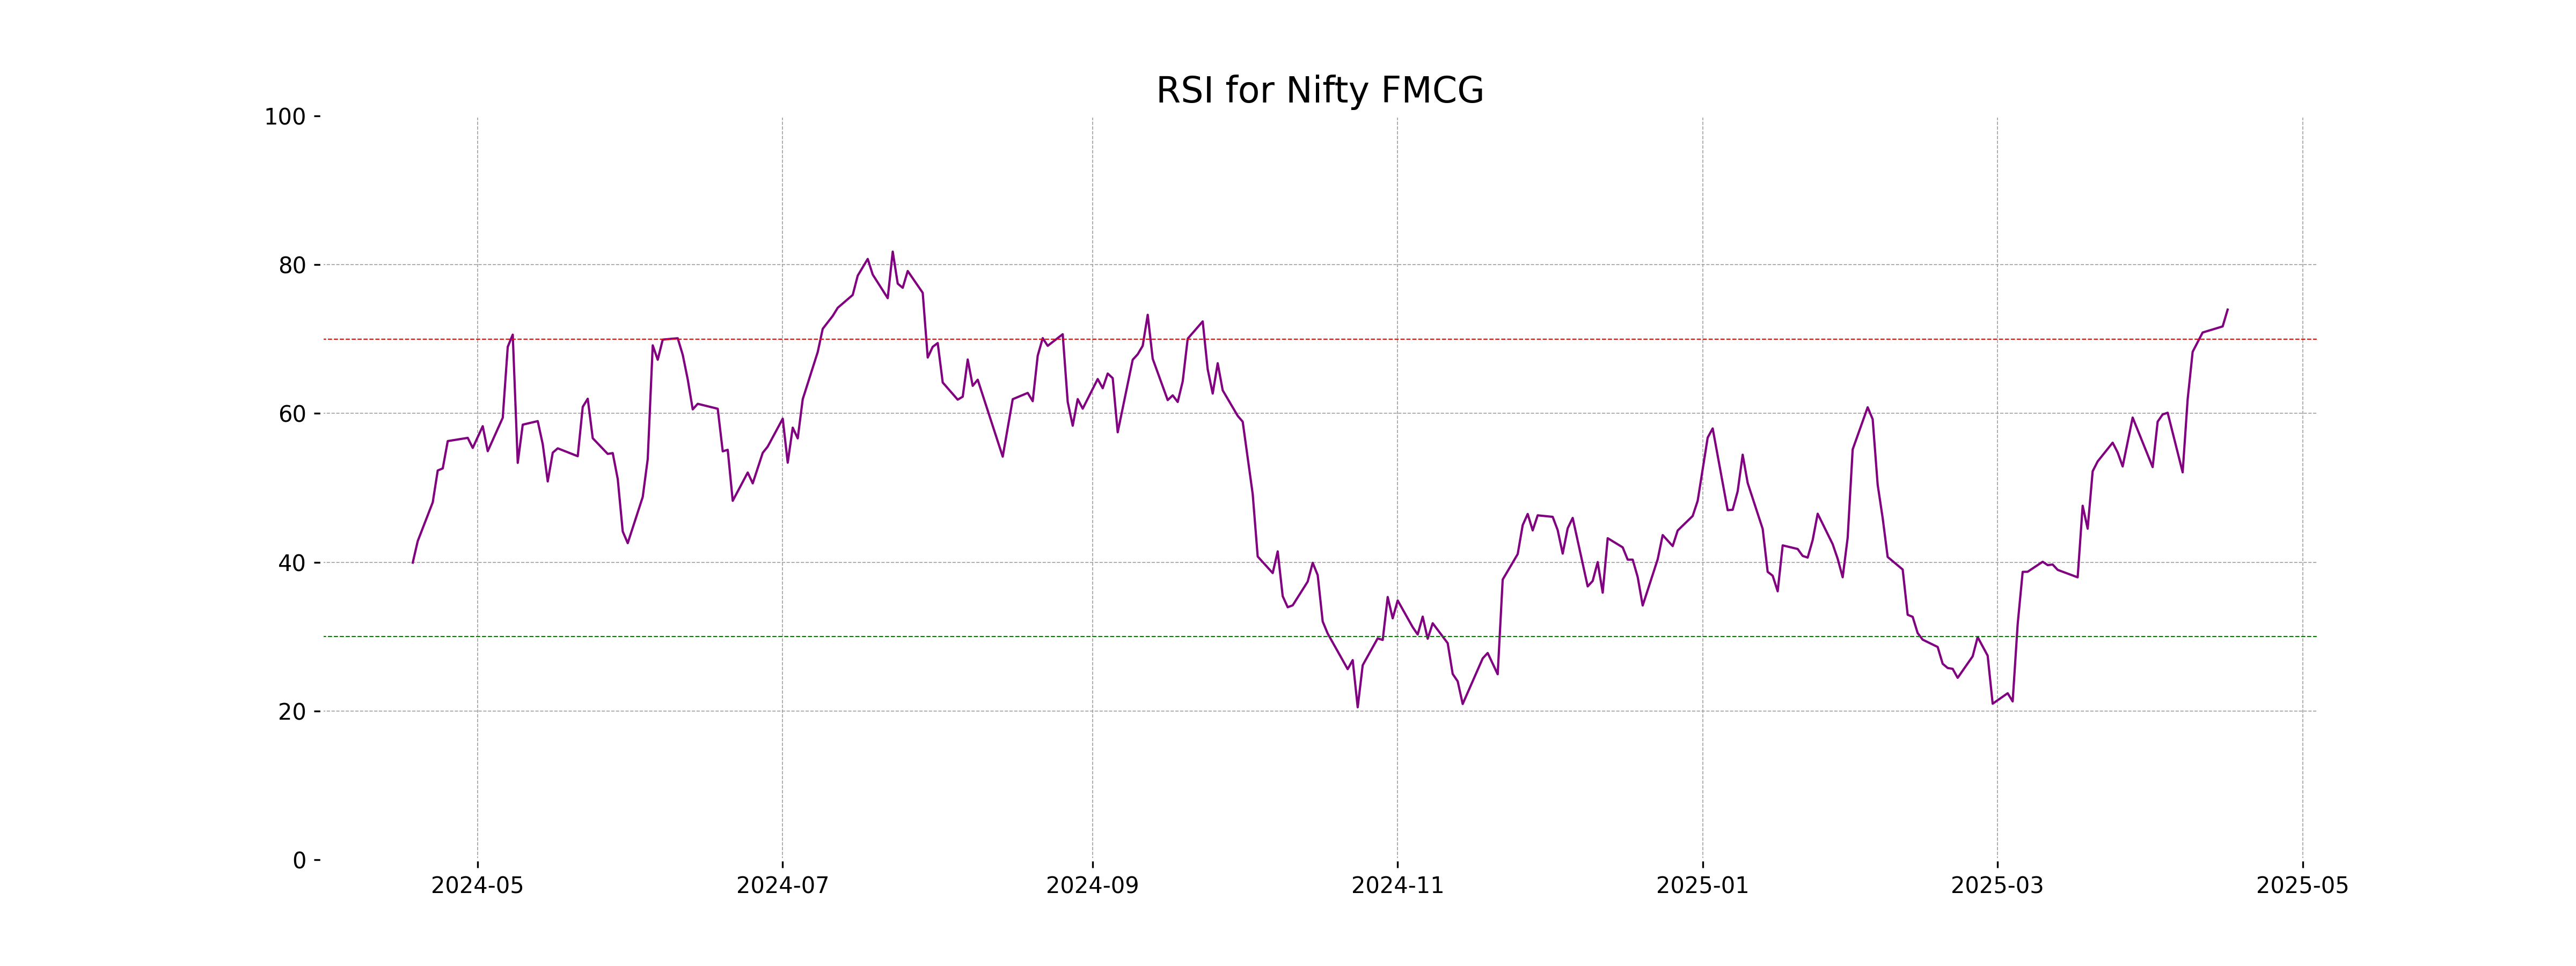
RSI Analysis
The Relative Strength Index (RSI) for Nifty FMCG is 73.96, indicating that the index is in the overbought territory. Typically, an RSI above 70 suggests that a stock or index may be due for a correction or pullback. It might be prudent for investors to be cautious and consider potential overvaluation.
Analysis for Nifty Infra - April 16, 2025
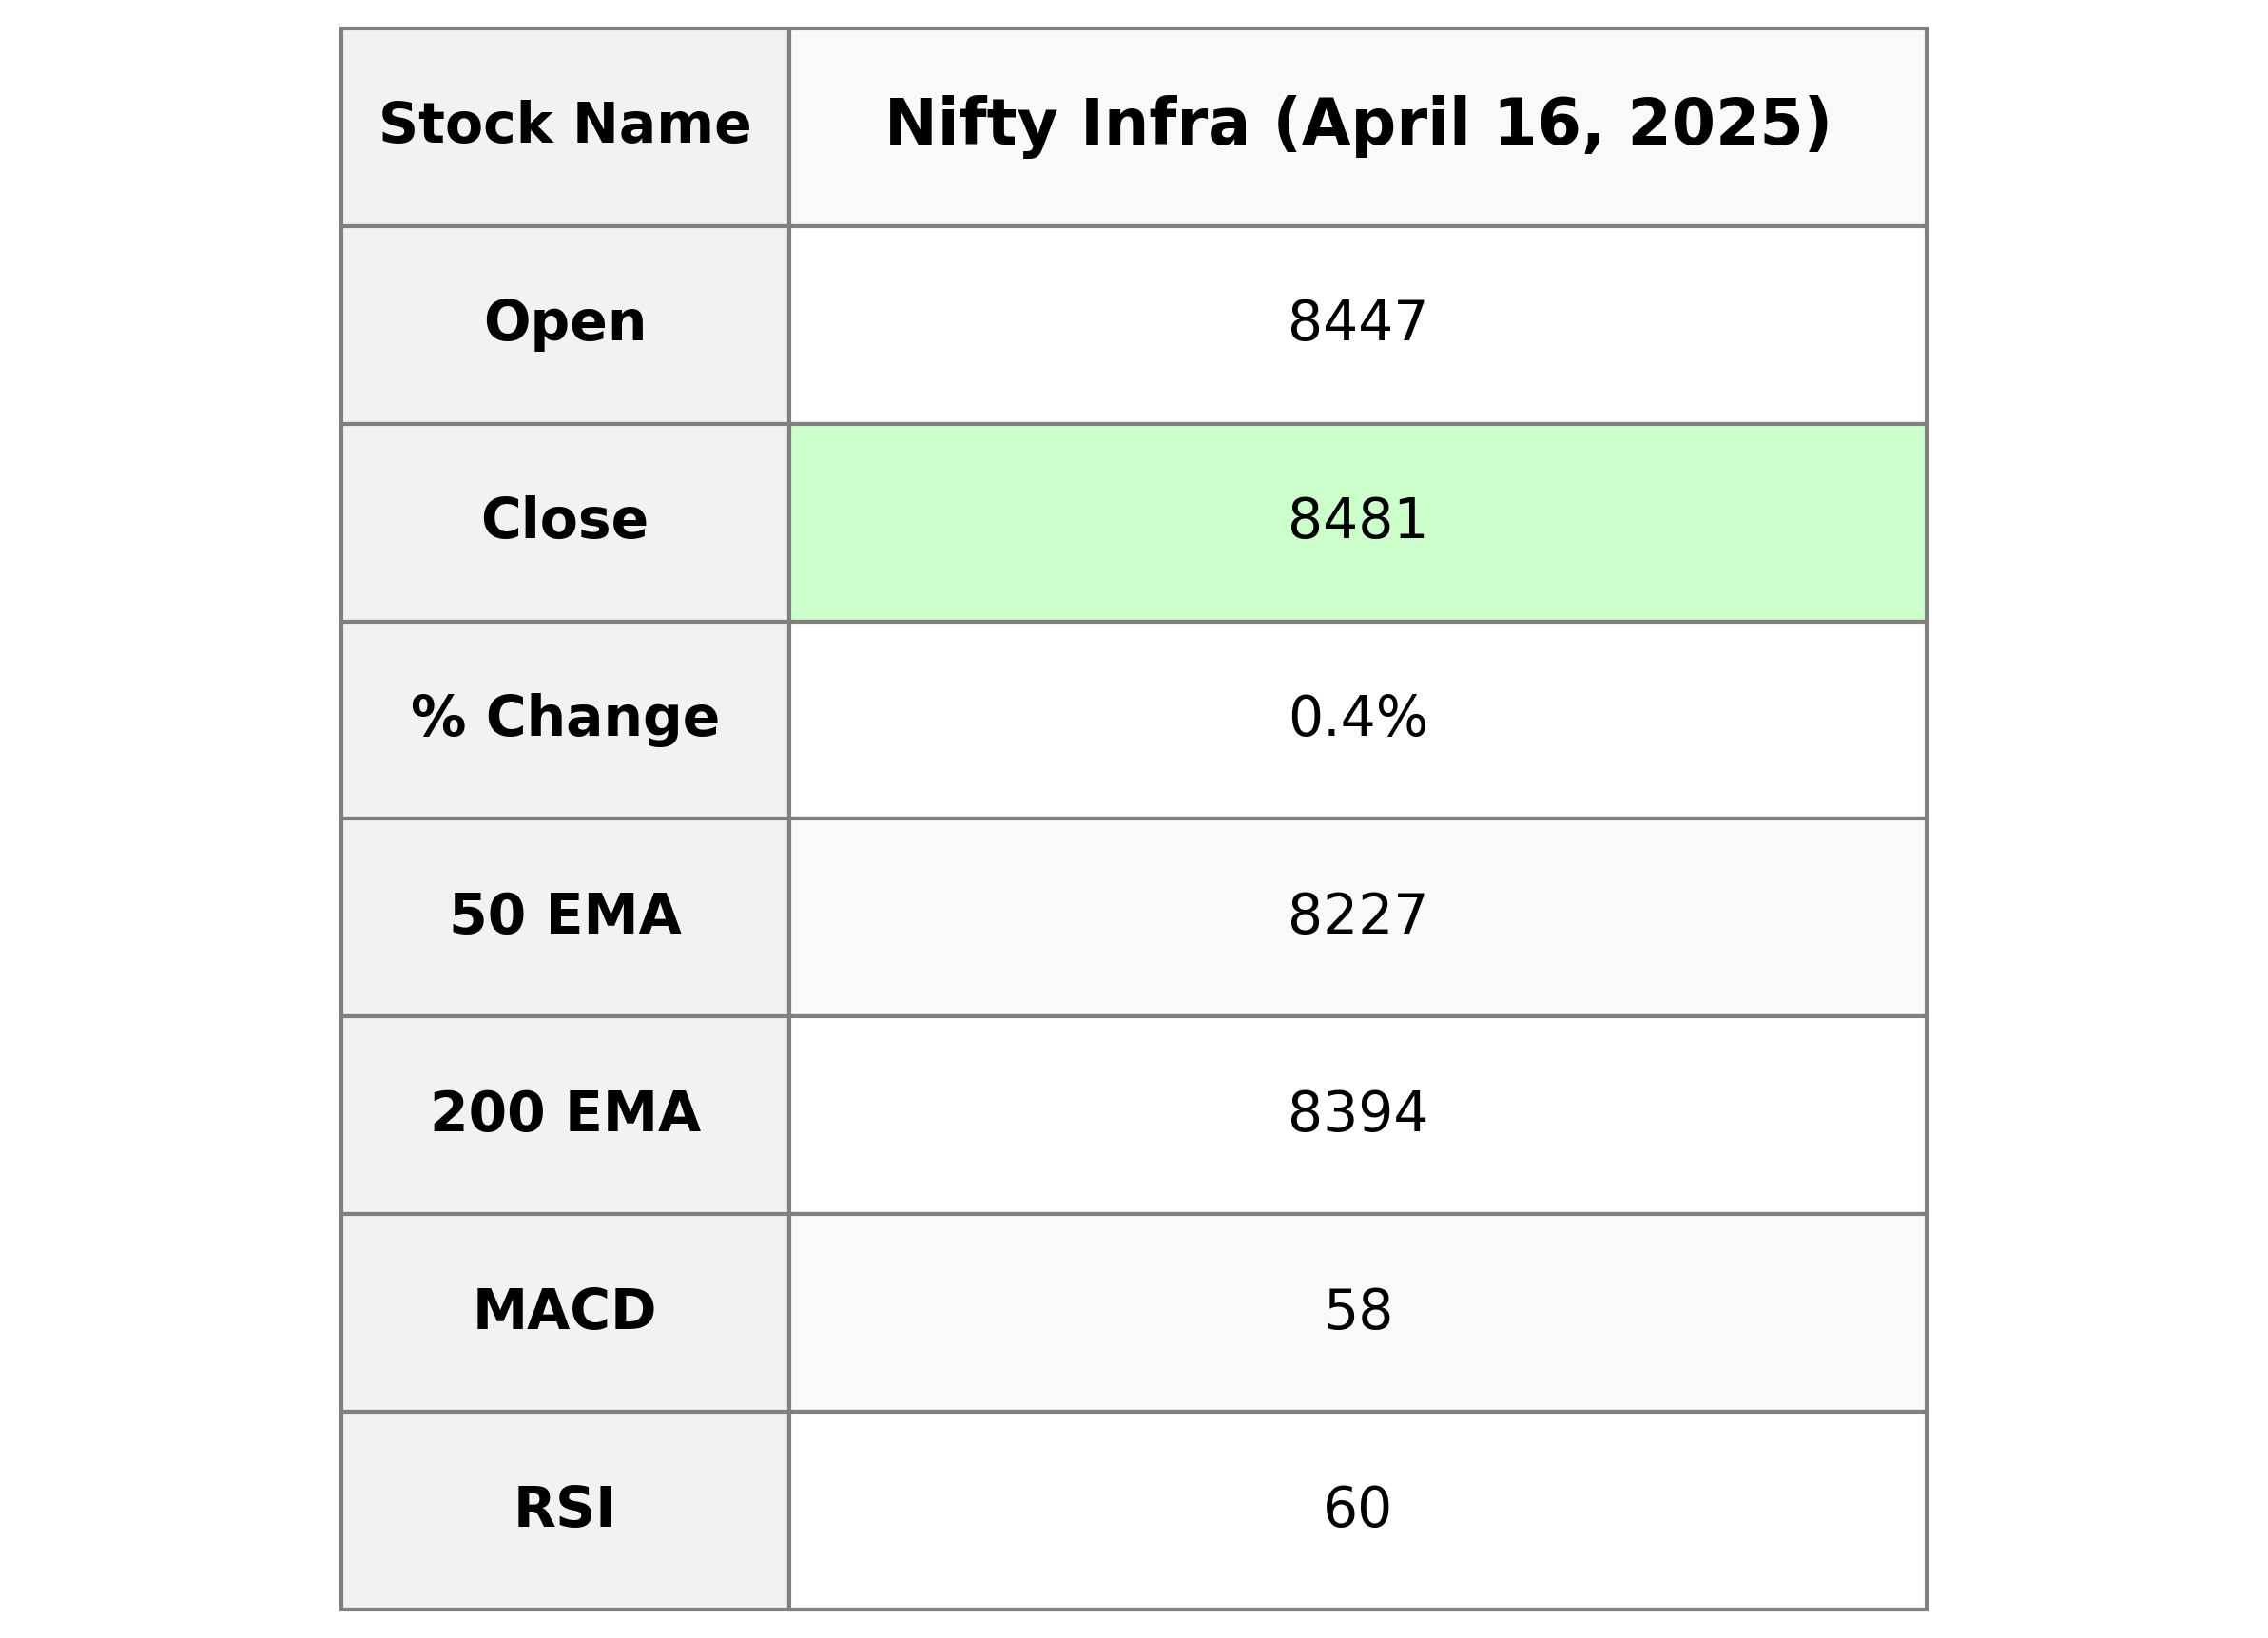
Nifty Infra opened at 8446.55 and had a high of 8489.35 and a low of 8426.90, closing at 8481.30. The stock had a percentage change of 0.36%, reflecting a points change of 30.70 from the previous close of 8450.60. The volume recorded was zero, and the Relative Strength Index stood at 59.94, indicating a moderately strong performance.
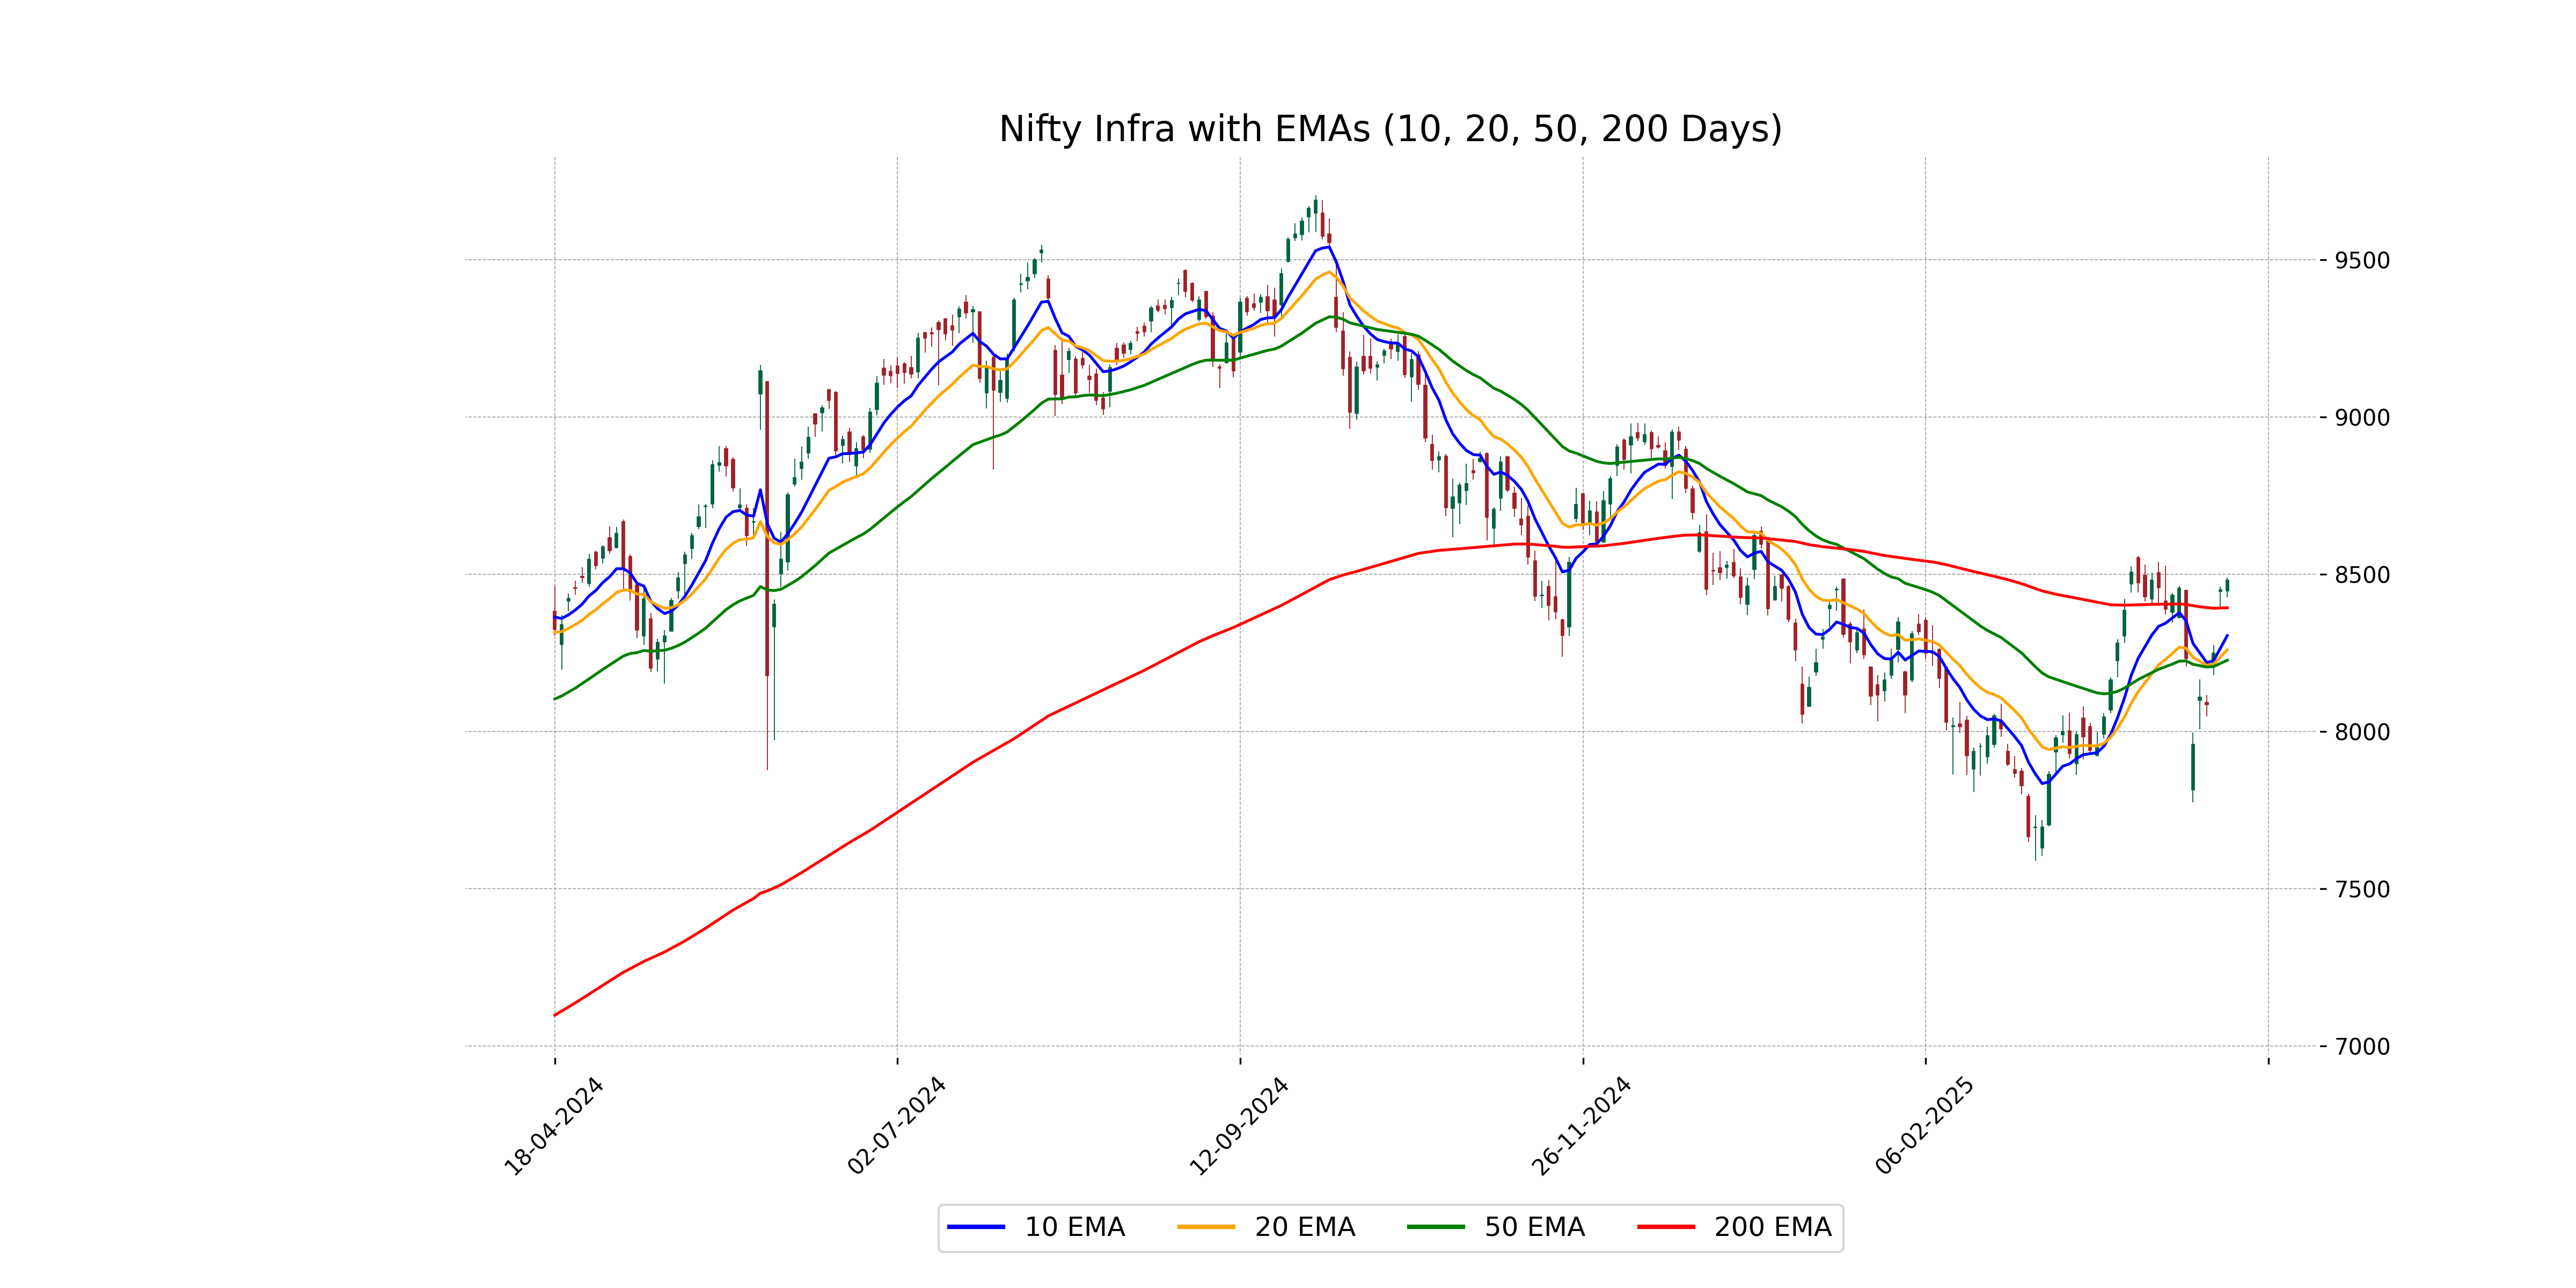
Relationship with Key Moving Averages
The Nifty Infra's recent closing of 8481.30 is above its 50-day EMA of 8226.76 and 200-day EMA of 8393.63, indicating a positive short to medium-term trend. The index is also well above its 10-day and 20-day EMAs, suggesting continued bullish momentum.
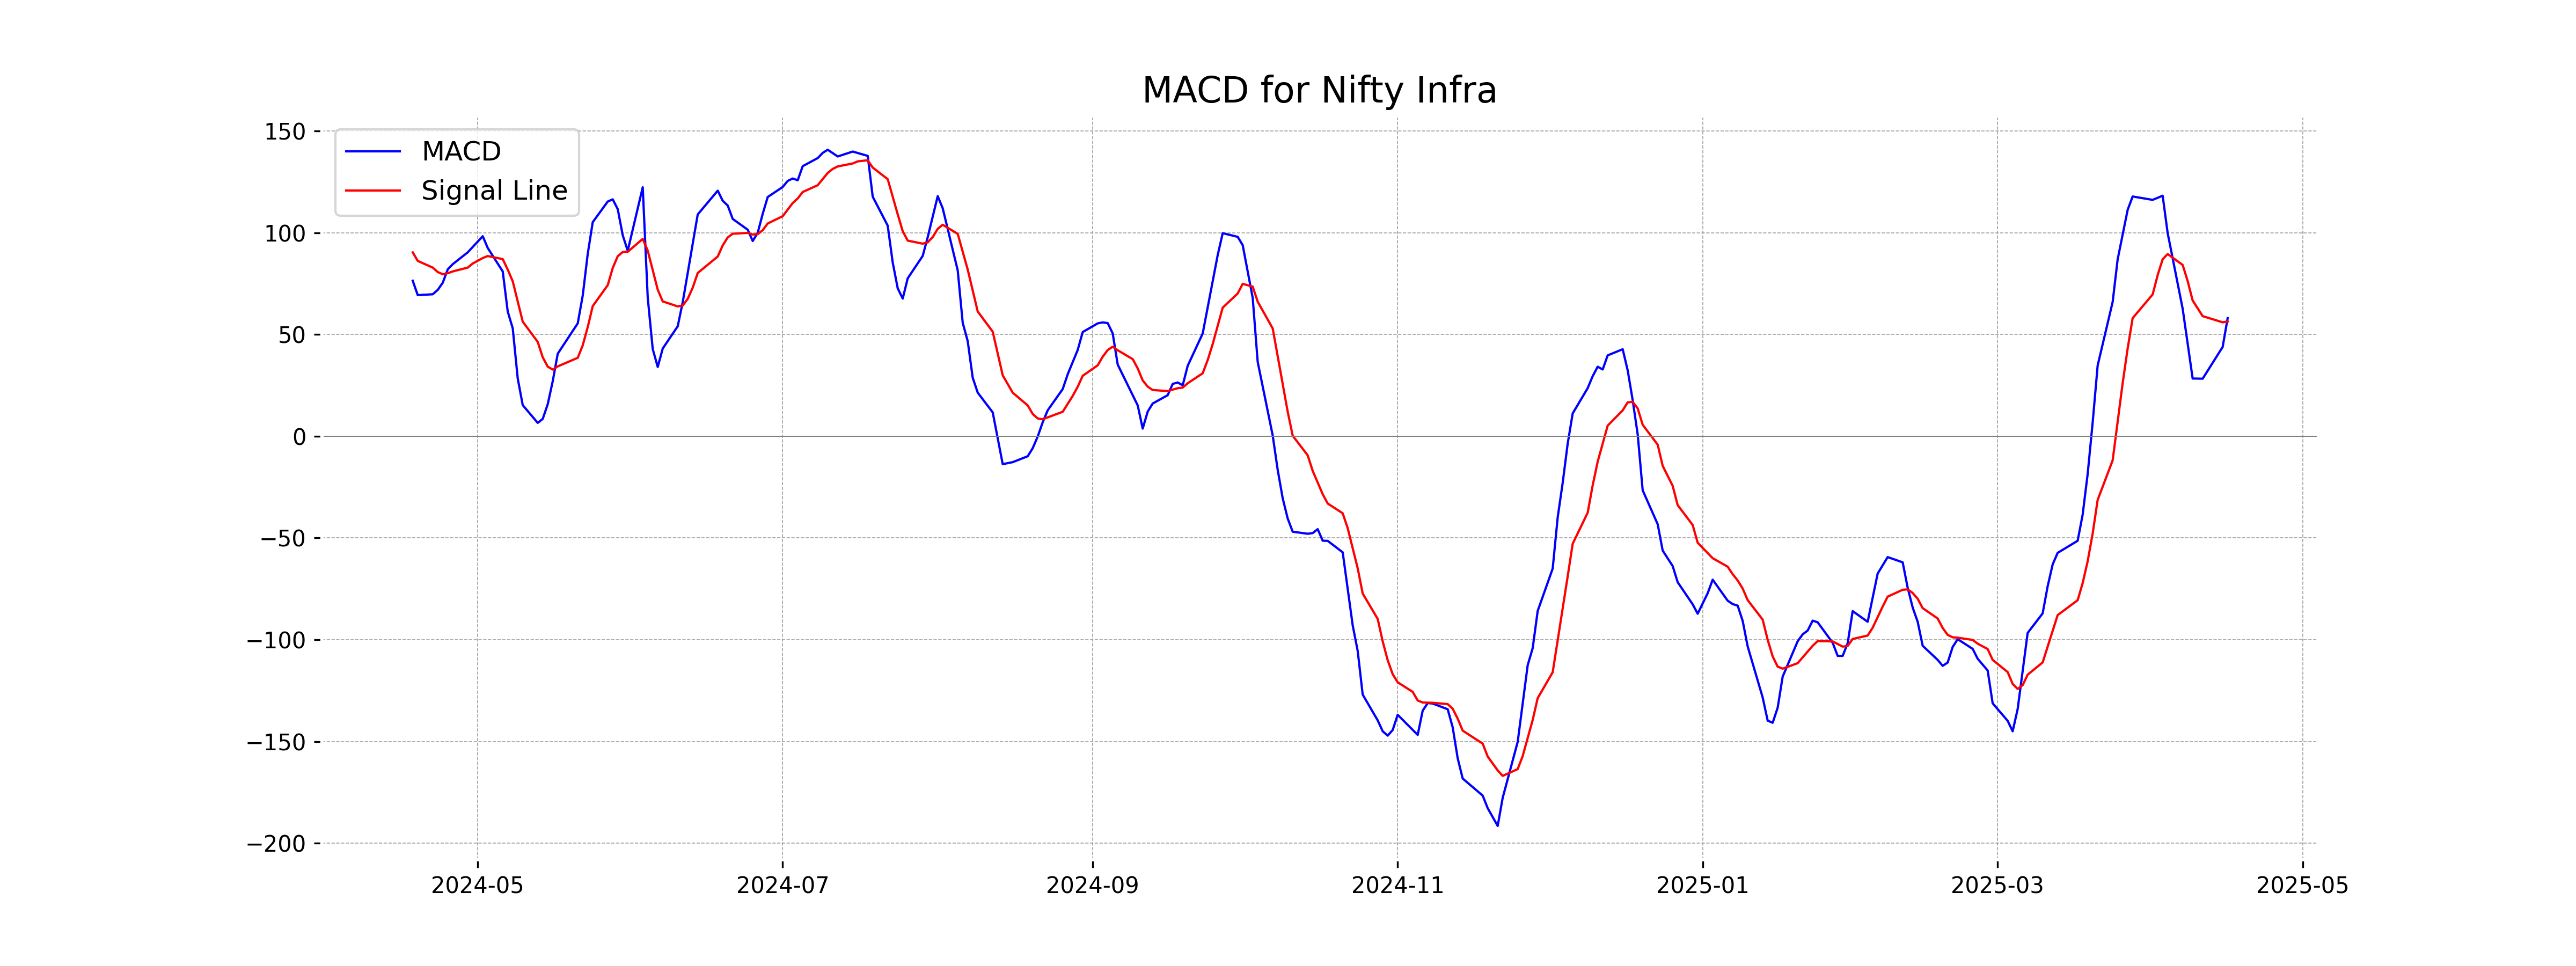
Moving Averages Trend (MACD)
Nifty Infra Analysis: The MACD value for Nifty Infra is 58.05, which is above the MACD Signal line at 56.42. This suggests a bullish signal, indicating potential upward momentum in the current trend. However, it's crucial to consider other indicators and market conditions for a comprehensive analysis.
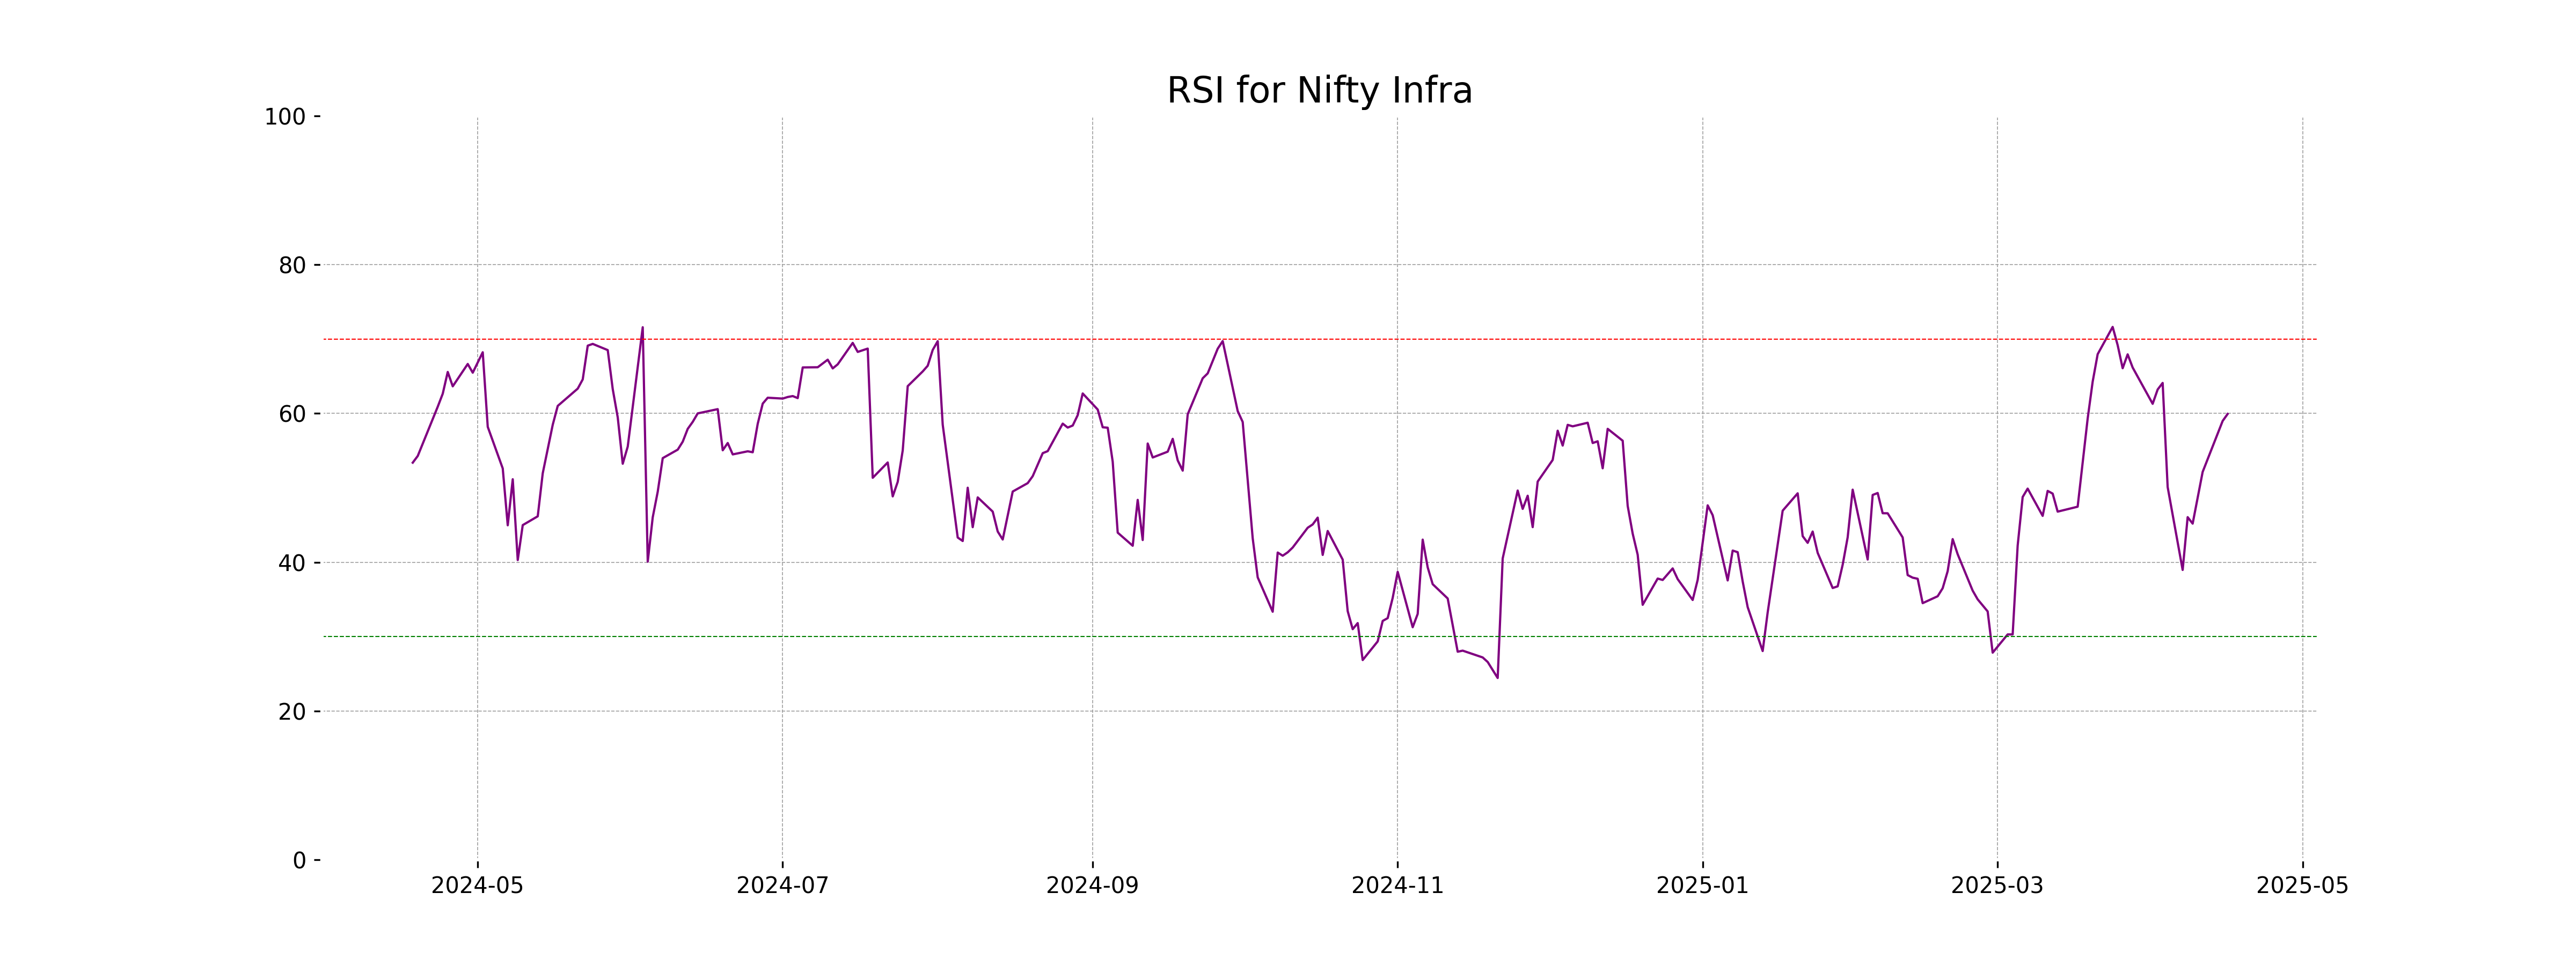
RSI Analysis
The RSI (Relative Strength Index) for Nifty Infra is 59.94, indicating a neutral to slightly bullish sentiment. Since the RSI is below 70, it hasn't reached the overbought threshold, suggesting there's potential for upward movement before hitting resistance.
Analysis for Nifty IT - April 16, 2025
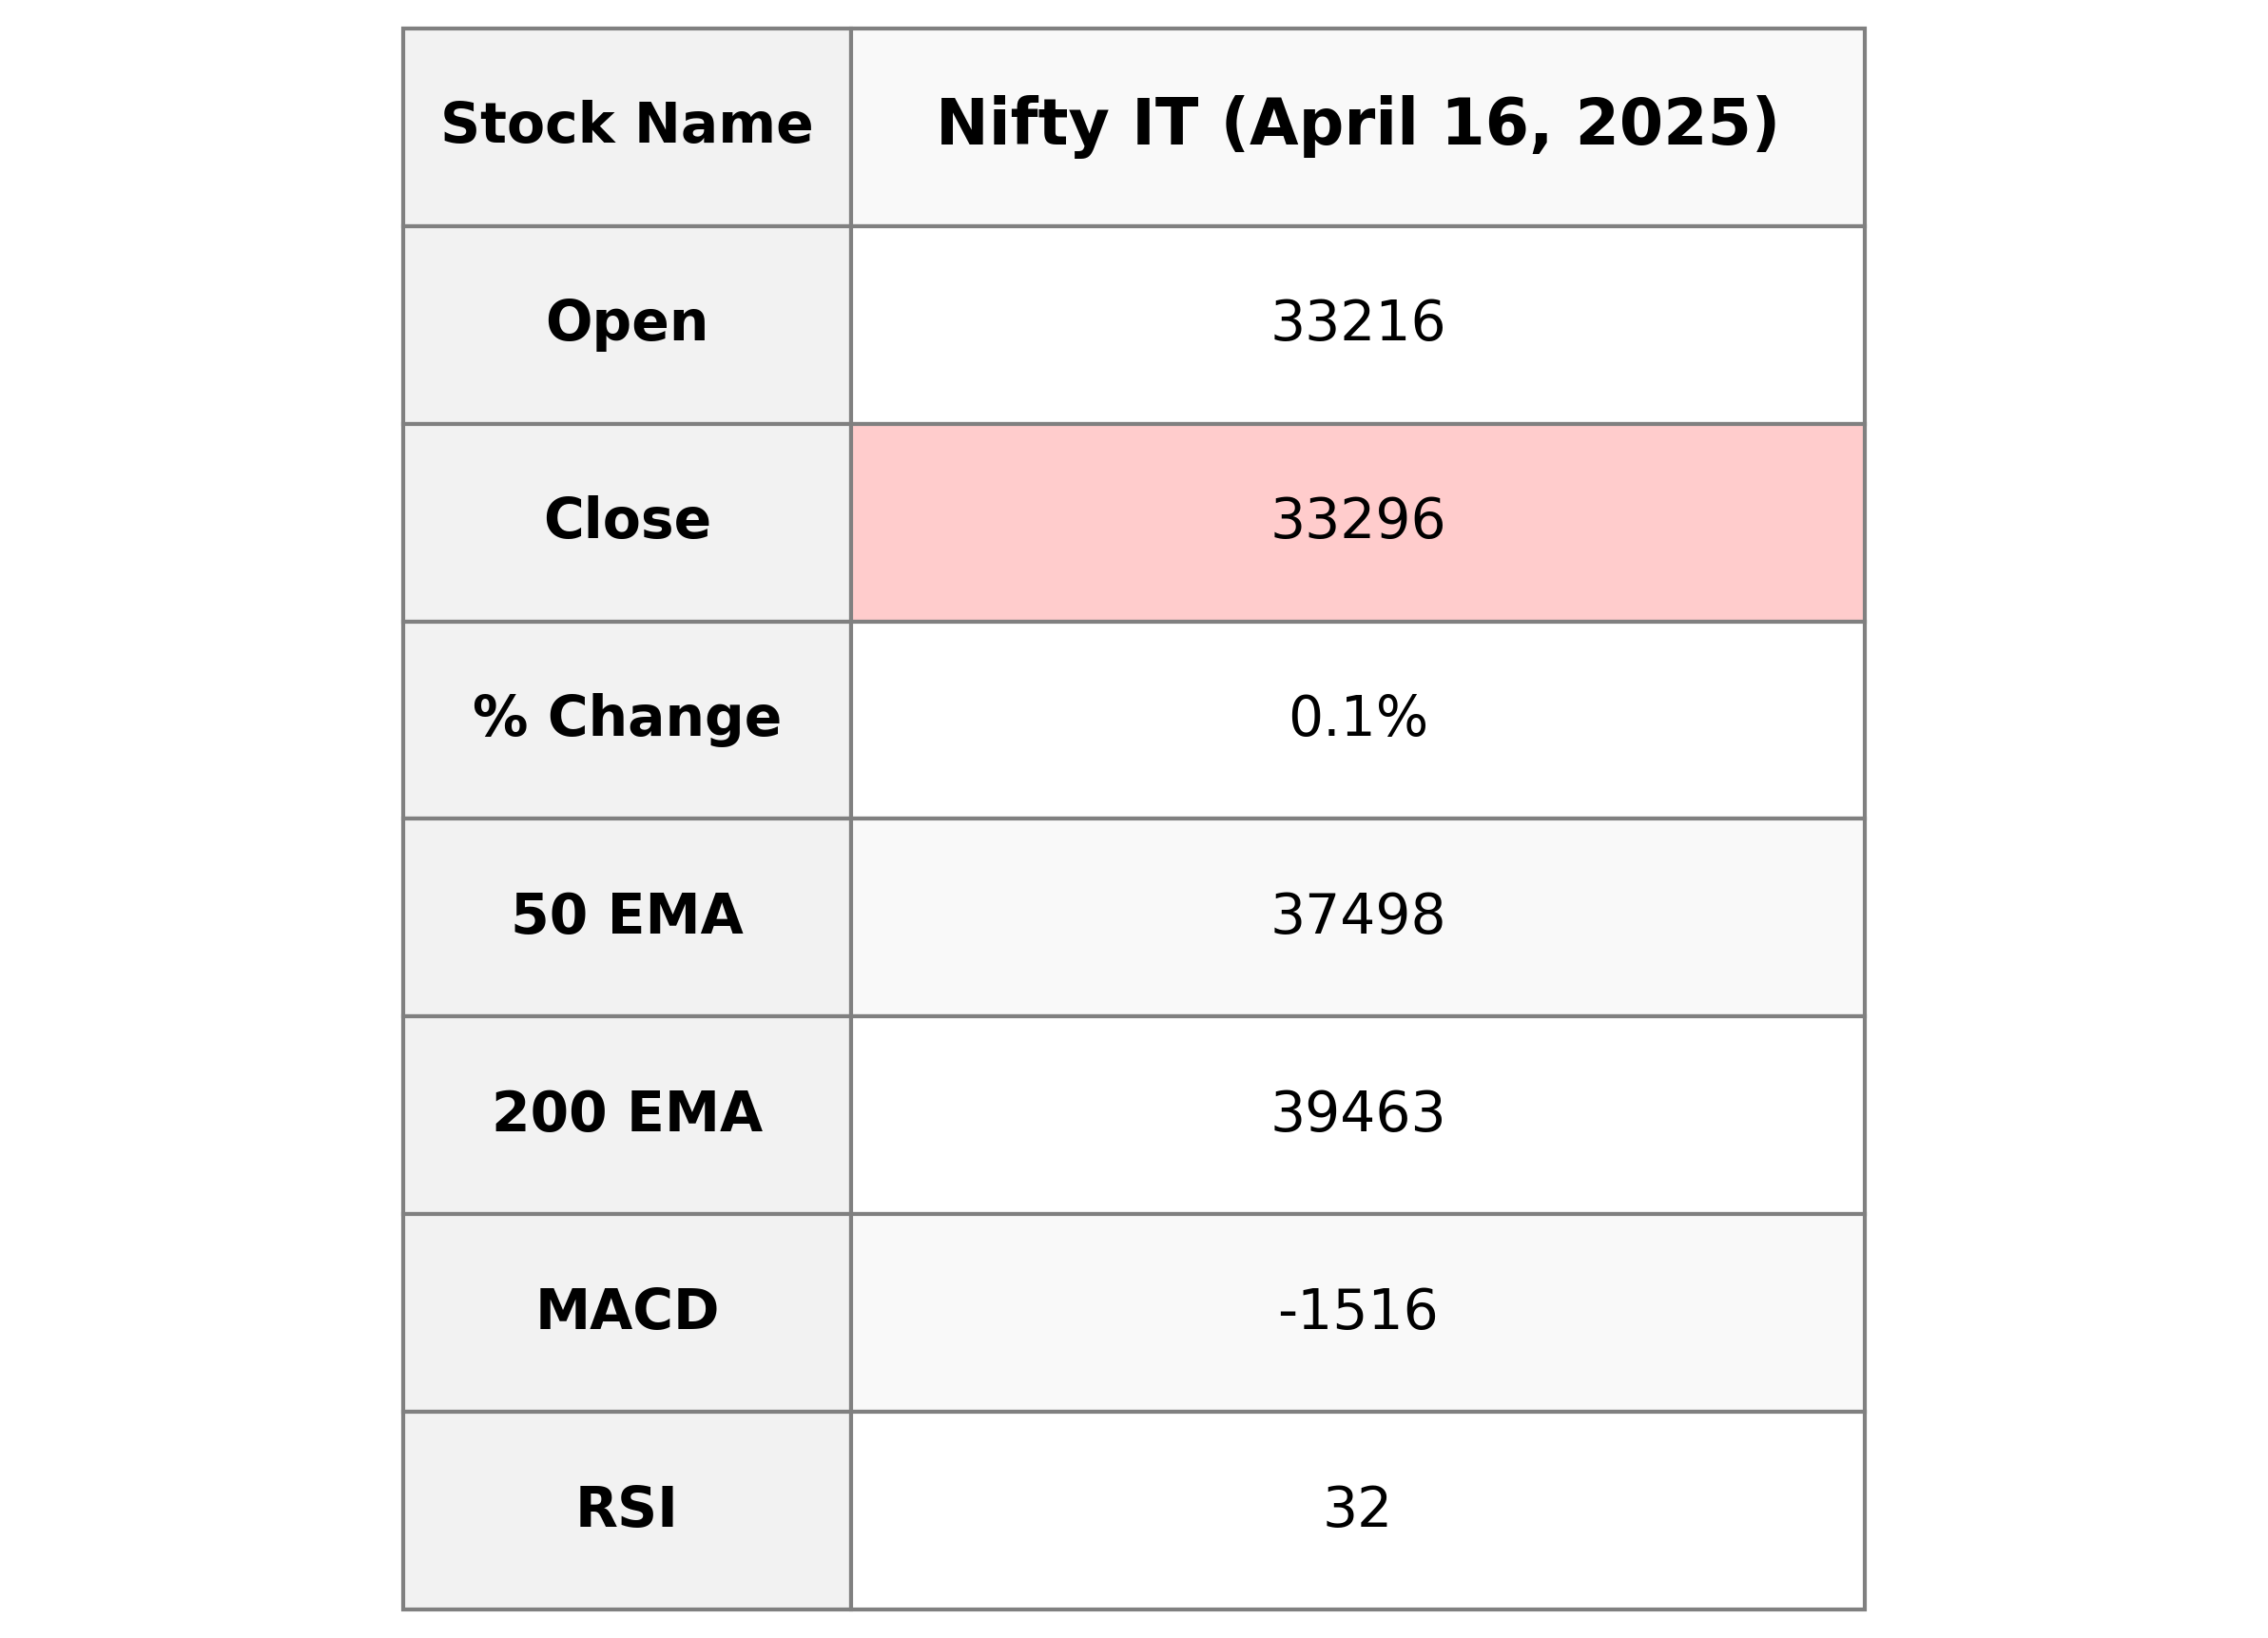
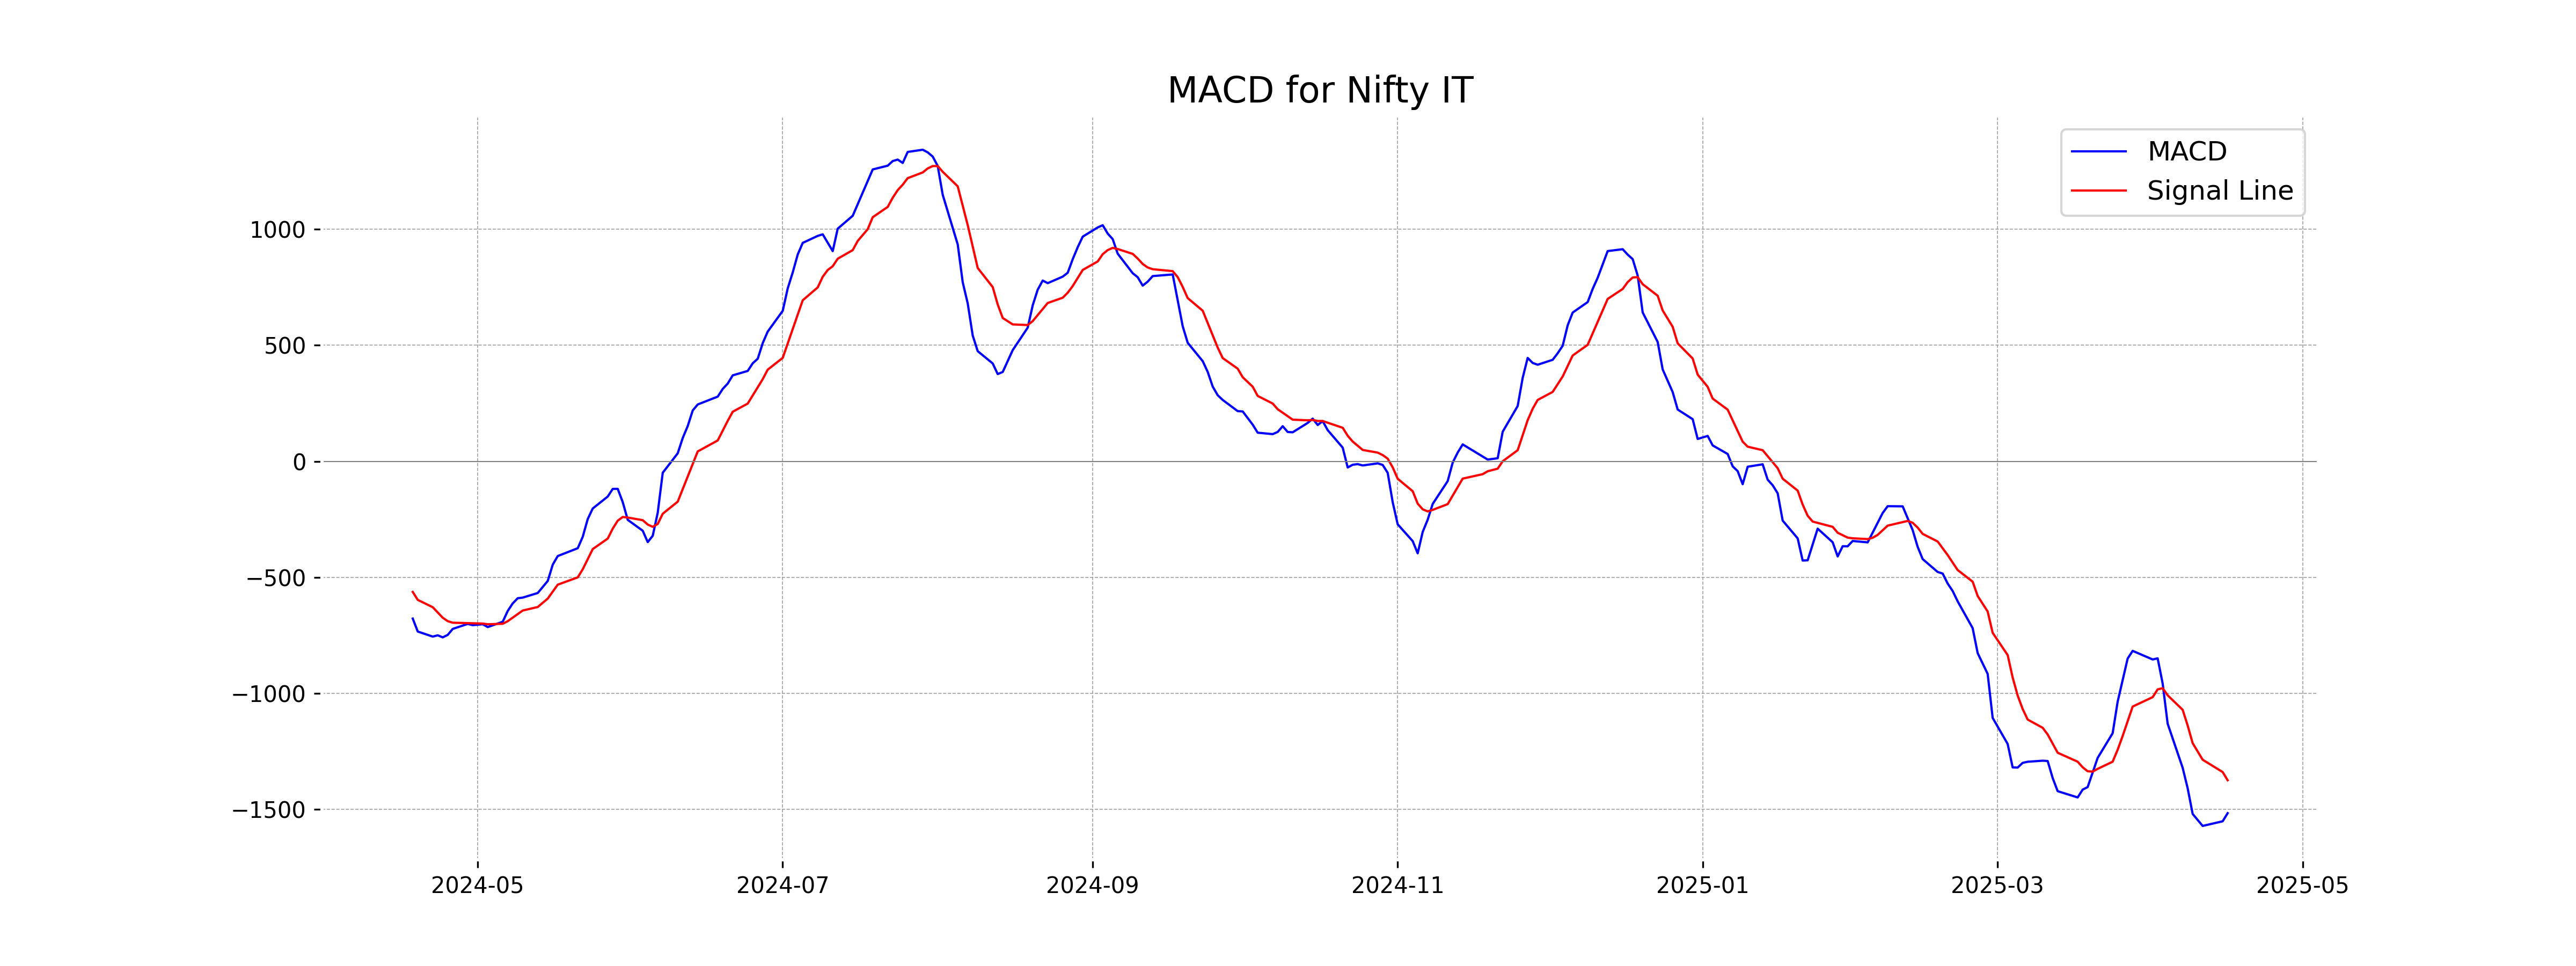
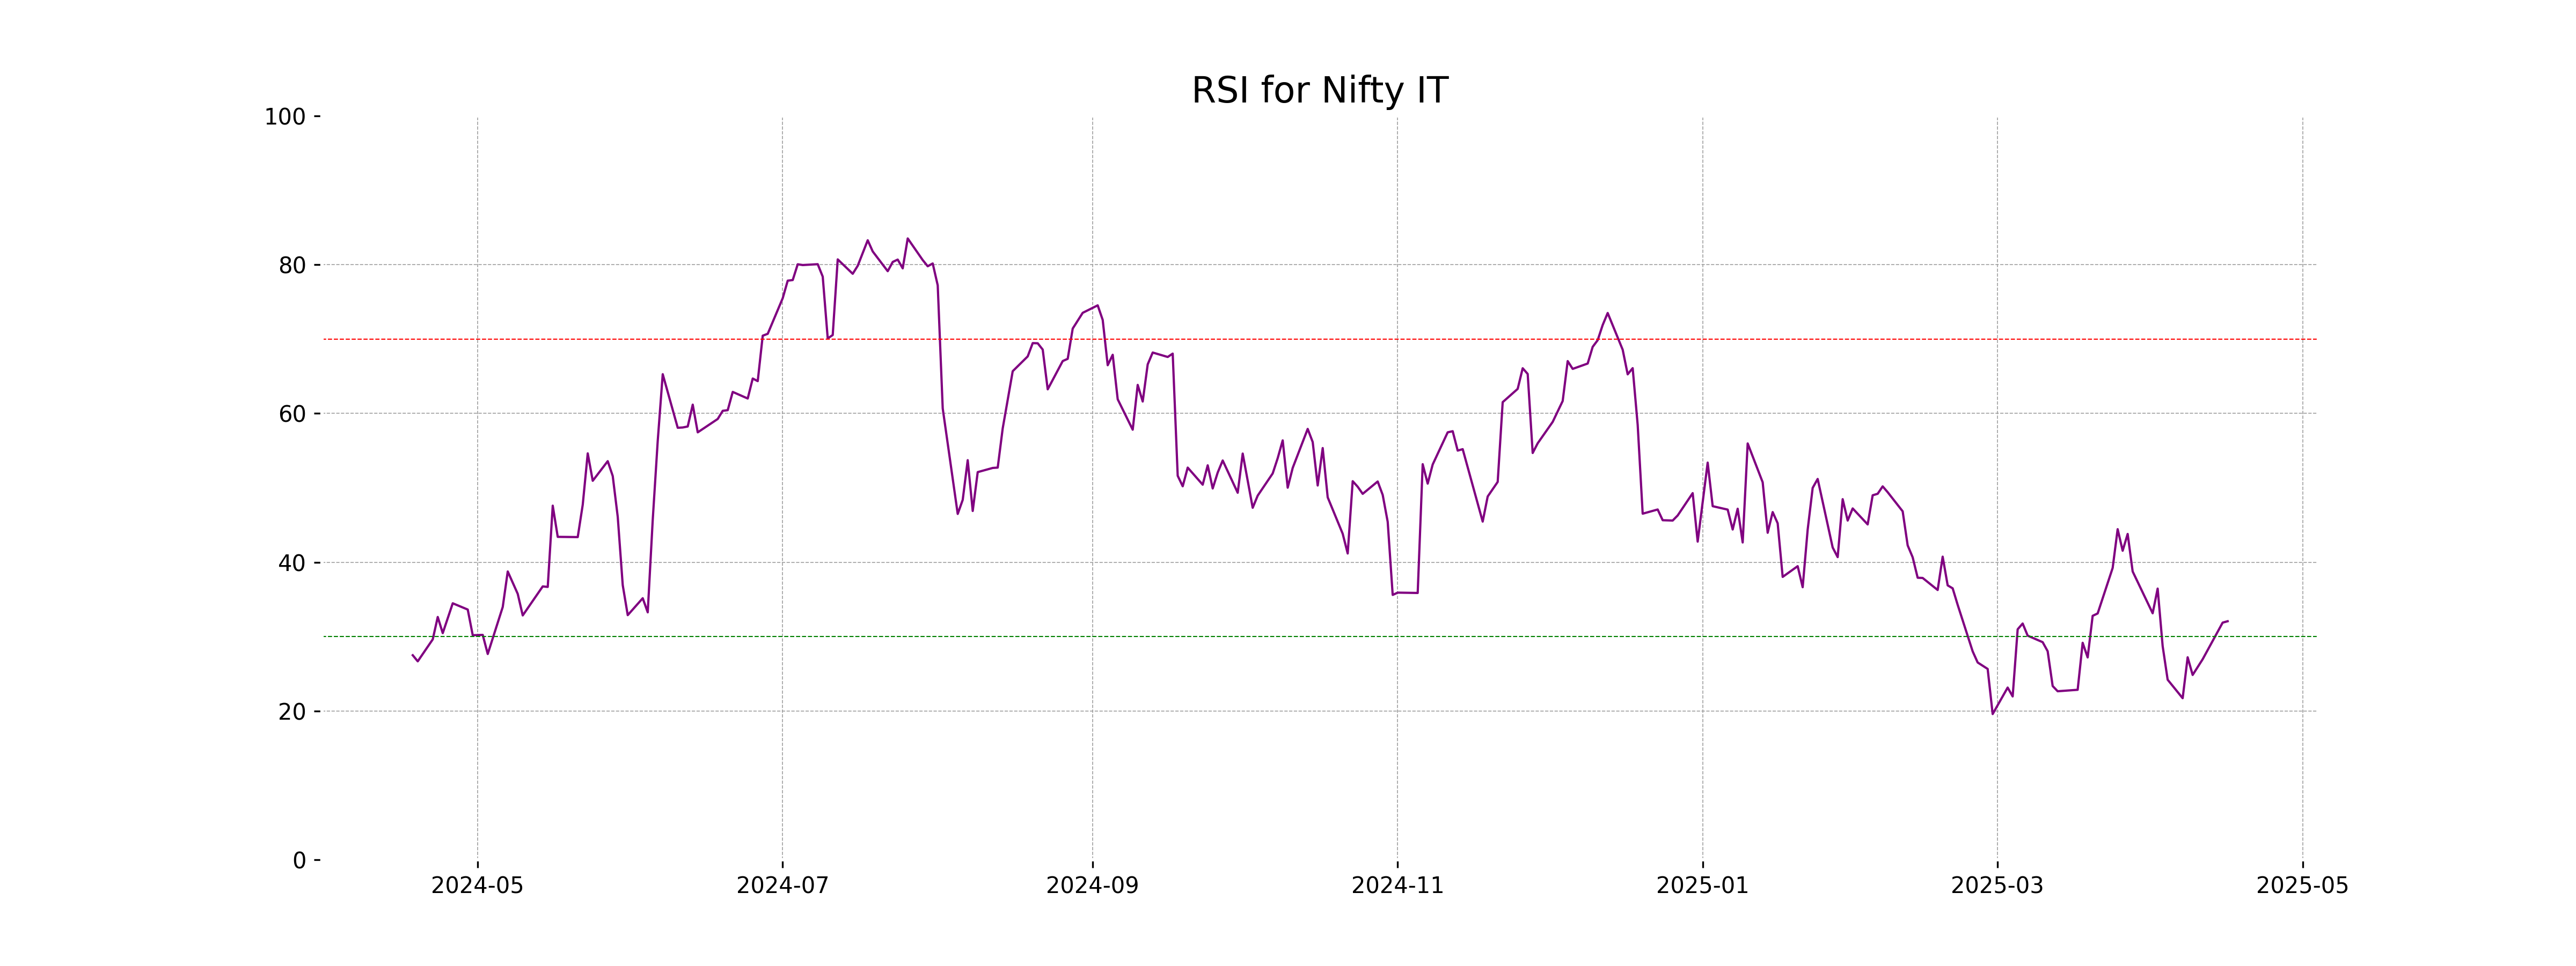
The Nifty IT index opened at 33,215.95 and closed slightly higher at 33,295.50, marking a minor increase of 0.06%. Despite this gain, the index's RSI stands at 32.06, indicating potential oversold conditions while the MACD at -1516.42 suggests bearish momentum compared to its signal line.
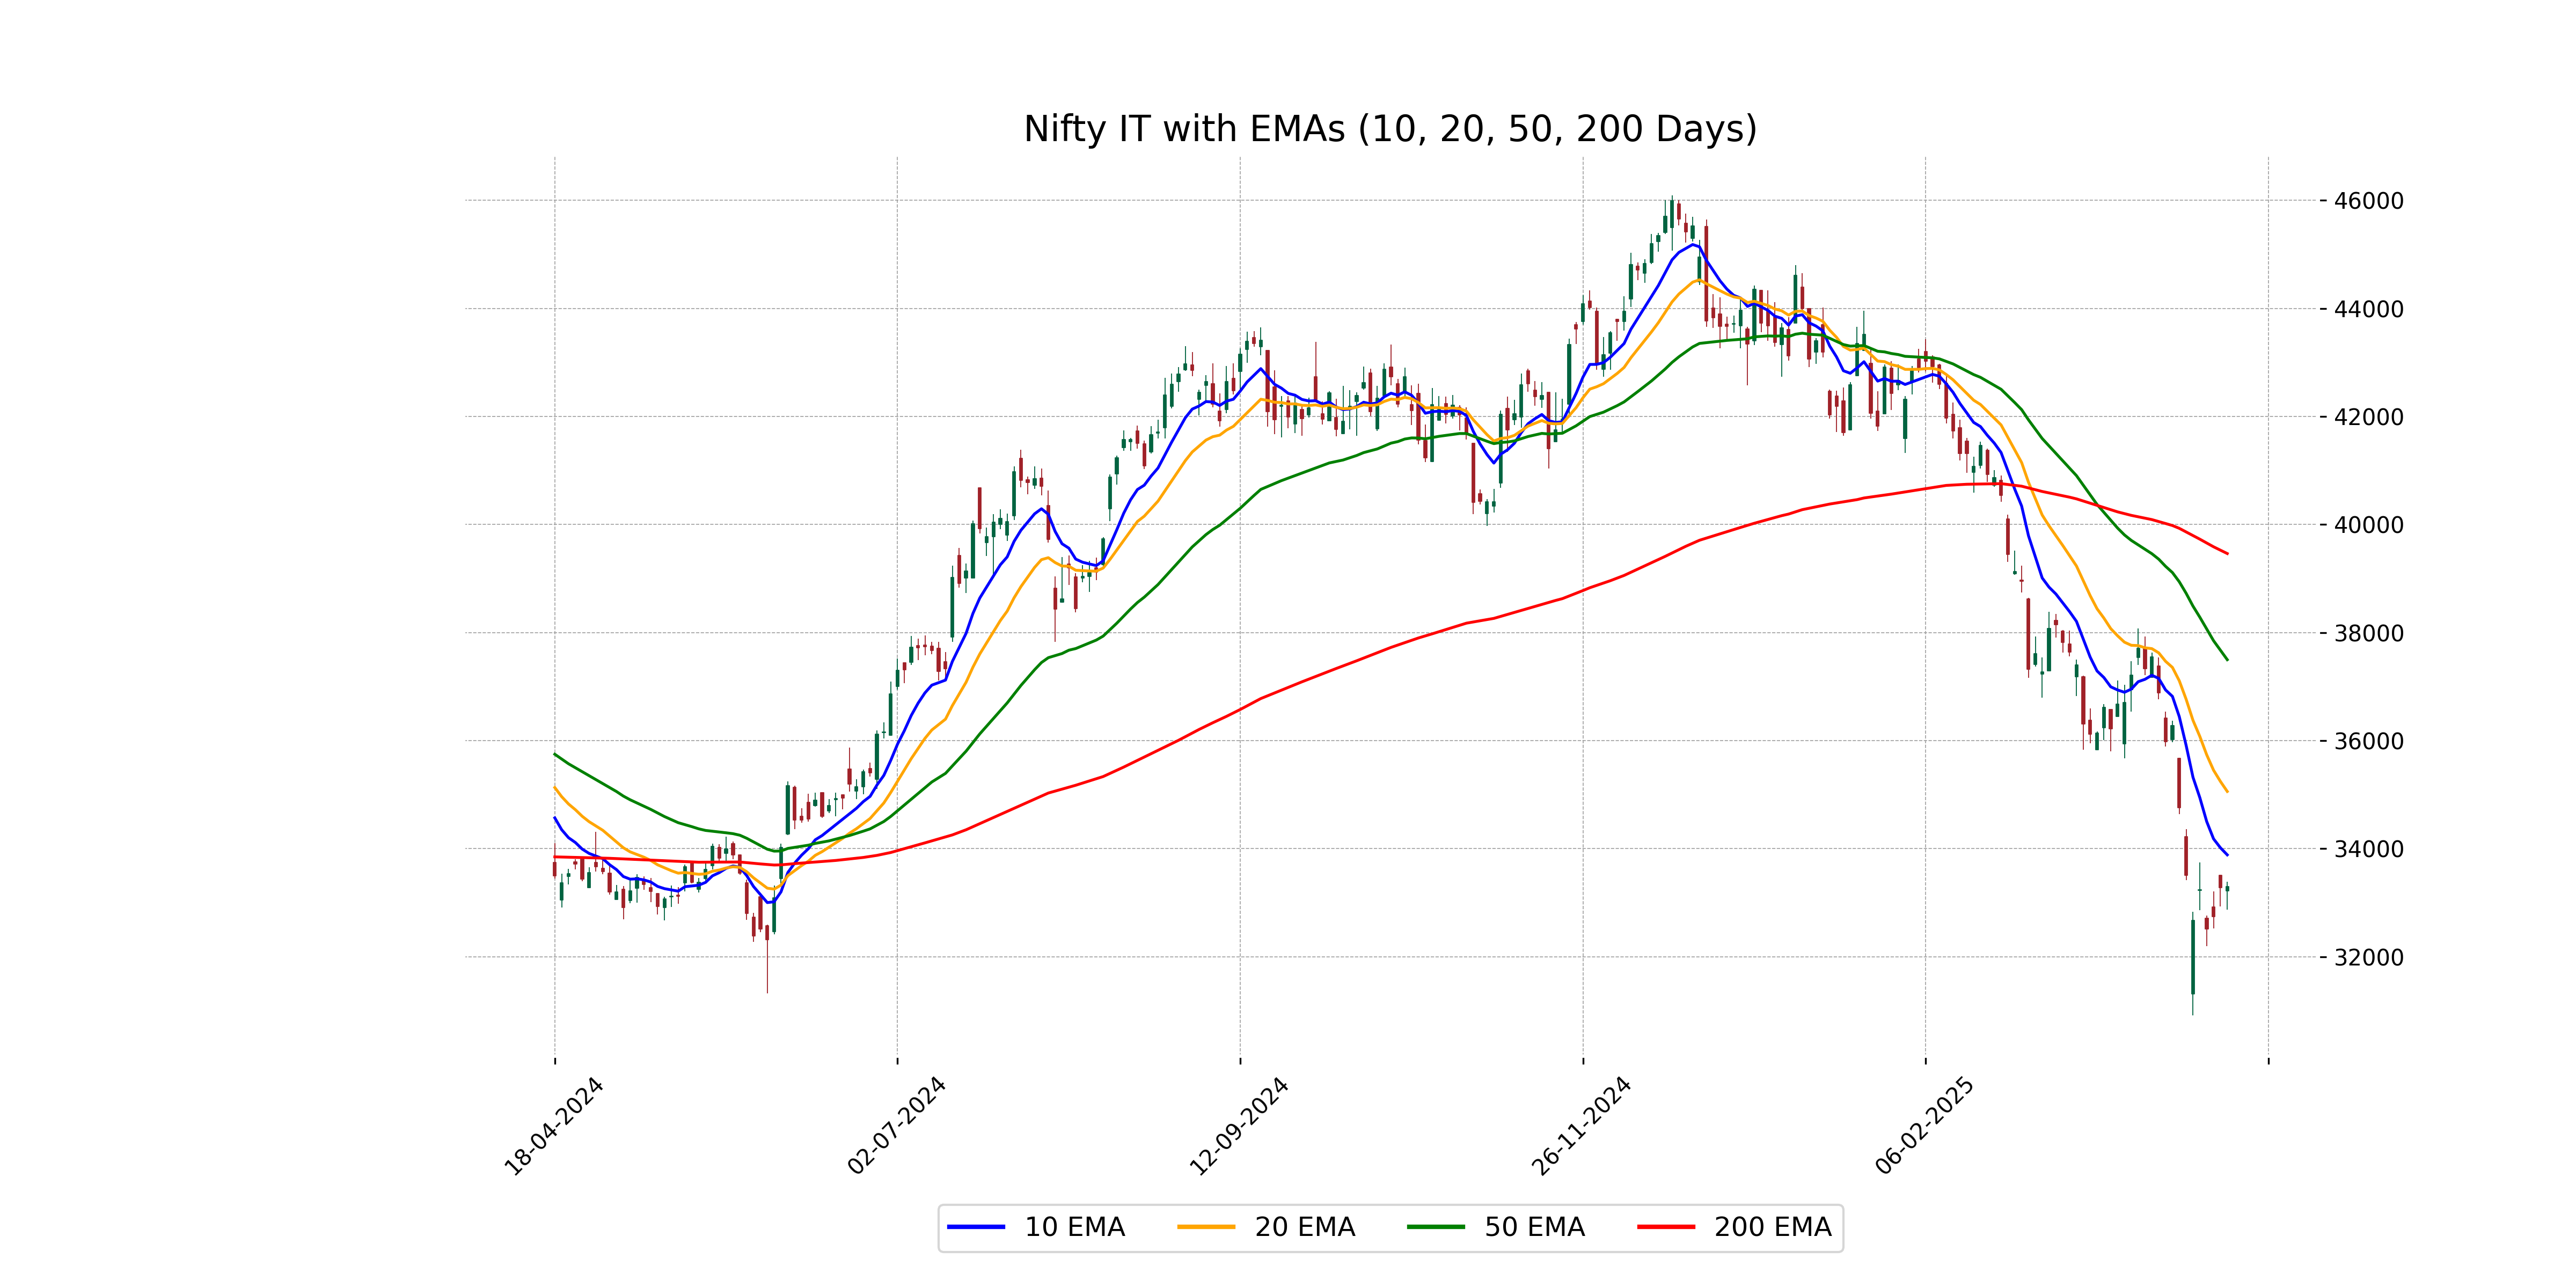
Relationship with Key Moving Averages
The current closing price of Nifty IT at 33,295.5 is below its 10 EMA of 33,886.25, 20 EMA of 35,059.64, 50 EMA of 37,498.44, and 200 EMA of 39,462.94, indicating a bearish trend with the price trading below key moving averages.
Moving Averages Trend (MACD)
Nifty IT's MACD is at -1516.42, with a MACD Signal of -1374.60, indicating a bearish trend as the MACD line is below the signal line. Investors might view this as a potential sell signal, although other indicators should be considered for a comprehensive analysis.
RSI Analysis
The Relative Strength Index (RSI) for Nifty IT stands at 32.06, indicating that the index is approaching oversold conditions. Generally, an RSI below 30 is considered oversold, which might suggest a potential buying opportunity if other indicators align favorably.
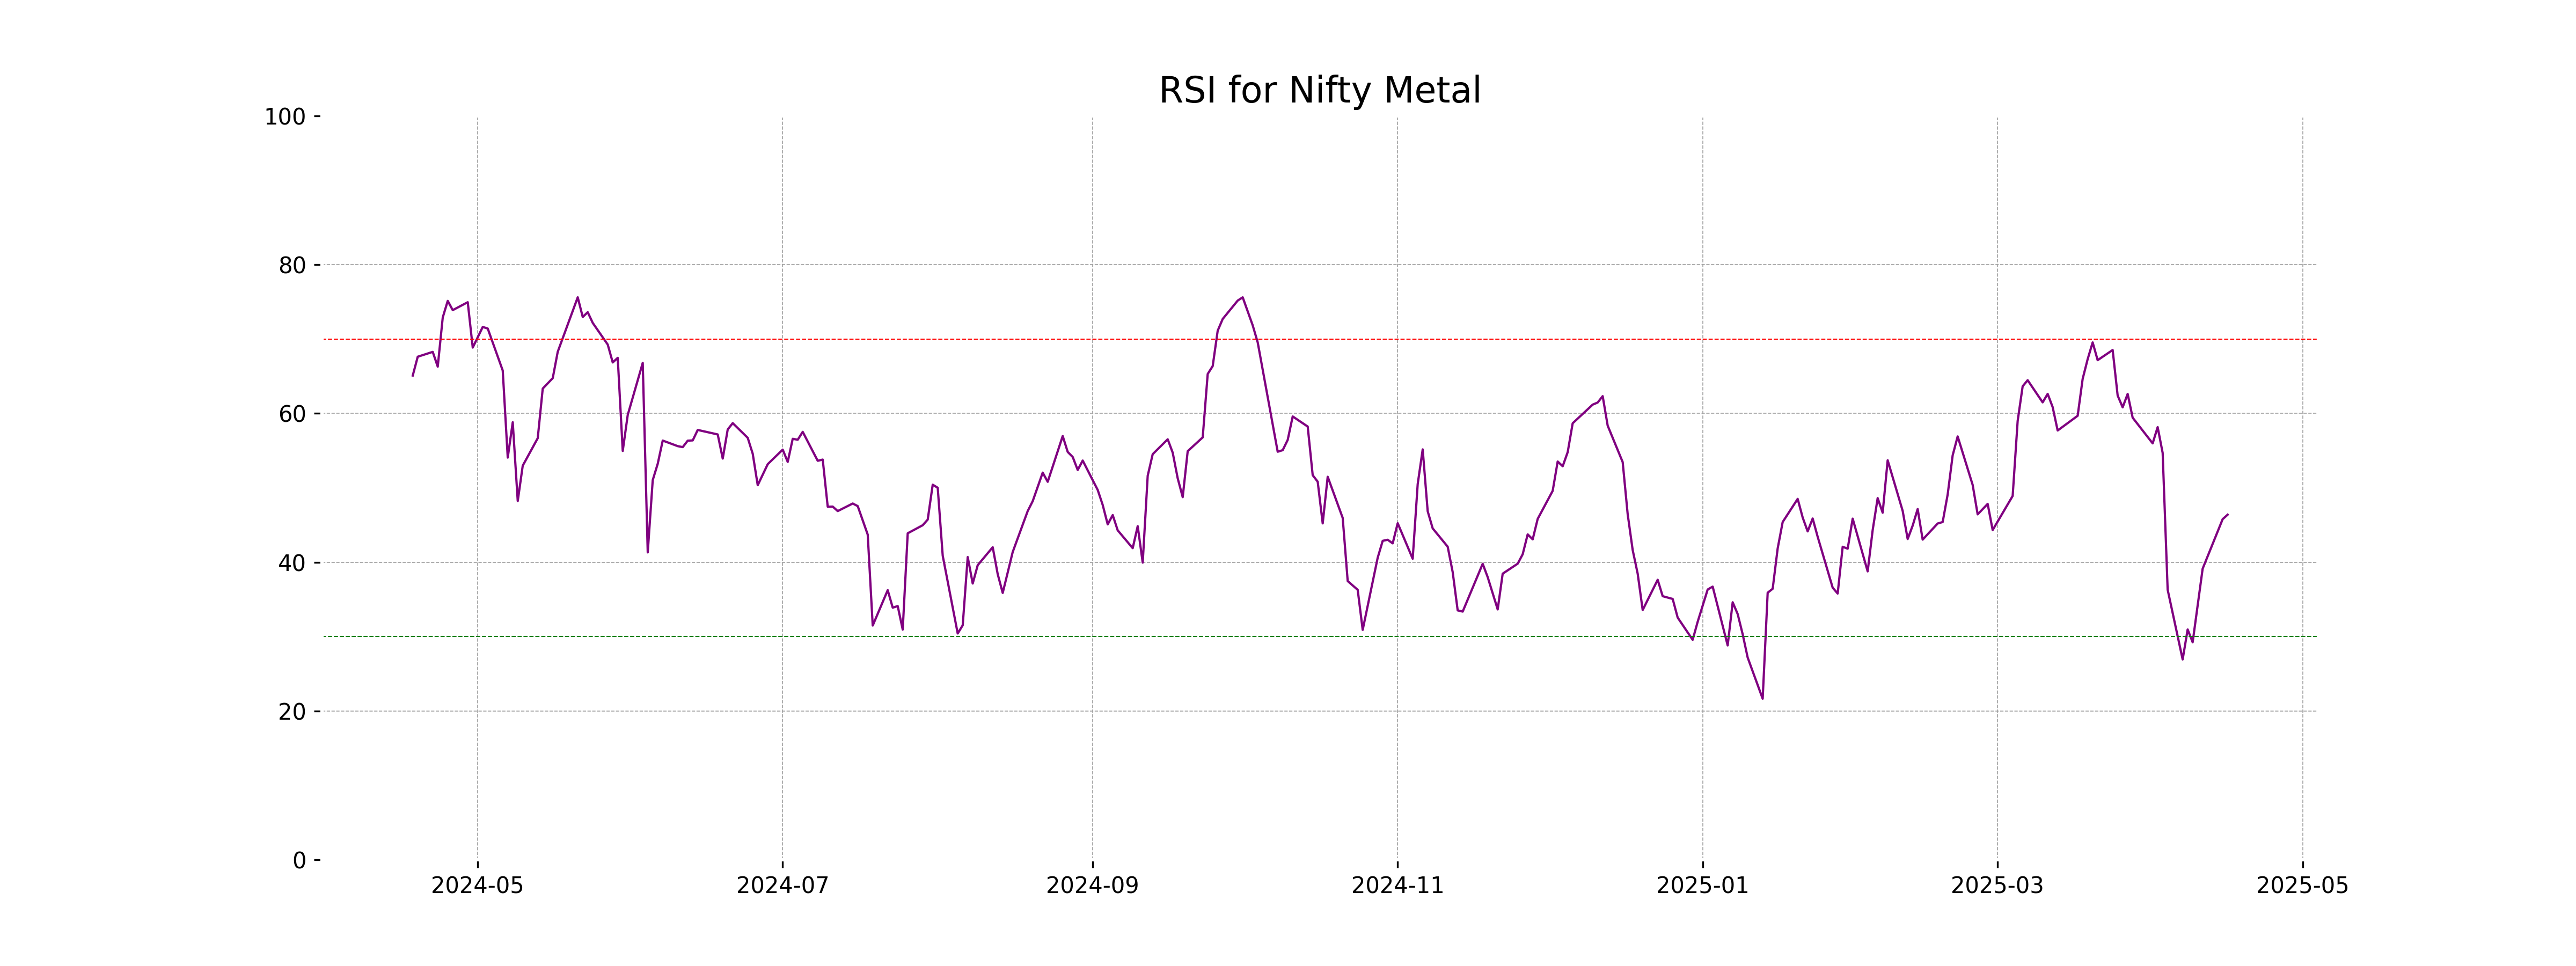
Analysis for Nifty Metal - April 16, 2025
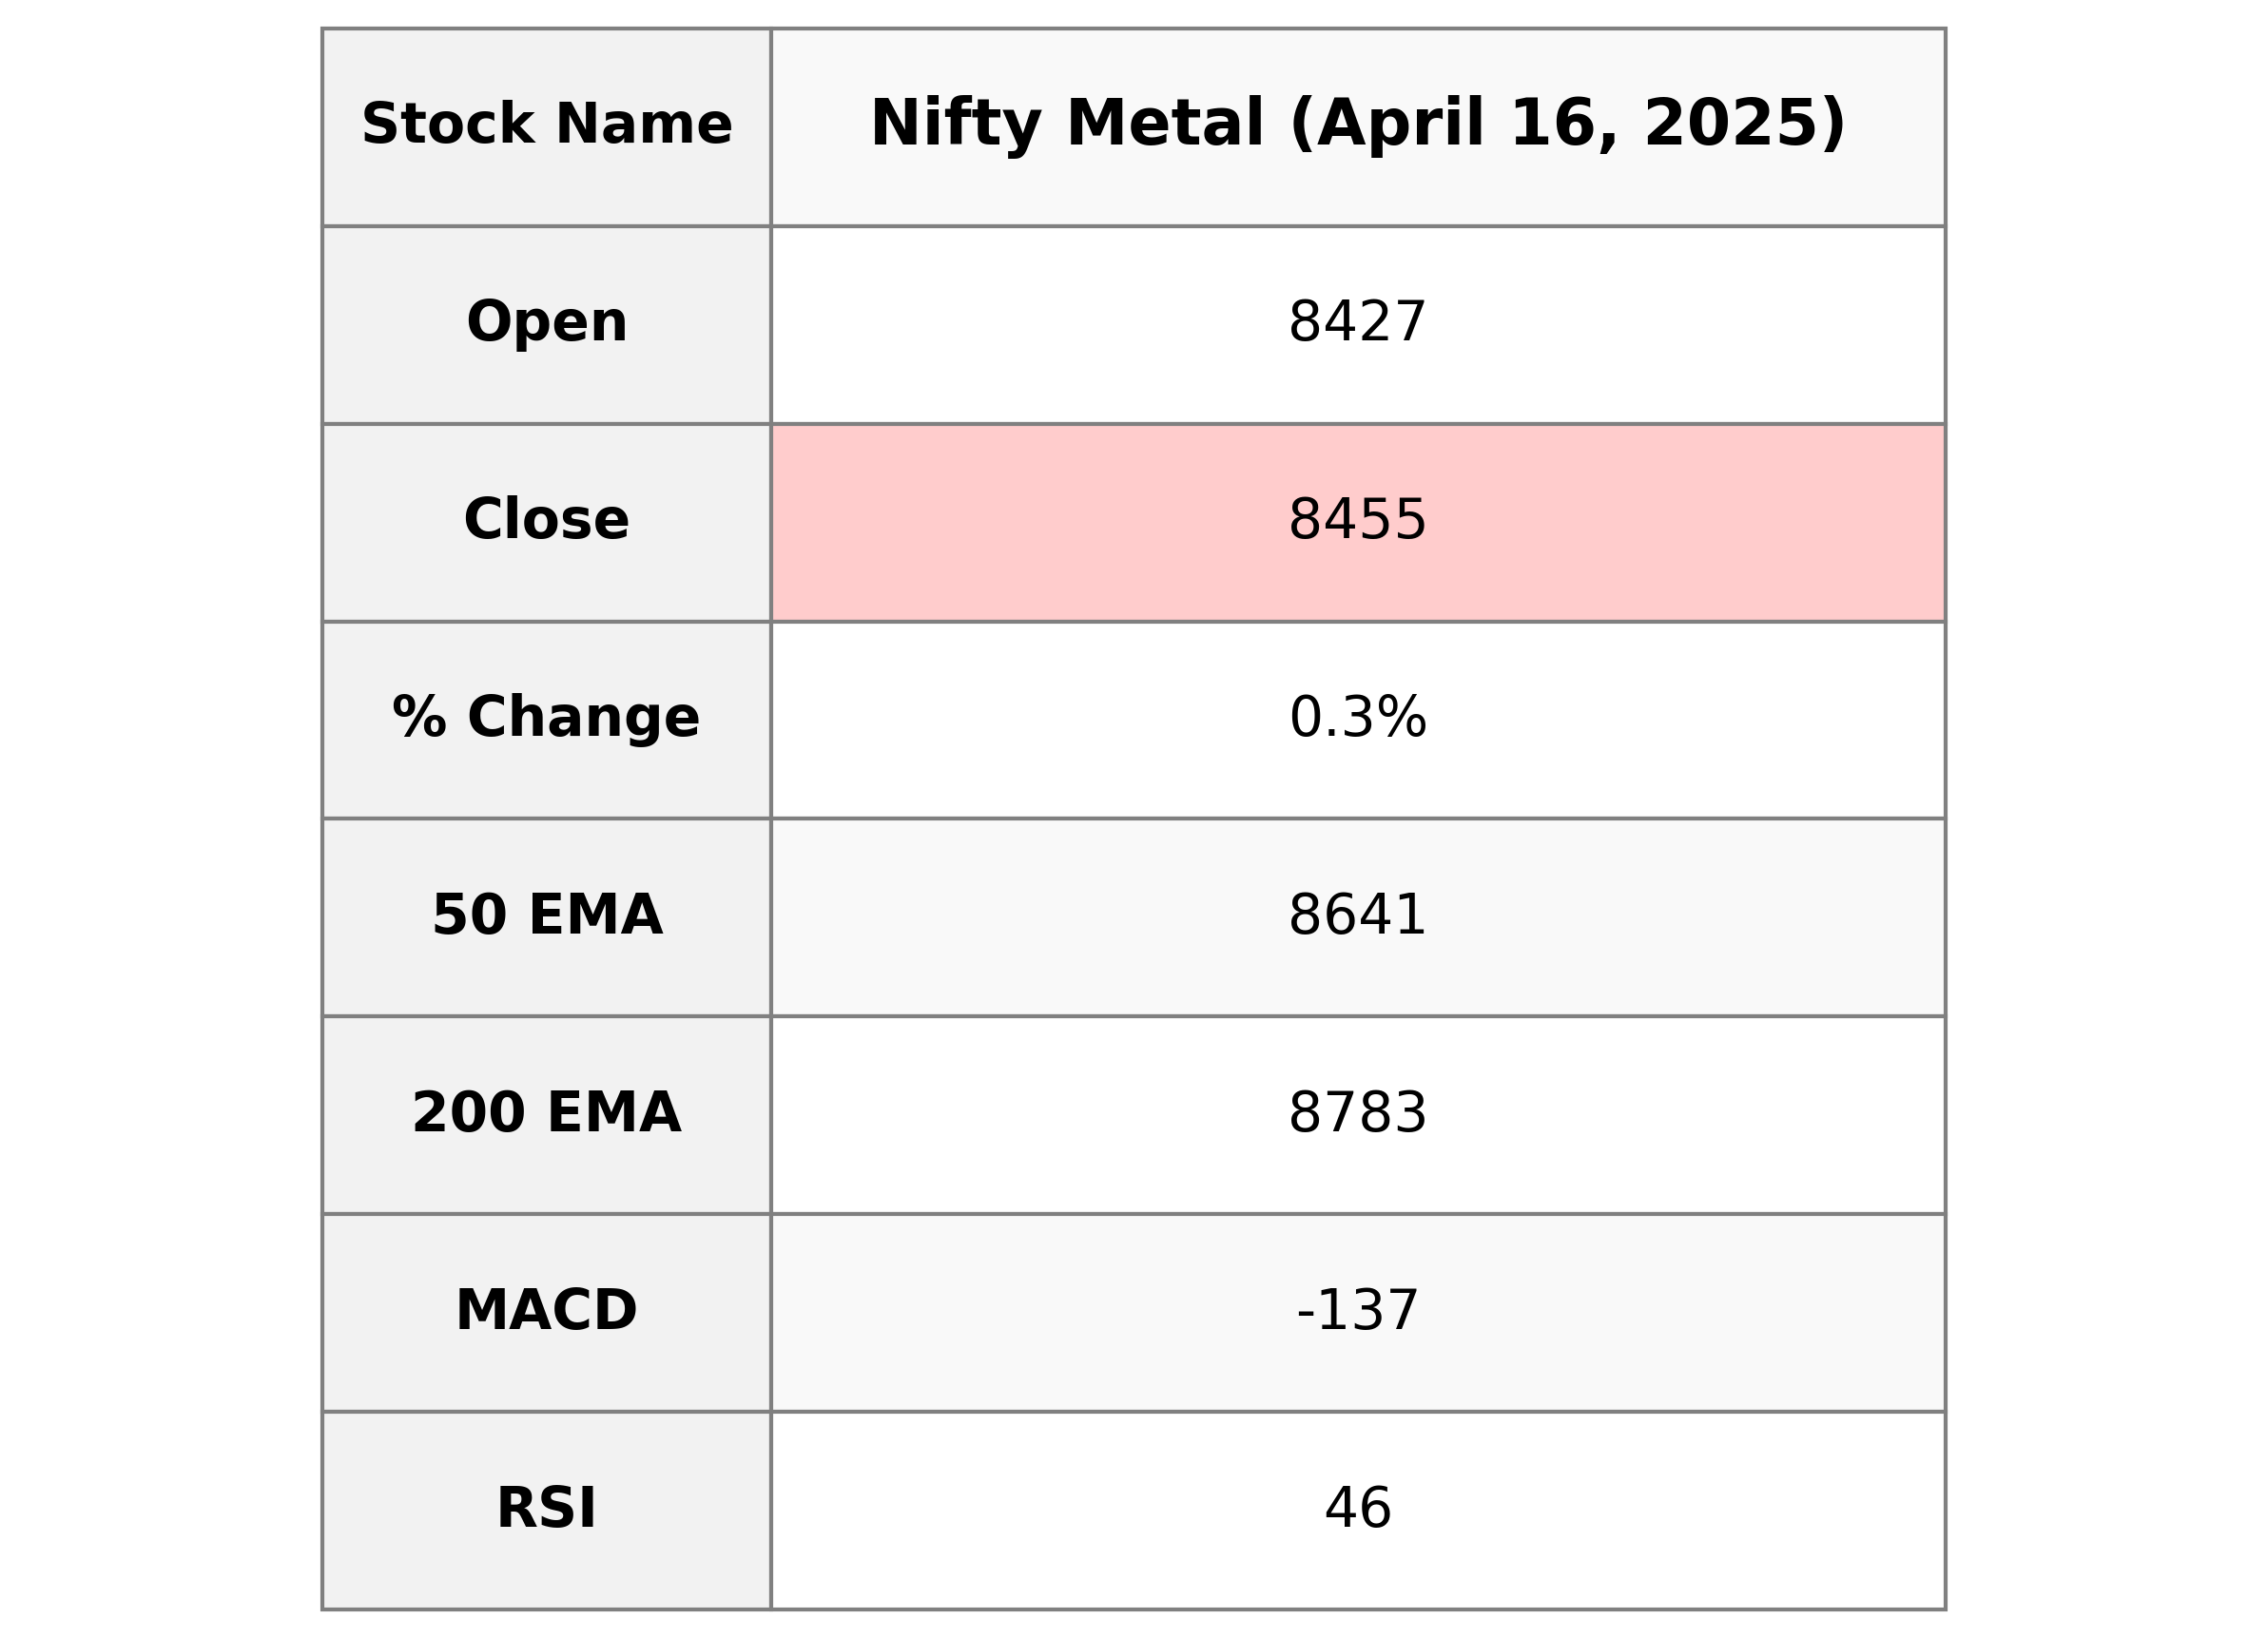
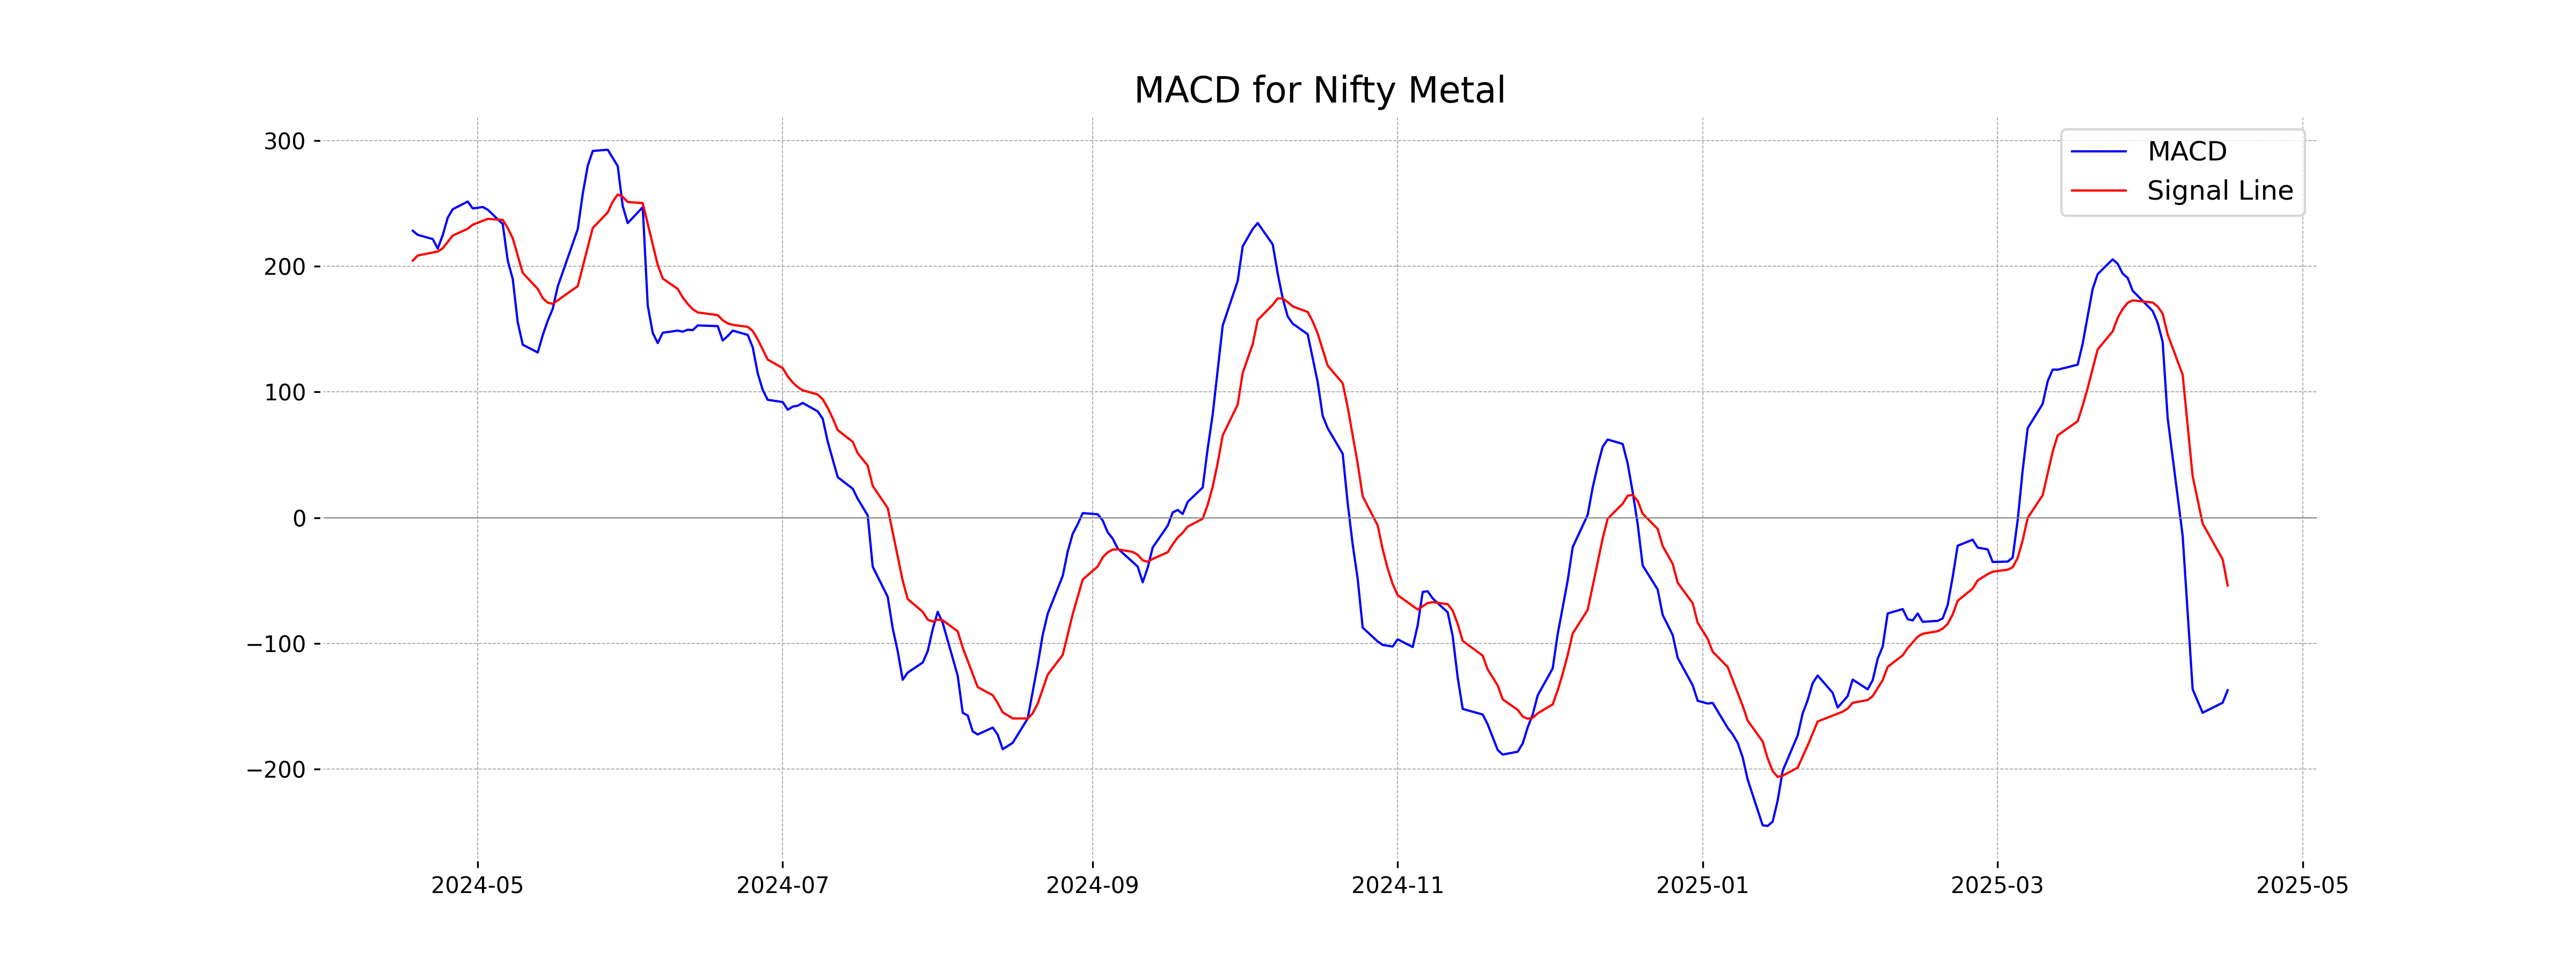
Nifty Metal Performance Description: On the reported day, Nifty Metal opened at 8427.40, reached a high of 8478.45, and closed at 8454.80. The index marked a slight increase with a 0.30% change from the previous close, despite technical indicators showing a bearish sentiment with an RSI of 46.39 and a MACD well below the signal line. The trading volume was notably low at 0.

Relationship with Key Moving Averages
The close price of Nifty Metal is 8454.80, which is below its 50-day EMA of 8641.04 and its 200-day EMA of 8783.12, indicating a potential bearish trend. However, it is slightly above the 10-day EMA of 8421.33, suggesting short-term bullishness.
Moving Averages Trend (MACD)
Based on the given data, the MACD for Nifty Metal is -137.25, which is below the MACD Signal of -54.00, suggesting a bearish momentum. This indicates that the stock might be in a downtrend, but traders may look for a MACD crossover to potentially signal a reversal.
RSI Analysis
The RSI for Nifty Metal is 46.39, indicating a neutral position since it is between 30 and 70. This suggests that neither overbought nor oversold conditions are currently prevalent. It may signify a period of consolidation or indecision in the market.
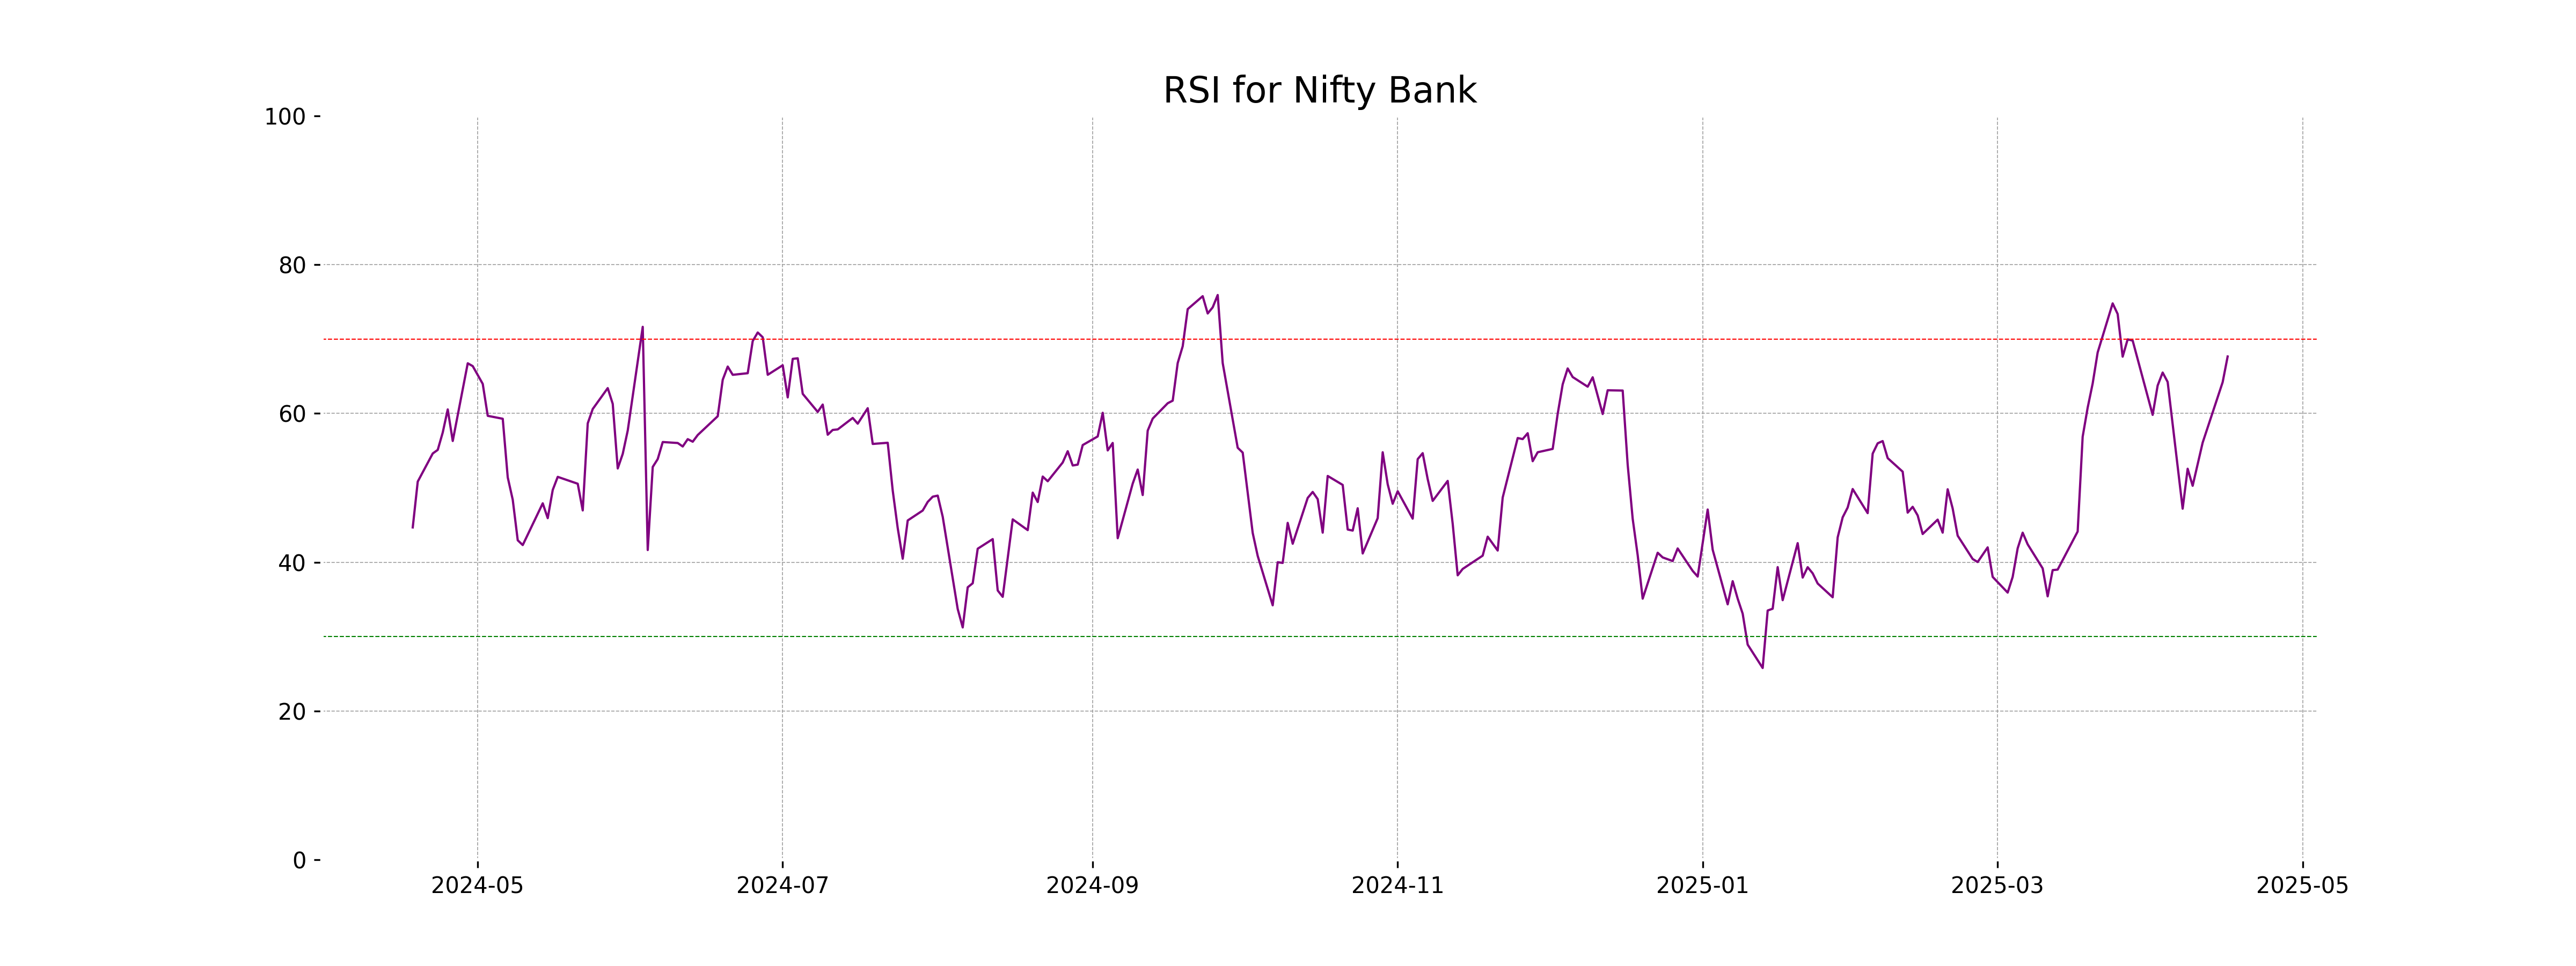
Analysis for Nifty Bank - April 16, 2025
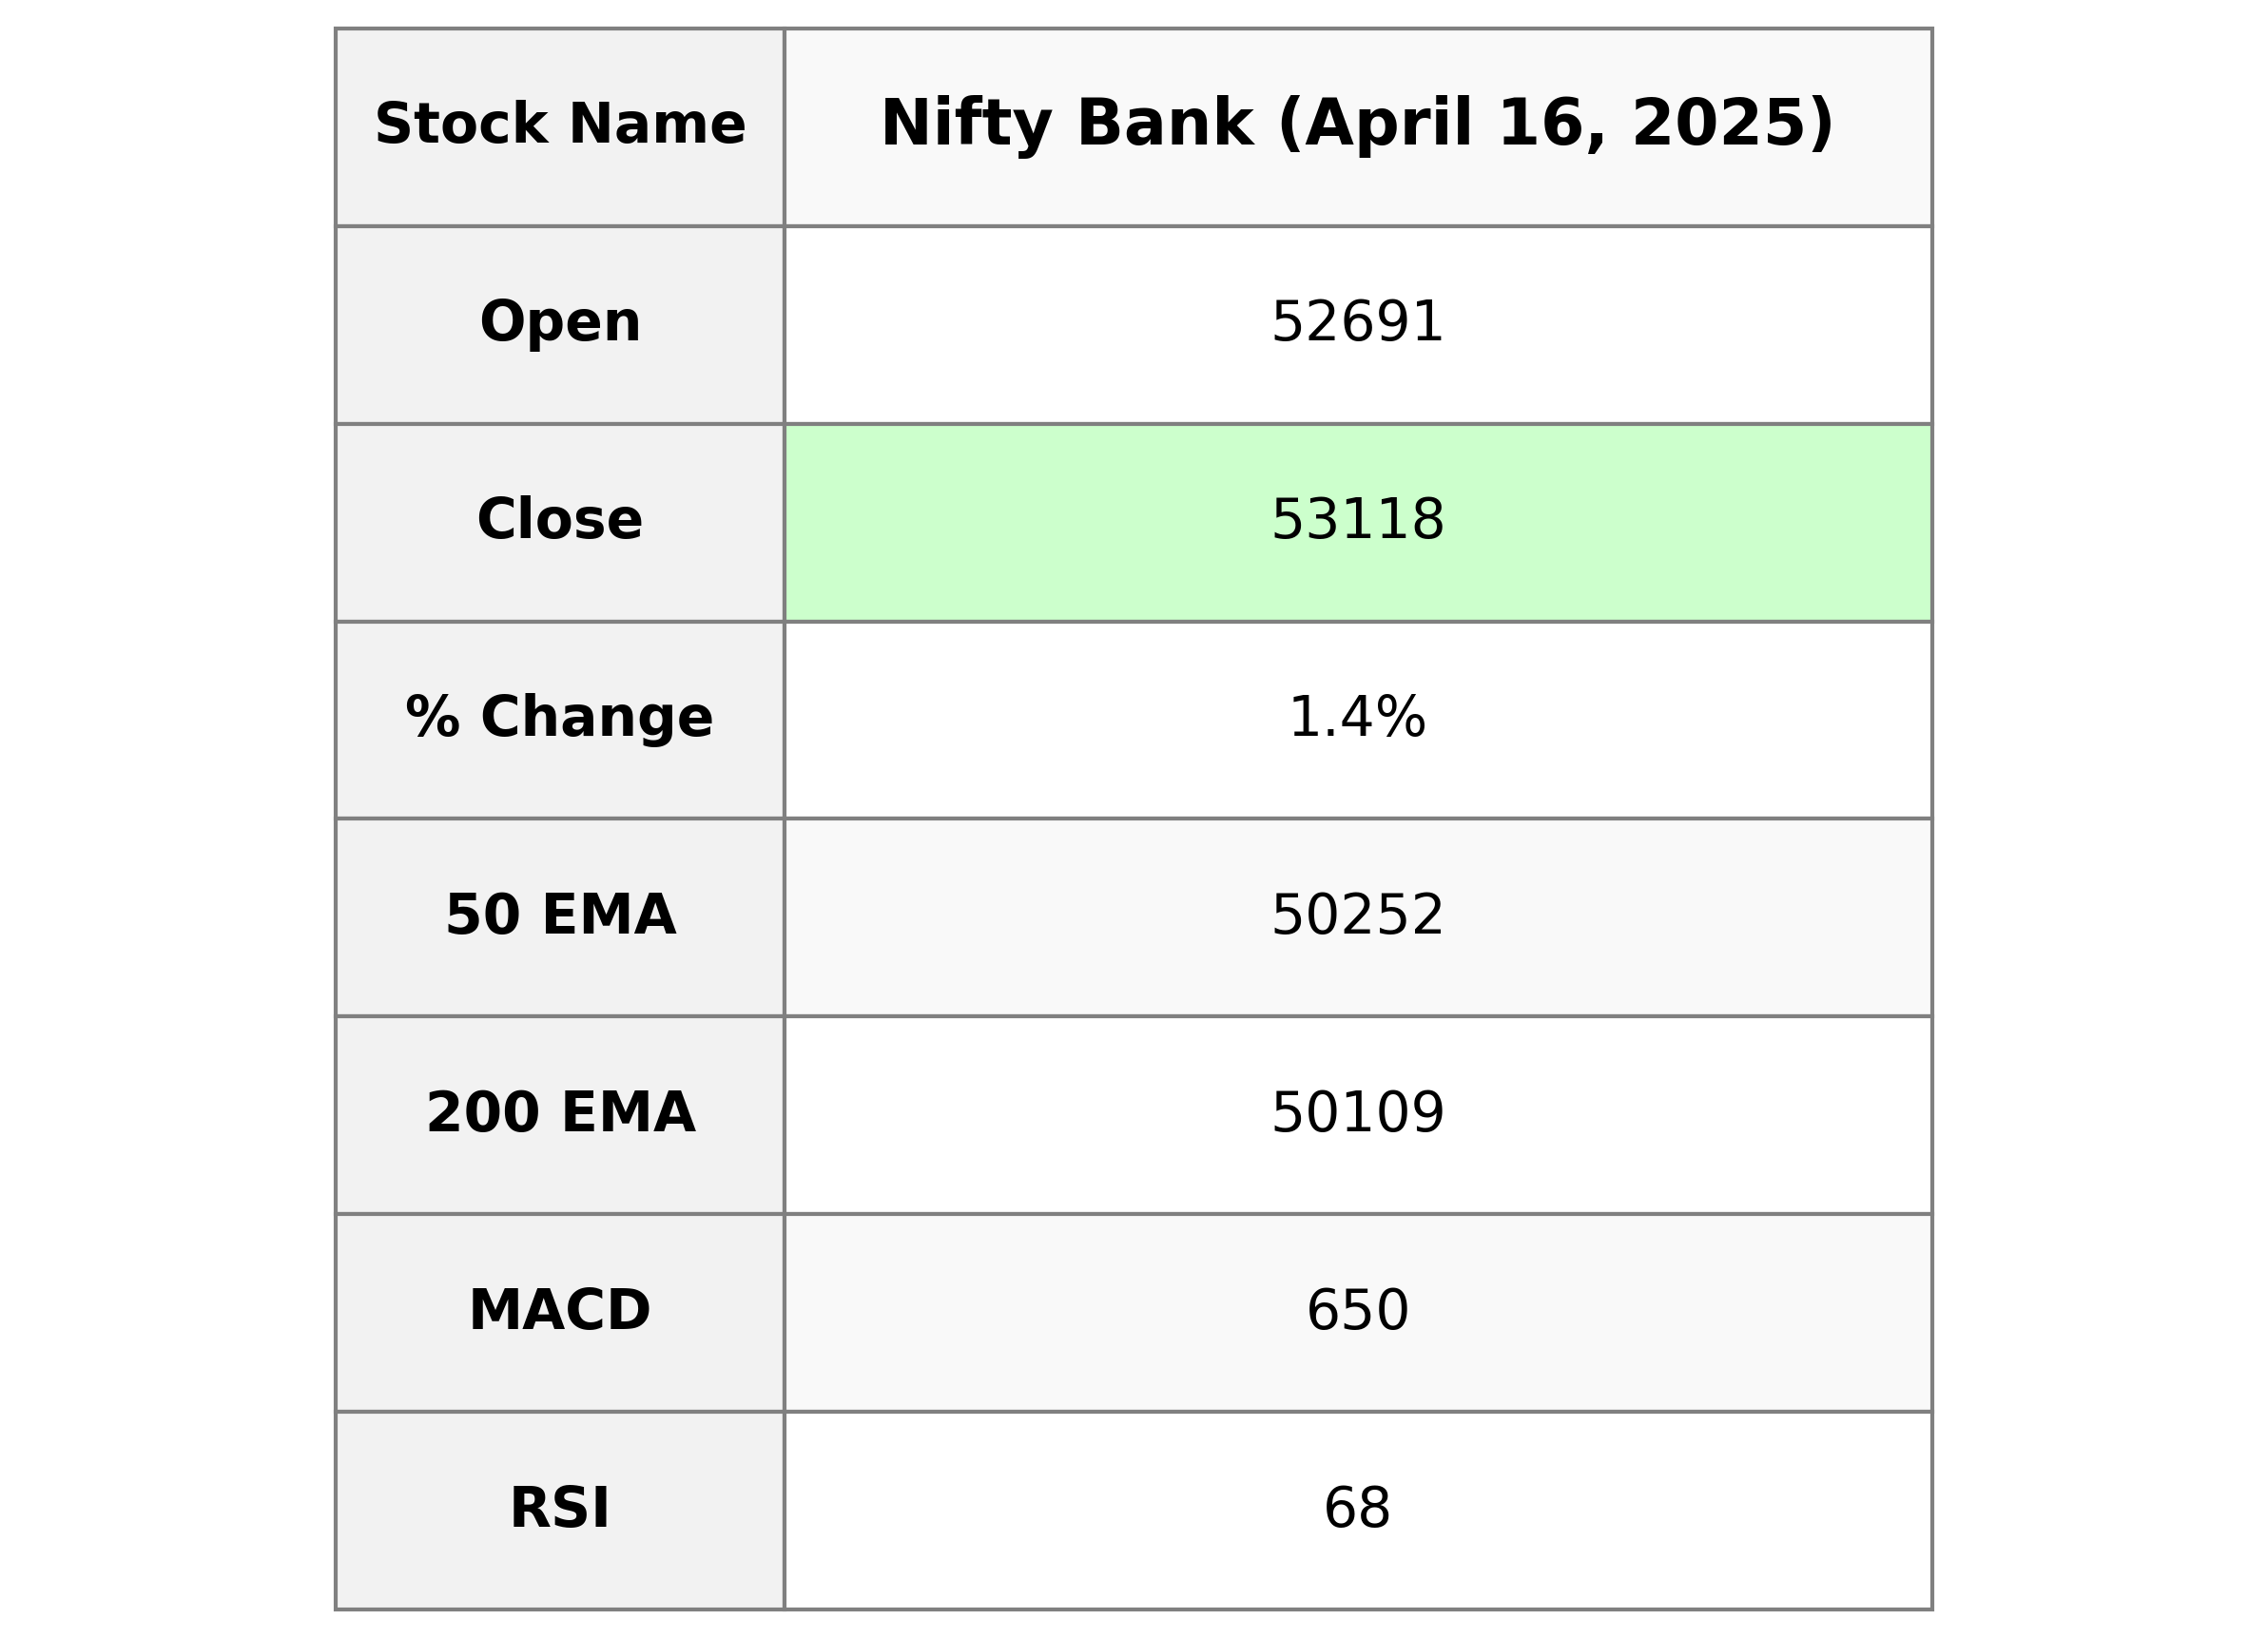
Nifty Bank opened at 52,690.90 and closed at 53,117.75, marking a 1.41% increase from the previous close of 52,379.50 with a points change of 738.25. The relative strength index (RSI) is at 67.66, suggesting potential overbought conditions. Meanwhile, the MACD is above the signal line, indicating a bullish momentum in the short term.
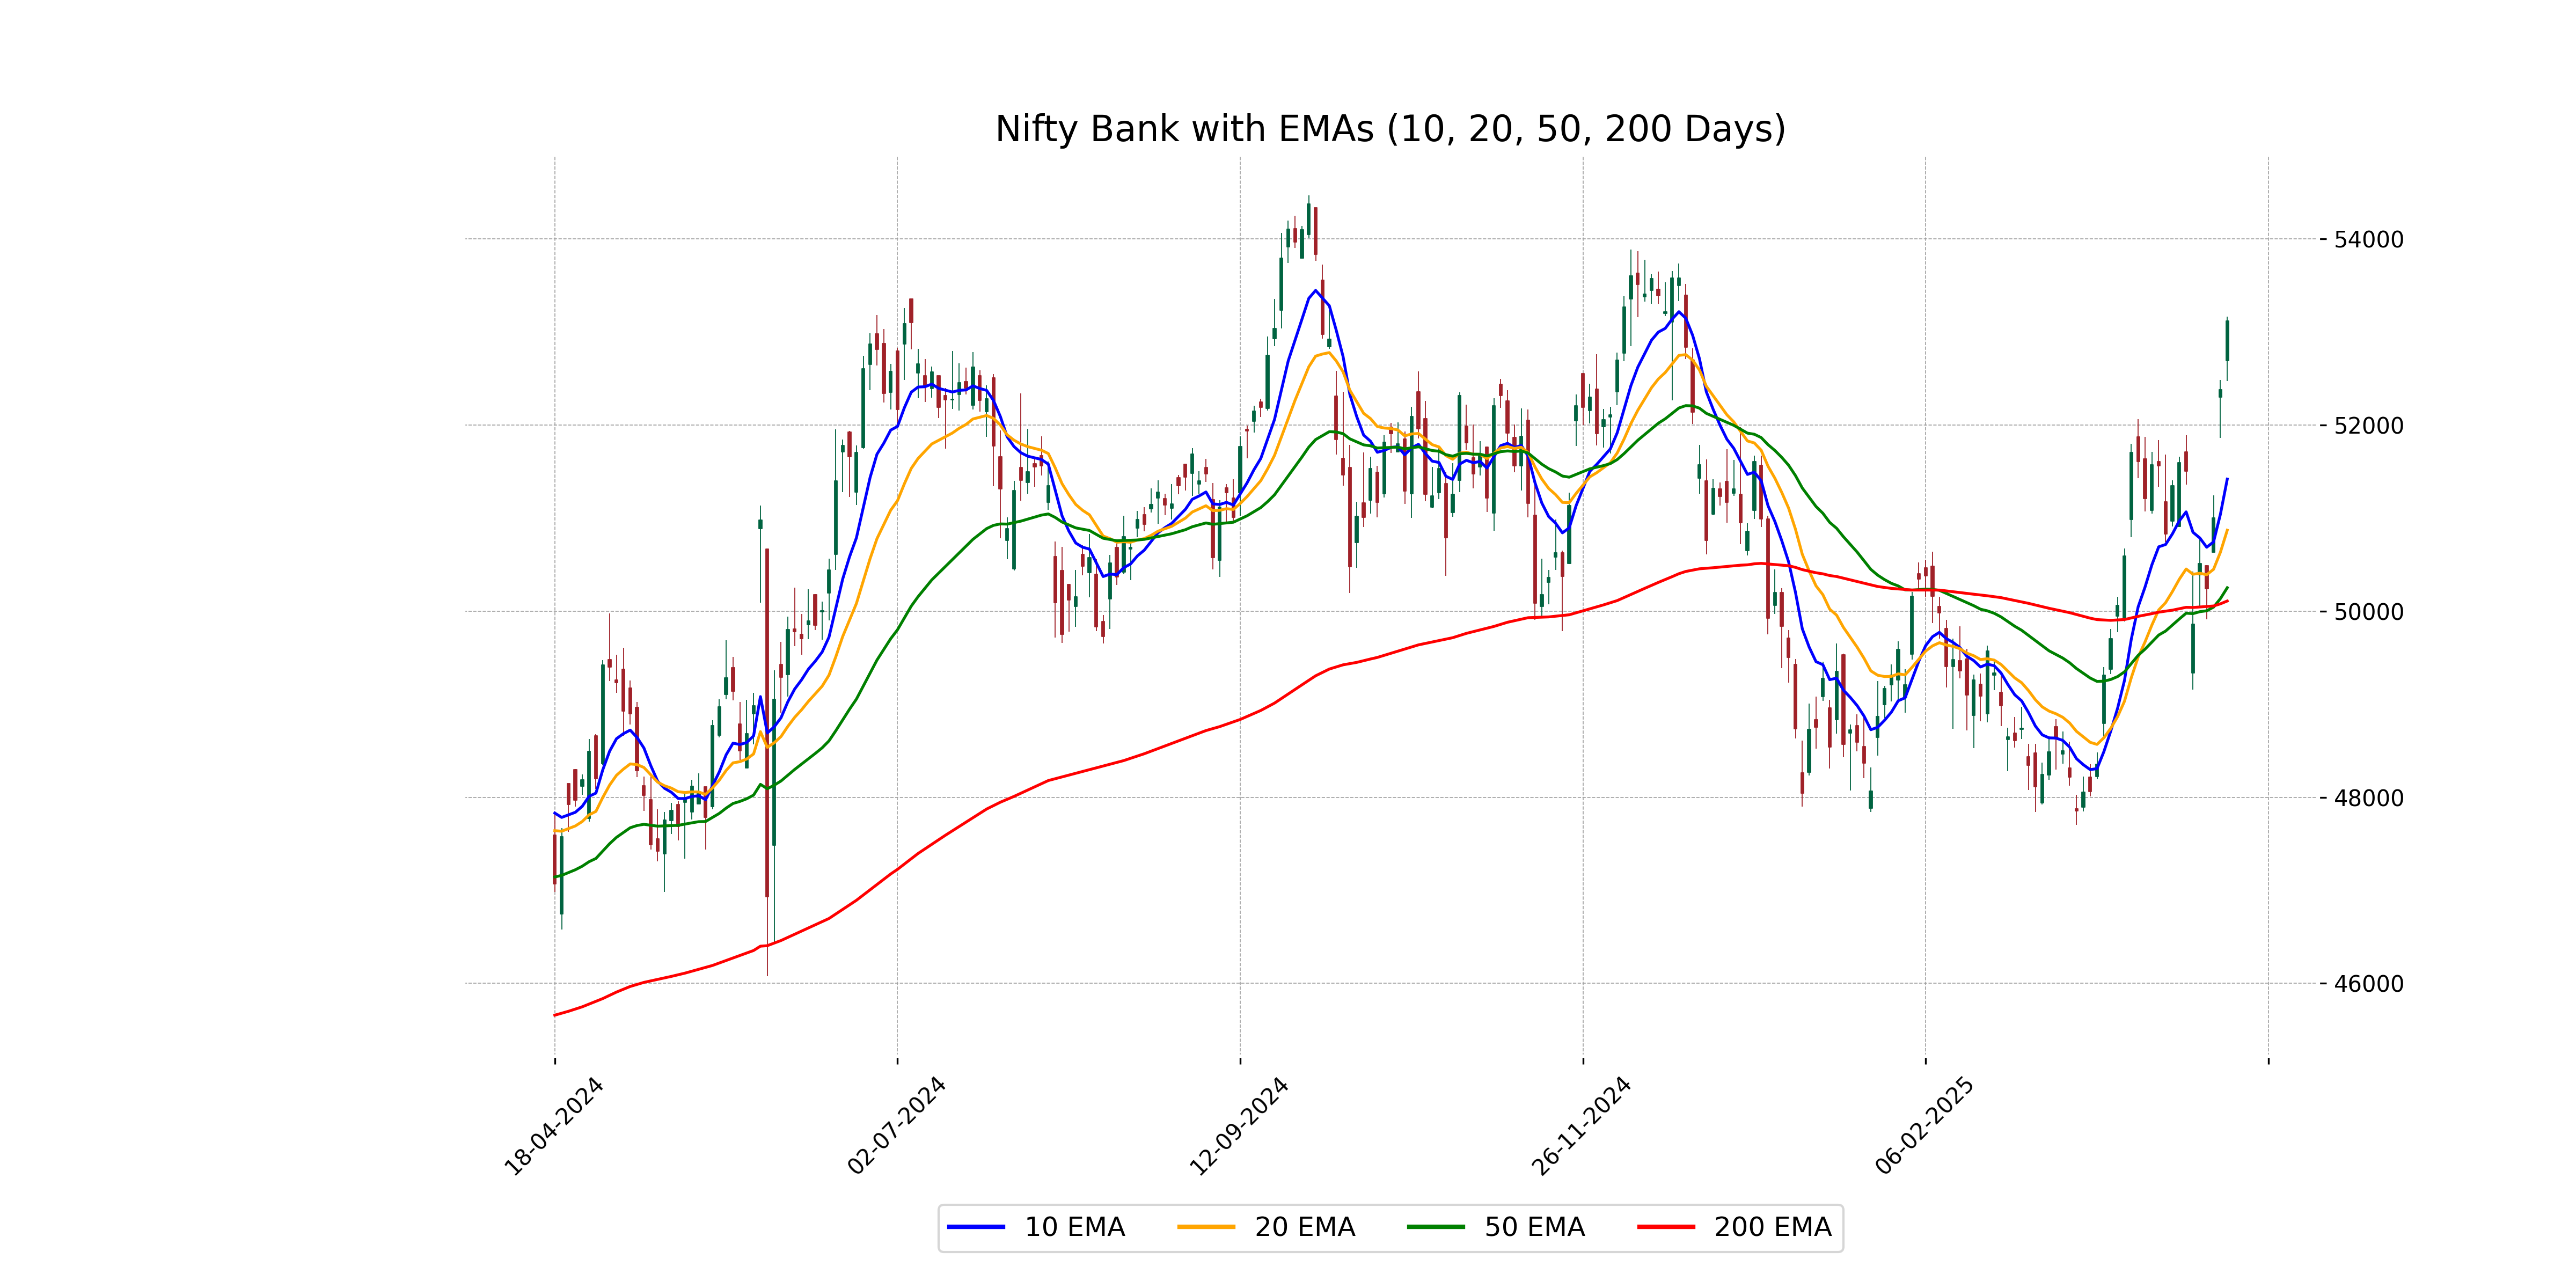
Relationship with Key Moving Averages
The current close of Nifty Bank is 53117.75, which is above the 50 EMA at 50251.91 and the 200 EMA at 50109.23, indicating a bullish trend. The close is also above the 10 EMA of 51419.24 and the 20 EMA of 50870.29, suggesting positive short-term momentum.
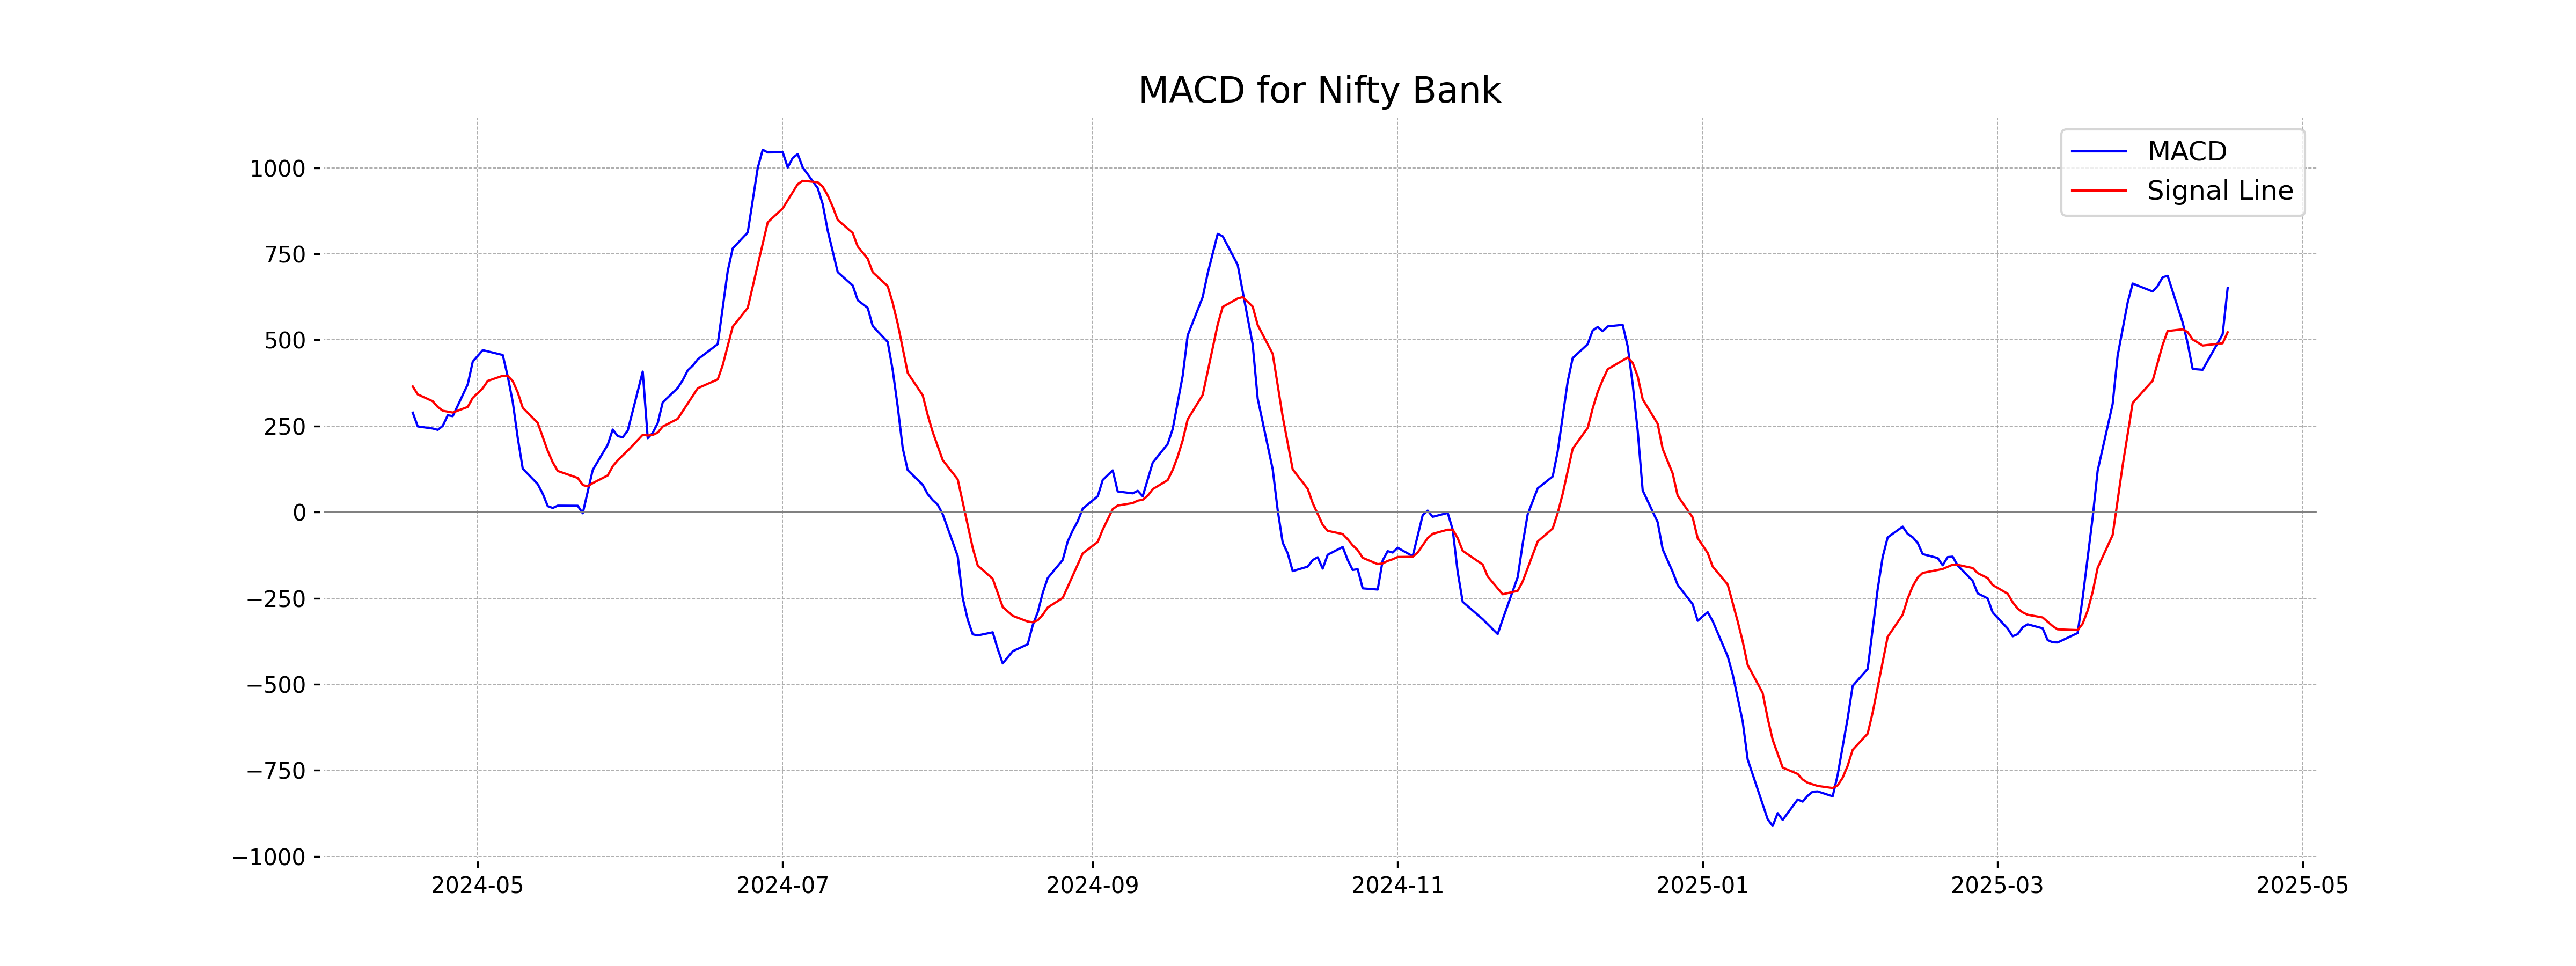
Moving Averages Trend (MACD)
Nifty Bank MACD Analysis The MACD value for Nifty Bank is 650.49, which is above the MACD Signal of 522.29, suggesting a bullish momentum. This indicates a potential upward trend, as the MACD line crossing above the signal line typically signals positive sentiment.
RSI Analysis
The RSI (Relative Strength Index) for Nifty Bank is 67.66, suggesting that the stock is approaching overbought territory, as RSI values above 70 typically indicate such. This may imply a potential for a price pullback or consolidation.
Analysis for Nifty 50 - April 16, 2025

The Nifty 50 opened at 23,344.10 and closed slightly higher at 23,437.20, marking a percentage change of approximately 0.47% and a points change of 108.65. The RSI stands at 57.43, indicating a relatively neutral position, while the MACD suggests a bullish trend with its value above the MACD Signal.
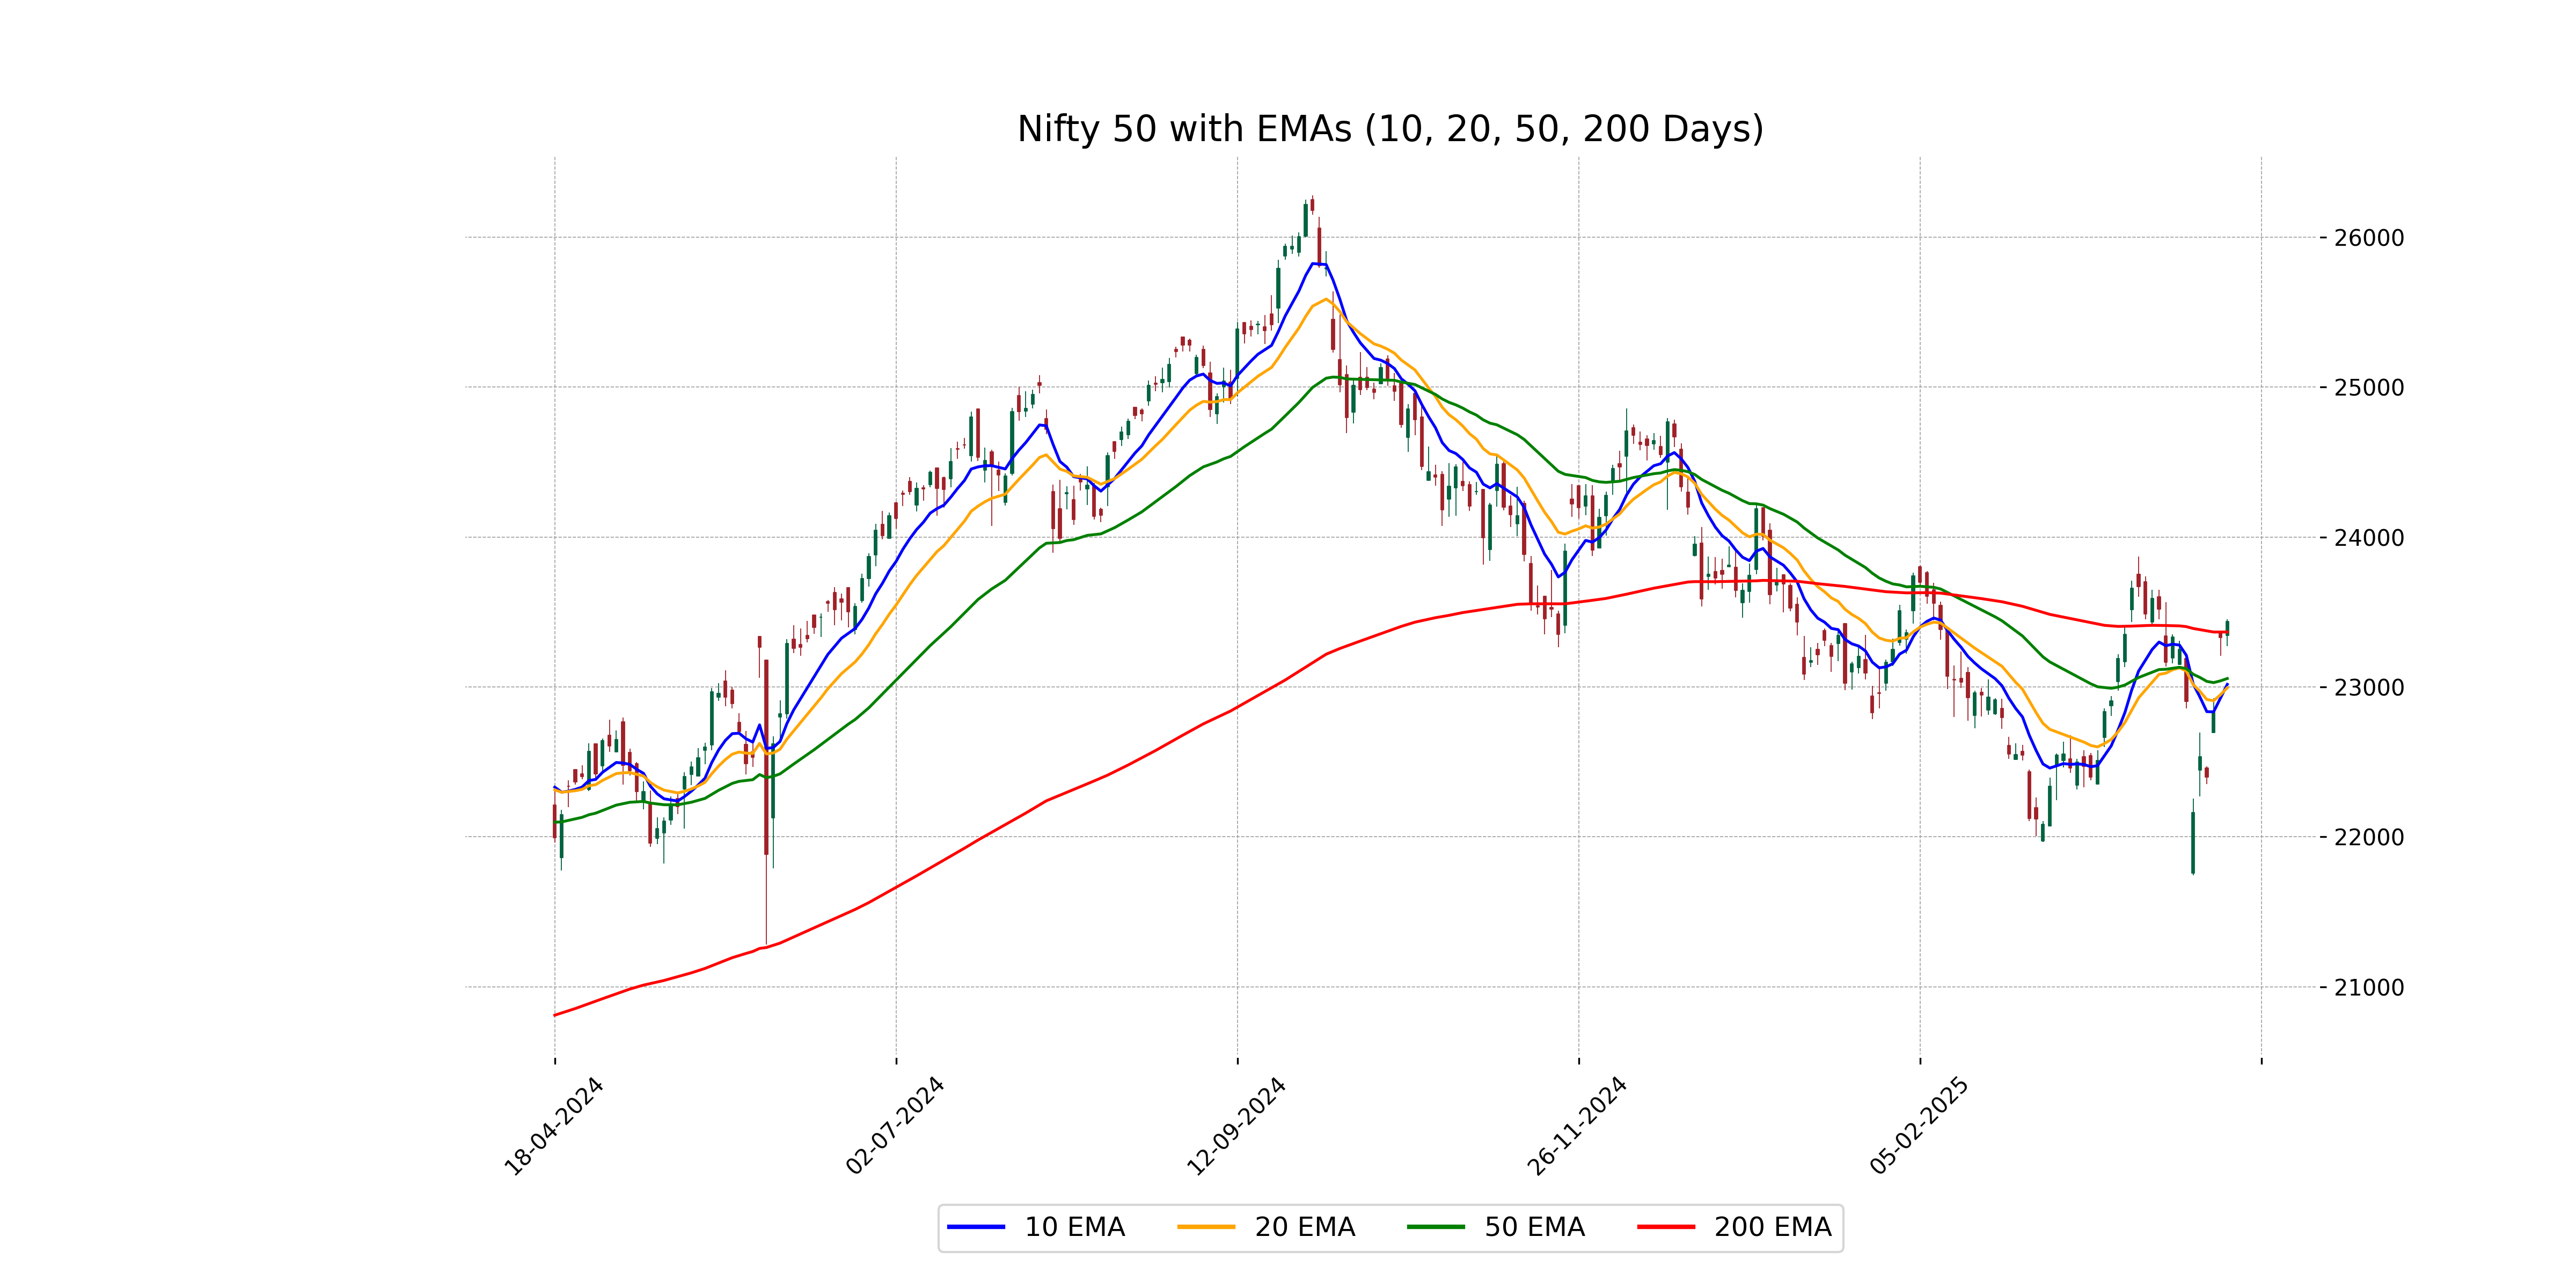
Relationship with Key Moving Averages
The Nifty 50 closed at 23,437.20, which is above its 50 EMA of 23,056.17 and just slightly above its 200 EMA of 23,366.49, indicating a bullish trend as it also stays above both the 10 EMA of 23,017.23 and the 20 EMA of 22,994.46. The MACD value of 25.02 being greater than the MACD Signal of 18.92 suggests positive momentum.
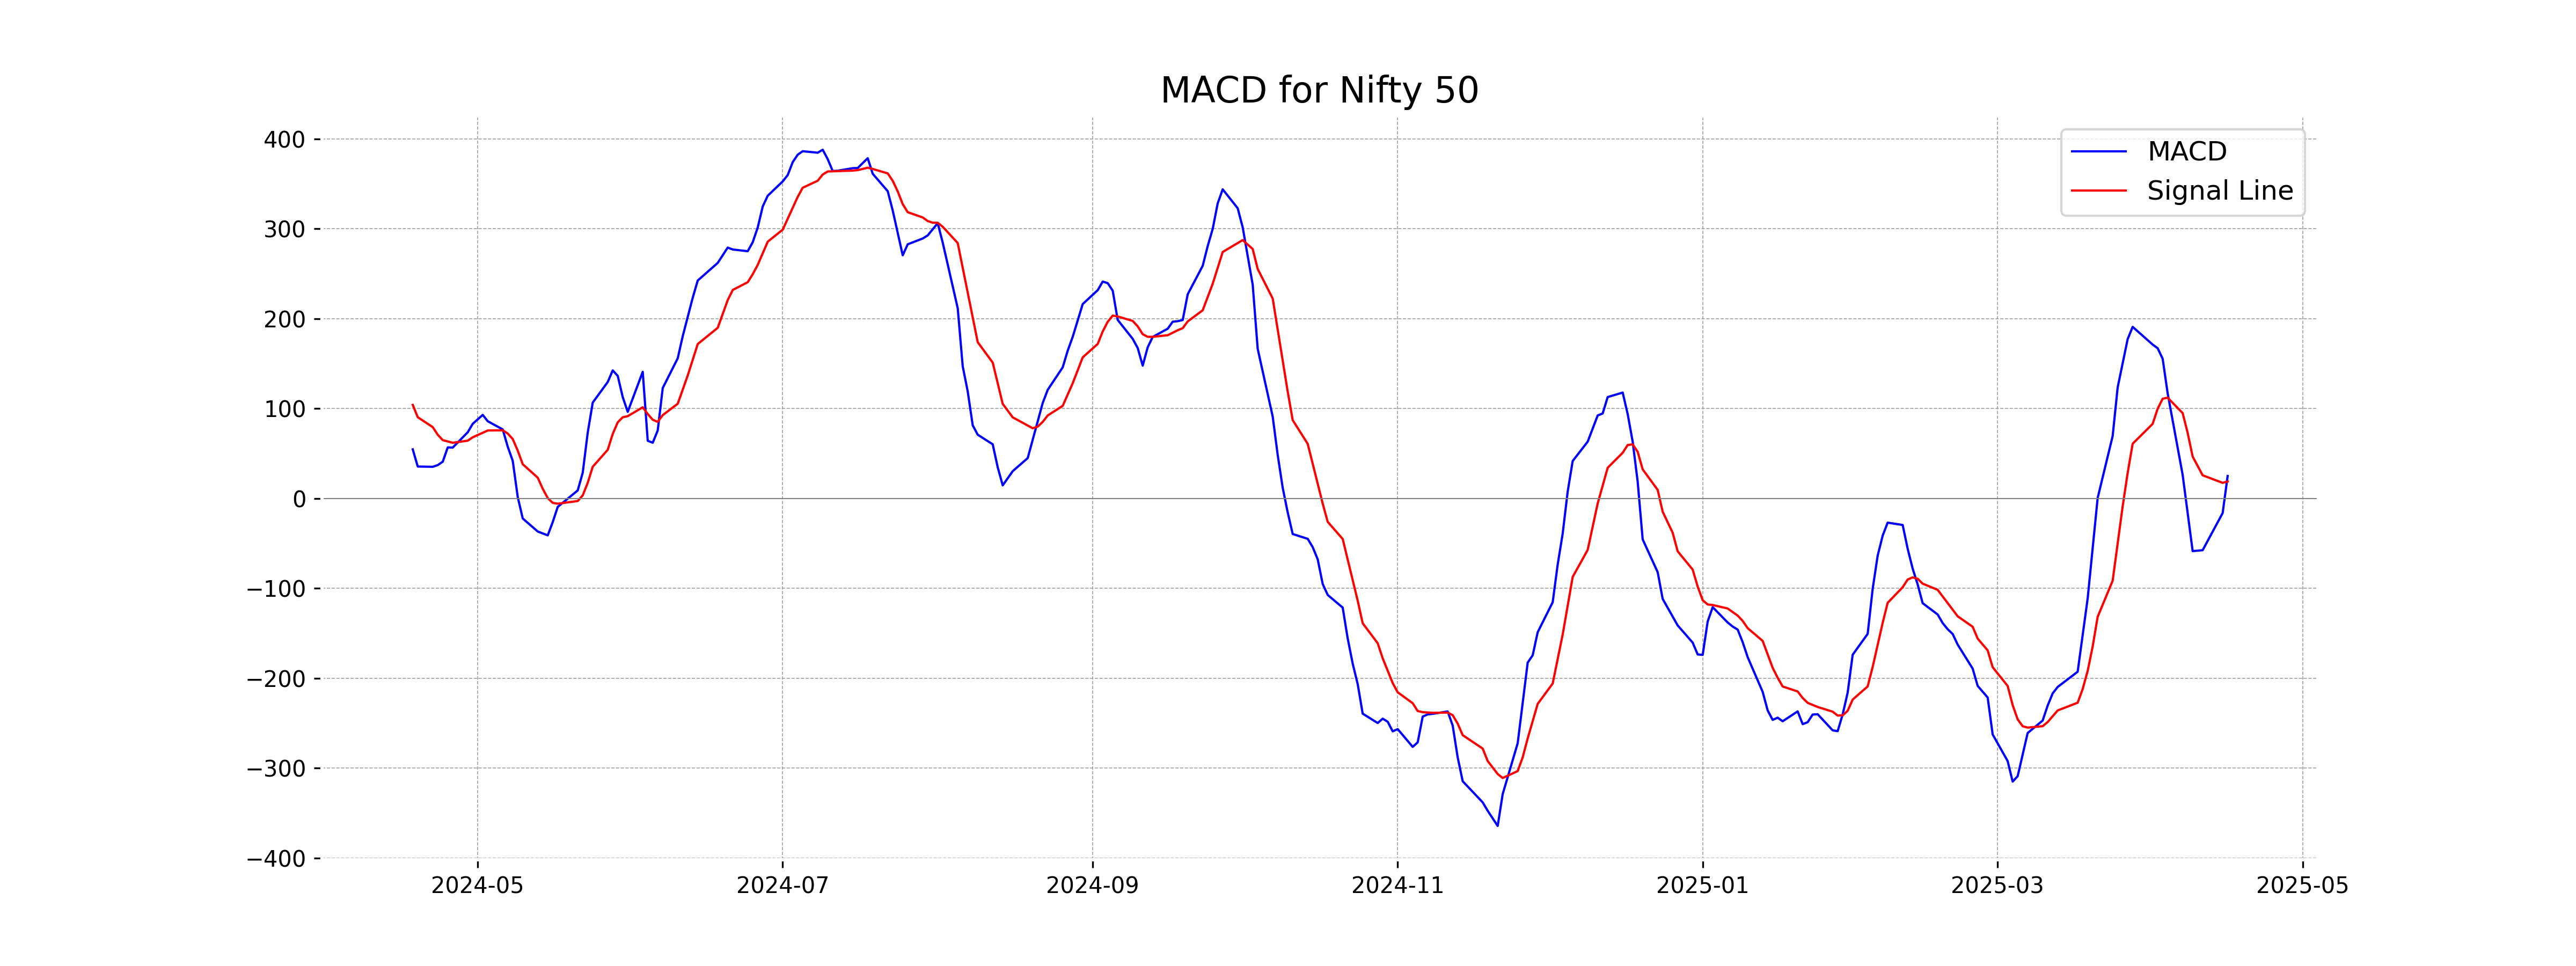
Moving Averages Trend (MACD)
The MACD for Nifty 50 is positioned at 25.02 with a MACD Signal of 18.92, indicating a bullish signal as the MACD line is above the Signal line. This suggests potential upward momentum in the market trend.
RSI Analysis
The Relative Strength Index (RSI) for Nifty 50 is 57.43, indicating a neutral stance with a slight bullish inclination. Since it is below the typical overbought threshold of 70, this suggests there may still be room for upward movement before reaching overbought conditions.